
Jacobs & Schneider (GE Energy)- May 2009 -Cogeneration Application Considerations
48
GE Energy Cogeneration Application Considerations John A. Jacobs III Technical Leader Evaluation & Analysis Martin Schneider Senior Marketing Manager May 2009
-
Upload
james-obern -
Category
Documents
-
view
693 -
download
10
Transcript of Jacobs & Schneider (GE Energy)- May 2009 -Cogeneration Application Considerations

GE Energy
CogenerationApplication Considerations
John A. Jacobs IIITechnical LeaderEvaluation & Analysis
Martin Schneider Senior Marketing Manager
May 2009

Contents:
Introduction . . . . . . . . . . . . . . . . . . . . . . . . . . . . . . . . . . . . . . . . . . . . . . . . . . . . . . . . . . . . . . . . . . . . . . . . . . . . . . . . . . . . . . . . . . . . . . . . . . . . . . . . . . . . . . . . 1
Cogeneration . . . . . . . . . . . . . . . . . . . . . . . . . . . . . . . . . . . . . . . . . . . . . . . . . . . . . . . . . . . . . . . . . . . . . . . . . . . . . . . . . . . . . . . . . . . . . . . . . . . . . . . . . . . . . . . 2
Net Heat to Process and Fuel Chargeable to Power . . . . . . . . . . . . . . . . . . . . . . . . . . . . . . . . . . . . . . . . . . . . . . . . . . . . . . . . . . . . . . . . . . . . . . . . . . . . . . . . . . 3
Steam Turbines for Cogeneration . . . . . . . . . . . . . . . . . . . . . . . . . . . . . . . . . . . . . . . . . . . . . . . . . . . . . . . . . . . . . . . . . . . . . . . . . . . . . . . . . . . . . . . . . . . . . 4
Steam Turbine Performance Flexibility . . . . . . . . . . . . . . . . . . . . . . . . . . . . . . . . . . . . . . . . . . . . . . . . . . . . . . . . . . . . . . . . . . . . . . . . . . . . . . . . . . . . . . . . . . . . . . . 6
Cogeneration and Reheat Steam Cycles . . . . . . . . . . . . . . . . . . . . . . . . . . . . . . . . . . . . . . . . . . . . . . . . . . . . . . . . . . . . . . . . . . . . . . . . . . . . . . . . . . . . . . . . . . . . . 7
Cogeneration with Gas Reciprocating Engines . . . . . . . . . . . . . . . . . . . . . . . . . . . . . . . . . . . . . . . . . . . . . . . . . . . . . . . . . . . . . . . . . . . . . . . . . . . . . . . . . 7
Gas Engines . . . . . . . . . . . . . . . . . . . . . . . . . . . . . . . . . . . . . . . . . . . . . . . . . . . . . . . . . . . . . . . . . . . . . . . . . . . . . . . . . . . . . . . . . . . . . . . . . . . . . . . . . . . . . . . . . . . . . . . . 7
Cogeneration – Overall Efficiencies . . . . . . . . . . . . . . . . . . . . . . . . . . . . . . . . . . . . . . . . . . . . . . . . . . . . . . . . . . . . . . . . . . . . . . . . . . . . . . . . . . . . . . . . . . . . . . . . . . 8
Power and Heat Utilization . . . . . . . . . . . . . . . . . . . . . . . . . . . . . . . . . . . . . . . . . . . . . . . . . . . . . . . . . . . . . . . . . . . . . . . . . . . . . . . . . . . . . . . . . . . . . . . . . . . . . . . . . . 8
Fuel Flexibility and Gas Reciprocating Engines . . . . . . . . . . . . . . . . . . . . . . . . . . . . . . . . . . . . . . . . . . . . . . . . . . . . . . . . . . . . . . . . . . . . . . . . . . . . . . . . . . . . . . . 9
Gas Turbine and Combined Cycles . . . . . . . . . . . . . . . . . . . . . . . . . . . . . . . . . . . . . . . . . . . . . . . . . . . . . . . . . . . . . . . . . . . . . . . . . . . . . . . . . . . . . . . . . . . 18
Gas Turbine Power Enhancements . . . . . . . . . . . . . . . . . . . . . . . . . . . . . . . . . . . . . . . . . . . . . . . . . . . . . . . . . . . . . . . . . . . . . . . . . . . . . . . . . . . . . . . . . . . . . . . . . 19
Fuel Flexibility and Gas Turbines . . . . . . . . . . . . . . . . . . . . . . . . . . . . . . . . . . . . . . . . . . . . . . . . . . . . . . . . . . . . . . . . . . . . . . . . . . . . . . . . . . . . . . . . . . . . . . . . . . . 21
Gas Turbine Exhaust Heat Recovery. . . . . . . . . . . . . . . . . . . . . . . . . . . . . . . . . . . . . . . . . . . . . . . . . . . . . . . . . . . . . . . . . . . . . . . . . . . . . . . . . . . . . . . . . . . . . . . . 22
Heat Recovery Steam Generators . . . . . . . . . . . . . . . . . . . . . . . . . . . . . . . . . . . . . . . . . . . . . . . . . . . . . . . . . . . . . . . . . . . . . . . . . . . . . . . . . . . . . . . . . . . . . . . . . . 22
HRSG Steam Production Rates . . . . . . . . . . . . . . . . . . . . . . . . . . . . . . . . . . . . . . . . . . . . . . . . . . . . . . . . . . . . . . . . . . . . . . . . . . . . . . . . . . . . . . . . . . . . . . . . . . . . . 24
Cycle Configurations. . . . . . . . . . . . . . . . . . . . . . . . . . . . . . . . . . . . . . . . . . . . . . . . . . . . . . . . . . . . . . . . . . . . . . . . . . . . . . . . . . . . . . . . . . . . . . . . . . . . . . . . . . . . . . . 25
Combined Cycle Design Flexibility . . . . . . . . . . . . . . . . . . . . . . . . . . . . . . . . . . . . . . . . . . . . . . . . . . . . . . . . . . . . . . . . . . . . . . . . . . . . . . . . . . . . . . . . . . . . . . . . . . 25
Cogeneration Opportunities. . . . . . . . . . . . . . . . . . . . . . . . . . . . . . . . . . . . . . . . . . . . . . . . . . . . . . . . . . . . . . . . . . . . . . . . . . . . . . . . . . . . . . . . . . . . . . . . . 37
Conclusion. . . . . . . . . . . . . . . . . . . . . . . . . . . . . . . . . . . . . . . . . . . . . . . . . . . . . . . . . . . . . . . . . . . . . . . . . . . . . . . . . . . . . . . . . . . . . . . . . . . . . . . . . . . . . . . . . 40
Acknowledgement. . . . . . . . . . . . . . . . . . . . . . . . . . . . . . . . . . . . . . . . . . . . . . . . . . . . . . . . . . . . . . . . . . . . . . . . . . . . . . . . . . . . . . . . . . . . . . . . . . . . . . . . . . 40
List of Figures . . . . . . . . . . . . . . . . . . . . . . . . . . . . . . . . . . . . . . . . . . . . . . . . . . . . . . . . . . . . . . . . . . . . . . . . . . . . . . . . . . . . . . . . . . . . . . . . . . . . . . . . . . . . . . 41
List of Tables. . . . . . . . . . . . . . . . . . . . . . . . . . . . . . . . . . . . . . . . . . . . . . . . . . . . . . . . . . . . . . . . . . . . . . . . . . . . . . . . . . . . . . . . . . . . . . . . . . . . . . . . . . . . . . . 42
GE Energy | GER-3430G (05/09) i


IntroductionCogeneration or CHP (Combined Heat and Power). The terms
cogeneration and CHP are used interchangeably in this paper and
are defined as the combined simultaneous generation of heat and
electrical energy with a common source of fuel. Common examples
of cogeneration applications include pulp and paper mills, steel
mills, food and chemical processing plants, and District Heating
(DH) applications.
Since the beginning of the 20th century, cogeneration technology
has been utilized by many industrial companies as an eco-friendly
means to economically meet a plant’s combined heat and power
demands. The volatility of fuel costs and electricity prices in
deregulated markets—coupled with the need to secure reliable
heat and power supplies, along with new environmentally based
financial incentives—are driving the evolution of this technology.
These key factors are causing many industrial companies,
municipalities, developers and utilities to give even more
consideration to cogeneration as an eco-friendly, profitable, and
reliable means of addressing their specific generation needs while
also meeting local environmental regulations.
In the past and certainly prior to 1960, most cogeneration
applications were developed based on steam turbine cogeneration
systems consisting of conventional fossil-fired boiler(s) in addition
to an industrial type steam turbine and/or combinations of
industrial type steam turbines. More recent factors have made gas
turbine and engine based solutions highly desirable, including:
• Potential economic benefits resulting from higher
power-to-heat ratios
• Rising fuel costs
• Operational flexibility
• Emerging environmental policies and incentives
• Increased focus and need for power security
• Availability of a wide range of system integration options
coupled with attractive cogeneration system performance levels
These technological advances in the area of fuel flexibility, as well
as gas turbine and engine product diversification/adaptation, have
served as enablers to make some cogeneration opportunities
feasible, while making others even more attractive.
CogenerationApplication Considerations
Universal sensitivity to our environment and environmental
considerations have led to the development of projects that not
only minimize GHG (Green House Gas) emissions, but also help to
displace GHG emissions from existing plants as well as other
emissions sources. Thus, one of the more significant advantages
for gas turbine, combined cycles and gas reciprocating engines is
the potential for GHG reductions as compared to less efficient
systems. This monetization of GHG reductions serves as a
significant driver/incentive for the development of gas-turbine and
gas-engine-based cogeneration applications.
Cogeneration applications range from industrial applications
such as pulp and paper mills, steel mills, and chemical processing
plants to commercial and civic-based applications like hospitals,
universities and warehouses—thus encompassing a wide range
of unique power-to-heat ratios. The variation of power-to-heat
ratio combined with differences in grade/quality of heat
(such as water, steam, and process heating/cooling) within
the cogeneration application space are dictating both
technology selection as well as system and product
flexibility requirements.
The primary objectives of this paper are to:
• Review many of the technical considerations and alternative
options associated with the development of cogeneration
systems.
• Discuss some of the environmental benefits that are potentially
available through cogeneration, and to introduce the concept of
monetization (primarily surrounding CO2).
• Illustrate and provide the CHP performance characteristics
associated with GE’s diverse gas turbine and reciprocating
gas engine product portfolios that can ultimately be
leveraged for project and technology screening purposes.
The technical parameters provided include—but are not
limited to—power-to-heat ratio, equipment capacity
(thermal/electrical) and efficiency/FCP (Fuel Chargeable to
Power), and/or SFC (Specific Fuel Consumption) in the case of
reciprocating gas engines.
This paper reviews many of the technical, economical and
environmental considerations in the development of
cogeneration projects.
GE Energy | GER-3430G (05/09) 1

2
• Power generation derived from exothermic process reactions,
and heat recovery from kilns, process heaters and furnaces.
This paper focuses primarily on application considerations for
topping cogeneration cycles.
For comparative purposes Figure 1 illustrates energy utilization
effectiveness (the percent of total energy output from the cycle
which is useful heat and/or power) for a typical non-reheat coal-
fired utility/industrial plant configuration (three-stage feed water
heating with steam conditions of 1450 psig / 950°F [101 bar /
510°C] steam conditions vs. a cogeneration facility utilizing the
same fired boiler but with a non-condensing steam turbine
generator that supplies steam to process. This diagram suggests
that relative to the typical coal-fired power generation application
(as previously defined) the energy utilization associated with an
equivalent cycle with cogeneration can be improved by as much as
35%. This improvement in energy utilization is made possible
because the process demand becomes the heat sink for the
cogeneration cycle, thus eliminating energy losses associated
primarily with the condenser.
This principal is further illustrated by Figure 2, which highlights the
influence of decreasing the thermal energy to a process from a
steam turbine cycle. As less steam is delivered to process, the
electrical output ratio (relative to the electric output at 100%
steam-to-process) increases, becoming a maximum of about 2.0
for the steam conditions noted if no steam is delivered to process.
The overall efficiency decreases from 84% to 35% as process
steam delivery is eliminated.
CogenerationCogeneration is frequently defined as the sequential production
of necessary heat and power (electrical or mechanical) or
the recovery of low-level energy for power production. This
sequential energy production yields fuel savings relative to
separate energy production facilities because both the heat and
power requirements are satisfied from a common/single fuel
source. The heat that would otherwise be wasted in the power
production process is recovered and leveraged to provide
process heat requirements (which otherwise would have to
be generated with a separate fuel source), thus providing
significant fuel savings.
With the recent increases in gas and oil prices, advancements in
gas-turbine and gas-reciprocating-engine fuel flexibility—combined
with a worldwide desire to reduce GHG (Green House Gas)
emissions, increase power security (through localization of power
generation), and attractive cogeneration system efficiency levels—
have sparked renewed interest in cogeneration applications.
Power can be cogenerated in topping or bottoming cycles. In a
topping cycle, power is generated prior to the delivery of thermal
energy to the process. Typical topping cycle examples include:
• Non-condensing steam turbine cycles (commonly used in the
pulp and paper industry)
• Heat recovery and combined cycles (applied in many chemical
plants), where exhaust energy for a gas turbine or heat from gas
reciprocating engines provide thermal energy that is ultimately
used to satisfy the process requirements
• Central heating/cooling applications that exist in urban
locations where electric power stations also supply thermal
energy (or similarly on a smaller scale, where heating/cooling
requirements are recovered from gas turbine or gas
reciprocating engines to satisfy localized, civic or commercial
based CHP requirements)
In bottoming cycles, power is produced from the recovery of
process thermal energy that would normally be rejected to the
heat sink. Typical bottoming cycle examples include:
• Power generation resulting from recovery of excess thermal
energy (combined cycle steam turbine output generation)
Figure 1. Fuel utilization effectiveness (fossil-fired boiler)
2%Other
Power Generation35% isOutput
asPower
15%BoilerAssoc.Losses48%
CondenserLosses
Cogeneration
84% isOutput asPower and
ProcessHeat
15%BoilerAssoc.Losses
1%Other
Basis: 1) Typical industrial – coal-fired system 2) Effectiveness on higher heating value of coal
Similar performance benefits are also available in gas turbine and
reciprocating gas engine cogeneration systems. For example, an F-
class technology gas turbine generator with feeding to an HRSG
(which in turn provides process steam) can yield overall energy
effectiveness levels between 80-85% depending upon process
steam conditions. In comparison, the same F-class gas turbine in
combined cycle (and producing power only) yields an overall
energy effectiveness of between 50-55% depending upon the cycle
design. This comparison is illustrated in Figure 3.
It is worthy to note that energy effectiveness as previously defined
differs from efficiency/CHP efficiency in that CHP Efficiency is
defined as the useful energy-out (combined heat and power)
divided by energy-in (energy in the fuel), whereas energy
effectiveness also accounts for the energy in the air. By
comparison the efficiency/CHP efficiency for gas-turbine-based
cogeneration plants are 90+% versus 80+% for a conventional
steam plant based cogeneration system.
Figure 1 and Figure 3 clearly illustrate that from a fuel utilization
perspective, cogeneration system performances are significantly
better than typical steam turbine or gas turbine combined cycles
that are designed to only produce power.
Today, across the globe, many local governmental incentives have
been established to help promote the development of new
cogeneration applications with an objective of driving fuel
utilization. One such example is the SPP (Small Power Plant) in
Thailand. While such incentives are not new (for example, PURPA in
the US), the underlying motivations can be different. More often
than not, current incentives are borne out of a want, desire and
need to reduce green house gas emissions, whereas the
motivations of the past may have focused more on fuel utilization
from an energy market perspective (deregulation and market
competition). In support of today’s market drivers GE not only
maintains a position of industry leadership in the areas of gas
turbine and gas engine fuel flexibility and emissions capability, but
also continues to evolve world-class advanced technology with
focused research and development efforts in these areas.
Coincidentally, in the case of the aforementioned regulations a
STAG (STeam And Gas) cycle qualification is/was to provide about
6% of its steam generation to process. At this operating condition,
the overall performance approaches that of a conventional STAG
power generation cycle. Later in this paper, tables are provided
that define GE’s gas turbine and gas engine product
characteristics, which in turn illustrate the wide application range
and flexibility of these products to support cogeneration
applications.
For purposes of the following discussions, “thermally optimized”
cogeneration systems are defined as those developed using non-
condensing steam turbine generators or condensing units
operated at minimum flow to the condenser for cooling purposes.
Net Heat to Process and Fuel Chargeable to PowerIn evaluating and comparing alternative cogeneration cycles, two
concepts are key: Net Heat to Process (NHP) and Fuel Chargeable
to Power (FCP). Both concepts are “Btu/kJ accounting methods”
that can be leveraged to provide normalized performance
comparisons between different sized cogeneration systems and
different technologies. In turn, the products of these methodologies
GE Energy | GER-3430G (05/09) 3
Figure 2. Steam turbine cycle performance at various process steam demands
Rela
tive
Elec
tric
al O
utpu
t
% Steam to Process
Overall Efficiency %
(HH
V)
2.00
1.75
1.50
1.25
1.000 20 40 60 80 100
100
75
50
25
0
Basis: 1) Steam conditions 1450 psig, 950°F (101 bars, 510°C), 150 psig (11.4 bars) process, 2 1/2" (63.5mm) HgA condenser pressure 2) Three stages of feedwater heating 3) Boiler efficiency 85% HHV
Figure 3. Fuel utilization effectiveness (combined cycle/gas turbine based)
Combined CycleCogeneration
Combined CyclePower Only
50%Electrical
Output
80%Electrical
+ThermalOutput
5%Misc. 2%
Misc.20%Stack
18%Stack
25%Condenser
Losses
4
become the basis of the performance that is used in the economic
modeling process.
Net Heat to Process is defined as the net energy supplied by the
cogeneration system to the process load, as depicted in Figure 4. It
is necessary to maintain a constant NHP for all systems being
considered, especially when different gas- and steam-turbine
configurations export energy to process at different conditions.
Fuel Chargeable to Power (FCP) is a parameter used to define the
thermal performance of a topping cogeneration system. The FCP is
defined as the incremental fuel for the cogeneration system,
relative to the fuel needs of a heat-only system divided by the net
incremental power produced by the cogeneration system. Simply
put, FCP is the incremental fuel divided by the incremental power
(i.e., the incremental heat rate). For a plant generating electric
power only (an industrial or a utility), the FCP and net plant heat
rate are interchangeable terms commonly expressed in Btu/kWh
or kJ/kWh. The FCP concept is illustrated in Figure 5.
Steam Turbines for CogenerationFigure 6 shows several steam turbine configurations that can be
used to generate power while satisfying a process need for steam.
Steam turbines generally can be designed to meet the specific
process heat needs. Unlike gas turbines that are sold in specific
sizes or frame sizes, steam turbine generators have traditionally
been custom-designed machines and seldom have 100% identical
components or capabilities. However, it should be noted that many
OEMs (including GE) continue to push more and more toward
product and as a minimum component/hardware standardization
wherever possible.
Configurations 1, 3 and 4 (illustrated in Figure 6) provide steam at a
“controlled” pressure, consistent with the process header
requirements. Configuration 5 includes two uncontrolled extraction
openings in the steam turbine generator and provides steam that
would be taken to a common line and pressure-reduced if
necessary to meet the pressure requirements in the process. The
higher uncontrolled opening would be used during lighter load
operation of the turbine, when the pressure at the lower opening is
too low for process use. Uncontrolled-extraction turbines of this
type are typically used when process extractions are small
compared to total turbine flow—or when process needs are fairly
constant except during start up, shut down or emergency
situations.
Turbines represented in Configurations 1 and 3 will yield power
dependent directly on process demands, since no condensing
section capability exists. Their power production depends on the
rise and fall of the steam demand. The addition of condensing
capability (Configurations 2, 4 and 5) provides added power-
generating flexibility. When a condenser is used, power can be
generated independently from the process steam demand
(assuming that the steam turbine is sized accordingly).
In “thermally optimized” steam turbine cogeneration cycles, steam
is expanded in non-condensing or automatic-extraction non-
condensing steam turbine-generators that extract and/or exhaust
into the process-steam header(s). The FCP for these systems is
typically in the 4000 to 4500 Btu/kWh HHV (4220 to 4750 kJ/kWh)
range. The influence of initial steam conditions and process steam
Figure 4. Net Heat to Process (NHP)
Steam to ProcessPROCESS
DA
Boilers
Wr
Wp Hp
hr
hmuWmu
NHP = WpHp – WrHr – Wmuhmu
Figure 5. Fuel Chargeable to Power (FCP)
Plant SupplyingHeat Only
Process Steam
KW (2)
Fuel (2)
Aux Power (2)Aux Power (1)
HRSGFuel (1)
Steam
Plant SupplyingPower and Heat
FCP = Fuel (2) – Fuel (1)
KW (2) – Aux Power (2) + Aux Power (1)
pressure on the amount of cogenerated power per 100 million
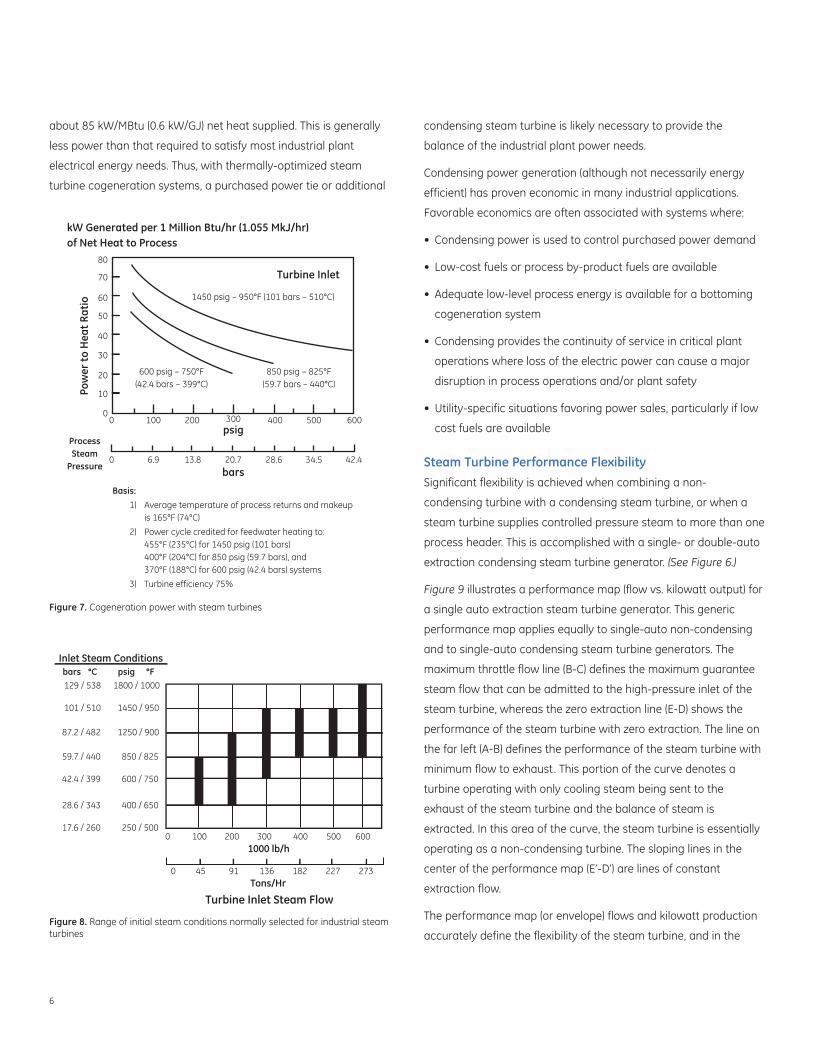
Btu/h (105.5 GJ/h) NHP is illustrated in Figure 7. The increase in
cogenerated power through the use of higher initial steam
conditions, and lower process pressures, is readily apparent.
Studies have shown that higher steam conditions can be
economically justified more easily in industrial plants with relatively
large process steam demands. Data given in Figure 8 provide
guidance with regard to the initial steam conditions that are
normally considered for industrial cogeneration applications.
It should be noted, and it may even be obvious, that there is a
correlation between fuel price and/or energy prices and the initial
steam condition selection for a given application. Specifically, this
illustrates that higher fuel prices and/or energy prices favor the
upper portion of the bands shown in Figure 8.
Even when utilizing the most effective thermally optimized steam
turbine cogeneration systems, the amount of power that can be
cogenerated without a condensing section to the steam turbine,
per unit of heat energy delivered to process, will usually not exceed
GE Energy | GER-3430G (05/09) 5
Figure 6. Steam turbine configurations for power generation and process needs
1. Straight Non-Condensing Steam Turbine Generator (SNC)
5. Uncontrolled Extraction Steam Turbine Generator
3. Single Automatic Extraction Non-Condensing Steam Turbine Generator (SAEC)
4. Double Automatic Extraction Condensing Steam Turbine Generator (DAEC)
2. Straight CondensingSteam Turbine Generator(SC)
Gen. Gen.
Gen.Gen.
Condenser
To Process
To Process
ToProcess
To ProcessTo Process To Process To Process
Condenser
P1 P1P2 P2
NOTE:
Steam Turbine ConfigurationOptions for Either:
Fossil-Fueled Steam PlantsOR
Combined-Cycle Plants
6
about 85 kW/MBtu (0.6 kW/GJ) net heat supplied. This is generally
less power than that required to satisfy most industrial plant
electrical energy needs. Thus, with thermally-optimized steam
turbine cogeneration systems, a purchased power tie or additional
condensing steam turbine is likely necessary to provide the
balance of the industrial plant power needs.
Condensing power generation (although not necessarily energy
efficient) has proven economic in many industrial applications.
Favorable economics are often associated with systems where:
• Condensing power is used to control purchased power demand
• Low-cost fuels or process by-product fuels are available
• Adequate low-level process energy is available for a bottoming
cogeneration system
• Condensing provides the continuity of service in critical plant
operations where loss of the electric power can cause a major
disruption in process operations and/or plant safety
• Utility-specific situations favoring power sales, particularly if low
cost fuels are available
Steam Turbine Performance FlexibilitySignificant flexibility is achieved when combining a non-
condensing turbine with a condensing steam turbine, or when a
steam turbine supplies controlled pressure steam to more than one
process header. This is accomplished with a single- or double-auto
extraction condensing steam turbine generator. (See Figure 6.)
Figure 9 illustrates a performance map (flow vs. kilowatt output) for
a single auto extraction steam turbine generator. This generic
performance map applies equally to single-auto non-condensing
and to single-auto condensing steam turbine generators. The
maximum throttle flow line (B-C) defines the maximum guarantee
steam flow that can be admitted to the high-pressure inlet of the
steam turbine, whereas the zero extraction line (E-D) shows the
performance of the steam turbine with zero extraction. The line on
the far left (A-B) defines the performance of the steam turbine with
minimum flow to exhaust. This portion of the curve denotes a
turbine operating with only cooling steam being sent to the
exhaust of the steam turbine and the balance of steam is
extracted. In this area of the curve, the steam turbine is essentially
operating as a non-condensing turbine. The sloping lines in the
center of the performance map (E’-D’) are lines of constant
extraction flow.
The performance map (or envelope) flows and kilowatt production
accurately define the flexibility of the steam turbine, and in the
Figure 7. Cogeneration power with steam turbines
Basis: 1) Average temperature of process returns and makeup is 165°F (74°C)
2) Power cycle credited for feedwater heating to: 455°F (235°C) for 1450 psig (101 bars) 400°F (204°C) for 850 psig (59.7 bars), and 370°F (188°C) for 600 psig (42.4 bars) systems
3) Turbine efficiency 75%
1450 psig – 950°F (101 bars – 510°C)
Turbine Inlet
600 psig – 750°F(42.4 bars – 399°C)
850 psig – 825°F(59.7 bars – 440°C)
80
70
60
50
40
30
20
10
00
0 6.9 13.8 20.7 28.6 34.5 42.4
100 200 300psig
bars
400 500 600
kW Generated per 1 Million Btu/hr (1.055 MkJ/hr)of Net Heat to Process
ProcessSteam
Pressure
Pow
er to
Hea
t Rat
io
Figure 8. Range of initial steam conditions normally selected for industrial steamturbines
0
0 45
100 200 300 400 500 600
Turbine Inlet Steam FlowTons/Hr
1000 lb/h
91 136 182 227 273
Inlet Steam Conditions
129 / 538 1800 / 1000
101 / 510 1450 / 950
87.2 / 482 1250 / 900
59.7 / 440 850 / 825
42.4 / 399 600 / 750
28.6 / 343 400 / 650
17.6 / 260 250 / 500
bars °C psig °F

case of a combined cycle, defines much of the flexibility of
that cycle as well. It is possible to design the steam turbine for
higher maximum throttle flow. In doing so, the high-pressure
section of the steam turbine is enlarged and the flow that
can be admitted to that section of the turbine is increased.
Likewise, the maximum throttle flow line may be lowered,
which makes the inlet capability less. A similar change is
possible by extending the zero extraction line to the right,
allowing the turbine to produce additional kilowatts with
zero extraction flow. In this case, the exhaust section of
the steam turbine is enlarged.
This tailoring of steam turbine capability to the needs of
the industrial process steam user is critical for maximizing the
flexibility of the cogeneration project—as well as optimizing
the efficiency of the cogeneration system.
Cogeneration and Reheat Steam Turbine CyclesIn most instances, thermal energy in the form of steam is
utilized in industrial plants by condensing steam in process
heat exchangers. Since most processes require heat transfer
at a constant temperature, high degrees of steam superheat
are not desirable and de-super heating (steam attemperation)
stations are commonly applied to control steam temperatures.
In a steam turbine cogeneration cycle, considerable de-super
heater spray water would be required if reheat was considered.
In fact, in most instances the amount of “thermally optimized”
cogenerated power would be less in a reheat cycle compared to
a non-reheat cycle, assuming inlet steam conditions are held
constant. For example, assuming a 500,000 lb/hr (227 metric
ton/hr) process steam demand at 150 psig (10.3 bars) saturated,
a non-reheat cycle with 1450 psig/950°F (100 bars/510°C) initial
steam conditions would deliver about 28 MW. A reheat cycle with
1450 psig/950°F/950°F (100 bars/510°C/510°C) would generate
about 27.3 MW, or 2.5% less power. In addition, the cycle
complexity due to reheat would increase the cost of the turbine,
boiler and associated systems relative to the non-reheat case.
The economics of reheat steam turbines are enhanced in
cogeneration when most of the steam is expanded to the
condenser to produce electric power, i.e., for applications
requiring high power to heat ratios.
Cogeneration with Gas Reciprocating EnginesGas EnginesReciprocating engine generator sets and cogeneration systems are
well suited to fulfil many decentralized energy supply needs. Some
key features of our products include:
• High electrical efficiencies up to 43%
• Overall efficiencies (electrical and thermal) over 90%
• Minimum NOx emissions through the patented LEANOX®
• Lean mixture combustion
• Specially designed gas engines for utilization of alternative,
renewable energy sources (e.g., biogas or landfill gas) and special
gases (e.g., coal mine gas or coke gas)
• Maximum operational safety and availability
• High power density
Through supply of energy directly at the load source, it is
also possible to reduce or avoid altogether transport and
distribution losses.
GE Energy | GER-3430G (05/09) 7
Figure 9. Typical single-automatic extraction turbine-performance map
Max Throttle Flow
High Extraction
Lines of Constant Extraction Flow
Low ExtractionMax E
xhaust
Flow
Zero Extraction Line
Pressure RisekW Point
Min Flow to
Exhaust
Thro
ttle
Flo
w
Max
Ext
ract
ion
kW P
erfo
rman
ce
% of Rated Steam Turbine Output
A
B
30 40 50 60 70 80 90 100
C
D
D'
E'
E
Auto-Extracting Condensing Steam Turbines Provide a Wide Range of Power and Heat to Process Control, Independently
8
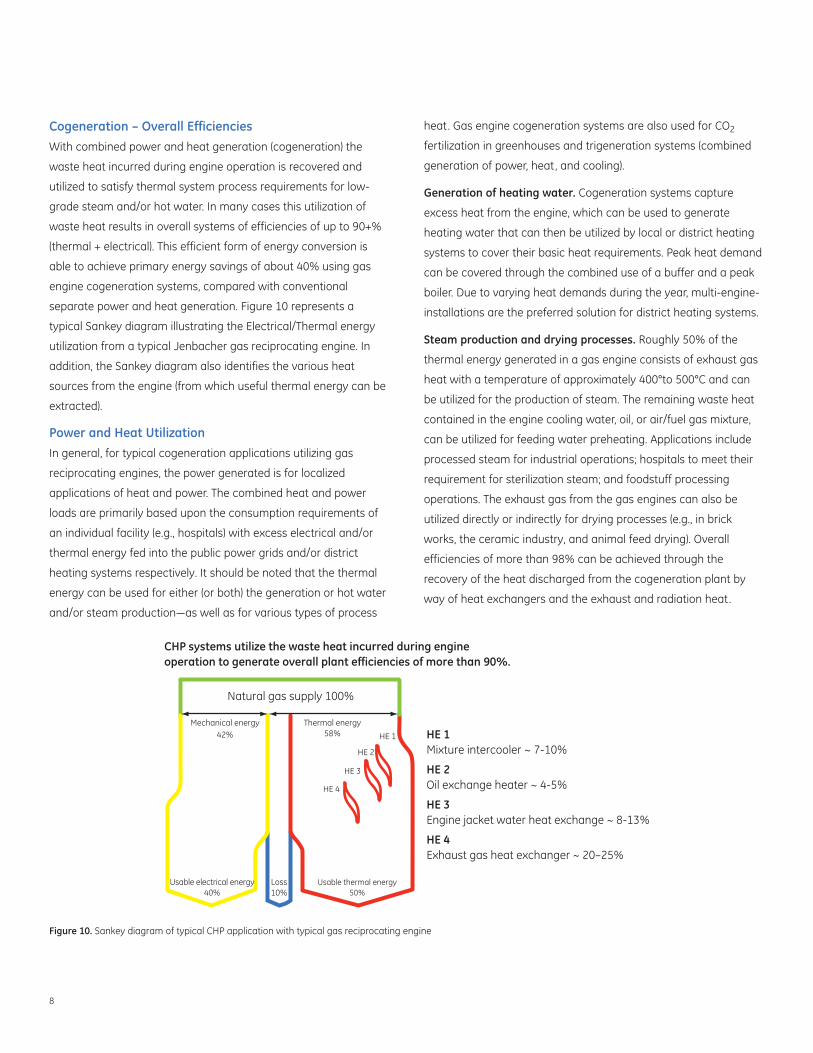
Cogeneration – Overall EfficienciesWith combined power and heat generation (cogeneration) the
waste heat incurred during engine operation is recovered and
utilized to satisfy thermal system process requirements for low-
grade steam and/or hot water. In many cases this utilization of
waste heat results in overall systems of efficiencies of up to 90+%
(thermal + electrical). This efficient form of energy conversion is
able to achieve primary energy savings of about 40% using gas
engine cogeneration systems, compared with conventional
separate power and heat generation. Figure 10 represents a
typical Sankey diagram illustrating the Electrical/Thermal energy
utilization from a typical Jenbacher gas reciprocating engine. In
addition, the Sankey diagram also identifies the various heat
sources from the engine (from which useful thermal energy can be
extracted).
Power and Heat UtilizationIn general, for typical cogeneration applications utilizing gas
reciprocating engines, the power generated is for localized
applications of heat and power. The combined heat and power
loads are primarily based upon the consumption requirements of
an individual facility (e.g., hospitals) with excess electrical and/or
thermal energy fed into the public power grids and/or district
heating systems respectively. It should be noted that the thermal
energy can be used for either (or both) the generation or hot water
and/or steam production—as well as for various types of process
heat. Gas engine cogeneration systems are also used for CO2
fertilization in greenhouses and trigeneration systems (combined
generation of power, heat, and cooling).
Generation of heating water. Cogeneration systems capture
excess heat from the engine, which can be used to generate
heating water that can then be utilized by local or district heating
systems to cover their basic heat requirements. Peak heat demand
can be covered through the combined use of a buffer and a peak
boiler. Due to varying heat demands during the year, multi-engine-
installations are the preferred solution for district heating systems.
Steam production and drying processes. Roughly 50% of the
thermal energy generated in a gas engine consists of exhaust gas
heat with a temperature of approximately 400°to 500°C and can
be utilized for the production of steam. The remaining waste heat
contained in the engine cooling water, oil, or air/fuel gas mixture,
can be utilized for feeding water preheating. Applications include
processed steam for industrial operations; hospitals to meet their
requirement for sterilization steam; and foodstuff processing
operations. The exhaust gas from the gas engines can also be
utilized directly or indirectly for drying processes (e.g., in brick
works, the ceramic industry, and animal feed drying). Overall
efficiencies of more than 98% can be achieved through the
recovery of the heat discharged from the cogeneration plant by
way of heat exchangers and the exhaust and radiation heat.
Figure 10. Sankey diagram of typical CHP application with typical gas reciprocating engine
CHP systems utilize the waste heat incurred during engineoperation to generate overall plant efficiencies of more than 90%.
Natural gas supply 100%
HE 1Mixture intercooler ~ 7-10%
HE 2Oil exchange heater ~ 4-5%
HE 3Engine jacket water heat exchange ~ 8-13%
HE 4Exhaust gas heat exchanger ~ 20–25%
Mechanical energy42%
Loss10%
Usable thermal energy50%
Thermal energy58% HE 1
HE 2
HE 3
HE 4
Usable electrical energy40%
CO2 fertilization in greenhouses. Heat, light and CO2 promote the
growth of plants in greenhouses. With artificial lighting, plants
absorb even more CO2. If the greenhouse atmosphere is enriched
with CO2, plant growth and consequently the harvest yield can be
increased by up to 40%. This process—also called CO2
fertilization—is able to make use of the CO2 contained in the
exhaust gas of a gas engine through catalytic converter
purification. As a result, greenhouses utilizing gas engine
cogeneration systems can cover the power and heat requirement
for the artificial lighting and heating in an economical manner,
while effectively utilizing CO2 of the engine exhaust gas.
Trigeneration. The combination of gas engines with absorption
chillers is an optimal solution for generating air conditioning and/or
refrigeration. The waste heat from the mixture intercooler, the engine
oil, the engine cooling water, and the exhaust gas serves as drive
energy for the chillers. Combining a cogeneration plant unit with an
absorption refrigeration system allows utilization of seasonal excess
heat for cooling. Using trigeneration, it is possible to achieve overall
efficiencies (power and air conditioning and/or refrigeration) of up to
75%, increasing both annual capacity and overall plant efficiency.
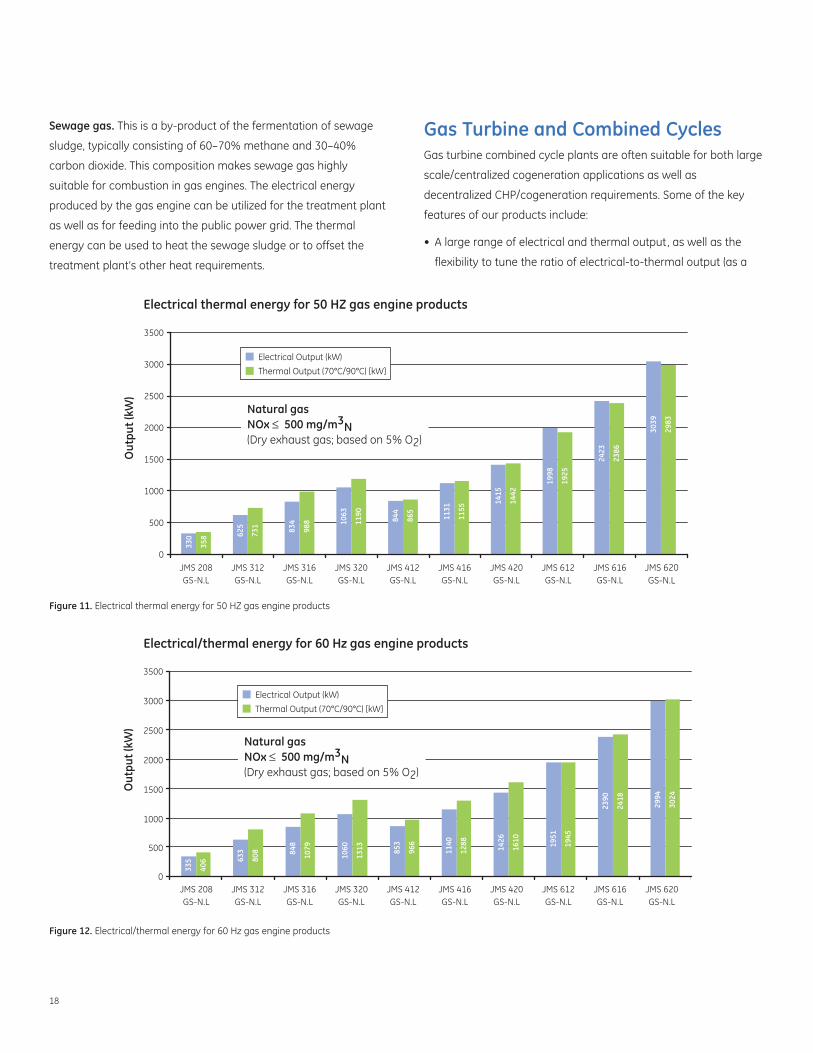
Figures 11 and 12 are graphical representations of both the
electrical and thermal energy available from GE’s 50 and 60 Hz
Jenbacher gas reciprocating engines as a function of engine
model. As identified on the graphs the thermal output is based
upon heating an incoming water source from 70°C to a discharge
temperature of 90°C.
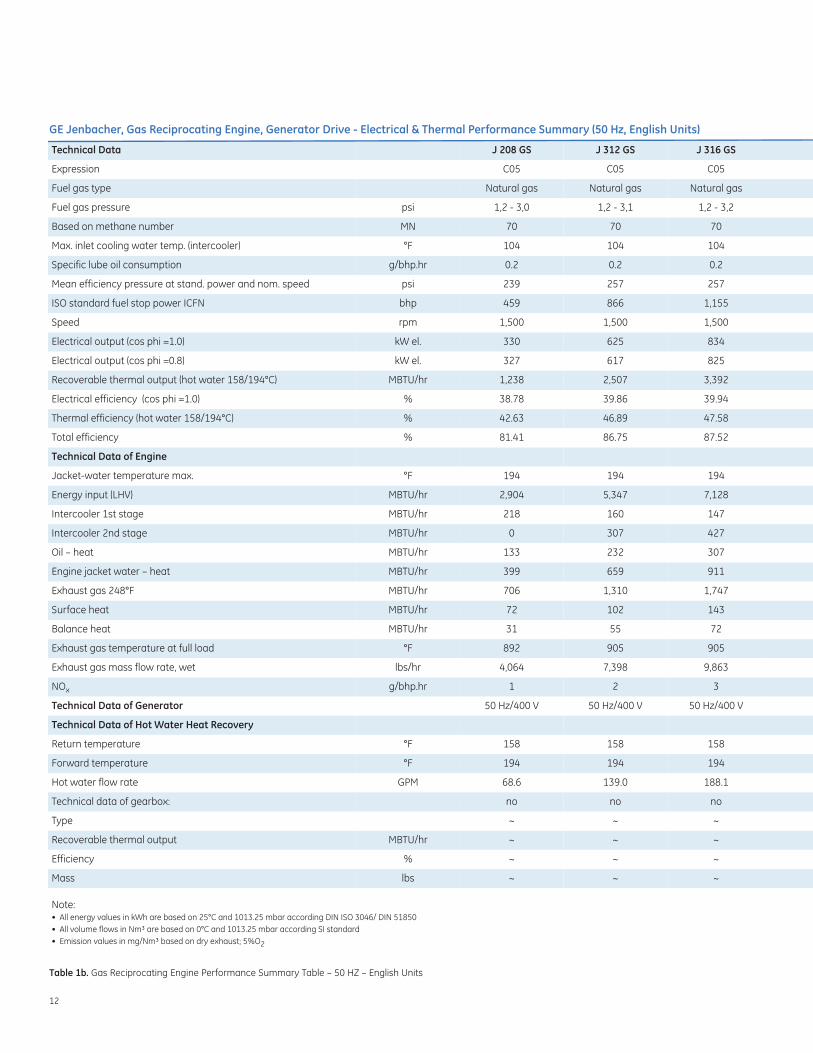
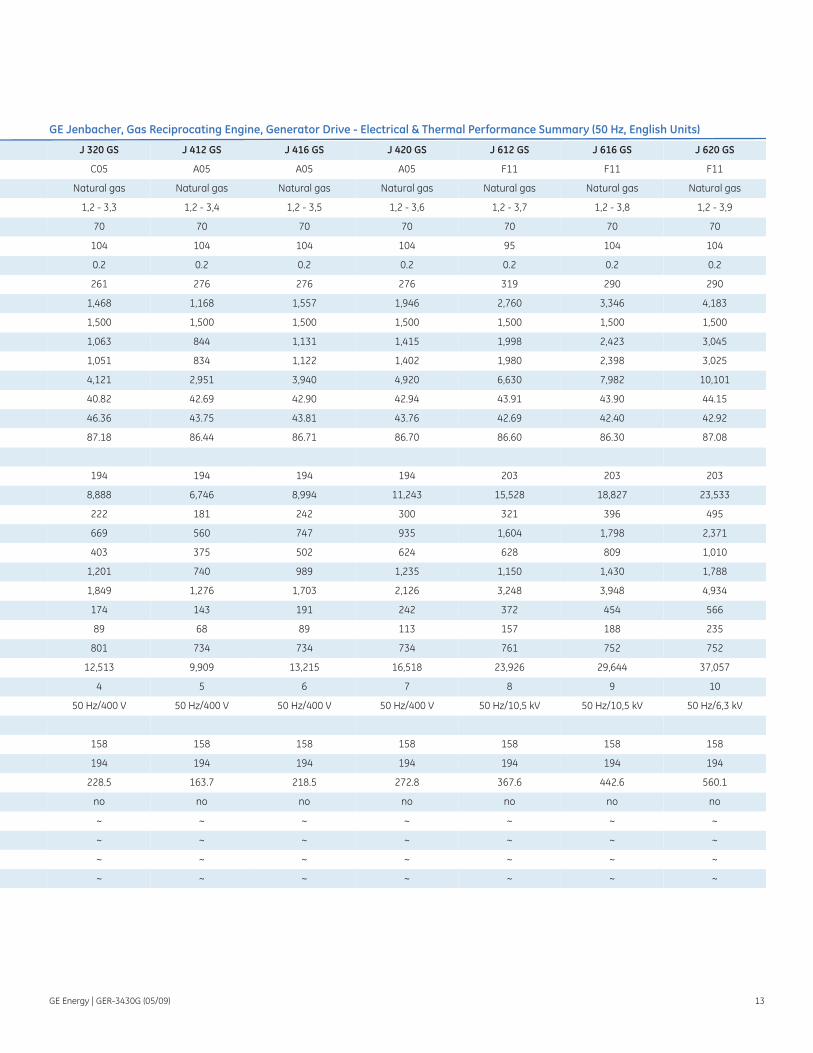
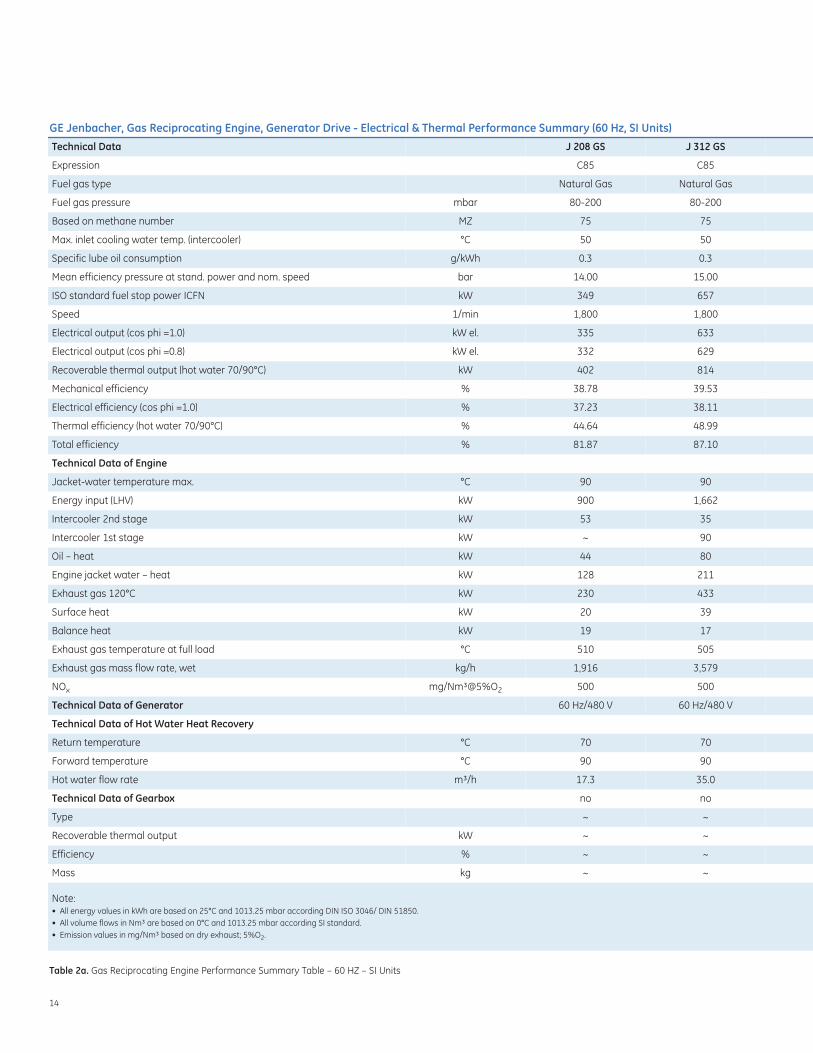
Tables 1a, 1b, 2a and 2b are performance summary tables for GE’s
50 and 60 Hz gas reciprocating engines. For convenience data has
been provided in both SI and English units.
Fuel Flexibility and Gas Reciprocating EnginesOne of the more significant characteristics/values of GE’s
Jenbacher gas engines is its fuel flexibility. Not only are standard
engines capable of burning natural gas, but specialized engines
also are available for burning unique gases such as flare gas and
other specialized gases (such as biogas, landfill, sewage, coal mine
and coke gases). The value of the standard engines is that they are
well suited for production of reliable, decentralized energy as
supported by a well-established, reliable natural gas supply system
infrastructures. The value of the gas engines revolves around the
fact that they are capable of generating useful energy (both heat
and power) from fuel sources that otherwise would have been
wasted and which otherwise would have served as an ecological
detriment. To this end, biogas, landfill gas, and coal mine gas-
fueled engines have been certified as GE “ecomagination” products
by an independent agency. It is also worthy to note that in addition
to having a wide range of fuel flexibility in terms of fuel
composition and heat characteristics, another value which
reciprocating engines afford is that they are capable of burning
low pressure fuels. Thus, they require little or no fuel gas
compression (as compared to alternative technology solutions).
Flare gas. This is an associated gas obtained during crude oil
exploration, largely consisting of methane and higher
hydrocarbons. The use of flare gas—which is generally available
free of charge as a waste product—ensures a fuel source for on-
site power generation and, if required, the engines can also provide
a heat supply for surrounding facilities. Consequently this problem
gas, instead of flaring it off while causing ecological exposure, can
be used economically and practically.
Biogas. For a wide range of organic substances from agriculture,
foodstuff, and feed industries, anaerobic fermentation is a superior
alternative to composting. Biogas—a mixture of methane and
carbon dioxide—is formed in the fermentation process of a wide
range of organic substances from the agriculture, foodstuff, and
feed industries. It is a high-energy fuel with a calorific value of 5–6
kWh/m3N that can substitute fossil fuel energy. Due to the organic
nature of the components of biogas, burning it in a gas engine for
power generation emits the same amount of CO2 into the
atmosphere as was originally absorbed during the process of
photosynthesis in the natural CO2 cycle. Using biogas in gas
engines promotes proper waste disposal, and allows the use of the
end products from the fermentation process as fertilizer.
Landfill gas. This is biogas in that it is formed as a result of the
decomposition of organic substances. It consists of methane (CH4),
carbon dioxide (CO2), nitrogen (N2), and a small amount of oxygen
(O2). To allow for proper re-cultivation of landfills, prevent offensive
smells, smouldering fires, or the migration of landfill gas into the
waterways these gases must be continuously extracted under
controlled conditions. With a calorific value of about 4 to 5 kWh/m3N,
landfill gas constitutes a high-value fuel for gas engines and can
therefore be economically utilized for power generation.
GE Energy | GER-3430G (05/09) 9

10
GE Jenbacher, Gas Reciprocating Engine, Generator Drive - Electrical & Thermal Performance Summary (50 Hz, SI Units)
Technical Data J 208 GS J 312 GS J 316 GS
Expression C05 C05 C05
Fuel gas type Natural Gas Natural Gas Natural Gas
Fuel gas pressure mbar 80-200 80-200 80-200
Based on methane number MN 70 70 70
Max. inlet cooling water temp. (intercooler) °C 40 40 40
Specific lube oil consumption g/kWh 0.3 0.3 0.3
Mean efficiency pressure at stand. power and nom. speed bar 16.50 17.70 17.70
ISO standard fuel stop power ICFN kW 342 646 861
Speed 1/min 1,500 1,500 1,500
Electrical output (cos phi =1.0) kW el. 330 625 834
Electrical output (cos phi =0.8) kW el. 327 617 825
Recoverable thermal output (hot water 70/90°C) kW 363 735 994
Electrical efficiency (cos phi =1.0) % 38.78 39.86 39.94
Thermal efficiency (hot water 70/90°C) % 42.63 46.89 47.58
Total efficiency % 81.41 86.75 87.52
Technical Data of Engine
Jacket-water temperature max. °C 90 90 90
Energy input [LHV] kW 851 1,567 2,089
Intercooler 2nd stage kW 64 47 43
Intercooler 1st stage kW ~ 90 125
Oil – heat kW 39 68 90
Engine jacket water – heat kW 117 193 267
Exhaust gas 120°C kW 207 384 512
Surface heat kW 21 30 42
Balance heat kW 9 16 21
Exhaust gas temperature at full load °C 478 485 485
Exhaust gas mass flow rate, wet kg/h 1,843 3,355 4,473
NOx mg/Nm³@5%O2 500 500 500
Technical Data of Generator 50 Hz/400 V 50 Hz/400 V 50 Hz/400 V
Technical Data of Hydraulic
Return temperature °C 70 70 70
Forward temperature °C 90 90 90
Hot water flow rate m³/h 15.6 31.6 42.7
Note:• All energy values in kWh are based on 25°C and 1013.25 mbar according DIN ISO 3046/ DIN 51850• All volume flows in Nm³ are based on 0°C and 1013.25 mbar according SI standard• Emission values in mg/Nm³ based on dry exhaust; 5%O2
Table 1a. Gas Reciprocating Engine Performance Summary Table – 50 HZ – SI Units
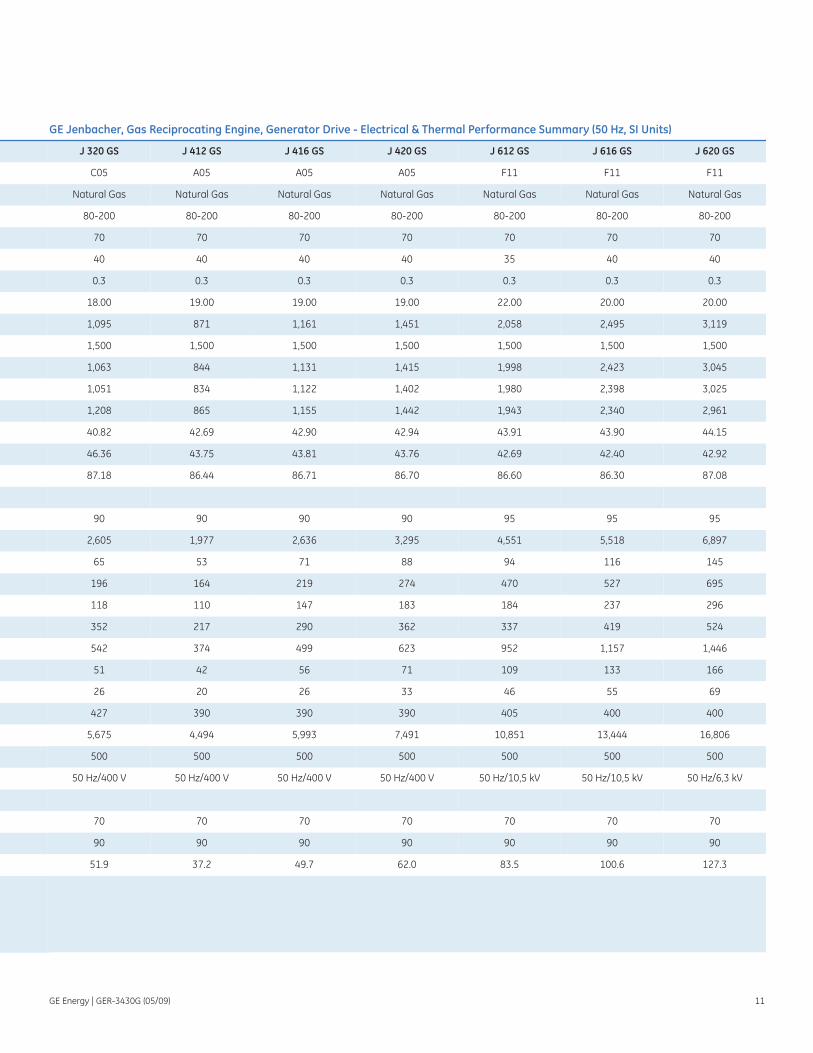
GE Energy | GER-3430G (05/09) 11
GE Jenbacher, Gas Reciprocating Engine, Generator Drive - Electrical & Thermal Performance Summary (50 Hz, SI Units)
J 320 GS J 412 GS J 416 GS J 420 GS J 612 GS J 616 GS J 620 GS
C05 A05 A05 A05 F11 F11 F11
Natural Gas Natural Gas Natural Gas Natural Gas Natural Gas Natural Gas Natural Gas
80-200 80-200 80-200 80-200 80-200 80-200 80-200
70 70 70 70 70 70 70
40 40 40 40 35 40 40
0.3 0.3 0.3 0.3 0.3 0.3 0.3
18.00 19.00 19.00 19.00 22.00 20.00 20.00
1,095 871 1,161 1,451 2,058 2,495 3,119
1,500 1,500 1,500 1,500 1,500 1,500 1,500
1,063 844 1,131 1,415 1,998 2,423 3,045
1,051 834 1,122 1,402 1,980 2,398 3,025
1,208 865 1,155 1,442 1,943 2,340 2,961
40.82 42.69 42.90 42.94 43.91 43.90 44.15
46.36 43.75 43.81 43.76 42.69 42.40 42.92
87.18 86.44 86.71 86.70 86.60 86.30 87.08
90 90 90 90 95 95 95
2,605 1,977 2,636 3,295 4,551 5,518 6,897
65 53 71 88 94 116 145
196 164 219 274 470 527 695
118 110 147 183 184 237 296
352 217 290 362 337 419 524
542 374 499 623 952 1,157 1,446
51 42 56 71 109 133 166
26 20 26 33 46 55 69
427 390 390 390 405 400 400
5,675 4,494 5,993 7,491 10,851 13,444 16,806
500 500 500 500 500 500 500
50 Hz/400 V 50 Hz/400 V 50 Hz/400 V 50 Hz/400 V 50 Hz/10,5 kV 50 Hz/10,5 kV 50 Hz/6,3 kV
70 70 70 70 70 70 70
90 90 90 90 90 90 90
51.9 37.2 49.7 62.0 83.5 100.6 127.3
12
GE Jenbacher, Gas Reciprocating Engine, Generator Drive - Electrical & Thermal Performance Summary (50 Hz, English Units)
Technical Data J 208 GS J 312 GS J 316 GS
Expression C05 C05 C05
Fuel gas type Natural gas Natural gas Natural gas
Fuel gas pressure psi 1,2 - 3,0 1,2 - 3,1 1,2 - 3,2
Based on methane number MN 70 70 70
Max. inlet cooling water temp. (intercooler) °F 104 104 104
Specific lube oil consumption g/bhp.hr 0.2 0.2 0.2
Mean efficiency pressure at stand. power and nom. speed psi 239 257 257
ISO standard fuel stop power ICFN bhp 459 866 1,155
Speed rpm 1,500 1,500 1,500
Electrical output (cos phi =1.0) kW el. 330 625 834
Electrical output (cos phi =0.8) kW el. 327 617 825
Recoverable thermal output (hot water 158/194°C) MBTU/hr 1,238 2,507 3,392
Electrical efficiency (cos phi =1.0) % 38.78 39.86 39.94
Thermal efficiency (hot water 158/194°C) % 42.63 46.89 47.58
Total efficiency % 81.41 86.75 87.52
Technical Data of Engine
Jacket-water temperature max. °F 194 194 194
Energy input (LHV) MBTU/hr 2,904 5,347 7,128
Intercooler 1st stage MBTU/hr 218 160 147
Intercooler 2nd stage MBTU/hr 0 307 427
Oil – heat MBTU/hr 133 232 307
Engine jacket water – heat MBTU/hr 399 659 911
Exhaust gas 248°F MBTU/hr 706 1,310 1,747
Surface heat MBTU/hr 72 102 143
Balance heat MBTU/hr 31 55 72
Exhaust gas temperature at full load °F 892 905 905
Exhaust gas mass flow rate, wet lbs/hr 4,064 7,398 9,863
NOx g/bhp.hr 1 2 3
Technical Data of Generator 50 Hz/400 V 50 Hz/400 V 50 Hz/400 V
Technical Data of Hot Water Heat Recovery
Return temperature °F 158 158 158
Forward temperature °F 194 194 194
Hot water flow rate GPM 68.6 139.0 188.1
Technical data of gearbox: no no no
Type ~ ~ ~
Recoverable thermal output MBTU/hr ~ ~ ~
Efficiency % ~ ~ ~
Mass lbs ~ ~ ~
Note:• All energy values in kWh are based on 25°C and 1013.25 mbar according DIN ISO 3046/ DIN 51850• All volume flows in Nm³ are based on 0°C and 1013.25 mbar according SI standard• Emission values in mg/Nm³ based on dry exhaust; 5%O2
Table 1b. Gas Reciprocating Engine Performance Summary Table – 50 HZ – English Units
GE Energy | GER-3430G (05/09) 13
GE Jenbacher, Gas Reciprocating Engine, Generator Drive - Electrical & Thermal Performance Summary (50 Hz, English Units)
J 320 GS J 412 GS J 416 GS J 420 GS J 612 GS J 616 GS J 620 GS
C05 A05 A05 A05 F11 F11 F11
Natural gas Natural gas Natural gas Natural gas Natural gas Natural gas Natural gas
1,2 - 3,3 1,2 - 3,4 1,2 - 3,5 1,2 - 3,6 1,2 - 3,7 1,2 - 3,8 1,2 - 3,9
70 70 70 70 70 70 70
104 104 104 104 95 104 104
0.2 0.2 0.2 0.2 0.2 0.2 0.2
261 276 276 276 319 290 290
1,468 1,168 1,557 1,946 2,760 3,346 4,183
1,500 1,500 1,500 1,500 1,500 1,500 1,500
1,063 844 1,131 1,415 1,998 2,423 3,045
1,051 834 1,122 1,402 1,980 2,398 3,025
4,121 2,951 3,940 4,920 6,630 7,982 10,101
40.82 42.69 42.90 42.94 43.91 43.90 44.15
46.36 43.75 43.81 43.76 42.69 42.40 42.92
87.18 86.44 86.71 86.70 86.60 86.30 87.08
194 194 194 194 203 203 203
8,888 6,746 8,994 11,243 15,528 18,827 23,533
222 181 242 300 321 396 495
669 560 747 935 1,604 1,798 2,371
403 375 502 624 628 809 1,010
1,201 740 989 1,235 1,150 1,430 1,788
1,849 1,276 1,703 2,126 3,248 3,948 4,934
174 143 191 242 372 454 566
89 68 89 113 157 188 235
801 734 734 734 761 752 752
12,513 9,909 13,215 16,518 23,926 29,644 37,057
4 5 6 7 8 9 10
50 Hz/400 V 50 Hz/400 V 50 Hz/400 V 50 Hz/400 V 50 Hz/10,5 kV 50 Hz/10,5 kV 50 Hz/6,3 kV
158 158 158 158 158 158 158
194 194 194 194 194 194 194
228.5 163.7 218.5 272.8 367.6 442.6 560.1
no no no no no no no
~ ~ ~ ~ ~ ~ ~
~ ~ ~ ~ ~ ~ ~
~ ~ ~ ~ ~ ~ ~
~ ~ ~ ~ ~ ~ ~
14
GE Jenbacher, Gas Reciprocating Engine, Generator Drive - Electrical & Thermal Performance Summary (60 Hz, SI Units)Technical Data J 208 GS J 312 GS
Expression C85 C85
Fuel gas type Natural Gas Natural Gas
Fuel gas pressure mbar 80-200 80-200
Based on methane number MZ 75 75
Max. inlet cooling water temp. (intercooler) °C 50 50
Specific lube oil consumption g/kWh 0.3 0.3
Mean efficiency pressure at stand. power and nom. speed bar 14.00 15.00
ISO standard fuel stop power ICFN kW 349 657
Speed 1/min 1,800 1,800
Electrical output (cos phi =1.0) kW el. 335 633
Electrical output (cos phi =0.8) kW el. 332 629
Recoverable thermal output (hot water 70/90°C) kW 402 814
Mechanical efficiency % 38.78 39.53
Electrical efficiency (cos phi =1.0) % 37.23 38.11
Thermal efficiency (hot water 70/90°C) % 44.64 48.99
Total efficiency % 81.87 87.10
Technical Data of Engine
Jacket-water temperature max. °C 90 90
Energy input (LHV) kW 900 1,662
Intercooler 2nd stage kW 53 35
Intercooler 1st stage kW ~ 90
Oil – heat kW 44 80
Engine jacket water – heat kW 128 211
Exhaust gas 120°C kW 230 433
Surface heat kW 20 39
Balance heat kW 19 17
Exhaust gas temperature at full load °C 510 505
Exhaust gas mass flow rate, wet kg/h 1,916 3,579
NOx mg/Nm³@5%O2 500 500
Technical Data of Generator 60 Hz/480 V 60 Hz/480 V
Technical Data of Hot Water Heat Recovery
Return temperature °C 70 70
Forward temperature °C 90 90
Hot water flow rate m³/h 17.3 35.0
Technical Data of Gearbox no no
Type ~ ~
Recoverable thermal output kW ~ ~
Efficiency % ~ ~
Mass kg ~ ~
Note:• All energy values in kWh are based on 25°C and 1013.25 mbar according DIN ISO 3046/ DIN 51850.• All volume flows in Nm³ are based on 0°C and 1013.25 mbar according SI standard.• Emission values in mg/Nm³ based on dry exhaust; 5%O2.
Table 2a. Gas Reciprocating Engine Performance Summary Table – 60 HZ – SI Units

GE Energy | GER-3430G (05/09) 15
GE Jenbacher, Gas Reciprocating Engine, Generator Drive - Electrical & Thermal Performance Summary (60 Hz, SI Units)J 316 GS J 320 GS J 420 GS J 612 GS J 616 GS J 620 GS
C85 C85 A85 F11 F11 F11
Natural Gas Natural Gas Natural Gas Natural Gas Natural Gas Natural Gas
80-200 80-200 80-200 80-200 80-200 80-200
75 75 70 70 70 70
50 50 50 35 40 40
0.3 0.3 0.3 0.3 0.3 0.3
15.00 15.00 16.00 22.00 20.00 20.00
876 1,095 1,466 2,058 2,495 3,119
1,800 1,800 1,800 1,500 1,500 1,500
848 1059 1426 1951 2390 2994
840 1049 1416 1951 2368 2974
1,089 1,324 1,610 1,963 2,372 3,002
39.53 40.33 41.96 45.22 45.22 45.22
38.27 39.00 40.82 42.86 43.32 43.42
49.15 48.78 46.07 43.13 42.99 43.53
87.42 87.78 86.90 85.99 86.31 86.94
90 90 90 95 95 95
2,216 2,715 3,494 4,551 5,518 6,897
47 50 74 94 116 145
120 176 206 470 527 695
108 129 129 184 237 296
284 356 468 337 419 524
577 663 807 952 1,157 1,446
47 51 71 109 133 166
22 27 35 46 55 69
505 487 451 405 400 400
4,772 5,767 7,828 10,851 13,444 16,806
500 500 500 500 500 500
60 Hz/480 V 60 Hz/480 V 60 Hz/480 V 60 Hz/480 V 60 Hz/480 V 60 Hz/4,16 kV
70 70 70 70 70 70
90 90 90 90 90 90
46.8 56.9 69.2 84.4 102.0 129.1
no no no yes yes yes
~ ~ ~ ANO - 090 ANO - 110 ANO - 110
~ ~ ~ 20 33 42
~ ~ ~ 98.7 98.6 98.6
~ ~ ~ 1035 2500 2500

16
GE Jenbacher, Gas Reciprocating Engine, Generator Drive - Electrical & Thermal Performance Summary (60 Hz, English Units)Technical Data J208 J312
Expression C85 C85
Fuel gas type Natural gas Natural gas
Fuel gas pressure psi 1,2 - 2,9 1,2 - 2,9
Based on methane number MN 75 75
Max. inlet cooling water temp. (intercooler) °F 122 122
Specific lube oil consumption g/bhp.hr 0.2 0.2
Mean efficiency pressure at stand. power and nom. speed psi 203 218
ISO standard fuel stop power ICFN bhp 468 881
Speed rpm 1,800 1,800
Electrical output (cos phi =1.0) kW el. 335 633
Electrical output (cos phi =0.8) kW el. 332 629
Recoverable thermal output (hot water 158/194°C) MBTU/hr 1,372 2,777
Electrical efficiency (cos phi =1.0) % 37.23 38.11
Thermal efficiency (hot water 158/194°C) % 44.67 48.98
Total efficiency % 81.87 87.10
Technical Data of Engine
Jacket-water temperature max. °F 194 194
Energy input (LHV) MBTU/hr 3,071 5,671
Intercooler 1st stage MBTU/hr ~ 307
Intercooler 2nd stage MBTU/hr 181 119
Oil – heat MBTU/hr 150 273
Engine jacket water – heat MBTU/hr 437 720
Exhaust gas 248°F MBTU/hr 785 1477
Surface heat MBTU/hr 68 133
Balance heat MBTU/hr 65 58
Exhaust gas temperature at full load °F 950 941
Exhaust gas mass flow rate, wet lbs/hr 4,224 7,890
NOx g/bhp.hr 1.1 1.1
Technical Data of Generator: 60 Hz/480 V 60 Hz/480 V
Technical Data of Hot Water Heat Recovery
Return temperature °F 158 158
Forward temperature °F 194 194
Hot water flow rate GPM 76.2 154.4
Technical Data of Gearbox no no
Type ~ ~
Recoverable thermal output MBTU/hr ~ ~
Efficiency % ~ ~
Mass lbs ~ ~
Note:• All energy values in kWh are based on 25°C and 1013.25 mbar according DIN ISO 3046/ DIN 51850.• All volume flows in Nm³ are based on 0°C and 1013.25 mbar according SI standard.• Emission values in mg/Nm³ based on dry exhaust; 5%O2.
Table 2b. Gas Reciprocating Engine Performance Summary Table – 60 HZ – English Units

GE Energy | GER-3430G (05/09) 17
GE Jenbacher, Gas Reciprocating Engine, Generator Drive - Electrical & Thermal Performance Summary (60 Hz, English Units)J316 J320 J420 J612 J616 J620
C85 C85 A85 F11 F11 F11
Natural gas Natural gas Natural gas Natural gas Natural gas Natural gas
1,2 - 2,9 1,2 - 2,9 1,2 - 2,9 1,2 - 2,9 1,2 - 2,9 1,2 - 2,9
75 75 70 70 70 70
122 122 122 95 104 104
0.2 0.2 0.2 0.2 0.2 0.2
218 218 232 319 290 290
1,175 1,468 1,966 2,760 3,346 4,183
1,800 1,800 1,800 1,500 1,500 1,500
848 1059 1426 1951 2390 2994
840 1049 1416 1951 2368 2974
3,716 4,518 5,493 6,698 8,095 10,245
38.27 39.00 40.82 42.86 43.32 43.42
49.14 48.77 46.08 43.13 43.00 43.53
87.42 87.78 86.90 85.99 86.31 86.94
194 194 194 203 203 203
7,561 9,264 11,922 15,529 18,828 23,534
409 601 703 1,604 1,798 2,371
160 171 252 321 396 495
369 440 440 628 809 1,010
969 1,215 1,597 1,150 1,430 1,788
1969 2262 2753 3248 3948 4934
160 174 242 372 454 566
75 92 119 157 188 235
941 909 844 761 752 752
10,520 12,714 17,258 23,922 29,639 37,051
1.1 1.1 1.1 1.1 1.1 1.1
60 Hz/480 V 60 Hz/480 V 60 Hz/480 V 60 Hz/480 V 60 Hz/480 V 60 Hz/4,16 kV
158 158 158 158 158 158
194 194 194 194 194 194
206.5 251.0 305.1 372.1 449.7 569.1
no no no yes yes yes
~ ~ ~ ANO - 090 ANO - 110 ANO - 110
~ ~ ~ 68 111 142
~ ~ ~ 98.7 98.6 98.6
~ ~ ~ 2282 5512 5512
18
Sewage gas. This is a by-product of the fermentation of sewage
sludge, typically consisting of 60–70% methane and 30–40%
carbon dioxide. This composition makes sewage gas highly
suitable for combustion in gas engines. The electrical energy
produced by the gas engine can be utilized for the treatment plant
as well as for feeding into the public power grid. The thermal
energy can be used to heat the sewage sludge or to offset the
treatment plant’s other heat requirements.
Gas Turbine and Combined CyclesGas turbine combined cycle plants are often suitable for both large
scale/centralized cogeneration applications as well as
decentralized CHP/cogeneration requirements. Some of the key
features of our products include:
• A large range of electrical and thermal output, as well as the
flexibility to tune the ratio of electrical-to-thermal output (as a
Figure 12. Electrical/thermal energy for 60 Hz gas engine products
JMS 208GS-N.L
JMS 312GS-N.L
JMS 316GS-N.L
JMS 320GS-N.L
JMS 412GS-N.L
JMS 416GS-N.L
JMS 420GS-N.L
JMS 612GS-N.L
JMS 616GS-N.L
JMS 620GS-N.L
3500
3000
2500
2000
1500
1000
500
0
335
406 63
3
808 84
8
1079
1060
1313 85
3
966
1140
1288
1426
1610 1951
1945
2390
2418
2994
3024
Natural gas NOx ≤ 500 mg/m3N(Dry exhaust gas; based on 5% O2)
Electrical Output (kW)
Thermal Output (70°C/90°C) [kW]
Electrical/thermal energy for 60 Hz gas engine products
Out
put (
kW)
Figure 11. Electrical thermal energy for 50 HZ gas engine products
Natural gas NOx ≤ 500 mg/m3N(Dry exhaust gas; based on 5% O2)
3500
3000
2500
2000
1500
1000
500
0
330
358 62
5
731 83
4
988 10
63
1190
844
865
1131
1155
1415
1442
1998
1925
2423
2386
3039
2983
JMS 208GS-N.L
JMS 312GS-N.L
JMS 316GS-N.L
JMS 320GS-N.L
JMS 412GS-N.L
JMS 416GS-N.L
JMS 420GS-N.L
JMS 612GS-N.L
JMS 616GS-N.L
JMS 620GS-N.L
Electrical thermal energy for 50 HZ gas engine products
Out
put (
kW)
Electrical Output (kW)
Thermal Output (70°C/90°C) [kW]

result of a significant portfolio of heavy duty and aeroderivative
gas turbines, coupled with cycle flexibility that is inherent to
combined cycle cogeneration)
• Overall efficiencies (electrical and thermal) of 90-95% for unfired
and fired applications and higher yet for fully fired combined
cycle, cogeneration applications
• A wide range of liquid and gas fuel capability/flexibility
• Industry leadership NOx capability via DLN/DLE combustion
systems
• Industry leadership in gas turbine experience, reliability and
availability
Gas turbine cycles provide an opportunity to generate two-to-four
times more power output per unit of heat required in process,
relative to the “thermally optimized” steam turbine cogeneration
systems as defined in the Cogeneration section of this document.
Historically it has been this characteristic, combined with a
favorable FCP and proven reliability, that has made this technology
widely accepted in applications where suitable fuels are
economically available.
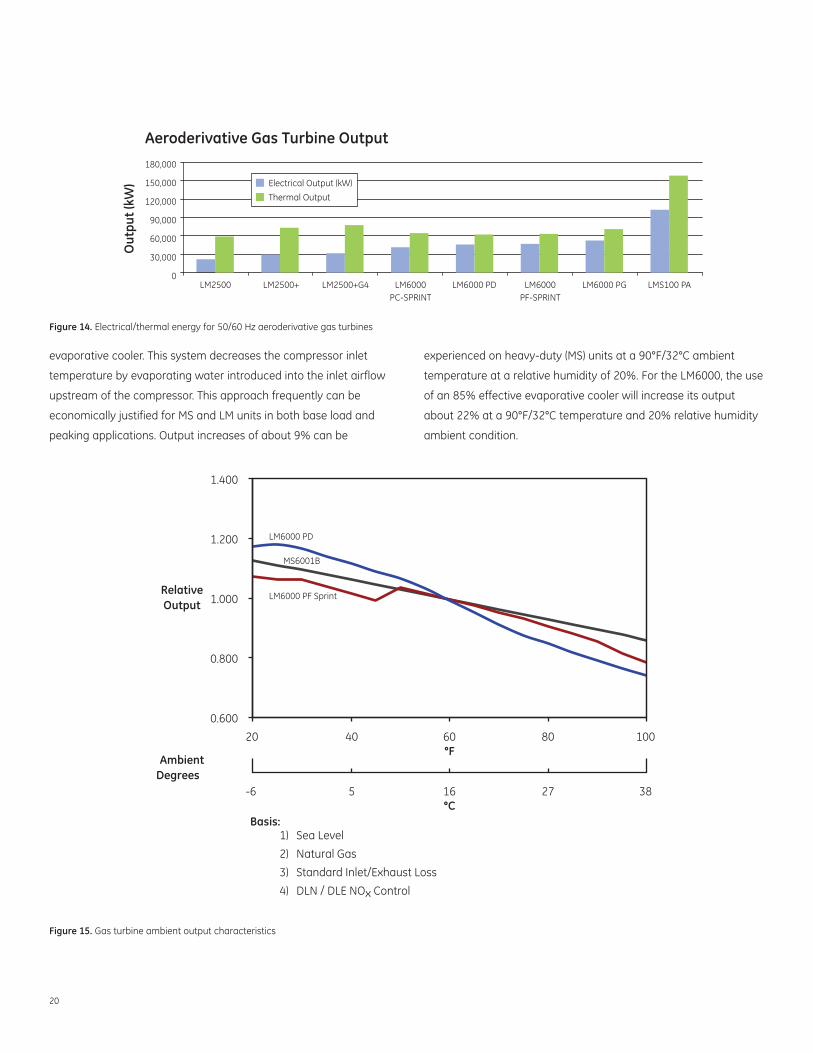
Figures 13 and 14 represent a characterization of the nominal
electrical and thermal output capability of both our heavy-duty gas
turbine products as well as our aeroderivative units respectively. It
should be noted that the thermal output capability reflected by this
graphic is relative to ISO ambient conditions versus a pre-defined
steam and/or hot water requirement.
Another significant driver—in a world now more environmentally
conscious than ever—is a global thrust to develop projects which
not only minimize GHG emissions but also help to displace GHG
emissions from other industrial sources. Thus, one of the more
significant advantages of gas-turbine and engine-based
cogeneration is the potential for significant GHG reductions.
Further, it is the monetization of GHG reductions and other possible
financial incentives that are helping to encourage and facilitate the
development of cogeneration applications.
Gas Turbine Power EnhancementsThe gas turbine is an air-breathing engine that responds
to the mass flow entering its compressor. For constant speed
units, the gas turbine output will generally vary in proportion
to the inlet air temperature (density) as shown for the MS6001B
in Figure 15. GE’s aeroderivative, multi-shaft designs use a
variety of parameters in their control logic and therefore
can have a different operating profiles as illustrated in
Figure 15.
The gas turbine output may be enhanced at high ambient
temperatures and low humidity levels by application of an
GE Energy | GER-3430G (05/09) 19
Figure 13. Electrical thermal energy for 50/60 Hz heavy-duty gas turbines
5PA 6B 6C 6FA 7EA 9E 7FA 7FB 9FA 9FB
Heavy Duty Gas Turbine Output
Out
put (
kW)
Turbine Model
500,000
450,000
400,000
350,000
300,000
250,000
200,000
150,000
100,000
50,000
0
Electrical Output (kW)
Thermal Output
20
evaporative cooler. This system decreases the compressor inlet
temperature by evaporating water introduced into the inlet airflow
upstream of the compressor. This approach frequently can be
economically justified for MS and LM units in both base load and
peaking applications. Output increases of about 9% can be
experienced on heavy-duty (MS) units at a 90°F/32°C ambient
temperature at a relative humidity of 20%. For the LM6000, the use
of an 85% effective evaporative cooler will increase its output
about 22% at a 90°F/32°C temperature and 20% relative humidity
ambient condition.
Figure 14. Electrical/thermal energy for 50/60 Hz aeroderivative gas turbines
Aeroderivative Gas Turbine OutputO
utpu
t (kW
)
180,000
150,000
120,000
90,000
60,000
30,000
0
Electrical Output (kW)
Thermal Output
LM2500 LM2500+ LM2500+G4 LM6000PC-SPRINT
LM6000PF-SPRINT
LM6000 PG LMS100 PALM6000 PD
Figure 15. Gas turbine ambient output characteristics
0.600
0.800
1.000
1.200
1.400
20 40 60 80 100 °F
-6 5 16 27 38 °C
AmbientDegrees
RelativeOutput
LM6000 PD
MS6001B
LM6000 PF Sprint
1) Sea Level
2) Natural Gas
3) Standard Inlet/Exhaust Loss
4) DLN / DLE NOx Control
Basis:

Another alternative often considered for power augmentation
and/or to simply minimize the impact of ambient temperature
effects is the use of inlet air chillers. Depending upon power plant
economics—in conjunction with ambient temperature and plant
load profiles—chillers can afford substantial economic value. This
alternative cools the incoming air, thus increasing the output
relative to the gain available with an evaporative cooler.
Frequently, the energy for cooling can be supplied by a mechanical
or absorption refrigeration system that receives its steam from a
low-pressure section in the gas turbine heat recovery steam
generator (HRSG).
For the diluent-injected LM6000, the normal decrease in
power output at ambient temperatures less than about
50°F (10°C) can be mitigated through inlet air heating to the
maximum power output temperature. Low-level energy recovery
from the HRSG can accomplish this task. The net effect is to drive
the performance characteristics for the LM6000 flat over the
ambient temperature range. (See Figure 16.)
The example gas turbine output enhancements are not limited to
LM units only, and should be evaluated for all gas turbines to
ensure that the maximum economic benefits are realized.
The greater the output change (lapse rate) with changing ambient
temperature, the larger the economic potential associated with
various power enhancement alternatives.
Fuel Flexibility and Gas TurbinesOver the years, significant strides have been made in the
progression of combustion system technology. This technology
progression includes advancements in fuel flexibility (the ability to
use traditional fuels over a wider range and a steadily increasing
ability to burn more non-traditional fuels), reductions in emissions
levels, as well and the ability to meet lower emissions level over an
extended range of turn down (larger output load range).
Almost everyone knows that gas turbines can burn natural gas, but
many of them can also burn alternative fuels either with or without
water injection, depending upon NOx/CO level requirements.
Typical examples of the aforementioned alternative fuels include:
• Gases such as synthetic gas (resulting from petcoke or coal
gasification), steel mill gases, and petrochemical process gases
• Liquids such as light distillate, naphtha, and heavy fuel oils
Dry Low NOx combustors—originally developed in the 1990s to
GE Energy | GER-3430G (05/09) 21
Figure 16. LM6000 PC inlet conditioning output enhancements
55,000
50,000
45,000
40,000
35,000
30,000
25,000
20,00020 40 60 80 100 °F
-6 5 16 27 38 °C
AmbientDegrees
Output(kWe)
MechanicalCoding
EvaporativeCoding
StandardPerformance

22
meet 25 ppm @ 15% 02 without water injection and mainly with
methane—have recently improved their capabilities to burn gases
with heavier hydrocarbons or more hydrogen to levels down to
below 5 ppm @ 15% 02 on the 6B, 7E and 9E.
Combustion systems have also progressed significantly to accept
gas composition variations and to meet emission levels on a large
range of output.
Multi-Nozzle Quiet Combustors (MNQC) and single nozzle
diffusion combustors provide the capability to some gas turbines
to burn liquid fuels and gases with high CO2, CO or H2 content.
In the case of these systems, water and steam are often
injected into the combustor as a means of reducing/controlling
emissions levels. However, it should also be noted that water or
steam injection can also be used as a means of gas turbine
power augmentation.
Table 3 illustrates a classification of the main alternative fuels and
their “parent” primary energy sector: oil, gas, coal, residual and
renewable, accessible to gas turbines
Gas Turbine Exhaust Heat RecoveryThe economics of gas turbines in process applications usually
depend on effective use of the exhaust energy, which generally
represents 60% to 70% of the inlet fuel energy. The increase in
overall system efficiency as the exhaust temperature is decreased
through use of effective heat recovery is illustrated in Figure 17.
The most common use of this energy is for steam generation in
HRSGs, with unfired as well as fired designs. However, the gas
turbine exhaust gases can also be used as a source of direct
energy, for unfired and fired process fluid process fluid heaters,
as well as preheated combustion air for power boilers.
Heat Recovery Steam GeneratorsThe overall FCP in a gas-turbine HRSG system is a function of the
amount of energy recovered from the turbine exhaust gas. The
greater the amount of energy recovered, the lower the HRSG stack
temperature, and the better the FCP. Thus, gas-turbine HRSG cycles
should use the lowest practical feedwater temperature to the
economizing section of the HRSG, within the constraints imposed
due to gas-side corrosion considerations. The typical feedwater
temperature is 230°F (110°C) if corrosion is not a problem. With an
integral de-aerating section or de-aerating condenser, the inlet
water temperatures can be much lower. For applications using
sulfur-bearing fuels, a feedwater temperature of about 270–290°F
(132–143°C) should be used to ensure metal temperatures remain
above the condensation temperature of the sulfurous products of
combustion. These feedwater temperatures are in contrast to
steam turbine cycles, which provide increased cogenerated power
as more regenerative feedwater heating (higher feedwater
temperature to the boiler) is incorporated into the cycle.
HRSG units are available in unfired, supplementary-fired, and fully
fired designs. The appropriate selection is established through
economic evaluations of various potential configurations for the
application.
Unfired HRSG. An unfired unit is the simplest HRSG configuration.
For industrial type applications, steam conditions characteristically
range from 150 psig (10.3 bar) saturated to approximately 1450
psig/950°F (100 bar/510°C). The steam temperature is typically set
somewhere around 50°F (28°C) or more below the turbine exhaust
gas temperature. Thus for applications leveraging F-class
technology gas turbines, exhaust conditions will permit
superheated steam temperatures of 1000°F–1050°F/538°C–566°C
and for large F-class gas turbine units, reheat steam cycles will be
permitted where project economics warrant this approach.
Generally speaking, unfired units can be economically designed to
Figure 17. Thermal efficiency vs. stack temperature
MS6001BNatural Gas Fired
SimpleCycle
100
80
60
40
20
0 0 200 400 600 800 1000
-18 93 204 316 427 538
°F
°C
ThermalEfficiency
%
StackTemp.
IncreasedExhaust Energy
Recovery

Origin Process Fuel NameLiquid/Gas
(L/G)Characteristics
RangeAshless (AL)/
Ash Forming (AF)Parent
Primary Energy
Oil extraction Crude oil L Light to heavy AL
Oil
Oil distillation LPG: propane, butane L/G Variable C3/C4
Naphtha, kerosene, L AL
Gas oils L Light to heavy AL
Heavy oils L Atm. & vac. Resides AF
Catalytic cracking Light cycle oil L Highly aromatic AL
NG extraction Natural gas G - Rich to weak AL
Natural Gas (NG)
- Soft to sour
NG extr. /treatment Gas condensates L Light to heavy AL to AF
NG reforming NGL G Variable CO2 content AL
H2 AL
Coal pyrolysis Coke oven gas G Medium BTU AF
Steel
Iron production Blast furnace gas (BFG) G Low BTU AF
Finex
Corex G Low BTU
G Medium BTU
Naphtha cracking Olefins G Variable olefin % AL
Petro ChemicalIndustry
Aromatics synthesis H2-rich gas G Variable H2 % AL
Butadiene unit, etc. C3/C4-rich gas G Variable C3/C4 ratio AL
Fermentation Biogas: CH4-N2-CO2 G Medium to low BTU AL (purified))
ResidualsMedium to low BTU AL (purified)
Gasification Syngas G
Coal extraction Coalbed gas G Low BTU gas AL
Coal & Lignite
Coal liquefaction Synfuels L Highly aromatic AL
Methanol L Medium BTU liquid AL
Coal gasification Syngas (CO/H2) G Medium to Low BTU AL (purified)
SNG G
Vegetable processing Biofuels from farming L # 2 DO substitute AL Renewables
GE Energy | GER-3430G (05/09) 23
Table 3. Fuel Sources/Origins

24
recover approximately 95% of the energy in the turbine exhaust
gas that is available for steam generation. Higher performance
levels are possible; however, the increased cost of the heat transfer
surface and possible larger gas side pressure drop must be
evaluated vs. the additional energy recovered to establish whether
the higher costs are warranted.
When unfired units are designed with higher steam conditions for a
combined cycle, multiple-pressure units are usually applied to
increase exhaust heat recovery and enhance system performance.
The intermediate level may be that required for steam injection for
NOx control and/or a process level. In applications using natural
gas, a third pressure level will further enhance overall system
performance. Typical design practice is that unfired HRSGs are
convective heat exchangers that respond to the exhaust
conditions of the gas turbine. Thus, the performance of unfired
HRSG units are driven by the gas turbine operating mode and
cannot easily provide steam flow control.
Supplementary-Fired HRSG. Since gas turbines generally consume
very little of the available oxygen within the gas turbine air flow,
the oxygen content of the gas turbine exhaust generally permits
supplementary fuel firing ahead of the HRSG to increase steam
production rates relative to an unfired unit. A supplementary-fired
unit is defined as a HRSG fired to an average temperature not
exceeding about 1800°F/982°C.
Since the turbine exhaust gas is essentially preheated combustion
air, the supplementary-fired HRSG fuel consumption is less than
that required for a power boiler providing the same incremental
increase in steam generation. Characteristically, the incremental
steam production from supplementary firing above that of an
unfired HRSG will be achieved at 100% efficiency, based on the
lower heat value of the fuel fired. The amount of incremental fuel
will be about 10% to 20% less than for a natural-gas-fired power
boiler providing the same incremental increase in steam produced.
As previously stated, the unfired HRSG with higher steam
conditions is often designed with multiple pressure levels to
recover as much energy as possible from the gas turbine exhaust.
This adds cost to the unfired HRSG, but the economics are often
enhanced for the cycle. In the case of the supplementary-fired
HRSG, if the HRSG is to be fired during most of its operating hours
to the 1400°F to 1800°F/760°C to 982°C range, then a suitably low
stack temperature can usually be achieved with a single pressure
level unit. This is the result of increased economizer duty as
compared to the unfired HRSG.
A supplementary-fired HRSG is basically a convective unit with a
design quite similar to an unfired HRSG. However the firing
capability provides the ability to control the HRSG steam
production—within the capability of the burner system—
independent of the normal gas turbine operating mode.
Fully-Fired HRSG. A few industrials have used the exhaust of the
gas turbine as preheated combustion air for a fully-fired HRSG. A
fully fired HRSG is defined as a unit having the same amount of
oxygen in its stack gases as an ambient-air-fired power boiler. The
HRSG is essentially a power boiler for which the gas turbine
exhaust serves as the source of preheated air supply.
Steam production from fully-fired HRSGs (10% excess air) may
range up to six or seven times the unfired HRSG steam production
rate. The actual increase is a function of the oxygen remaining for
combustion and the gas turbine exhaust temperature. Because of
the use of preheated combustion air, fuel requirements for fully-
fired units will usually range between 7.5% and 8% less than those
of an ambient-air-fired boiler providing the same incremental
steam generating capacity. With the more efficient gas turbines
(higher firing temperatures resulting in lower oxygen content in the
exhaust gases), the ability to ignite and maintain stable
combustion in the HRSG should be confirmed with the HRSG
manufacturer.
Even though fully-fired units can provide a significant amount of
steam, few applications of this type can be found in industry.
Evaluations show that the higher power-to-heat ratio available
using unfired or supplementary-fired HRSGs is usually
economically preferable over fully-fired HRSGs and lower amount
of power generated.
HRSG Steam Production RatesThe amount of steam that can be generated using the exhaust gas
from various GE gas turbine-generators frequently considered in
industrial cogeneration systems is given in Tables 3–5.
In addition, the FCP is shown for the combination of the
gas turbine and HRSG. This data is useful in performing
gas-turbine cogeneration feasibility studies to obtain a rough

estimation of the cycle’s overall FCP. To do this, simply take the
gas turbine kilowatts generated and the tabulated FCP from
Table 4 through Table 6. Then, add the non-condensing
steam turbine kilowatts generated at the previously
mentioned 4000–4500 Btu/kWh / 4219– 4747 kJ/kWh
and the condensing steam turbine kilowatts generated
(if there is a condenser in the cycle being considered) at
12,000–14,000 Btu/kWh /12,658–14,767 kJ/kWh. The weighted
average of the FCP for the amount of power produced in the
above three modes (gas turbine, non-condensing steam turbine,
and condensing steam turbine) will be a close estimate of the
overall FCP for the system being considered.
Cycle ConfigurationsThe most simple gas turbine cogeneration cycle is one where the
exhaust energy is used to generate steam at conditions suitable
for the process steam header. (See Figure 18.)
The generation of steam at higher initial steam conditions than
those required in process will allow the use of a steam turbine in
addition to the gas turbine in the cogeneration cycle. (See Figure
19.) This configuration derives the benefits of both gas and steam
turbine cogeneration and yields a higher power-to-heat ratio than
the arrangement given in Figure 18.
A multi-pressure HRSG system is illustrated in Figure 19. This
arrangement is common for unfired and moderately fired
(~1200°F/654°C) HRSG systems. The multi-pressure HRSG provides
increased recovery of the gas turbine exhaust energy, and thus
contributes to the favorable FCP associated with these cycles. For
example, an unfired multi-pressure HRSG used in conjunction with
an MS7001EA combined cycle supplying steam to process at 150
psig (10.3 bars) will yield about 5150 Btu/kWh HHV (5430 kJ/kWh
HHV) FCP—whereas a single-pressure, unfired HRSG used in a
combined cycle, with the same gas turbine, would have a FCP of
6030 Btu/kWh HHV / 6360 kJ/kWh HHV.
The steam turbine design schematic in Figure 19 provides
considerable cycle flexibility in cogeneration applications. The
condenser provides a heat sink for HRSG steam generating
capability in excess of that extracted from the turbine for process
use. Furthermore, the admission capability will permit the
introduction of lower-pressure steam into the turbine for expansion
to the condenser during periods when excess HRSG steam at the
process pressure level is available.
Combined-Cycle Design FlexibilityOne method of displaying the many options available using a gas
turbine in a cogeneration application is illustrated in Figure 20. This
diagram has been developed for the GE MS6001FA gas turbine-
generator (75,000 kW ISO, natural-gas-fired). A summary of the
performance used to develop the envelope given in Figure 20 is
presented in Table 6.
Point A represents the MS6001FA gas turbine-generator exhausting
into an unfired low-pressure HRSG. Point C is a combined-cycle
configuration based on use of a two-pressure-level unfired HRSG.
The steam turbine in the C cycle is a non-condensing unit
expanding the HP HRSG steam to the 150 psig/10.3 bar process
steam header.
Points B and D in Figure 20 represent operation of the HRSG
with supplementary firing to a 1600°F/871°C average
exhaust-gas-temperature entering the heat transfer surface.
GE Energy | GER-3430G (05/09) 25
Figure 18. Gas turbine with LP HRSG
Fuel
kW or HP
HRSG
ProcessSteam
Air
Figure 19. Typical industrial gas turbine cycle
HRSGFuel
ProcessSteam
Air

26
Generator Drives - Natural Gas Fuel - Dry Performance - English UnitsGas Turbine Type MS5001(PA) MS6001(B) MS6001(C) MS6001(FA)Gas Turbine Model PG5371(PA) PG6581(B) PG6591(FA) PG6111(FA)ISO Base Rating (KW) 26,060 41,600 45,250 77,060
Performance at 59 F,Sea Level, Natural Gas Fuel
50 / 60 Hz 50 / 60 Hz 50 / 60 Hz 50 / 60 Hz
Output - kWUnfired, 1 PL 25,690 41,250 44,990 76,660
Unfired, 2 PL 25,590 41,160 44,860 76,490
Supp Fired 25,490 41,070 44,720 76,310
Fully Fired 25,190 40,780 44,410 75,770
Power Turbine Speed - rpm 5,100 5,163 5,250 5,231
Fuel - MBtu/h (HHV) 348.9 445.3 469.1 822.2
Exhaust Flow - lb/h 985,000 1,168,000 973,000 1,679,000
Exhaust Temp - FUnfired, 1 PL 910 1018 1080 1112
Unfired, 2 PL 911 1022 1082 1113
Supp Fired 912 1023 1083 1114
Fully Fired 916 1024 1088 1118
HRSG Performance Fuel - MBtu/h (HHV)Supp Fired 225.9 228.4 277.7 280.5
Fully Fired 845.9 910.6 1182.4 1188.2Steam Conditions (Psig / F)
HRSG Steam
1000 lb/h
FCPGT
Btu/kWh
HRSGSteam
1000 lb/h
FCPGT
Btu/kWh
HRSGSteam
1000 lb/h
FCPGT
Btu/kWh
HRSGSteam
1000 lb/h
FCPGT
Btu/kWhUnfired
150 / 365 1 PL 155 5810 224.7 3790 347 530 363 4630
400 / 650 1 PL 124 6560 185.4 4260 296 890 314.1 4770
600 / 750 1 PL 113 6940 172.3 4500 278 1140 295.3 4920
850 / 825 1 PL 104 7320 162.2 4720 264 1390 281.5 5050
850 / 825 2 PL 104 6060 162.5 4020 265 700 281.9 4650
150 / 365 25.7 - 22.44 - 23.0 - 24.1 -
1250 / 900 2 PL - - 152 4040 252 720 268.5 4810
150 / 365 - - 30.79 - 31.6 - 24.05 -
1450 / 950 2 PL - - 145.8 4040 244 720 259.6 4820
150 / 365 - - 35.03 - 36.2 - 28.9 -
Supp Fired150 / 365 349 4930 415 3410 347 6700 598.3 4360
400 / 650 310 4870 367.9 3400 307.5 6690 530.2 4350
600 / 750 299 4870 355.1 3390 296.9 6680 511.9 4340
850 / 825 292 4860 346.9 3380 290 6670 500.1 4330
1250 / 900 286 4850 340 3360 284.3 6660 490.3 4320
1450 / 950 282 4800 334.5 3350 279.7 6650 482.2 4320
Fully Fired400 / 650 763 3440 866.5 2410 1173 -1050 1194.4 3640
600 / 750 737 3380 836.7 2380 1133 -1100 1153.4 3610
850 / 825 720 3340 817.4 2350 1107 -1140 1126.9 3590
1250 / 900 705 3330 801.3 2310 1085 -1190 1104.9 3550
1450 / 950 694 3270 788.2 2290 1067 -1200 1087 3540
• Gas turbines and boilers fueled with natural gas and all fuel data based on higher heatingvalue (HHV)
• Gas Turbines equipped with DLN combustors• Fuel chargeable to gas turbine power assumes GT credit with PH auxiliaries and equivalent
boiler fuel required to generate steam in an 84% efficient boiler (HHV)
• Standard inlet losses; exhaust losses 10 “H2O for unfired 1PL, 12” H2O for unfired 2 PL, 14”H2O for supplementary fired, 20” H2O for fully fired
• Assumes 0% exhaust bypass stack damper leakage, 0% blowdown, and 150 F condensatereturn for all cases
Table 4a. Steam generation and fuel chargeable to power with gas turbine and heat recovery boilers – Heavy Duty (MS series) – English units
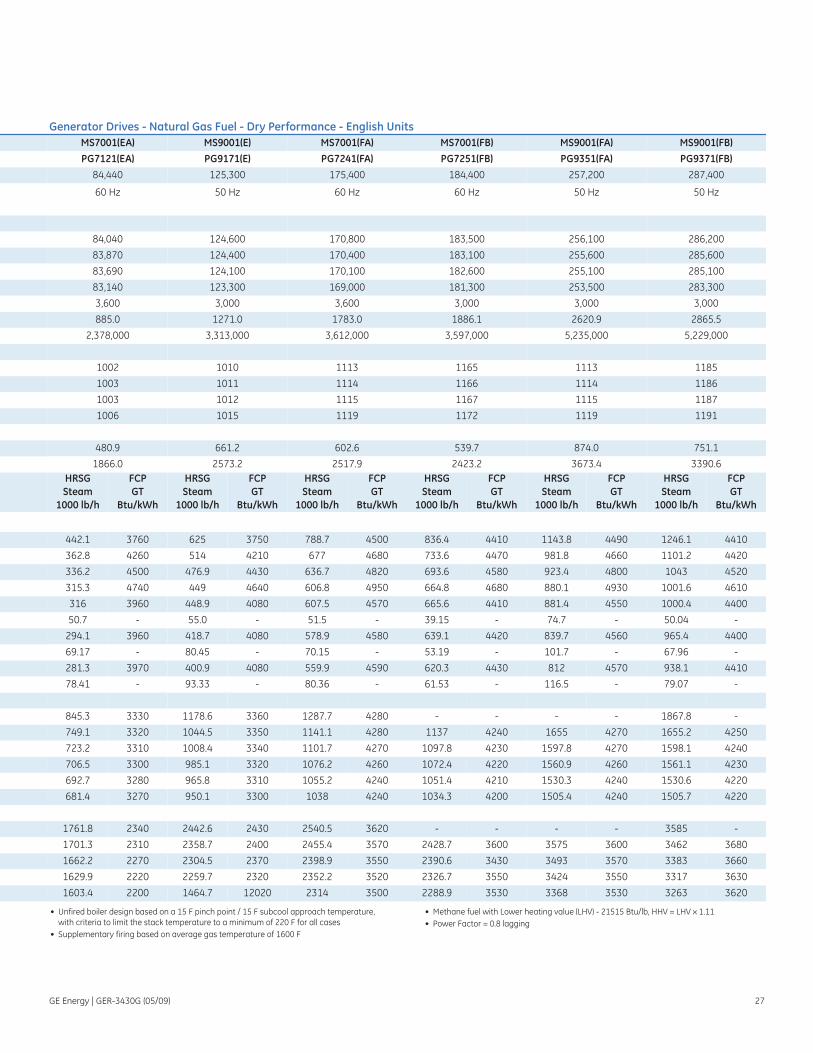
GE Energy | GER-3430G (05/09) 27
Generator Drives - Natural Gas Fuel - Dry Performance - English UnitsMS7001(EA) MS9001(E) MS7001(FA) MS7001(FB) MS9001(FA) MS9001(FB)PG7121(EA) PG9171(E) PG7241(FA) PG7251(FB) PG9351(FA) PG9371(FB)
84,440 125,300 175,400 184,400 257,200 287,400
60 Hz 50 Hz 60 Hz 60 Hz 50 Hz 50 Hz
84,040 124,600 170,800 183,500 256,100 286,200
83,870 124,400 170,400 183,100 255,600 285,600
83,690 124,100 170,100 182,600 255,100 285,100
83,140 123,300 169,000 181,300 253,500 283,300
3,600 3,000 3,600 3,000 3,000 3,000
885.0 1271.0 1783.0 1886.1 2620.9 2865.5
2,378,000 3,313,000 3,612,000 3,597,000 5,235,000 5,229,000
1002 1010 1113 1165 1113 1185
1003 1011 1114 1166 1114 1186
1003 1012 1115 1167 1115 1187
1006 1015 1119 1172 1119 1191
480.9 661.2 602.6 539.7 874.0 751.1
1866.0 2573.2 2517.9 2423.2 3673.4 3390.6HRSGSteam
1000 lb/h
FCPGT
Btu/kWh
HRSGSteam
1000 lb/h
FCPGT
Btu/kWh
HRSGSteam
1000 lb/h
FCPGT
Btu/kWh
HRSGSteam
1000 lb/h
FCPGT
Btu/kWh
HRSGSteam
1000 lb/h
FCPGT
Btu/kWh
HRSGSteam
1000 lb/h
FCPGT
Btu/kWh
442.1 3760 625 3750 788.7 4500 836.4 4410 1143.8 4490 1246.1 4410
362.8 4260 514 4210 677 4680 733.6 4470 981.8 4660 1101.2 4420
336.2 4500 476.9 4430 636.7 4820 693.6 4580 923.4 4800 1043 4520
315.3 4740 449 4640 606.8 4950 664.8 4680 880.1 4930 1001.6 4610
316 3960 448.9 4080 607.5 4570 665.6 4410 881.4 4550 1000.4 4400
50.7 - 55.0 - 51.5 - 39.15 - 74.7 - 50.04 -
294.1 3960 418.7 4080 578.9 4580 639.1 4420 839.7 4560 965.4 4400
69.17 - 80.45 - 70.15 - 53.19 - 101.7 - 67.96 -
281.3 3970 400.9 4080 559.9 4590 620.3 4430 812 4570 938.1 4410
78.41 - 93.33 - 80.36 - 61.53 - 116.5 - 79.07 -
845.3 3330 1178.6 3360 1287.7 4280 - - - - 1867.8 -
749.1 3320 1044.5 3350 1141.1 4280 1137 4240 1655 4270 1655.2 4250
723.2 3310 1008.4 3340 1101.7 4270 1097.8 4230 1597.8 4270 1598.1 4240
706.5 3300 985.1 3320 1076.2 4260 1072.4 4220 1560.9 4260 1561.1 4230
692.7 3280 965.8 3310 1055.2 4240 1051.4 4210 1530.3 4240 1530.6 4220
681.4 3270 950.1 3300 1038 4240 1034.3 4200 1505.4 4240 1505.7 4220
1761.8 2340 2442.6 2430 2540.5 3620 - - - - 3585 -
1701.3 2310 2358.7 2400 2455.4 3570 2428.7 3600 3575 3600 3462 3680
1662.2 2270 2304.5 2370 2398.9 3550 2390.6 3430 3493 3570 3383 3660
1629.9 2220 2259.7 2320 2352.2 3520 2326.7 3550 3424 3550 3317 3630
1603.4 2200 1464.7 12020 2314 3500 2288.9 3530 3368 3530 3263 3620
• Unfired boiler design based on a 15 F pinch point / 15 F subcool approach temperature,with criteria to limit the stack temperature to a minimum of 220 F for all cases
• Supplementary firing based on average gas temperature of 1600 F
• Methane fuel with Lower heating value (LHV) - 21515 Btu/lb, HHV = LHV x 1.11• Power Factor = 0.8 lagging

28
Generator Drive - Natural Gas Fuel - Dry Performance - SI UnitsGas Turbine Type MS5001(PA) MS6001(B) MS6001(C) MS6001(FA)Gas Turbine Model PG5371(PA) PG6581(B) PG6591(FA) PG6111(FA)ISO Base Rating (kW) 26060 41600 45250 77060
Performance at 15 C,Sea Level, Natural Gas Fuel
50 / 60 Hz 50 / 60 Hz 50 / 60 Hz 50 / 60 Hz
Output - kW Unfired, 1 PL 25690 41250 44990 76660
Unfired, 2 PL 25590 41160 44860 76490
Supp Fired 25490 41070 44720 76310
Fully Fired 25190 40780 44410 75770
Power Turbine Speed - rpm 5100 5163 5250 5231
Fuel - MKJ/h (HHV) 368.1 469.8 494.9 867.4
Exhaust Flow - Tons/h 447 530 441 761
Exhaust Temp - CUnfired, 1 PL 488 548 582 600
Unfired, 2 PL 488 550 583 601
Supp Fired 489 551 584 601
Fully Fired 491 551 587 603
HRSG Performance Fuel - MKJ/h (HHV)Supp Fired 238.3 241.0 293.0 296.0
Fully Fired 892.4 960.6 1247.4 1253.5Steam Conditions(bara/C)
HRSGSteam Tons/h
FCPGT
KJ/kWh
HRSGSteam Tons/h
FCPGT
KJ/kWh
HRSGSteam Tons/h
FCPGT
KJ/kWh
HRSGSteam Tons/h
FCPGT
KJ/kWhUnfired
11.4 / 185 1 PL 70.3 6130 101.9 4000 157.4 560 164.6 4880
28.6 / 343 1 PL 56.2 6920 84.1 4490 134.2 940 142.4 5030
42.4 / 399 1 PL 51.2 7320 78.1 4750 126.1 1200 133.9 5190
59.7 / 441 1 PL 47.2 7720 73.6 4980 119.7 1470 127.7 5330
59.7 / 441 2 PL 47.2 6390 73.7 4240 120.2 740 127.8 4910
11.4 / 185 11.7 - 10.2 - 10.4 - 10.9 -
87.2 / 482 2 PL - - 68.9 4260 114.3 740 121.8 4910
11.4 / 185 - - 14.0 - 14.3 - 10.9 -
101 / 510 2 PL - - 66.1 4260 110.7 760 117.7 5070
11.4 / 185 - - 14.0 - 16.4 - 13.1 -
Supp Fired11.4 / 185 158.3 5200 188.2 3600 157.4 7070 271.3 4600
28.6 / 343 140.6 5140 166.8 3590 139.5 7060 240.5 4590
42.4 / 399 135.6 5140 161.0 3580 134.6 7050 232.2 4580
59.7 / 441 132.4 5130 157.3 3570 131.5 7040 226.8 4570
87.2 / 482 129.7 5120 154.2 3540 128.9 7030 222.4 4560
101 / 510 127.9 5060 151.7 3530 126.8 7020 218.7 4560
Fully Fired28.6 / 343 346.0 3630 393.0 2540 532.0 -1110 541.7 3840
42.4 / 399 334.2 3570 379.5 2510 513.8 -1160 523.1 3810
59.7 / 441 326.5 3520 370.7 2480 502.0 -1200 511.1 3790
87.2 / 482 319.7 3510 363.4 2440 492.1 -1260 501.1 3750
101 / 510 314.7 3450 357.5 2420 483.9 -1270 493.0 3730
• Gas turbines and boilers fueled with natural gas and all fuel data based on higher heatingvalue (HHV)
• Gas turbines equipped with DLN combustors
• Fuel chargeable to gas turbine power assumes GT credit with PH auxiliaries and equivalentboiler fuel required to generate steam in an 84% efficient boiler (HHV)
• Standard inlet losses; exhaust losses 254 mm H2O for unfired 1PL, 305 mm H2O for unfired 2PL, 356 mm H2O for supplementary fired, 508 mm H2O for fully fired
Table 4b. Steam generation and fuel chargeable to power with gas turbine and heat recovery boilers – Heavy Duty (MS series) – SI units

GE Energy | GER-3430G (05/09) 29
Generator Drive - Natural Gas Fuel - Dry Performance - SI UnitsMS7001(EA) MS9001(E) MS7001(FA) MS7001(FB) MS9001(FA) MS9001(FB)PG7121(EA) PG9171(E) PG7241(FA) PG7251(FB) PG9351(FA) PG9371(FB)
84440 125300 175400 184400 257200 287400
60 Hz 50 Hz 60 Hz 60 Hz 50 Hz 50 Hz
84040 124600 170800 183500 256100 286200
83870 124400 170400 183100 255600 285600
83690 124100 170100 182600 255100 285100
83140 123300 169000 181300 253500 283300
3600 3000 3600 3000 3000 3000
933.7 1340.9 1881.1 1989.8 2765.1 3023.1
1,078 1,502 1,638 1,631 2,374 2,371
539 543 601 629 601 641
539 544 601 630 601 641
539 544 602 631 602 642
541 546 604 633 604 644
507.4 697.5 635.7 569.4 922.1 792.5
1968.6 2714.8 2656.4 2556.5 3875.5 3577.1 HRSGSteam Tons/h
FCPGT
KJ/kWh
HRSGSteam Tons/h
FCPGT
KJ/kWh
HRSGSteam Tons/h
FCPGT
KJ/kWh
HRSGSteam Tons/h
FCPGT
KJ/kWh
HRSGSteam Tons/h
FCPGT
KJ/kWh
HRSGSteam Tons/h
FCPGT
KJ/kWh
200.5 3970 283.4 3960 357.7 4750 379.3 4650 518.7 4740 565.1 4650
164.5 4490 233.1 4440 307.0 4940 332.7 4720 445.3 4920 499.4 4660
152.5 4750 216.3 4670 288.8 5090 314.6 4830 418.8 5060 473.0 4770
143.0 5000 203.6 4900 275.2 5220 301.5 4940 399.1 5200 454.2 4860
143.3 4180 203.6 4300 275.5 4820 301.9 4650 399.7 4800 453.7 4640
23.0 - 24.9 - 23.4 - 17.8 - 33.9 - 22.7 -
133.4 4180 189.9 4300 262.5 4820 289.8 4650 380.8 4800 437.8 4640
31.4 - 36.5 - 31.8 - 24.1 - 46.1 - 30.8 -
127.6 4180 181.8 4300 253.9 4830 281.3 4660 368.3 4810 425.4 4640
35.6 - 42.3 - 36.4 - 27.9 - 52.8 - 35.9 -
383.4 3510 534.5 3540 584.0 4520 - - - - - -
339.7 3500 473.7 3530 517.5 4520 515.6 4470 750.6 4500 750.7 4480
328.0 3490 457.3 3520 499.6 4500 497.9 4460 724.6 4500 724.8 4470
320.4 3480 446.8 3500 488.1 4490 486.3 4450 707.9 4490 708.0 4460
314.1 3460 438.0 3490 478.5 4470 476.8 4440 694.0 4470 694.1 4450
309.0 3450 430.9 3480 470.7 4470 469.1 4430 682.7 4470 682.9 4450
799.0 2470 1107.8 2560 1152.2 3820 - - - - - -
771.6 2440 1069.7 2530 1113.6 3770 1101.5 3800 1621.3 3800 1570.1 3880
753.8 2390 1045.1 2500 1087.9 3750 1084.2 3620 1584.1 3770 1534.2 3860
739.2 2340 1024.8 2450 1066.8 3710 1055.2 3750 1552.8 3750 1504.3 3830
727.2 2320 664.3 12680 1049.4 3690 1038.0 3720 1527.4 3720 1479.8 3820
• Assumes 0% exhaust bypass stack damper leakage, 0% blowdown, and 65.6 C condensatereturn for all cases
• Unfired boiler design based on a 8.3 C pinch point / 8.3 C subcool approach temperature,with criteria to limit the stack temperature to a minimum of 104.4 C for all cases
• Supplementary firing based on average gas temperature of 871 C• Methane fuel with Lower heating value (LHV) - 50031 kJ/kg, HHV = LHV x 1.11• Power Factor = 0.8 lagging
30
Generator Drives - Natural Gas Fuel - Dry Performance - English UnitsGas Turbine Type LM2500 PJ LM2500+ PR LM6000 PF LM6000 PF SPRINT LMS100 PAGas Turbine Model PGLM2500 (PJ) PGLM2500 (+) PGLM6000 (PF) PGLM6000 (PF SPRINT) PGLMS100 (PA)ISO Base Rating (kW) 22,719 33,165 43,068 48,092 103,045
Performance at 59 F, Sea Level, Natural Gas Fuel
60 Hz 60 Hz 60 Hz 60 Hz 60 Hz
Output - kWUnfired, 1 PL 22,032 32,106 41,763 46,915 102,680
Unfired, 2 PL 21,974 32,019 41,655 46,814 102,507
Supp Fired 21,915 31,927 41,547 46,714 102,335
Fully Fired 21,736 31,658 41,225 46,410 101,823
Power Turbine Speed - rpm 3,600 3,600 3,600 3,600 3,600
Fuel - MBtu/h (HHV) 240.0 323.5 391.6 439.8 929.5
Exhaust Flow - lb/h 536,500 713,300 975,700 1,034,700 1,685,400
Exhaust Temp - FUnfired 1 PL 996.4 988.0 861.0 855.4 777.8
Unfired 2 PL 997.7 989.5 862.3 856.6 779.1
Supp Fired 999.0 990.9 863.7 857.9 780.4
Fully Fired 1003.0 995.2 867.5 861.5 784.2
HRSG Performance Fuel - MBtu/h (HHV)Supp Fired 110.0 148.2 241.7 261.1 478.1
Fully Fired 408.0 537.3 789.1 798.2 1049.9 Steam Conditions (Psig / F)
HRSG Steam
1000 lb/h
FCPGT
Btu/kWh
HRSG Steam
1000 lb/h
FCPGT
Btu/kWh
HRSG Steam
1000 lb/h
FCPGT
Btu/kWh
HRSG Steam
1000 lb/h
FCPGT
Btu/kWh
HRSG Steam
1000 lb/h
FCPGT
Btu/kWhUnfired
150 / 365 1 PL 98.69 5130 129.4 4890 137.5 5140 145.5 5380 200.5 6540
400 / 650 1 PL 80.76 5560 105.6 5290 107.1 5650 113 5870 148.5 6950
600 / 750 1 PL 74.72 5780 97.59 5490 96.01 5910 101.1 6120
850 / 825 1 PL 69.96 5990 91.22 5690
1250 / 900 1 PL 64.93 5670 84.45 5390
850 / 825 2 PL 70.43 5180 91.89 4940 87.82 5170
150 / 365 11.68 - 15.9 - 29.3 -
1250 / 900 2 PL 65.45 5290 85.2 5030
150 / 365 15.96 - 21.7 -
1450 / 950 2 PL 62..55 9860 81.31 5110
150 / 365 18.09 - 24.61 -
Supp Fired150 / 365 191.3 4740 254.5 4520 348.4 4450 373.5 4710 623.8 5900
400 / 650 169.7 4720 225.7 4500 309 4440 331.2 4700 553.2 5890
600 / 750 163.9 4700 218 4490 298.4 4420 320 4680 534.3 5880
850 / 825 160.2 4680 213.1 4470 291.7 4410 312.7 4670 522.3 5870
1250 / 900 157.2 4660 209.1 4450 286.3 4380 306.9 4640 512.5 5850
1450 / 950 154.7 4650 205.8 4430 281.7 4370 302 4630 504.4 5840
1800 / 1000 152.9 4780 203.4 4550 278.4 4500 298.4 4760 498.4 5930
Fully Fired400 / 650 387.7 3900 510.5 3770 709.4 3650 724.2 4010 972.2 5550
600 / 750 374.6 3860 493.2 3730 685.3 3610 699.7 3970 939.2 5530
850 / 825 366.2 3820 482.1 3700 670 3570 684 3930 918.1 5510
1250 / 900 359.4 3750 473.1 3640 657.5 3510 671.2 3880 901 5480
1450 / 950 353.7 3720 465.7 3610 647.1 3480 660.6 3850 886.7 5460
• Gas turbines and boilers fueled with natural gas and all fuel data based on higher heatingvalue (HHV)
• Gas Turbines equipped with DLN combustors
• Fuel chargeable to gas turbine power assumes GT credit with PH auxiliaries and equivalentboiler fuel required to generate steam in an 84% efficient boiler (HHV)
• Standard inlet losses; exhaust losses 10 “H2O for unfired 1PL, 12” H2O for unfired 2 PL, 14”H2O for supplementary fired, 20” H2O for fully fired
Table 5a. Steam generation and fuel chargeable to power with gas turbine and heat recovery boilers – LM series – English units
GE Energy | GER-3430G (05/09) 31
Generator Drives - Natural Gas Fuel - Dry Performance - English UnitsLMS100 PB LM2500 PJ LM2500+ PR LM6000 PF LM6000 PF SPRINT LMS100 PA LMS100 PB
PGLMS100 (PB) PGLM2500 (PJ) PGLM2500 (+) PGLM6000 (PF) PGLM6000 (PF SPRINT) PGLMS100 (PA) PGLMS100 (PB)99,012 21,818 32,881 42,732 48,040 102,995 99,044
60 Hz 50 Hz 50 Hz 50 Hz 50 Hz 50 Hz 50 Hz
95,752 21,145 31,831 41,685 46,932 102,600 95,868
95,581 21,086 31,744 41,586 46,831 102,439 95,708
95,410 21,028 31,653 41,489 46,729 102,276 95,548
94,903 20,852 31,386 41,195 46,427 101,792 95,069
3,600 3,000 3,600 3,627 3,627 3,000 3,000
840.6 238.1 323.5 392.6 441.9 929.6 840.5
1,615,932 538,700 713,300 986,700 1,045,100 1,685,400 1,615,824
792.1 1004.7 988.0 854.3 850.8 779.8 792.8
793.5 1006.0 989.5 855.7 852.1 781.0 794.0
794.8 1007.4 990.9 857.0 853.3 782.2 795.3
798.8 1011.3 995.2 861.3 857.0 785.8 799.0
441.3 108.9 148.2 246.5 265.2 477.1 441.0
1105.6 412.6 537.3 801.5 808.6 1050.0 1105.7 HRSG Steam
1000 lb/h
FCPGT
Btu/kWh
HRSG Steam
1000 lb/h
FCPGT
Btu/kWh
HRSG Steam
1000 lb/h
FCPGT
Btu/kWh
HRSG Steam
1000 lb/h
FCPGT
Btu/kWh
HRSG Steam
1000 lb/h
FCPGT
Btu/kWh
HRSG Steam
1000 lb/h
FCPGT
Btu/kWh
HRSG Steam
1000 lb/h
FCPGT
Btu/kWh
195.6 6150 99.33 5210 128.6 4960 137 5190 145.4 5430 201.6 6530 196 6130
146.4 6550 82.38 5600 105.6 5340 106.3 5710 112.7 5920 149.5 6940 146.7 6540
127.7 6770 76.33 5820 97.59 5540 95.11 5980 100.7 6180 128 6750
71.57 6030 91.22 5740
66.58 5720 84.45 5440
72.04 5210 91.89 4980
11.4 - 15.89 -
67.09 5320 85.2 5080
15.64 - 21.7 -
64.19 5410 81.34 5150
17.73 - 24.61 -
585.6 5530 191.9 4760 254.5 4560 352.4 4470 377.2 4740 623.7 4890 585.5 4510
519.3 5520 170.2 4740 225.7 4540 312.5 4460 334.5 4730 553.1 5890 519.2 5510
501.6 5510 164.4 4720 218 4530 301.9 4440 323.1 4710 534.3 5870 501.6 5500
490.3 5500 160.7 4700 213.1 4510 295 4430 315.9 4690 522.2 5860 490.2 5490
481.1 5480 157.7 4680 209.1 4490 289.5 4400 310 4670 512.5 5840 481.1 5470
473.5 5470 155.2 4660 205.8 4470 284.9 4390 305 4660 504.3 5840 473.4 5460
467.9 5560 153.3 4810 203.4 4590 281.6 4520 301 4780 498.4 5930 467.8 5550
1005.9 5100 392.4 3870 510.5 3800 718.7 3650 732.2 4020 973 5040 1006.1 4530
971.7 5080 379.1 3830 493.2 3770 694.3 3610 707.3 3990 939.9 5530 971.9 5060
949.9 5050 370.6 3780 482.1 3730 678.7 3570 691.5 3950 918.8 5500 950.1 5040
932.2 5010 363.7 3720 473.1 3670 666.1 3510 678.6 3900 901.7 5470 932.4 5000
917.4 5000 357.9 3690 465.7 3640 655.6 3480 667.9 3870 887.4 5450 917.6 4980
• Assumes 0% exhaust bypass stack damper leakage, 0% blowdown, and 150 F condensatereturn for all cases
• Unfired boiler design based on a 15 F pinch point / 15 F subcool approach temperature,with criteria to limit the stack temperature to a minimum of 220 F for all cases
• Supplementary firing based on average gas temperature of 1600 F• Lower heating value (LHV) - 21515 Btu/lb, HHV = LHV x 1.11

32
Generator Drive - Natural Gas Fuel - Dry Performance - SI UnitsGas Turbine Type LM2500 PJ LM2500+ PR LM6000 PF LM6000 PF SPRINT LMS100 PAGas Turbine Model PGLM2500 (PJ) PGLM2500 (+) PGLM6000 (PF) PGLM6000 (PF SPRINT) PGLMS100 (PA)ISO Base Rating (kW) 26,060 41,610 45,250 45,250 77,650
Performance at 15 C, Sea Level, Natural Gas Fuel
60 Hz 60 Hz 60 Hz 60 Hz 60 Hz
Output - kWUnfired, 1 PL 22,032 32,106 41,763 46,915 102,680
Unfired, 2 PL 21,974 32,019 41,655 46,814 102,507
Supp Fired 21,915 31,927 41,547 46,714 102,335
Fully Fired 21,736 31,658 41,225 46,410 101,823
Power Turbine Speed - rpm 3,600 3,600 3,600 3,600 3,600
Fuel - MKJ/h (HHV) 396.0 533.8 646.2 725.6 1533.6
Exhaust Flow - Tons/h 243 323 442 469 764
Exhaust Temp - CUnfired, 1 PL 535.8 531.1 460.6 457.4 414.3
Unfired, 2 PL 536.5 531.9 461.3 458.1 415.1
Supp Fired 537.2 532.7 462.1 458.8 415.8
Fully Fired 539.4 535.1 464.2 460.8 417.9
HRSG Performance Fuel - MKJ/h (HHV)Supp Fired 116.0 156.3 255.0 275.5 504.3
Fully Fired 430.5 566.9 832.5 842.1 1107.6 Steam Conditions(bara / C)
HRSGSteamTons/h
FCPGT
KJ/kWh
HRSGSteamTons/h
FCPGT
KJ/kWh
HRSGSteamTons/h
FCPGT
KJ/kWh
HRSGSteamTons/h
FCPGT
KJ/kWh
HRSGSteamTons/h
FCPGT
KJ/kWhUnfired
11.4 / 185 1 PL 44.76 5410 58.68 5160 62.36 5420 65.99 5680 90.93 6900
28.6 / 343 1 PL 36.63 5870 47.89 5580 48.57 5960 51.25 6190 67.35 7330
42.4 / 399 1 PL 33.89 6100 44.26 5790 43.54 6240 45.85 6460
59.7 / 441 1 PL 31.73 6320 41.37 6000
87.2 / 482 29.45 5980 38.30 5690
59.7 / 441 2 PL 31.94 5460 41.67 5210
11.4 / 185 5.30 - 7.21 -
87.2 / 482 2 PL 29.68 5580 38.64 5310
11.4 / 185 7.24 - 9.85 -
101 / 510 2 PL
11.4 / 185
Supp Fired11.4 / 185 86.76 5000 115.42 4770 158.00 4690 169.39 4970 282.90 6220
28.6 / 343 76.96 4980 102.36 4750 140.14 4680 150.20 4960 250.88 6210
42.4 / 399 74.33 4960 98.87 4740 135.33 4660 145.12 4940 242.31 6200
59.7 / 441 72.65 4940 96.64 4720 132.29 4650 141.81 4930 236.87 6190
87.2 / 482 71.29 4920 94.83 4690 129.84 4620 139.18 4900 232.43 6170
101 / 510 70.16 4910 93.33 4670 127.76 4610 136.96 4880 228.75 6160
125 / 538 69.34 5040 92.24 4800 126.26 4750 135.33 5020 226.03 6260
Fully Fired28.6 / 343 175.83 4110 231.52 3980 321.72 3850 328.44 4230 440.91 5860
42.4 / 399 169.89 4070 223.67 3940 310.79 3810 317.32 4190 425.94 5830
59.7 / 441 166.08 4030 218.64 3900 303.85 3770 310.20 4150 416.37 5810
87.2 / 482 162.99 3960 214.56 3840 298.19 3700 304.40 4090 408.62 5780
101 / 510 160.41 3920 211.20 3810 293.47 3670 299.59 4060 402.13 5760
• Gas turbines and boilers fueled with natural gas and all fuel data based on higher heatingvalue (HHV)
• Gas turbines equipped with DLN combustors
• Fuel chargeable to gas turbine power assumes GT credit with PH auxiliaries and equivalentboiler fuel required to generate steam in an 84% efficient boiler (HHV)
• Standard inlet losses; exhaust losses 254 mm H2O for unfired 1PL, 305 mm H2O for unfired 2PL, 356 mm H2O for supplementary fired, 508 mm H2O for fully fired
Table 5b. Steam generation and fuel chargeable to power with gas turbine and heat recovery boilers – LM series – SI units
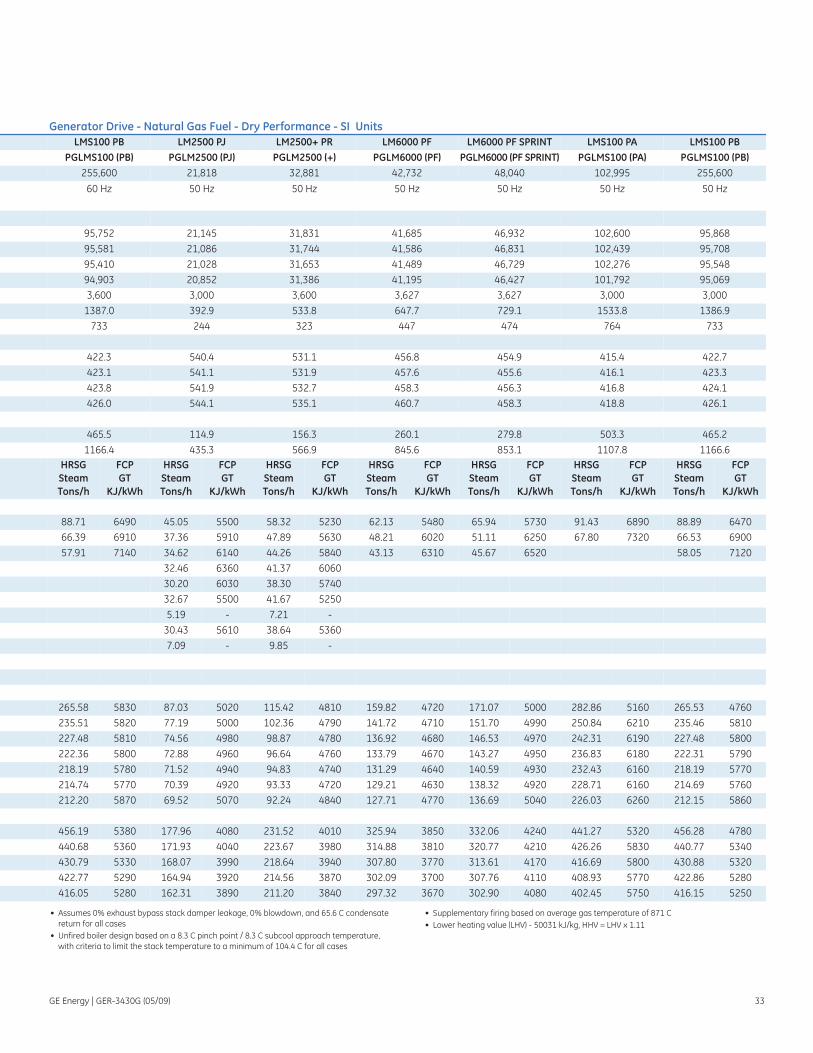
GE Energy | GER-3430G (05/09) 33
Generator Drive - Natural Gas Fuel - Dry Performance - SI UnitsLMS100 PB LM2500 PJ LM2500+ PR LM6000 PF LM6000 PF SPRINT LMS100 PA LMS100 PB
PGLMS100 (PB) PGLM2500 (PJ) PGLM2500 (+) PGLM6000 (PF) PGLM6000 (PF SPRINT) PGLMS100 (PA) PGLMS100 (PB)255,600 21,818 32,881 42,732 48,040 102,995 255,600
60 Hz 50 Hz 50 Hz 50 Hz 50 Hz 50 Hz 50 Hz
95,752 21,145 31,831 41,685 46,932 102,600 95,868
95,581 21,086 31,744 41,586 46,831 102,439 95,708
95,410 21,028 31,653 41,489 46,729 102,276 95,548
94,903 20,852 31,386 41,195 46,427 101,792 95,069
3,600 3,000 3,600 3,627 3,627 3,000 3,000
1387.0 392.9 533.8 647.7 729.1 1533.8 1386.9
733 244 323 447 474 764 733
422.3 540.4 531.1 456.8 454.9 415.4 422.7
423.1 541.1 531.9 457.6 455.6 416.1 423.3
423.8 541.9 532.7 458.3 456.3 416.8 424.1
426.0 544.1 535.1 460.7 458.3 418.8 426.1
465.5 114.9 156.3 260.1 279.8 503.3 465.2
1166.4 435.3 566.9 845.6 853.1 1107.8 1166.6 HRSGSteamTons/h
FCPGT
KJ/kWh
HRSGSteamTons/h
FCPGT
KJ/kWh
HRSGSteamTons/h
FCPGT
KJ/kWh
HRSGSteamTons/h
FCPGT
KJ/kWh
HRSGSteamTons/h
FCPGT
KJ/kWh
HRSGSteamTons/h
FCPGT
KJ/kWh
HRSGSteamTons/h
FCPGT
KJ/kWh
88.71 6490 45.05 5500 58.32 5230 62.13 5480 65.94 5730 91.43 6890 88.89 6470
66.39 6910 37.36 5910 47.89 5630 48.21 6020 51.11 6250 67.80 7320 66.53 6900
57.91 7140 34.62 6140 44.26 5840 43.13 6310 45.67 6520 58.05 7120
32.46 6360 41.37 6060
30.20 6030 38.30 5740
32.67 5500 41.67 5250
5.19 - 7.21 -
30.43 5610 38.64 5360
7.09 - 9.85 -
265.58 5830 87.03 5020 115.42 4810 159.82 4720 171.07 5000 282.86 5160 265.53 4760
235.51 5820 77.19 5000 102.36 4790 141.72 4710 151.70 4990 250.84 6210 235.46 5810
227.48 5810 74.56 4980 98.87 4780 136.92 4680 146.53 4970 242.31 6190 227.48 5800
222.36 5800 72.88 4960 96.64 4760 133.79 4670 143.27 4950 236.83 6180 222.31 5790
218.19 5780 71.52 4940 94.83 4740 131.29 4640 140.59 4930 232.43 6160 218.19 5770
214.74 5770 70.39 4920 93.33 4720 129.21 4630 138.32 4920 228.71 6160 214.69 5760
212.20 5870 69.52 5070 92.24 4840 127.71 4770 136.69 5040 226.03 6260 212.15 5860
456.19 5380 177.96 4080 231.52 4010 325.94 3850 332.06 4240 441.27 5320 456.28 4780
440.68 5360 171.93 4040 223.67 3980 314.88 3810 320.77 4210 426.26 5830 440.77 5340
430.79 5330 168.07 3990 218.64 3940 307.80 3770 313.61 4170 416.69 5800 430.88 5320
422.77 5290 164.94 3920 214.56 3870 302.09 3700 307.76 4110 408.93 5770 422.86 5280
416.05 5280 162.31 3890 211.20 3840 297.32 3670 302.90 4080 402.45 5750 416.15 5250
• Assumes 0% exhaust bypass stack damper leakage, 0% blowdown, and 65.6 C condensatereturn for all cases
• Unfired boiler design based on a 8.3 C pinch point / 8.3 C subcool approach temperature,with criteria to limit the stack temperature to a minimum of 104.4 C for all cases
• Supplementary firing based on average gas temperature of 871 C• Lower heating value (LHV) - 50031 kJ/kg, HHV = LHV x 1.11

34
The temperature used for the HRSG firing in Figure 20 has been
arbitrarily limited to 1600°F/871°C, even though higher firing
temperatures (and thus higher steam production rates) are
possible in the exhaust of this unit.
The envelope defined by A, B, C, D in Figure 20 represents the
most thermally optimized use of a gas turbine in a cogeneration
application (i.e., it provides the lowest FCP). Operation along
the line CE, DF or any intermediate point to the left of line CD
represents use of condensing steam turbine power generation with
the E and F points applicable for combined-cycle operation without
any heat supplied to process. Thus, the cycles along line EF are
combined cycles providing power alone.
Performance envelopes for many of the gas turbines included
in Tables 3–5 are presented in Figures 21–23. These data are
on the same basis as Figure 20, except for point C. Point C
for all units, except the various MS7001 models, is based on
Performance of MS6001FA Gas Turbine CyclesCycle A B C D E F
Net Output MW 75.5 74.9 88.6 100.5 110.8 138.9
NHP MBtu/hr 466 768 347 648 0 0
GJ/hr 491 810 366 684 0 0
FCP Btu/kWh, HHV 4716 4462 5364 4517 7418 7944
kJ/kWh, HHV 4975 4707 5659 4766 7826 8381
Basis:
1. Cycle definition as given in Figure 20.
2. Net output is the total power credited to the cogen cycle.
3. Net fuel includes credit for Net Heat to Process (NHP) at an 84% process boiler efficiency.
Table 6. Performance of MS6001FA gas turbine cycles
Figure 20. Performance envelope for MS6001FA gas turbine cogeneration system
150
135
120
105
90
75
600 200 400 600 800 MBtu/hr
0 211 422 633 844 MkJ/hr
Net HeatTo Process
Combined Cycle Design Flexibility
Net PlantOutput(MW)
BA
D
C
E
F 150 psig (11.4 bar)Process Steam
1) Gas turbine operating at its 59°F (15°C) capability, sea level site, natural gas fuel, DLNto for 25 ppmvd (1.45g/gc) Nox emission level
2) Cycle A – Unfired HRSG (LP process steam)
Cycle B – Supplementary fired (1600°F/871°C) HRSG, LP process steam
Cycle C – Combined cycle, unfired, two-pressure level HRSG, HP at 1250 psig, 900 F (87.2 bars, 482 C), LP at 150 psig saturated (11.4 bars saturated), noncondensing steam turbine-generator Cycle D – Combined cycle, supplementary fired HRSG, steam at 1250 psig, 900°F (87.2 bars, 482°C), noncondensing steam turbine generator
Cycle E – Same as Cycle C, but with admission condensing steam turbine-generator Cycle F – Same as Cycle D, but with condensing steam turbine-generator
3) Process returns and makeup enter the integral 44 psia (3 bars deaerating heater at a mixed temperature of 150°F (66°C)
Basis:
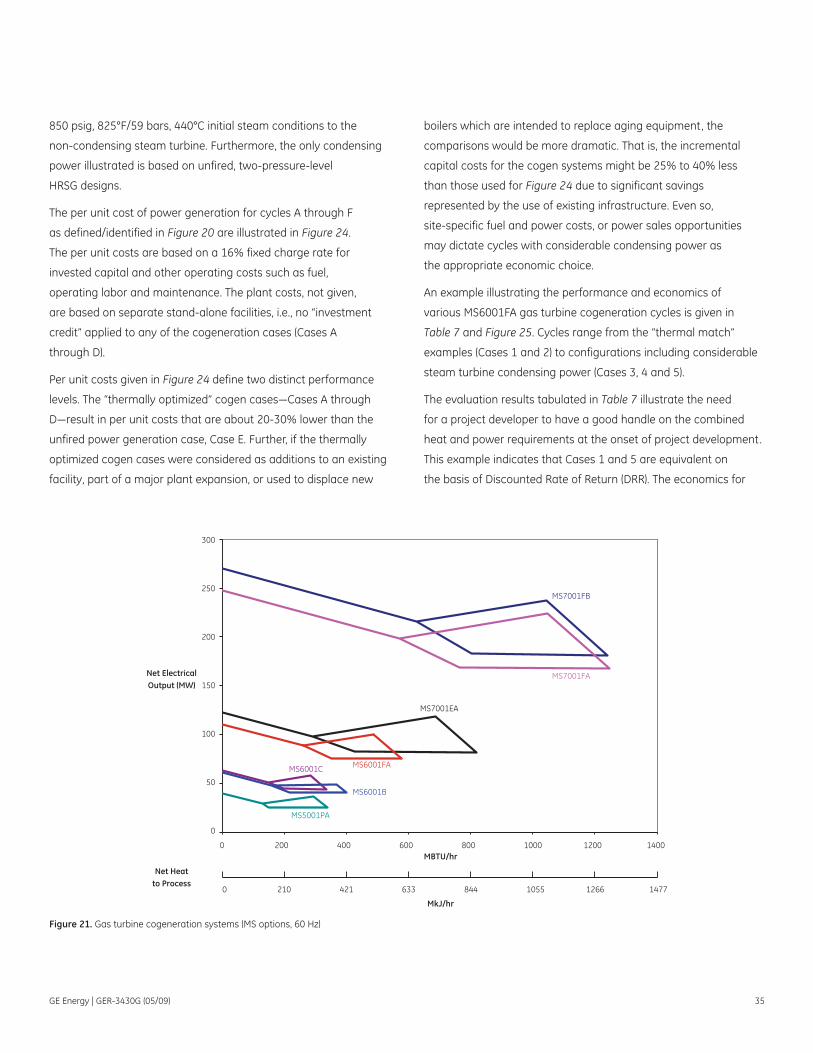
850 psig, 825°F/59 bars, 440°C initial steam conditions to the
non-condensing steam turbine. Furthermore, the only condensing
power illustrated is based on unfired, two-pressure-level
HRSG designs.
The per unit cost of power generation for cycles A through F
as defined/identified in Figure 20 are illustrated in Figure 24.
The per unit costs are based on a 16% fixed charge rate for
invested capital and other operating costs such as fuel,
operating labor and maintenance. The plant costs, not given,
are based on separate stand-alone facilities, i.e., no “investment
credit” applied to any of the cogeneration cases (Cases A
through D).
Per unit costs given in Figure 24 define two distinct performance
levels. The “thermally optimized” cogen cases—Cases A through
D—result in per unit costs that are about 20-30% lower than the
unfired power generation case, Case E. Further, if the thermally
optimized cogen cases were considered as additions to an existing
facility, part of a major plant expansion, or used to displace new
boilers which are intended to replace aging equipment, the
comparisons would be more dramatic. That is, the incremental
capital costs for the cogen systems might be 25% to 40% less
than those used for Figure 24 due to significant savings
represented by the use of existing infrastructure. Even so,
site-specific fuel and power costs, or power sales opportunities
may dictate cycles with considerable condensing power as
the appropriate economic choice.
An example illustrating the performance and economics of
various MS6001FA gas turbine cogeneration cycles is given in
Table 7 and Figure 25. Cycles range from the “thermal match”
examples (Cases 1 and 2) to configurations including considerable
steam turbine condensing power (Cases 3, 4 and 5).
The evaluation results tabulated in Table 7 illustrate the need
for a project developer to have a good handle on the combined
heat and power requirements at the onset of project development.
This example indicates that Cases 1 and 5 are equivalent on
the basis of Discounted Rate of Return (DRR). The economics for
GE Energy | GER-3430G (05/09) 35
Figure 21. Gas turbine cogeneration systems (MS options, 60 Hz)
0 200 400 600 800 1000 1200 1400
300
250
200
150
100
50
0
MS7001FB
MS7001FA
MS7001EA
MS6001FAMS6001C
MS6001B
MS5001PA
Net Heatto Process
Net ElectricalOutput (MW)
0 210 421 633 844 1055 1266 1477
MBTU/hr
MkJ/hr

36
Figure 22. Gas turbine cogeneration systems (LM options, 50/60 Hz)
60
50
40
30
20
10
0
Net PlantOutput (MW)
LM6000 PF
LM2500+G4
0 53 105 158 211 264 316 369 422
0 50 100 150 200 250 300 350 400
Net Heatto Process
MBTU/hr
MkJ/hr
Figure 23. Gas turbine cogeneration systems option (50 Hz)
0
50
100
150
200
250
300
350
400
450
0 200 400 600 800 1000 1200 1400 1600 1800 2000
0 211 422 633 844 1055 1266 1477 1688 1899 210
Net ElectricalOutput (MW)
Net Heatto Process
MBTU/hr
MkJ/hr
MS9001FB
MS9001FA
MS9001E
MS5001PA
MS6001B
MS6001CMS6001FA

Case 1 – 1GT + HRSG (a thermally matched case) is primarily driven
by FCP (has best cogeneration efficiency) while Case 5 benefits
from improved capital recovery (lower $/kW) and is driven
primarily by power sales. Figure 25 is a plot of Discounted
Rate of Return as a function of fuel price at two different
power sale price levels. It is included here to illustrate the
sensitivity of each of the five plant configuration cases as a
function of the aforementioned parameters—which in turn
highlight the need to evaluate the configurations over a range
of economic conditions vs. a single point. Figure 25 illustrates
that while Case 1 (1GT + HRSG) and Case 2 (1GT + NC ST)
(thermally matched cases) may not have the best DRR over
the range considered, they do have the shallowest slope—
which means they are the least sensitive to fuel and power
sale prices. Another way of looking at this is that these
cases have the best cogeneration efficiencies – lowest FCP.
Additional inspection of Figure 25 reveals that at the low end
of the fuel price range the economics are largely driven by
capital investment – $/kW. In other words the DRR case
Rank order (highest to lowest) of 5, 4, 1, 3, 2 is exactly the same
rank order (lowest to highest) of capital investment as identified
in Table 7. In the high fuel price regime, power plant economics
are largely driven by the combination of efficiency and power
sale margin.
Cogeneration OpportunitiesCircumstances under which cogeneration should be considered
include:
• Development of new industrial or commercial facilities
• Major expansions to existing industrial facilities
• Expansion of large commercial and educational institutions (such
as universities, hospitals and shopping malls that need power,
heat and/or cooling)
• Replacement of aging steam generation equipment
• Significant changes in energy costs (fuel and power)
• Power sales opportunities
New industrial plants or major expansions to existing facilities
that have large process heat demands and continuous process
operations provide ideal opportunities to evaluate cogeneration.
In these instances, cogeneration is compared to a Base Case
where process heat is produced on-site with power requirements
purchased from the utility. Cogeneration represents an incremental
investment relative to the Base Case with significant infrastructure
savings. Thus, the capital cost on a $/kW basis is less than for a
grass roots Base Case facility without this “investment credit.”
For example, assuming that a new facility requires 360,000 lb/hr
(163,290 tons/hr) of gas-fired boiler capacity at 150 psig/11.4 bars,
GE Energy | GER-3430G (05/09) 37
Figure 24. Per unit cost of power generation (MS60001FA cycles)
15
14
13
12
11
10
9
8
7
6
5
4
0 2 4 6 8 10 12 14
Leve
lized
20
Year
Per
Uni
t Cos
tof
Pow
er G
ener
ated
(¢/k
Wh)
Fuel Price (cents/MBTU-HHV)
Basis: 1) Grass Roots MS6001FA Cogeneration Plant 2) Cycles as Defined in Figure 15 and Table 4 3) Operation 8400
FE
C
DAB

38
and 75 MW, the incremental investment for an MS6001FA
with an unfired HRSG providing a portion of the required steam
may be about 860 $/kW, whereas, installation of a separate
facility with the MS6001FA and supplementary-fired HRSG system
may approach 1230 $/kW—making a potential project more
difficult to economically justify. (See Table 8.)
Replacement of old low-pressure process steam boilers,
or even boilers with higher steam conditions used to support
a steam turbine cogeneration system often provides an
attractive cogeneration opportunity. Boiler steam capacity
can be replaced by a gas turbine/HRSG system significantly
increasing the system power-to- heat ratio at an attractive FCP.
In addition, the “investment credit” for the replacement boiler
generally assures that the $/kW cost can be reasonable.
When a facility anticipates a significant change in energy costs,
the economic potential of cogeneration should be examined.
This is particularly true in locations where purchased power costs
may be increasing much faster than fuel costs. A cogeneration
evaluation may suggest attractive economics even if there are no
offsetting investments. Furthermore, if the cogeneration system
results in an attractive FCP, the profitability may increase as fuel
costs increase.
Many projects have been developed as a result of favorable
power sales opportunities. Some projects are of a size that could
have simple displaced power purchases. Others are based on
circumstances where large process heat demands permit
generation of electric power significantly in excess of plant
power needs, such as the enhanced oil recovery projects using
steam injection.
Case 1 2 3 4 5
Case Name 1GT + HRSG 1GT + NC ST 2GT + Cond ST 3GT + Cond ST 4GT + Cond ST
Gas Turbine Units 1 1 2 3 4
HRSG Pressure Levels 1 2 2 2 2
Steam Turbine None Noncondensing Extraction condensing Extraction condensing Extraction condensing
Net Fuel
MBTU/hr (HHV) 821.7 902.1 1642.9 2464.4 3285.9
GJ/hr (HHV) 866.9 951.7 1733.3 2599.9 3466.6
Net Power
MW 75 93 198 311 425
Fuel Chargeable to Power
BTU/kWh (HHV) 5654 5435 6290 6654 6798
GJ/kWh (HHV) 5965 5734 6636 7020 7172
Estimated Installed Cost
$ / kW (2008) 1210 1479 1280 1102 1012
Discounted Rate of Return
Percent 15.0 12.8 13.2 14.1 15.0
Basis:
1. Process steam demand at 150 psig saturated (10.3 barg saturated) is 366,200 lb/hr (166.1 tonnes/hr).
2. Case 2 has supplimentary firing. All others are unfired.
3. Net fuel includes credit for process steam delivered at 84% boiler efficiency (HHV).
4. All comparisons with existing facility generating steam for direct use in process, 8000 hr/yr operation assumed.
5. Fuel cost 7.0 $/MBTU (HHV); power value 0.0755 $/kWh.
6. Incremental costs for operating labor, water and maintenance are included.
7. DRR based on 50% equity financing, 100% accelerated depreciation, 20 year economic life, 1.8% local property taxes and insurance, 38% income taxes and3% annual escalation.
Table 7. MS6001FA Cogeneration Example
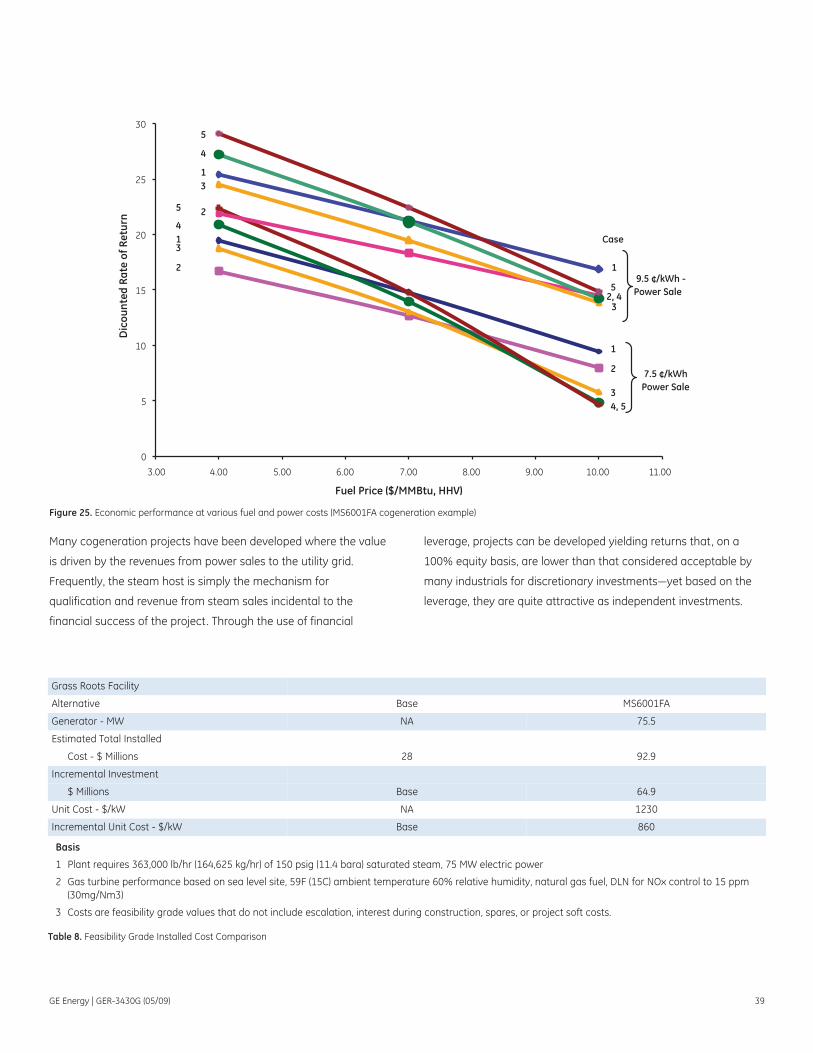
Many cogeneration projects have been developed where the value
is driven by the revenues from power sales to the utility grid.
Frequently, the steam host is simply the mechanism for
qualification and revenue from steam sales incidental to the
financial success of the project. Through the use of financial
leverage, projects can be developed yielding returns that, on a
100% equity basis, are lower than that considered acceptable by
many industrials for discretionary investments—yet based on the
leverage, they are quite attractive as independent investments.
GE Energy | GER-3430G (05/09) 39
Figure 25. Economic performance at various fuel and power costs (MS6001FA cogeneration example)
0
5
10
15
20
25
30
3.00 4.00 5.00 6.00 7.00 8.00 9.00 10.00 11.00
Dic
ount
ed R
ate
of R
etur
n
Fuel Price ($/MMBtu, HHV)
Case
1
5 2, 4
3
4, 5 3
2
1
5
4
1 3
2 5
4 1 3
2
7.5 ¢/kWhPower Sale
9.5 ¢/kWh -Power Sale
Grass Roots Facility
Alternative Base MS6001FA
Generator - MW NA 75.5
Estimated Total Installed
Cost - $ Millions 28 92.9
Incremental Investment
$ Millions Base 64.9
Unit Cost - $/kW NA 1230
Incremental Unit Cost - $/kW Base 860
Basis
1 Plant requires 363,000 lb/hr (164,625 kg/hr) of 150 psig (11.4 bara) saturated steam, 75 MW electric power
2 Gas turbine performance based on sea level site, 59F (15C) ambient temperature 60% relative humidity, natural gas fuel, DLN for NOx control to 15 ppm(30mg/Nm3)
3 Costs are feasibility grade values that do not include escalation, interest during construction, spares, or project soft costs.
Table 8. Feasibility Grade Installed Cost Comparison

40
ConclusionCogeneration continues to play an important role in controlling
industrial or commercial energy costs through the effective
integration of power generation options into the planned energy
supply system. The overall performance and application flexibility
of the cogeneration equipment and system is critical to the
success of these ventures. The use of automatic extraction steam
turbines to control process pressures, integration of gas turbine
exhaust energy for process steam generation, process fluid heating
and preheated combustion air for fired process heaters are a few
examples of the many options available.
As more and more industrials, commercial/educational
establishments, developers and utilities around the world search
for low-cost electric energy and process heat, cogeneration is
found to offer high efficiency and possibly environmental benefits
as well. The industrial steam host is one important key to success.
The host provides the thermal energy demands that can be
leveraged to highly efficient cogeneration systems as well as land
for utilities and developers to site new generation facilities.
This paper has shown the large array of choices available to those
configuring a future power system. Optimizing a cogeneration
system is a complicated process that is usually most satisfactorily
addressed when the turbine supplier, permitting engineer, steam
host, system owner and utility work hand in hand. Application
engineering decisions should be made with as much knowledge as
possible. Each project has its own unique drivers such as
redundancy, maximum kilowatt capability, pollution issues,
reliability of steam or kilowatt supply, or part load operational
flexibility. To respond to these issues, the application engineering
team must “know” the project.
GE remains committed to the development of effective and
efficient cogeneration systems that provide the user with the
operational and service characteristics necessary for successful
applications. It is vital to these projects that the envisioned cycles
will be viewed as reliable steam supplies by the industrial hosts
and, at the same time, provide solid reliable capacity in the eyes of
the industrial or utility that is utilizing that electric power. We offer
our application resources to develop potential alternatives and
identify those systems that most economically satisfy specified
energy requirements.
Acknowledgement First and foremost, the authors of this revision would like to
acknowledge the original authors of the paper Robert W. Fisk and
Robert L. VanHousen. Their contributions still represent a vast
majority of the paper. We would also like to thank John Sanders for
the significant contributions he made both in terms of refreshing
the technical content and in review of the paper. Further, we would
like to acknowledge Andy Kos, Vincent Posta, Warren Ferguson and
Mike Aiello for their contributions.

List of FiguresFigure 1. Fuel utilization effectiveness (fossil-fired boiler)
Figure 2. Steam turbine cycle performance at various process steam demands
Figure 3. Fuel utilization effectiveness (combined cycle/gas turbine based)
Figure 4. Net Heat to Process (NHP)
Figure 5. Fuel Chargeable to Power (FCP
Figure 6. Steam turbine configurations for power generation and process needs
Figure 7. Cogeneration power with steam turbines
Figure 8. Range of initial steam conditions normally selected for industrial steam turbines
Figure 9. Typical single-automatic extraction turbine-performance map
Figure 10. Sankey diagram of typical CHP application with typical gas reciprocating engine
Figure 11. Electrical thermal energy for 50 HZ gas engine products
Figure 12. Electrical/thermal energy for 60 Hz gas engine products
Figure 13. Electrical thermal energy for 50/60 Hz heavy-duty gas turbines
Figure 14. Electrical/thermal energy for 50/60 Hz aeroderivative gas turbines
Figure 15. Gas turbine ambient output characteristics
Figure 16. LM6000 PC inlet conditioning output enhancements
Figure 17. Thermal efficiency vs. stack temperature
Figure 18. Gas turbine with LP HRSG
Figure 19. Typical industrial gas turbine cycle
Figure 20. Performance envelope for MS6001FA gas turbine cogeneration system
Figure 21. Gas turbine cogeneration systems (MS options, 60 Hz)
Figure 22. Gas turbine cogeneration systems (LM options, 50/60 Hz)
Figure 23. Gas turbine cogeneration systems option (50 Hz)
Figure 24. Per unit cost of power generation (MS60001FA cycles)
Figure 25. Economic performance at various fuel and power costs (MS6001FA cogeneration example)
GE Energy | GER-3430G (05/09) 41

42
List of TablesTable 1a. Gas Reciprocating Engine Performance Summary Table – 50 HZ – SI Units
Table 1b. Gas Reciprocating Engine Performance Summary Table – 50 HZ – English Units
Table 2a. Gas Reciprocating Engine Performance Summary Table – 60 HZ – SI Units
Table 2b. Gas Reciprocating Engine Performance Summary Table – 60 HZ – English Units
Table 3. Fuel Sources/Origins
Table 4a. Steam generation and fuel chargeable to power with gas turbine and heat recovery boilers – Heavy Duty (MS series) – English units
Table 4b. Steam generation and fuel chargeable to power with gas turbine and heat recovery boilers – Heavy Duty (MS series) – SI units
Table 5a. Steam generation and fuel chargeable to power with gas turbine and heat recovery boilers – LM series – English units
Table 5b. Steam generation and fuel chargeable to power with gas turbine and heat recovery boilers – LM series – SI units
Table 6. Performance of MS6001FA gas turbine cycles
Table 7. MS6001FA Cogeneration Example
Table 8. Feasibility Grade Installed Cost Comparison


©2009, General Electric Company. All rights reserved.
GER3430G (05/09)