![Marc jacobs presentation[1]](https://static.fdocuments.us/doc/165x107/554cb81fb4c905aa608b501e/marc-jacobs-presentation1.jpg)
Jacobs Investor Presentation
27
©Jacobs 2021 Nurturing our next generation of climate change-makers … driven by our purpose to create a more connected, sustainable world December 2021 Investor Presentation
Transcript of Jacobs Investor Presentation

©Jacobs 2021
Nurturing our next generation of climate change-makers … driven by our purpose to create a more connected, sustainable world
December 2021
Investor Presentation

DisclaimerForward-Looking Statement Disclaimer
Certain statements contained in this presentation constitute forward-looking statements as such term is defined in Section 27A of the Securities Act of 1933, as amended, and Section 21E of the Securities Exchange Act of 1934, as amended, and such statements are intended to be covered by the safe harbor provided by the same. Statements made in this presentation that are not based on historical fact are forward-looking statements. Examples of forward-looking statements include, but are not limited to, statements regarding our expectations as to our future growth, prospects, financial outlook and business strategy for fiscal 2022 or future fiscal years, including fiscal 2025 adjusted EPS expectations, and statements regarding our expectations from our PA Consulting investment and the anticipated benefits of that strategic investment, which are based, in part, on estimates and assumptions regarding the potential continued effects of the COVID-19 pandemic on our business, financial condition and results of operations. Although such statements are based on management's current estimates and expectations, and currently available competitive, financial, and economic data, forward-looking statements are inherently uncertain, and you should not place undue reliance on such statements as actual results may differ materially. We caution the reader that there area variety of risks, uncertainties and other factors that could cause actual results to differ materially from what is contained,projected or implied by our forward-looking statements. Such factors include the magnitude, timing, duration and ultimate impact of the COVID-19 pandemic, including the emergence and spread of variants of COVID-19, and any resulting economic downturn on our results, prospects and opportunities, the timeline for easing or removing “shelter-in-place”, “stay-at-home”, social distancing, travel restrictions and similar orders, measures or restrictions imposed by governments and health officials in response to the pandemic, or if such orders, measures or restrictions are re-imposed after being lifted or eased, including as aresult of increases in cases of COVID-19; the development, effectiveness and distribution of vaccines or treatments for COVID-19; the timing and scope of any government stimulus programs enacted in response to the impacts of the COVID-19 pandemic, including, but not limited to, any additional infrastructure-related stimulus programs, and the timing of the award of projects and funding under the Infrastructure Investment and Jobs Act signed into law by President Biden on November 15, 2021; and the impact of such matters includes, but is not limited to, the possible reduction in demand for certain of our services and thedelay or abandonment of ongoing or anticipated projects due to the financial condition of our clients and suppliers or to governmental budget constraints or changes to governmental budgetary priorities; the inability of our clients to meet their payment obligations in a timely manner or at all; potential issues and risks related to a significant portion of our employees working remotely; illness, travel restrictions and other workforce disruptions that have and could continue to negatively affectour supply chain and our ability to timely and satisfactorily complete our clients’ projects; difficulties associated with hiring of additional employees; and the inability of governments in certain of the countries in which we operate to effectively mitigate the financial or other impacts of the COVID-19 pandemic on their economies and workforces and our operations therein. The foregoing factors and potential future developments are inherently uncertain, unpredictable and, in many cases, beyond our control. For a description of these and additional factors that may occur that could cause actual results to differ from our forward-looking statements see our Annual Report on Form 10-K for the year ended October 1, 2021, and in particular the discussions contained therein under Item 1 - Business; Item 1A - Risk Factors; Item 3 - Legal Proceedings; and Item 7 -Management's Discussion and Analysis of Financial Condition and Results of Operations, as well as the Company’s other filingswith the Securities and Exchange Commission. The Company is not under any duty to update any of the forward-looking statements after the date of this presentation to conform to actual results, except as required by applicable law.
Non-GAAP Financial Measures
To supplement the financial results presented in accordance with generally
accepted accounting principles in the United States (“GAAP”), we present
certain non-GAAP financial measures within the meaning of Regulation G
under the Securities Exchange Act of 1934, as amended. These measures
are not, and should not be viewed as, substitutes for GAAP financial
measures. More information about these non-GAAP financial measures and
reconciliations of these non-GAAP financial measures to the most directly
comparable GAAP financial measures can be found at the end of this
presentation. Reconciliation of the adjusted EPS and adjusted EBITDA for
fiscal 2022 and beyond, including fiscal 2025 adjusted EPS expectations, to
the most directly comparable GAAP measure is not available without
unreasonable efforts because the Company cannot predict with sufficient
certainty all of the components required to provide such reconciliation,
including with respect to the costs and charges relating to transaction
expenses, restructuring and integration and other non-recurring or unusual
items to be incurred in such periods..
Pro Forma FiguresDuring this presentation, we may discuss comparisons of current period results to prior periods on a pro forma adjusted basis. Prior fiscal periods are presented as if acquisitions and the PA Consulting investment had occurred prior to the comparable periods, as adjusted for the exclusion of restructuring and other related charges and transaction expenses and other adjustments described on the Non-GAAP Financial Measures slides as the end of this presentation. In addition, pro forma net revenue comparisons exclude the impact from an extra week in the Q4 2020 period compared to fiscal Q4 2021. We believe this information helps provide additional insight into the underlying trends of our business when comparing current performance against prior periods.

Net Revenue TTM As Reported
($ in Billions)
Backlog As Reported
($ in Billions)We solve some of the most complex challenges of exploration — both in space and closer to home.
Environmental stewardship and climate response are the defining issues of our time.
For the first time in history, security and defense threats have no borders.
Rapidly evolving, complex facilities require fast-paced, innovative solutions.
Prosperous communities. Healthy cities. A brighter tomorrow. By working together we build a better future.
It is one thing to dream up new solutions. At Jacobs, we also deliver them.
Resilient environments
Scientific discovery
Thriving cities
Mission critical outcomes
Cutting-edge manufacturing
Operational advancement
People & Places Solutions
Critical Mission Solutions
PA Consulting
$11.0
$11.7
Q4 2020 Q4 2021
$23.8 $26.6
Q4 2020 Q4 2021
Jacobs: Challenging today. Reinventing tomorrow.Compelling investment thesis ▪ Global infrastructure modernization, climate response and industry digitization
▪ U.S. Infrastructure Investment and Jobs Act to fuel 2H 22 growth and beyond
▪ ESG and digital solutions embedded throughout global offerings
Strong track record of execution ▪ Q4 net revenue increased 7% y/y and adjusted EBITDA up 12%
▪ Q4 backlog increased to $26.6B, up 12% y/y
▪ PA Consulting Q4 revenue growth of 41% y/y
▪ Fiscal 2022 outlook represents accelerating y/y growth
▪ Effectively deploying capital to maximize long-term shareholder value
3

Office of Global Climate Response and Environmental, Social & Governance (ESG)
4
Decarbonization▪ End-to-end net zero delivery ▪ Clean & smart mobility▪ Carbon capture, utilisation & storage
Energy Transition▪ Clean energy generation▪ Grid modernization & storage▪ Water-energy nexus
Adaptation & Resilience▪ Climate risk & vulnerability assessments▪ Asset & infrastructure resilience▪ Disaster planning, response
& recovery
Natural & Social Capital▪ Natural capital stewardship
& restoration▪ Social value impact▪ Healthy & vibrant communities
ESG Business Transformation▪ Sustainable business strategies▪ ESG disclosures & reporting▪ Governance
~$5B
FY21 FY25E
Estimated ESG Solutions Revenue
With our future in the balance, the planning, commitments and sustainability steps we take today are critical to leading the world to a more climate-resilient existence for the generations to come.
Climate change: the greatest challenge and opportunity of our generation
Climate Response
Jan WalstromSVP, Office of Global Climate Response & ESG
“
“
5
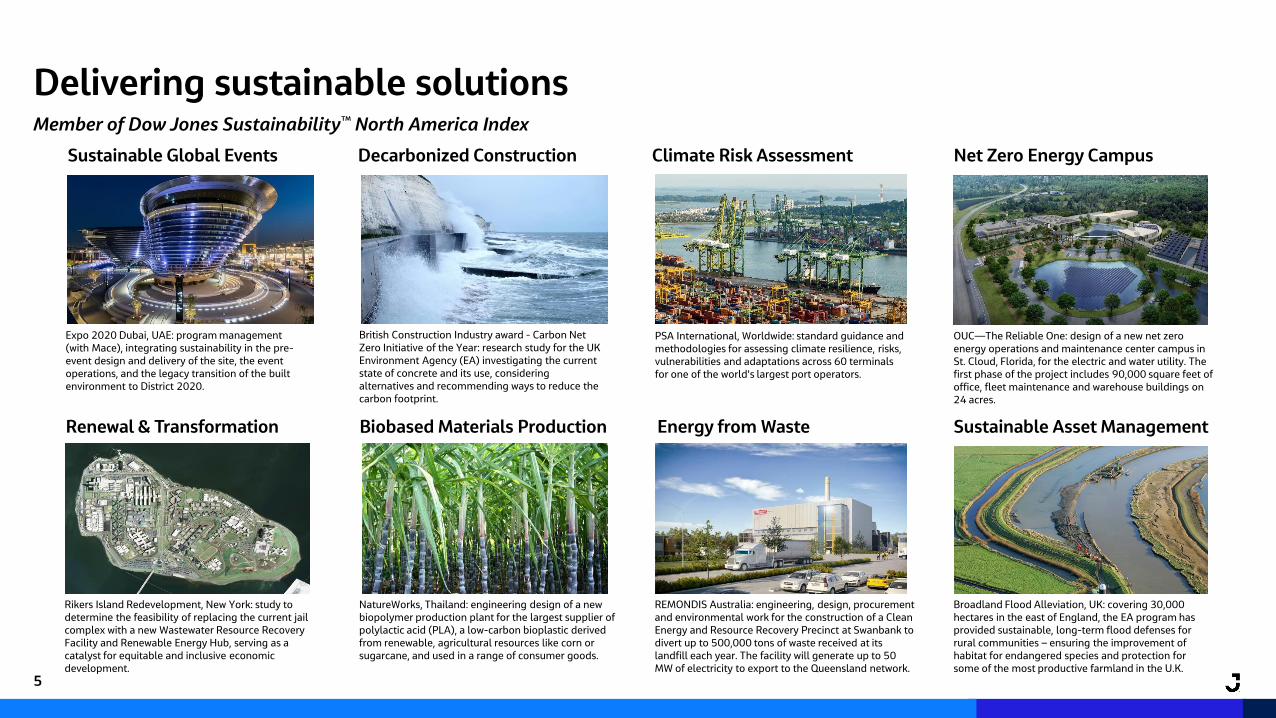
Member of Dow Jones Sustainability™ North America Index
Rikers Island Redevelopment, New York: study to determine the feasibility of replacing the current jail complex with a new Wastewater Resource Recovery Facility and Renewable Energy Hub, serving as a catalyst for equitable and inclusive economic development.
Expo 2020 Dubai, UAE: program management (with Mace), integrating sustainability in the pre-event design and delivery of the site, the event operations, and the legacy transition of the built environment to District 2020.
Broadland Flood Alleviation, UK: covering 30,000 hectares in the east of England, the EA program has provided sustainable, long-term flood defenses for rural communities – ensuring the improvement of habitat for endangered species and protection for some of the most productive farmland in the U.K.
PSA International, Worldwide: standard guidance and methodologies for assessing climate resilience, risks, vulnerabilities and adaptations across 60 terminals for one of the world's largest port operators.
NatureWorks, Thailand: engineering design of a new biopolymer production plant for the largest supplier of polylactic acid (PLA), a low-carbon bioplastic derived from renewable, agricultural resources like corn or sugarcane, and used in a range of consumer goods.
Renewal & Transformation Sustainable Asset Management
Climate Risk AssessmentSustainable Global Events
British Construction Industry award - Carbon Net Zero Initiative of the Year: research study for the UK Environment Agency (EA) investigating the current state of concrete and its use, considering alternatives and recommending ways to reduce thecarbon footprint.
Decarbonized Construction
Delivering sustainable solutions
Energy from Waste
REMONDIS Australia: engineering, design, procurement and environmental work for the construction of a Clean Energy and Resource Recovery Precinct at Swanbank to divert up to 500,000 tons of waste received at its landfill each year. The facility will generate up to 50 MW of electricity to export to the Queensland network.
OUC—The Reliable One: design of a new net zero energy operations and maintenance center campus in St. Cloud, Florida, for the electric and water utility. The first phase of the project includes 90,000 square feet of office, fleet maintenance and warehouse buildings on 24 acres.
Net Zero Energy Campus
Biobased Materials Production

Revenue by Customer (TTM)
U.S. / International 83% / 17%
Government ~88%
Reimbursable and Lower Risk Fixed Price Services ~95%
Recurring ~93%
Talent Force ~19k
Critical Mission Solutions Snapshot (TTM including The Buffalo Group)
Backlog As Reported ($ in Billions)
34%
25%
15%
18%
8%
Civilian Defense
Intelligence International
Commercial
$9.1
$10.6
Q4 FY20 Q4 FY21
Critical Mission SolutionsBase of recurring revenue; new business pipeline margin-accretive
▪ Multi-year enterprise contracts provide long-term stability
▪ High-value solutions and efficient cost structure driving margin expansion
▪ Next 18-month new business pipeline remains strong >$30 billion
Strategy aligned to critical national security priorities
▪ High priority areas in space, digital modernization, data, cyber, all-source intelligence, and 5G networks
▪ Positioned to grow through technology-enabled solutions such as strategic data utilization, space sensors and clean energy
▪ BlackLynx acquisition bringing software solutions, hybrid-cloud platform, collection automation and edge computing
Recent customer wins
▪ Geospatial intelligence software engineering & modernization for NGA
▪ Agile software development, testing and integration for a classified client
▪ 10-year Oak Ridge environmental clean-up for the DoE
▪ Aircraft and airdrop software development for the U.S. Air Force
▪ U.S. Space Force Patriot Excalibur (PEX) aircraft status software support
6

Net Revenue by Sector(Q4 2021)
U.S. / International 61% / 39%
Public / Private Sector 65% / 35%
Reimbursable and Lower Risk Fixed Price Services ~91%
Talent Force ~35k
People & Places Solutions Snapshot(Net Revenue Q4 2021)
Backlog As Reported ($ in Billions)
34%
12%21%
16%
17%
Transportation Built Environment
Water Advanced Facilities
Environmental
$14.7 $15.7
Q4 FY20 Q4 FY21
People & Places SolutionsExecuting against high-value opportunities
▪ Deep domain expertise at scale across sectors
▪ Global delivery model benefiting profitability and talent utilization
Strong secular trend alignment
▪ Global stimulus supporting infrastructure modernization and digitization
▪ Climate response driving long-term opportunities
▪ Pandemic recovery driving health, life sciences and cloud computing investment
▪ Well-positioned to capitalize on semi-conductor expansion in the US
Recent customer wins
▪ Intel Arizona Semiconductor Fab design (US)
▪ Rikers Island sustainability and resiliency feasibility study (US)
▪ US Army Corps of Engineers Engineering for Nature (US)
▪ Caltrans hydrogen rail feasibility study (US)
▪ Transport for London Engineering Consultancy Framework (UK)
▪ Transport for New South Wales Warringah Freeway technical/design services (AU)
▪ Solidarity Transport Hub integrated program management (PL)
7
Sector mappings updated in Q3 2021

Revenue by Sector(Since 3/2/21)
U.S. / UK / Other 13% / 78% / 9%
Public / Private Sector 45% / 55%
Backlog Growth y/y +18%
23%
22%
18%
12%
12%
6%7%
Health and Life Sciences Defense and SecurityPublic Services Financial ServicesConsumer and Manufacturing Energy and UtilitiesTransport
PA Consulting
Deep strategic expertise vital for value enhanced solutions
▪ Trusted partner for UK government’s pandemic response
▪ Growth in US Consumer and Life Sciences
Innovation-focused solutions critical in technology-driven world
▪ Strategic vision with experience executing end-to-end innovation
▪ Focused on leveraging technology advances across public sector
▪ Sustainable solutions in water, carbon capture, and packaging
Recent customer wins
▪ Business Continuity Awards Initiative of the Year - COVID-19 Awareness and Situational Intelligence (CASI) tool with Unilever
▪ Designing Electric Vehicle ChargePoint for the UK unveiled at the COP26
▪ Ministry of Housing Communities and Local Government, Cities and Local Growth Unit's to support the delivery of the UK's Freeports Programme
▪ Several PA and Jacobs collaborative wins in transportation
8
PA Consulting Snapshot(Revenue Q4 2021)

Fiscal 2021 Q4 results
Revenue increased 2% y/y and Pro Forma Net Revenue1 up 6% y/y
GAAP Operating Profit (OP) of $252M and OP Margin of 7.0%
Adj. OP of $303M (+17%) and Net Revenue Adj. OP Margin of 9.9% (+85 bps)
GAAP Net Earnings from Continuing Operations of $45M
GAAP EPS from Continuing Operations of $0.34 impacted by:
▪ $(0.45) related to income tax rate alignment and UK statutory tax rate changes and other items
▪ $(0.40) related to mark-to-market adjustments associated with Worley stock and related FX
▪ $(0.23) of expense net of NCI related to the amortization of acquired intangibles
▪ $(0.10) of transaction and other related costs
▪ $(0.06) of net charges related to Focus 2023 and other restructuring
Adj. EPS of $1.58, includes $0.23 from PA Consulting (including incremental interest expense)
Adjusted EBITDA of $310M, up 12% y/y and 10.2% of Net Revenue
Q4 revenue book-to-bill 1.3x
9
An organization’s journey to net zero can be complex. That’s where my work comes in: collaborating with clients using a customized Net Zero Lab approach to uncover emissions abatement challenges and opportunities – and set emission reduction targets that will stand the test of time.
“
Net Zero Labs
Janine BarrowGlobal Technology Lead, Sustainability & Climate Action
“Drawing from our greatest minds to explore pathways to net zero readiness.
1Pro forma net revenue growth adjusts for the impact of the first year of acquired revenue and the impact from an extra week in fiscal Q4 2020 compared to fiscal Q4 2021.

Fiscal 2021
Revenue increased 4% y/y and Pro Forma Net Revenue1 up 3% y/y
Fiscal Year 2021 Revenue book-to-bill 1.1x
GAAP Operating Profit (OP) of $688M and OP Margin of 4.9%
Adj. OP of $1,188M (+23%) and Net Revenue Adj. OP Margin of 10.1% (+130 bps)
GAAP Net Earnings from Continuing Operations of $467M
Adjusted EBITDA of $1,244M, up 18% y/y and 10.6% of Net Revenue
GAAP EPS from Continuing Operations of $3.12 impacted by:
▪ $(1.96) portion of PA investment consideration treated as compensation with no change to total consideration and valuation allocation related to PA Equity
▪ $(0.77) of expense net of NCI related to the amortization of acquired intangibles
▪ $(0.57) related to income tax rate alignment and UK statutory tax rate changes and other items
▪ $(0.35) of net charges related to Focus 2023, deal cost and other restructuring costs
▪ $0.48 related to sale and FX impact of Worley and C3.ai equity
Adj. EPS of $6.29 including $0.48 of accretion from PA Consulting investment
10
By bringing together our domain expertise with the right enabling digital technologies, we’re helping clients optimize both the capability of their modernized cloud computing infrastructure and the mission and operational outcomes that rely on it.
“
Harnessing digital modernization as a pathway towards a lower carbon future
Low-Carbon Computing
Jed Van DykeVP, Innovation & Strategy
“
1Pro forma net revenue growth adjusts for the impact of the first year of acquired revenue and the impact from an extra week in fiscal Q4 2020 compared to fiscal Q4 2021.

1See reconciliation at the end of presentation2Includes $20M legal settlement
$’s in millions
Q4 2020
Q4 2021
Y/Y FY20 FY21 Y/Y
Critical Mission Solutions Operating Profitas a % of revenue
1088.1%
1159.1%
7%100 bps
3727.5%
4478.8%
20%130 bps
People & Places Solutions Operating Profitas a % of net revenue
18312.2%
1772
11.7%
-3%-40 bps
74112.4%
7802
13.0%
5%65 bps
PA Consulting Operating Profitas a % of revenue
—N/A
6624.3%
N/AN/A bps
—N/A
15124.1%
N/AN/A bps
Adjusted Unallocated Corporate Costs
(33) (55) (23) (143) (190) (48)
Adjusted Operating Profit from Continuing Operations1
as a % of net revenue
2589.1%
3039.9%
17%85 bps
9708.9%
1,18810.1%
23%130 bps
Adjusted EBITDA from Continuing Operations1
as a % of net revenue
2779.8%
31010.2%
12%40 bps
1,0529.6%
1,24410.6%
18%100 bps
Adj. EBITDA Margin Above 10% with Y/Y Expansion Throughout FY21
Segment financials
11
Given the commitment of governments and businesses around the world – and the acceleration of investments and innovations – there is great hope.
“
Decarbonizing our energy systems and sources is the critical pathway to achieving net zero
Global Energy Transition
David StaderGlobal Market DirectorEnergy Transition
“

12* FY2022E adjusted EBITDA assumed mid-point of outlook**Factors in ~$924M notional interest rate swap
Q4 Leverage Metrics ($ billions) FY21 Q4
Q4 Net Debt Position $1.9B
Q4 net debt to adjusted FY22E EBITDA 1.3x*
Fixed/Floating Mix** 49%/51%
Weighted average interest rate** 2.11%
1 Free cash flow (FCF) calculated as reported cash flow from operations minus CAPEX
Balance sheet and cash flow Continued strong cash flow generation
▪ Q4 cash flow from operations (CFFO) $203M and FCF1 of $176M; includes ~$22M of cash outflows mainly related to new ways of working related costs
▪ FY21 CFFO $726M and FCF1 $633M; mainly impacted by $261M from PA investment consideration
▪ Targeting >100% FY22 FCF to adj. net income
Robust free cash flow enables financial flexibility
▪ Q4 cash and equivalents of $1.0B and gross debt of $2.9B; net debt of $1.9B resulting in 1.3x of net debt to FY22E adjusted EBTDA
▪ Monetized Worley investment during Q4 for $369M
Balance Sheet strength affords capital deployment
▪ Executed a $250M accelerated share repurchase (ASR) and paid $27M in cash dividends in Q4
▪ Q4 dividend of $0.21/share (+11% y/y), paid October 29, 2021
Reducing global transportation sector emissions is a top priority, and the greening of public and private vehicle fleets is one way for entire populations to take steps toward reducing their carbon footprint and environmental impacts.
Net zero by 2050 hinges on an unprecedented clean technology push to 2030
Fleet Greening
Marc DeSchampProgram Manager, Green Fleets
“
“

$ billions
Q1 & FY22 fully diluted average share count 131M
Q1 & FY22 effective tax rate ~23%
Annual CAPEX ~1% of net revenue
Additional Metrics
Outlook & SummaryIntroducing Fiscal 2022 Outlook
▪ Expect adjusted EBITDA outlook to $1,370 to $1,450M
▪ Expect adjusted EPS outlook to $6.85 to $7.45
Positioned for double-digit adj. EBITDA growth in FY22 and beyond
▪ Expect benefits from U.S. Infrastructure Investment and Jobs Act in Fiscal 2H 22 and beyond
▪ The company expects adjusted EPS of approximately $10.00 in fiscal 20251
13
David StaderGlobal Market Director, Energy Transition
Jed Van DykeVP, Innovation & Strategy
“
“
Coastal wetlands capture and hold carbon at high rates when compared to most forests and other ecosystems, so protecting and restoring them is critical.
“
Blue Carbon
Doug HuxleyPrincipal Technologist & Practice Leader Climate Response & Carbon Management
Nature’s helping hand
“
1Incorporates anticipated benefits to People and Places Solutions from the recently passed Infrastructure Investment and Jobs Act, executing against a robust Critical Mission Solutions sales pipeline, continued growth in PA Consulting, and assumes a 23.5% effective adjusted tax rate, modest capital deployment and net leverage of <0.5x adjusted EBITDA.

14
We do things right.We challenge the accepted.We aim higher.We live inclusion.
Challenging today and reinventing tomorrow, our passion and commitment to take immediate action on climate change comes from our leadership and our 55,000 employees who, together, are pushing the limits of what’s possible by creating sustainable solutions that leave no one behind.
14

15
Reimagined Perspectives
Continue to drive thought leadership
▪ Climate Response: Are we going to be proactive or reactive?
▪ Jacobs is helping build a healthier, safer, more sustainable and resilient future for all
Current issue of Reimagined Perspectives focus on
▪ Global Energy Transition
▪ Fleet Greening
▪ Wastewater-Energy Nexus
▪ Blue Carbon
▪ Low Carbon Computing
▪ Net Zero Labs
Our purpose at Jacobs is to create a more connected, sustainable world — shaping solutions for a future that incorporates sustainable principles as essential to the well-being of all people and our planet — and in the process, enabling all generations to believe in the reality of a resilient future where we thrive in harmony with our planet.
“
Steve DemetriouChair and CEO
Explore the issue online
“

Environmental, Social & Governance Summary
A sustainable business model aligning purpose and vision with both growth and positive impact:
▪ Fully integrates purpose with profit and operationalizessustainability across all aspects of our business
▪ Drives how we can have the biggest positive impact for society as a business
▪ Leverages Jacobs’ full suite of solutions to play a key role in advancing a net zero economy
▪ ISS environmental and social scores significantly improve; annualized ESG related revenue ~$5 billion
Water Business Overview
Jacobs ESG Investor Page
2020 ESG Data Disclosure for Analysts
Environmental and PFAS Overview
▪ Achieved 100% renewable energy for our operations in 2020.
▪ Achieved net zero carbon for our operations and business travel in 2020.
▪ Carbon negative for our operations and business travel by 2030.
Jacobs' Climate Action Plan
16

$’s in millions Q1 2020 Q2 2020 Q3 2020 Q4 2020 FY 2020 Q1 2021 Q2 2021 Q3 2021 Q4 2021 FY 2021
Backlog 22,671 23,291 23,674 23,818 23,818 25,105 25,571 25,436 26,631 26,631
Revenue 3,360 3,427 3,260 3,520 13,567 3,382 3,548 3,576 3,586 14,093
Net Revenue 2,658 2,786 2,681 2,832 10,957 2,733 2,971 2,964 3,042 11,711
Adjusted Gross Profit 645 648 631 665 2,589 632 767 817 827 3,044
Adjusted G&A (408) (412) (392) (407) (1,619) (373) (456) (502) (525) (1,856)
Adjusted Operating Profit From Continuing Operations as a % of Net Revenue
2378.9%
2378.5%
2398.9%
2589.1%
9708.9%
2599.5%
31110.5%
31510.6%
3039.9%
1,18810.1%
Adj. Net Interest Income (Expense) (13) (14) (17) (13) (57) (12) (15) (19) (19) (65)
Selected financial data
17

1 PA Consulting results are reflected from the March 2, 2021 acquisition date through the April 2, 2021 quarter end date.
$’s in millions Q1 2020 Q2 2020 Q3 2020 Q4 2020 FY 2020 Q1 2021Q2
20211 Q3 2021 Q4 2021 FY 2021
Critical Mission Solutions
Backlog 8,473 9,135 9,066 9,104 9,104 9,683 9,779 9,565 10,589 10,589
Revenue 1,182 1,243 1,211 1,329 4,966 1,295 1,310 1,218 1,264 5,087
Operating Profit as a % of revenue 907.6%
846.8%
907.4%
1088.1%
3727.5%
1108.5%
1148.7%
1088.9%
1159.1%
4478.8%
People & Places Solutions
Backlog 14,197 14,156 14,608 14,714 14,714 15,422 15,512 15,557 15,738 15,738
Revenue 2,178 2,184 2,049 2,191 8,601 2,087 2,140 2,103 2,049 8,378
Net Revenue 1,476 1,542 1,470 1,503 5,991 1,438 1,563 1,491 1,505 5,996
Operating Profit as a % of Net Revenue 17812.1%
18912.3%
19013.0%
18312.2%
74112.4%
19613.7%
20212.9%
20513.8%
17711.7%
78013.0%
PA Consulting
Backlog — — — — — — 280 314 304 304
Revenue — — — — — — 98 256 273 627
Operating Profit as a % of revenue — — — — — — 2828.4%
5722.2%
6624.3%
15124.1%
Adj. Unallocated Corporate Expense (32) (37) (41) (33) (143) (47) (33) (55) (55) (190)
Selected financial data
18

$’s in thousands Q1 2020 Q2 2020 Q3 2020 Q4 2020 FY 2020 Q1 2021 Q2 2021 Q3 2021 Q4 2021 FY 2021
Depreciation (pre-tax)
22,152 22,566 22,276 24,076 91,070 22,989 25,090 26,405 26,540 101,024
Amortization of Intangibles (pre-tax)
21,845 22,094 23,135 23,489 90,563 23,155 30,598 49,555 46,468 149,776
Pass-Through Costs Included in Revenue
701,754 641,393 578,717 687,980 2,609,843 648,677 576,629 612,045 544,435 2,381,785
Capital Expenditures 22,260 39,077 27,484 29,448 118,269 16,766 28,287 20,617 27,144 92,814
Fully Diluted Weighted Average Share Count
134.7 133.6 131.3 131.4 132.7 131.2 131.2 131.4 131.4 131.3
Other operational metrics from continuing operations
19

Non GAAP financial measures
20
(1) Includes charges associated with various restructuring, transaction and other related activity costs associated with Company transformation and acquisition related programs.
(2) Includes (a) the removal of pass through revenues and costs for the People & Places Solutions line of business for the calculation of operating profit margin as a percentage of net revenue of $544.4 million, (b) the removal of amortization of intangible assets of $46.5 million, (c) the removal of $(67.5) million in fair value gains and (losses) related to our investment in Worley stock and certain foreign currency revaluations relating to ECR sale, (d) the removal of $(1.7) million additional income tax expense attributable to tax rate increases in the UK during 2021, (e) associated noncontrolling interest impacts for the above adjustment items and (f) income tax expense adjustments for the above pre-tax adjustment items.

21
Non GAAP financial measures
(1) Includes after-tax charges for the Company's fourth quarter fiscal 2020 transformation initiatives relating to real estate of $123.1 million, and other staffing programs of $23.5 million and $14.4 million of other restructuring, transaction and other charges.
(2) Includes (a) the removal of pass through revenues and costs for the People & Places Solutions line of business for the calculation of operating profit margin as a percentage of net revenue of $688.0 million, (b) the removal of amortization of intangible assets of $23.5 million, (c) the reclassification of revenues under the Company's TSA of $0.6 million included in other income for U.S. GAAP reporting purposes to SG&A, (d) the removal of $44.5 million in fair value gains and (losses) related to our investment in Worley stock (net of Worley stock dividend) and certain foreign currency revaluations relating to the ECR sale and (e) associated income tax expense adjustments for the above pre-tax adjustment items.

22
Non GAAP financial measures
(1) Includes charges associated with various restructuring, transaction and other related activity costs associated with Company transformation and acquisition related programs, impairment charges relating to our investment in AWE, along with pre-tax $297.8 million in PA Consulting deal related costs and associated noncontrolling interest impacts for the above adjustment items. Also includes $57.3 million or $(0.44) per share in EPS numerator adjustments relating to the PA preference shares redemption value, which does not affect net earnings.
(2) Includes (a) the removal of pass through revenues and costs for the People & Places Solutions line of business for the calculation of operating profit margin as a percentage of net revenue of $2.4 billion, (b) the removal of amortization of intangible assets of $149.8 million, (c) the removal of $34.7 million in fair value gains and (losses) related to our investment in Worley stock and certain foreign currency revaluations relating to ECR sale, (d) the removal of the fair value gains and (losses) of the Company's investment in C3 of $49.6 million, (e) the removal of $29.1 million additional income tax expense attributable to tax rate increases in the UK during 2021, (f) associated noncontrolling interest impacts for the above adjustment items and (g) income tax expense adjustments for the above pre-tax adjustment items.

23
Non GAAP financial measures
(1) Includes after-tax charges for the Company's fourth quarter fiscal 2020 transformation initiatives relating to real estate of $123.1 million, and other staffing programs of $23.5 million, and $101.6 million of other restructuring, transaction and other charges.
(2) Includes (a) the removal of pass through revenues and costs for the People & Places Solutions line of business for the calculation of operating profit margin as a percentage of net revenue of $2.6 billion, (b) the removal of amortization of intangible assets of $90.6 million, (c) the reclassification of revenues under the TSA of $16.1 million included in other income for U.S. GAAP reporting purposes to SG&A, (d) the removal of $74.5 million in fair value gains related to our investment in Worley stock (net of Worley stock dividend) and certain foreign currency revaluations relating to the ECR sale and (e) associated income tax expense adjustments for the above pre-tax adjustment items.

24
Reconciliation of net earnings from continuing operations attributable to Jacobs to adjusted EBITDA

25
Reconciliation of Jacobs free cash flow

26
Reconciliation of Jacobs pro forma net revenue
This presentation includes comparisons of current period net revenue to prior periods on a pro forma basis. Prior fiscal
periods are calculated as if all acquisitions had occurred prior to the comparable periods and excludes the impact from an
extra week in the fiscal Q4 2020 period compared to fiscal Q4 2021.

27
Net revenue is calculated excluding pass-through revenue of the Company’s People & Places Solutions segment from the Company’s revenue from continuing operations. Adjusted net earnings from continuing operations, adjusted EPS from continuing operations, adjusted operating profit and adjusted operating profit margin are calculated by (i) excluding the costs related to our 2015 restructuring activities, which included involuntary terminations, the abandonment of certain leased offices, combining operational organizations and the co-location of employees into other existing offices; and charges associated with our Europe, U.K. and Middle East region, which included write-offs on contract accounts receivable and charges for statutory redundancy and severance costs; (ii) excluding costs and other charges associated with restructuring activities implemented in connection with the acquisitions of The KeyW Holding Corporation ("KeyW"), CH2M, John Wood Group nuclear business and Buffalo Group, and the strategic investment in PA Consulting, the sale of the ECR business and other related cost reduction initiatives, which included involuntary terminations, costs associated with co-locating Jacobs, KeyW and CH2M offices, separating physical locations of ECR and continuing operations, professional services and personnel costs, costs and charges associated with the divestiture of joint venture interests to resolve potential conflicts arising from the CH2M acquisition, expenses relating to certain commitments and contingencies relating to discontinued operations of the CH2M business, charges associated with certain operations in India, which included write-offs on contract accounts receivable and other accruals, and similar costs and expenses; (iii) excluding the costs and other charges associated with our Focus 2023 transformation initiatives commenced in the fourth quarter of fiscal 2020, which included costs and charges associated with the re-scaling and repurposing of physical office space, voluntary employee separations, contractual termination fees and related expenses (the amounts referred in (i), (ii) and (iii) are collectively referred to as the “Restructuring and other charges”); (iv) excluding transaction costs and other charges incurred in connection with closing of the KeyW, CH2M, John Wood Group nuclear business, Buffalo Group and BlackLynx acquisitions and the strategic investment in PA Consulting, including advisor fees, change in control payments, certain consideration amounts for PA Consulting that were required to be treated as post-completion compensation expense given retention related requirements applicable to the distribution of such funds to PA Consulting employees, and impacts resulting from the non-cash purchase accounting adjustment related to the investment in PA Consulting to reflect a change in the preliminary purchase price allocation for the redeemable non-controlling interests, the impact of the third quarter adjustment to the estimated future payout of contingent consideration to the sellers in the Buffalo Group acquisition, and similar transaction costs and expenses (collectively referred to as “transaction costs”); (v) adding back amortization of intangible assets; (vi) the reclassification of revenue under the Company's transition services agreement (TSA) with Worley included in other income for U.S. GAAP reporting purposes to SG&A and the exclusion of remaining unreimbursed costs associated with the TSA; (vii) the removal of fair value adjustments and dividend income related to the Company’s investments in Worley and C3 stock and certain foreign currency revaluations relating to ECR sale proceeds; (viii) excluding charges resulting from the revaluation of certain deferred tax assets/liabilities in connection with U.S. tax reform and tax rate increases in the United Kingdom during fiscal 2021; (ix) charges associated with the impairment of our investment in AWE; (x) certain non-routine income tax adjustments for the purposes of calculating the Company's annual non-GAAP effective tax rate to facilitate a more meaningful evaluation of the Company’s current operating performance and comparisons to the Company's operating performance in other periods and (xi) other income tax adjustments associated with the pre-tax income adjustments above. Adjustments to derive adjusted net earnings from continuing operations, adjusted EPS from continuing operations, adjusted operating profit and adjusted operating profit margin are calculated on an after-tax basis.
Adjusted EBITDA is calculated by adding income tax expense, depreciation expense and interest expense, and deducting interest income from adjusted net earnings from continuing operations. Free cash flow is calculated using the reported statement of cash flows, provided from operations less additions to property and equipment.
We believe that the measures listed above are useful to management, investors and other users of our financial information in evaluating the Company’s operating results and understanding the Company’s operating trends by excluding or adding back the effects of the items described above and below, the inclusion or exclusion of which can obscure underlying trends. Additionally, management uses such measures in its own evaluation of the Company’s performance, particularly when comparing performance to past periods, and believes these measures are useful for investors because they facilitate a comparison of our financial results from period to period. The Company provides non-GAAP measures to supplement U.S. GAAP measures, as they provide additional insight into the Company’s financial results. However, non-GAAP measures have limitations as analytical tools and should not be considered in isolation and are not in accordance with, or a substitute for, U.S. GAAP measures. In addition, other companies may define non-GAAP measures differently, which limits the ability of investors to compare non-GAAP measures of the Company to those used by our peer companies.
Non-GAAP financial measures