Jacob, Lefgren, and Sims
29
THE JOURNAL OF HUMAN RESOURCES •45 • 4 The Persistence of Teacher-Induced Learning Brian A. Jacob Lars Lefgren David P. Sims ABSTRACT This paper constructs a statistical model of learning that suggests a sys- tematic way of measuring the persistence of treatment effects in education. This method is straightforward to implement, allows for comparisons across educational treatments, and can be related to intuitive benchmarks. We demonstrate the methodology using student-teacher linked administra- tive data for North Carolina to examine the persistence of teacher quality. We find that teacher-induced learning has low persistence, with three- quarters or more fading out within one year. Other measures of teacher quality produce similar or lower persistence estimates. I. Introduction Educational interventions are often narrowly targeted and temporary, such as class size reductions in kindergarten or summer school in selected elementary grades. Because of financial, political and logistical constraints, evaluations of such programs often focus exclusively on the short-run impacts of the intervention. Insofar as the treatment effects are immediate and permanent, short-term evaluations will provide a good indication of the long-run impacts of the intervention. However, prior research suggests that the positive effects of educational interventions may Brian Jacob is the Walter H. Annenberg Professor of Education Policy, Professor of Economics, and Director of the Center on Local, State, and Urban Policy (CLOSUP) at the Gerald R. Ford School of Public Policy, University of Michigan. Lars Lefgren is an associate professor of economics at Brigham Young University. David Sims is an assistant professor of economics at Brigham Young University. The authors thank Henry Tappen for excellent research assistance. They thank John DiNardo, Scott Carrell, and Jesse Rothstein and anonymous reviewers as well as seminar participants at MIT, SOLE, Brigham Young University, the University of California, Davis, and Mathematica Policy Research. Scholars may obtain the data used in this article from the North Carolina Education Research Data Center upon sat- isfying their requirements. For information about that process, the authors may be contacted at [email protected], [email protected], and [email protected], respectively. [Submitted February 2009; accepted July 2009] ISSN 022-166X E-ISSN 1548-8004 2010 by the Board of Regents of the University of Wisconsin System
-
Upload
truongdien -
Category
Documents
-
view
215 -
download
0
Transcript of Jacob, Lefgren, and Sims
T H E J O U R N A L O F H U M A N R E S O U R C E S • 45 • 4
The Persistence of Teacher-InducedLearning
Brian A. JacobLars LefgrenDavid P. Sims
A B S T R A C T
This paper constructs a statistical model of learning that suggests a sys-tematic way of measuring the persistence of treatment effects in education.This method is straightforward to implement, allows for comparisonsacross educational treatments, and can be related to intuitive benchmarks.We demonstrate the methodology using student-teacher linked administra-tive data for North Carolina to examine the persistence of teacher quality.We find that teacher-induced learning has low persistence, with three-quarters or more fading out within one year. Other measures of teacherquality produce similar or lower persistence estimates.
I. Introduction
Educational interventions are often narrowly targeted and temporary,such as class size reductions in kindergarten or summer school in selected elementarygrades. Because of financial, political and logistical constraints, evaluations of suchprograms often focus exclusively on the short-run impacts of the intervention. Insofaras the treatment effects are immediate and permanent, short-term evaluations willprovide a good indication of the long-run impacts of the intervention. However,prior research suggests that the positive effects of educational interventions may
Brian Jacob is the Walter H. Annenberg Professor of Education Policy, Professor of Economics, andDirector of the Center on Local, State, and Urban Policy (CLOSUP) at the Gerald R. Ford School ofPublic Policy, University of Michigan. Lars Lefgren is an associate professor of economics at BrighamYoung University. David Sims is an assistant professor of economics at Brigham Young University. Theauthors thank Henry Tappen for excellent research assistance. They thank John DiNardo, Scott Carrell,and Jesse Rothstein and anonymous reviewers as well as seminar participants at MIT, SOLE, BrighamYoung University, the University of California, Davis, and Mathematica Policy Research. Scholars mayobtain the data used in this article from the North Carolina Education Research Data Center upon sat-isfying their requirements. For information about that process, the authors may be contacted [email protected], [email protected], and [email protected], respectively.[Submitted February 2009; accepted July 2009]ISSN 022-166X E-ISSN 1548-8004 � 2010 by the Board of Regents of the University of Wisconsin System
916 The Journal of Human Resources
fade out over time (see the work on Head Start by Currie and Thomas 1995, andothers). Failure to accurately account for this fadeout can dramatically change theassessment of a program’s impact and/or its cost effectiveness.
Unfortunately, work on measuring the persistence of educational program impactshas not received much emphasis in the applied microeconomics literature, particu-larly in the area of teacher effectiveness which has been a focus of comparativelydetailed attention among researchers and policymakers. Indeed, a number of districtsand states are experimenting with ways to advance the use of teacher characteristics,including statistically derived “value-added” measures in the design of hiring, cer-tification, compensation, tenure, and accountability policies. An oft-cited claim isthat matching a student with a stream of high value-added teachers (one standarddeviation above the average teacher) for five years in a row would be enough tocompletely eliminate the achievement gap between poor and nonpoor students (Riv-kin, Hanushek, and Kain 2005). This prognosis fails, however, to mention the un-derlying assumption of perfectly persistent teacher effects—that is, effects with iden-tical long- and short-run magnitudes.
This paper advances the persistence literature by introducing a framework forestimating and comparing the persistence of treatment effects in education acrosspolicy options. To begin, we present a simple model of student learning that incor-porates permanent as well as transitory learning gains. Using this model, we dem-onstrate how the parameter of interest—the persistence of a particular measurableeducation input—can be recovered via instrumental variables as a local averagetreatment effect (Imbens and Angrist 1994). We illustrate our method by estimatingthe persistence of teacher-induced learning gains with multiple measures of teacherquality, though the method generalizes to other educational interventions. Using thestudent-teacher linkages available in administrative data from North Carolina, weconstruct measures of teacher effectiveness, including observable teacher correlatesof student achievement such as experience and credentials (Clotfelter, Ladd, andVigdor 2007) as well as statistically derived measures of teacher value-added.
Our resulting estimates suggest that teacher-induced variation in both math andreading achievement quickly erodes. Our point estimates indicate a one-year persis-tence of teacher value-added effects near one-fourth for math and one-fifth for read-ing. Furthermore, we find that the estimated persistence of nontest-based measuresof teacher effectiveness is, at best, equal to that of value-added measures. Theseresults are robust to a number of specification checks and suggest that depreciationof a similar magnitude applies to different student racial, gender, and socioeconomicgroups. Further estimates suggest that only about one-sixth of the original studentgains from a high value-added teacher persist over two years. We further discusswhat these estimates can tell us about the relative importance of three fadeout mech-anisms: forgetting, compensatory investment, and future learning rates.
In general, our evidence suggests that even consistent estimates of single-periodteacher quality effects drastically overstate the relevant long-run increase in studentknowledge. Our results highlight the potential importance of incorporating accuratepersistence measures in educational policy evaluation and suggest a comparativeframework for implementation.
This paper focuses on the persistence of teacher effects, an issue which is distinctfrom the potential bias in teacher value-added estimates due to omitted variables or
Jacob, Lefgren, and Sims 917
nonrandom assignment of teachers. However, we are still concerned about the po-tential effects of this bias on our estimates, and we discuss this issue in detail below.We believe that at a minimum our estimates still present a useful upper bound tothe true persistence of teacher effects on student achievement.
The remainder of the paper proceeds as follows. Section II introduces the statis-tical model of student learning, Section III discusses the motivation for examiningthe persistence of teacher quality, Section IV outlines the data, Section V presentsthe results, and Section VI contains a short discussion of the paper’s conclusions.
II. A Statistical Model
This section outlines a model of student learning that incorporatespermanent as well as transitory learning gains. Our goal is to explicitly illustratehow learning in one period is related to knowledge in subsequent periods. Usingthis model, we demonstrate how the parameter of interest, the persistence of a par-ticular measurable education input, can be recovered via instrumental variables as aparticular local average treatment effect (Imbens and Angrist 1994). We initiallymotivate this strategy in the context of teacher quality, but then generalize the modelto consider other educational interventions.
A. Base Model
In order to control for past student experiences, education researchers often employempirical strategies that regress (mean zero measures of) current achievement onlagged achievement, namely
Y ��Y �ε ,(1) t t�1 t
with the common result that the OLS estimate of is less than one. This result is�typically given one of two interpretations: Either the lagged achievement score ismeasured with error due to factors such as guessing, test conditions, or variation inthe set of tested concepts, or the coefficient represents the constant depreciation ofknowledge over time.
In order to explore the persistence of knowledge, it is useful to specify the learningprocess underlying these test scores. To begin, suppose that true knowledge in anyperiod is a linear combination of what we describe as “long-term” and “short-term”knowledge, which we label with the subscripts l and s. With a t subscript to identifytime period, this leads to the following representation:
Y �y �y .(2) t l,t s,t
As the name suggests, long-term knowledge remains with an individual for mul-tiple periods, but is allowed to decay over time. Specifically, we assume that itevolves according to the following process:
y ��y �� �� .(3) l,t l,t�1 l,t l,t
918 The Journal of Human Resources
where indicates the rate of decay and is assumed to be less than one in order to�make stationary.1 The second term, , represents a teacher’s contribution toy �l l,t
long-term knowledge in period t. The final term, , represents idiosyncratic factors�l,t
affecting long-term knowledge.In contrast, short-term knowledge reflects skills and information a student has in
one period that decays entirely by the next period.2 Short-run knowledge evolvesaccording to the following process:
y �� �� ,(4) s,t s,t s,t
which mirrors Equation 3 above when , the persistence of long-term knowledge,�is zero. Here, the term represents a teacher’s contribution to the stock of short-�s,t
term knowledge and captures other factors that affect short-term performance.�s,t
The same factors that affect the stock of long-term knowledge also could impactthe amount of short-term knowledge. For example, a teacher may help students tointernalize some concepts, while only briefly presenting others immediately prior toan exam. The former concepts likely form part of long-term knowledge while thelatter would be quickly forgotten. Thus it is likely that a given teacher affects bothlong- and short-term knowledge, though perhaps to different degrees.
It is worth noting that variation in knowledge due to measurement error is ob-servationally equivalent to variation due to the presence of short-run (perfectly de-preciable) knowledge in this model, even though these may reflect different under-lying mechanisms. For example, both a teacher cheating on behalf of students anda teacher who effectively helps students internalize a concept that is tested in onlya single year would appear to increase short-term as opposed to long-term knowl-edge. Similarly, a student always forgetting material of a particular nature wouldappear as short-term knowledge.3 Consequently, our persistence estimates do notdirectly distinguish between short-run knowledge that is a consequence of limitationsin the ability to measure achievement and short-run knowledge that would have realsocial value if the student retained it.
In most empirical contexts, the researcher only observes the total of long- andshort-run knowledge, , as is the case when one can only observe aY �y �yt l,t s,t
single test score. For simplicity we initially assume that , , , and are� � � �l,t l,t s,t s,t
independently and identically distributed, although we will relax this assumptionlater.4 It is then straightforward to show that when considering this composite testscore, , in the typical “value-added” regression model given by Equation 1, theYt
OLS estimate of converges to:�
1. This assumption can be relaxed if we restrict our attention to time-series processes of finite duration.In such a case, the variance of would tend to increase over time.yl,t
2. The same piece of information may be included as a function of either long-term or short-term knowl-edge. For example, a math algorithm used repeatedly over the course of a school year may enter long-term knowledge. Conversely, the same math algorithm, briefly shown immediately prior to the adminis-tration of an exam, could be considered short-term knowledge.3. This presupposes that understanding the concept does not facilitate the learning of a more advancedconcept which is subsequently tested.4. Note that both the process for long-run and short-run knowledge accumulation are stationary implyingchildren have no upward learning trajectory. This is clearly unrealistic. The processes, however, can bereinterpreted as deviations from an upward trend.
Jacob, Lefgren, and Sims 919
2 2 2� � ��y � �l l lˆplim(� )�� �� .(5) OLS 2 2 2 2 2 2� �� (1��)(� �� )�� ��y y � � � �l s s s l l
Thus, OLS identifies the persistence of long-run knowledge multiplied by the frac-tion of variance in total knowledge attributable to long-run knowledge. In otherwords, one might say that the OLS coefficient measures the average persistence ofobserved knowledge. The formula above also illustrates the standard attenuation biasresult if we reinterpret short-term knowledge as measurement error.
This model allows us to leverage different identification strategies to recover al-ternative parameters of the data generating process. Suppose, for example, that weestimate Equation 3 using instrumental variables with a first-stage relationship givenby:
Y ��Y �� ,(6) t�1 t�2 t
where lagged achievement is regressed on twice-lagged achievement. We will referto the estimate of from this identification strategy as , where the subscript isˆ� �LR
an abbreviation for long-run. It is again straightforward to show that this estimateconverges to:
ˆplim(� )�� ,(7) LR
which is the persistence of long-run knowledge. Our estimates suggest that thispersistence is close to one.
Now consider what happens if we instrument lagged knowledge, , with theYt�1
lagged teacher’s contribution (value-added) to total lagged knowledge. The first stageis given by:
Y ��H �� ,(8) t�1 t�1 t
where the teacher’s total contribution to lagged knowledge is a combination of hercontribution to long- and short-run lagged knowledge, . In thisH �� ��t�1 l,t�1 s,t�1
case, the second-stage estimate, which we refer to as converges to:�̂VA
2��lˆplim(� )�� .(9) VA 2 2� ��� �l s
The interpretation of this estimator becomes simpler if we think about the dual roleof teacher quality in our model. Observed teacher value-added varies for two rea-sons: the teacher’s contribution to long-term knowledge and her contribution toshort-term knowledge. Given our estimates of �, the persistence of long-run knowl-edge, are roughly equal to one, approximates the fraction of variation in teacher�̂VA
quality attributable to long-term knowledge creation. Fundamentally, the differencesin persistence identified by the three estimation procedures above are a consequenceof different sources of identifying variation. For example, estimation of gen-�̂OLS
erates a persistence measure that reflects all sources of variation in knowledge, frombarking dogs to parental attributes to policy initiatives. On the other hand, an in-strumental variables strategy isolates variation in past test scores due to a particular
920 The Journal of Human Resources
factor or intervention.5 Consequently, the estimated persistence of achievement gainscan vary depending on the chosen instrument, as each identifies a different localaverage treatment effect. In our example, measures the persistence in test scores�̂VA
due to variation in teacher value-added in isolation from other sources of test scorevariation while measures the persistence of long-run knowledge, that is, achieve-�̂LR
ment differences due to prior knowledge.This suggests a straightforward generalization: to identify the coefficient on lagged
test score using an instrumental variables strategy, one can use any factor that isorthogonal to as an instrument for in identifying . Thus, for any educationalε y �t it�1
intervention for which assignment is uncorrelated to the residual, one can recoverthe persistence of treatment-induced learning gains by instrumenting lagged perfor-mance with lagged treatment assignment. Within the framework above, suppose that
and , where and reflect the treatment’s impact on� � treat � � treat lt l t st s t l s
long- and short-term knowledge respectively.6 In this case, instrumenting laggedobserved knowledge with lagged treatment assignment yields an estimator whichconverges to the following:
lˆplim(� )�� .(10) TREAT �l s
The estimator reflects the persistence of long-term knowledge multiplied by thefraction of the treatment-related test score increase attributable to gains in long-termknowledge.
A standard approach to estimating the persistence of treatment effects is to simplycompare the ratio of coefficients from separate treatment effect regressions at dif-ferent points in the future. For example, one might estimate the impact of a child’scurrent fifth grade teacher on her contemporaneous fifth grade test scores, and thenin a second regression estimate the impact of the child’s former (in this case fourthgrade) teacher on her fifth grade test scores. The ratio of the teacher coefficient fromthe second regression to the analogous coefficient in the first regression provides ameasure of the one-year persistence of the teacher effect.
While this approach does provide a measure of persistence, our approach has anumber of advantages over the informal examination of coefficient ratios. First, itprovides a straightforward way to both compute estimates and conduct inference onpersistence measures through standard t- and F-tests.7 Second, the estimates of
and serve as intuitive benchmarks that allow an understanding of theˆ ˆ� �LR OLS
relative importance of teacher value-added as opposed to test scaling effects. Theyallow us to examine the persistence of policy-induced learning shocks relative tothe respective effects of transformative learning and a “business as usual” index ofeducational persistence. Finally, the methodology can be applied to compare persis-
5. Given a different data generating process the structural interpretation of and may change butˆ ˆ� �OLS LR
they will still retain the LATE interpretation as the persistence arising from all sources of achievementvariation and long-run differences in achievement respectively.6. While treat could be a binary assignment status indicator, it could also specify a continuous policyvariable such as educational spending or class size.7. In our framework, a test of the hypothesis that different educational interventions have different ratesof persistence can be implemented as a standard test of over-identifying restrictions.
Jacob, Lefgren, and Sims 921
tence among policy treatments including those that may be continuous or on differentscales such as hours of tutoring versus number of students in a class.
B. Extensions
Returning to our examination of the persistence of teacher-induced learning gains,we relax some assumptions regarding our data generating process to highlight al-ternative interpretations of our estimates as well as threats to identification. First,consider a setting in which a teacher’s impacts on long- and short-term knowledgeare not independent. In that case converges to:�̂VA
2� �cov(� ,� ) cov(� ,H)� l s llˆplim(� )�� �� .(11) VA 2 2 2� �� �2cov(� ,� ) �� � l s Hl s
While maintains the same interpretation, the remainder of the expression is equiv-�alent to the coefficient from a bivariate regression of on . In other words, it� Hl
captures the rate at which a teacher’s impact on long-term knowledge increases withthe teacher’s contribution to total measured knowledge.
Another interesting consequence of relaxing this independence assumption is thatneed not be positive. In fact, if will be negative. This2� cov(� ,� )��� , �VA l s � VAl
can only be true if . This would happen if observed value-added captured2 2� � �� �l s
primarily a teacher’s ability to induce short-term gains in achievement and this isnegatively correlated to a teacher’s ability to raise long-term achievement. Althoughthis is an extreme case, it is clearly possible and serves to highlight the importanceof understanding the long-run impacts of teacher value-added.8,9
Although relaxing the independence assumption does not violate any of the re-strictions for satisfactory instrumental variables identification, can no longer be�VA
interpreted as a true persistence measure. Instead, it identifies the extent to whichteacher-induced achievement gains predict subsequent achievement.
However, there are some threats to identification that we initially ruled out byassumption. For example, suppose that cov , as would occur if school(� ,� )�0l,t l,t
administrators systematically allocate children with unobserved high learning to thebest teachers. The opposite could occur if principals assign the best teachers tochildren with the lowest learning potential. In either case, the effect on our estimatedepends on the sign of the covariance, since:
2� �cov(� ,� )� l llˆplim(� )�� .(12) VA 2 2� ��� �l s
8. The teacher cheating in Chicago identified by Jacob and Levitt (2003) led to large observed performanceincreases, but was correlated to poor actual performance in the classroom. Also, Carrell and West (2008)show that short run value-added among Air Force Academy Faculty is negatively correlated to long-runvalue-added.
9. In general, the is bounded between when the correlation between short and long��lˆplim(� ) �VA
� ��� �l s
run value-added is �1 and when it is 1.��l�
� ��� �l s
922 The Journal of Human Resources
If students with the best idiosyncratic learning shocks are matched with high-qualityteachers, the estimated degree of persistence will be biased upward. In the contextof standard instrumental variables estimation, lagged teacher quality fails to satisfythe necessary exclusion restriction because it affects later achievement through itscorrelation with unobserved educational inputs. To address this concern, we showthe sensitivity of our persistence measures to the inclusion of student-level covariatesand contemporaneous classroom fixed effects in the second-stage regression, whichwould be captured in the term. Indeed, the inclusion of student covariates reduces�l
the estimated persistence measure, which suggests that such a simple positive selec-tion story is the most likely and our persistence measures are overestimates of truepersistence. On the other hand, Rothstein (2010) argues that the matching of teachersto students is based in part on transitory gains on the part of students in the previousyear. This story might suggest that we underestimate persistence, as the studentswith the largest learning gains in the prior year are assigned the least effectiveteachers in the current year.
Another potential problem is that teacher value-added may be correlated over timefor an individual student. If this correlation is positive, perhaps because motivatedparents request effective teachers every period, the measure of persistence will bebiased upward. We explore this prediction by testing how the coefficient estimateschange when we omit our controls for student level characteristics. In our case theinclusion of successive levels of control variables monotonically reduces our persis-tence estimate, as the positive sorting story would predict.
III. Background
A. Teacher Quality and Value-Added Measures
A number of recent studies suggest an important role for teacher quality in elemen-tary and secondary education based on its effects on contemporaneous test scores.Their prevalence suggests that this is an important area in which to examine the roleof long-run versus short-run learning as described in our model. One branch of thesestudies indicates that some observable teacher characteristics such as certification,experience, and principal evaluations may have small but statistically significanteffects on student test scores (Kane, Rockoff, and Staiger 2008; Clotfelter, Ladd,and Vidgor 2006; Jacob and Lefgren 2007). Another branch uses sophisticated em-pirical models to attempt to isolate an individual teacher’s whole contribution tostudent test scores. These latter studies consistently find substantial variation inteacher effectiveness. For example, the findings of Rockoff (2004) and Rivkin, Han-ushek, and Kain (2005) both suggest a one standard deviation increase in teacherquality improves student math scores around 0.1 standard deviations. Aaronson,Barrow, and Sander (2007) find similar results using high school data. In compari-son, it would require a 4–5 student decrease in class size to achieve the same effectas a one standard deviation increase in teacher value-added (Angrist and Lavy 1999).
This research has inspired proposals that seek to use value-added metrics to eval-uate the effectiveness of classroom teachers for compensation or tenure purposes(Doran and Izumi 2004; McCaffrey et al. 2004). Given the poor record of singleyear test scores (Kane and Staiger 2002) or even principal evaluations (Jacob and
Jacob, Lefgren, and Sims 923
Lefgren 2008) in differentiating among certain regions of the teacher quality distri-bution, the increasing use of value-added measures seems likely wherever the datarequirements can be met.
At the same time, a number of recent studies (Andrabi et al. 2008; McCaffrey etal. 2004; Rothstein 2010; Todd and Wolpin 2003, 2006) highlight the strong as-sumptions of the most commonly used value-added models, suggesting that they areunlikely to hold in observational settings. The most important of these assumptionsin our present context is that the assignment of students to teachers is random. Indeedgiven random assignment of students to teachers, many of the uncertainties regardingprecise functional form become less important. If students are not assigned randomlyto teachers, positive outcomes attributed to a given teacher may simply result fromteaching better students. In particular, Rothstein (2010) raises disturbing questionsabout the validity of current teacher value-added measurements, showing that thecurrent performance of students can be predicted by the value-added of their futureteachers.
However, in a recent attempt to validate observationally derived value-addedmethods with experimental data, Kane and Staiger (2008) were unable to reject thehypothesis that the observational estimates were unbiased predictions of studentachievement in many specifications. Indeed, one common result seems to be thatmodels that control for lagged test scores, such as our model, tend to perform betteragainst these criticisms than gains models.
B. Prior Literature
As Todd and Wolpin (2003) note, much of the early research on teacher value-addedfails to explicitly consider the implications of imperfect persistence. For example,the Rivkin, Hanushek, and Kain (2005) scenario of “five good teachers” assumesperfect persistence of student gains due to teacher quality. As a result, these studiesimply that variation in test score increases due to policy changes will have long-runconsequences equivalent to those of test score increases that come from increasedparental investment or innate student ability.
The first paper to explicitly consider the issue of persistence in the effect ofteachers on student achievement was a study by McCaffery et al. (2004). Althoughtheir primary objective is to test the stability of teacher value-added models to vari-ous modeling assumptions, they also provide parameter estimates from a generalmodel that explicitly considers the one- and two-year persistence of teacher effectson math scores for a sample of 678 third through fifth graders from five schools ina large school district. Their results suggest one-year persistence of 0.2 to 0.3 andtwo-year persistence of 0.1. However, due to the small sample the standard errorson each of these parameter estimates was approximately 0.2.
In a later article, Lockwood et al. (2007) produce a Bayesian formulation of thissame model, which they use to estimate persistence measures for a cohort of ap-proximately 10,000 students from a large urban school district over five years. Usingthis computationally demanding methodology, they produce persistence estimatesthat are in all cases below 0.25 with relatively small confidence intervals that excludezero and appear very similar for both reading and mathematics. They also note thatuse of models that assume perfect persistence produce significantly different teachervalue-added estimates.
924 The Journal of Human Resources
More recently, a contemporary group of teacher value-added studies have emergedthat recognize the importance of persistence. For example, Kane and Staiger (2008)use a combination of experimental and nonexperimental data from Los Angeles toexamine the degree of bias present in value-added estimates due to nonrandomassignment of students to teachers. They note that coefficient ratios taken from theirresults imply a one-year math persistence of one-half and a language arts persistenceof 60–70 percent. When they expand their sample to include a more representativegroup of students and control for additional student characteristics, their persistenceestimates drop to near one-fourth. Similarly, Rothstein (2010) mentions the impor-tance of measuring fadeout and presents evidence of persistence effects for a par-ticular teacher around 40 percent. Carrell and West (2008) present evidence thatmore experienced university professors at the Air Force academy induce lower butmore persistent variation in student learning.
In summary, while the recent teacher value-added literature has come to recognizethe need to account for persistence, it and the broader education production literaturestill lack a straightforward, systematic way to test hypotheses about persistence andto make cross-program persistence comparisons. Persistence is usually inferred asthe informal ratio of coefficients from separate regressions, abstracting from theconstruction and scaling of the particular exam scores. This seems to be an importantomission given previous research suggesting decay rates for educational interven-tions that vary widely across programs; from long-term successes such as the Ten-nessee class size experiment (Nye, Hedges, and Konstantopoulos 1999; Krueger andWhitmore 2001) or the Perry preschool project (Barnett 1985), to programs with nopersistent academic effects such as Head Start (Currie and Thomas 1995) or graderetention for sixth graders (Jacob and Lefgren 2004).
C. Interpreting Persistence
Our measure of persistence reflects three different mechanisms. First, students mayforget information or lose skills that they acquired as a result of a particular teacheror intervention. Second, students or schools may engage in potentially endogenoussubsequent investments, which either mitigate or exacerbate the consequences ofassignment to a particular teacher or intervention. Third, our persistence measuredepends on how the knowledge learned from a particular teacher influences studentlearning of new material.
The use of different performance measures across years also will influence theinterpretation of the persistence measure, though we view this not as a separatemechanism, but rather as a factor that affects the weights placed on the three mech-anisms described above. Consider, for example, differences in test content acrossyears. To the extent that the knowledge and skills involved in Geometry and Algebraare largely distinct, then the effect of an excellent Algebra teacher may appear tofade out in the following year when the student is tested only in geometry. In thiscase, observed persistence will primarily reflect the usefulness of the past interven-tion in learning new knowledge. In an extreme case, it is possible that each grade’stest represents a largely unique subject matter, so that the persistence of test scorescould appear low while an excellent teacher in each grade could raise contemporarylearning valued by the labor market. However, given that our analysis focuses on
Jacob, Lefgren, and Sims 925
elementary school math and reading, in which there is considerable overlap fromyear to year, this extreme case seems unlikely. Hence, in our analysis, we believethat persistence will largely reflect the first two mechanisms, forgetfulness and com-pensatory investments.
Changes over time in the statistical properties of a test, such as variance, also mayaffect the interpretation of a persistence estimate. If observed performance capturesneither a cardinal measure of performance nor a uniformly measured rank, it isimpossible to arrive at a unique, interpretable estimate of persistence. For example,suppose the test metric functions as an achievement ranking but the variance of theperformance metric differs across years. In such cases, the observed persistencemeasure will reflect both the fadeout of teacher-induced changes in rank as well asthe cross-year heteroskedasticity of achievement measures. Whatever the true per-sistence in knowledge, the test scale can be compressed or stretched to produce anydesired estimate of fadeout.
This might lead some observers to discount the usefulness of persistence measuresin general or reject those estimates they find disagreeable. To us, however, thispotential sensitivity of observed persistence to test scale effects underscores theimportance of establishing baseline measures of the general persistence of knowledgeto which the persistence of teacher-induced knowledge can be compared. In thisstudy, we present two such benchmarks, which allow us to compare the persistenceof teacher-induced learning to more familiar sources of variation.
One final concern with interpreting our persistence measures involves the possi-bility of test manipulation. For example, Jacob and Levitt (2003) document a numberof cases of teacher cheating, which led to large observed performance increases inone year that did not persist in subsequent years. Similarly, Carrell, and West’s(2008) finding that teacher effects from one year of class can be negatively correlatedwith future years’ exam scores is likely explained by contrasting just such a short-run strategic focus on the part of some teachers with a forward-looking approachon the part of other instructors. Such behaviors would manifest themselves in lowobserved persistence that one might ascribe to poor test measurement—that is, onemight argue that there was no true learning in such cases in the first place.
IV. Data
A. The Sample
To measure the persistence of teacher-induced learning gains, we use a data setderived from North Carolina school administrative records maintained by the NorthCarolina Education Research Data Center. The primary data consists of student-yearobservations for all students in third through sixth grades in the state from 1997–2004.10 During this time period North Carolina required end-of-course standardizedexams for all these students in both reading and mathematics that were closelyaligned to the state’s learning standards.
10. We thank Jacob Vigdor for providing us with the data used in Clotfelter, Ladd, and Vigdor (2007)for our analysis.
926 The Journal of Human Resources
We follow the practice of earlier researchers (Clotfelter, Ladd, and Vigdor 2007)by standardizing the North Carolina scores to reflect standard-deviation units relativeto the state average for that grade and year. Thus, our resulting persistence measurecaptures the degree to which a teacher’s ability to change a student’s rank (measuredin standard deviations) in the achievement distribution is manifest in the student’srank in subsequent years. This relative measure not only allows for comparabilityof our results with the prior literature, but also captures the effect of a policy on theranking of a student at some future date such as entry into the labor market. Wealso show in our robustness checks that our results are robust to the use of scaledscores, which are designed to approximate an absolute measure of learning.
These student-year records can be matched to personnel record data for classroomteachers that contain information on teacher experience, credentials, and certification.We follow the algorithm described in detail in Clotfelter, Ladd, and Vigdor (2007)to match teachers to students.11 This allows an approximately 79 percent matchsuccess rate for a student’s prior year teacher (for whom we wish to calculate per-sistence). Because the most accurate matching of students to teachers is only possiblefor third through fifth grade students in this data, and because we require one yearof lagged test scores as an instrument to capture long-run learning persistence, wecalculate value-added over the set of fourth and fifth grade teachers, and measureoutcomes for these students in fifth and sixth grades.12 Beyond the matching errorrate, the measurement of teacher experience may be a concern as it is calculated asthe years for which the teacher is given credit on the salary schedule, (whether thoseyears were in North Carolina or not) a potentially noisy measure of true experience.
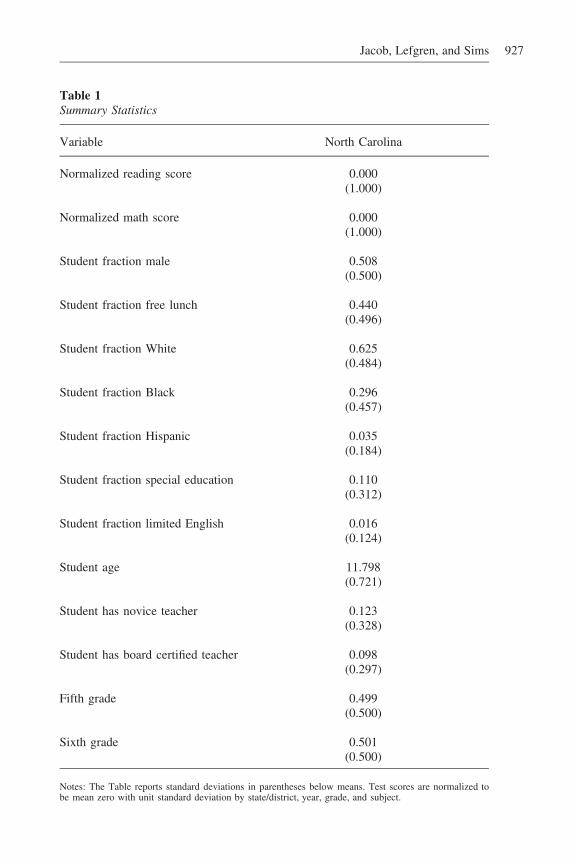
Table 1 reports summary statistics including the basic demographic controls forstudent race, ethnicity, free lunch, and special education status available in the data.While the North Carolina sample is close to the national average in free luncheligibility (44 percent compared to 42 percent nationally), it actually has smallerthan average minority enrollments, comprised mainly of African-American students,and has only a small percentage of nonnative English speakers. About one-eighthof students in North Carolina have a novice teacher (a teacher in his or her first twoyears of teaching), and a relatively large proportion of teachers, almost 10 percent,receive national board certification at some point in the sample period. This latterfigure is likely driven by the 12 percent salary premium attached to this certification.
B. Estimating Teacher Value-Added
To measure the persistence of teacher-induced learning gains we must first estimateteacher value-added. Consider a learning equation of the following form.
test ��test �X C�� �� �ε ,(13) ijt it�1 it j jt ijt
11. The teachers identified in the student test file are those that proctored the exam, not necessarily thosethat taught the class. The authors describe the three-tiered system of matching students to actual teachers.The first assigns the proctor as the teacher if the proctor taught the correct grade and subject that year.They also look at the composition of the test taking students and compare it with the composition ofstudents in classes from the teacher file to find matches.12. When examining two year depreciation rates we use the same students a year later when they are ingrades 6 and 7.
Jacob, Lefgren, and Sims 927
Table 1Summary Statistics
Variable North Carolina
Normalized reading score 0.000(1.000)
Normalized math score 0.000(1.000)
Student fraction male 0.508(0.500)
Student fraction free lunch 0.440(0.496)
Student fraction White 0.625(0.484)
Student fraction Black 0.296(0.457)
Student fraction Hispanic 0.035(0.184)
Student fraction special education 0.110(0.312)
Student fraction limited English 0.016(0.124)
Student age 11.798(0.721)
Student has novice teacher 0.123(0.328)
Student has board certified teacher 0.098(0.297)
Fifth grade 0.499(0.500)
Sixth grade 0.501(0.500)
Notes: The Table reports standard deviations in parentheses below means. Test scores are normalized tobe mean zero with unit standard deviation by state/district, year, grade, and subject.
928 The Journal of Human Resources
where is a test score for individual i in period t, is a set of potentially timetest Xit it
varying covariates, captures teacher value-added, reflects period specific class-� �j jt
room factors that affect performance (for example, a test administered on a hot dayor unusually good match quality between the teacher and students), and is a meanεit
zero residual.We have two concerns about our estimates of teacher value-added. The first,
discussed earlier, is that the value-added measures may be inconsistent due to thenonrandom assignment of students to teachers. The second is that the imprecisionof our estimates may affect the implementation of our strategy. Standard fixed effectsestimation of teacher value-added relies on test score variation due to classroom-specific learning shocks, , as well as student specific residuals, . Because of� εjt ijt
this, the estimation error in teacher value-added will be correlated to contempora-neous student achievement and fail to satisfy the necessary exclusion restrictions forconsistent instrumental variables identification.
To avoid this problem, we estimate the value-added of a student’s teacher thatdoes not incorporate information from that student’s cohort. Specifically, for eachyear by grade set of student observations we estimate a separate regression of theform:
test ��test �X C� �� ,(14) ijy iy�1 iy jy ijy
where indexing of student and teacher remains as above and y now indexes year. Xis a vector of control variables including the student’s age, race, gender, free-luncheligibility, special education placement, and limited English proficiency status. Thenfor each student i with teacher j in year t we compute an average of his teacher’svalue-added measures across all years in which that student was not in the teacher’sclassroom, but in the same school.
� � (15) ijt � jyy � t
Consider, for example, a teacher who taught in school A from 1995–99 and in schoolB from 2000–2003. For a student in the teacher’s class in 1996, we use a value-added measure that incorporates data from that teacher’s classes in 1995 and 1997–99. For a student in the teacher’s class in 2000, we use a value-added measureincorporating data from 2001–2003.13 The estimation error of the resulting value-added measures will be uncorrelated to unobserved classroom-specific determinants
of the reference student’s achievement. As discussed later, the results of our�jt
estimation are robust to various specifications of the initial value-added equation.Our second-stage equation for estimating the persistence of teacher value-added
then becomes:
test �� test �X C�� �� � �ε(16) ijt�1 VA it it�1 jt�1 t�1 g ijt�1
13. Teachers who taught for only one year have a missing value-added measure. They are removed fromconsideration using a dummy variable for missing teacher VA in the second stage (hence their missingstatus is not used for identification). For comparability, we exclude single-year teachers from later reducedform estimates.
Jacob, Lefgren, and Sims 929
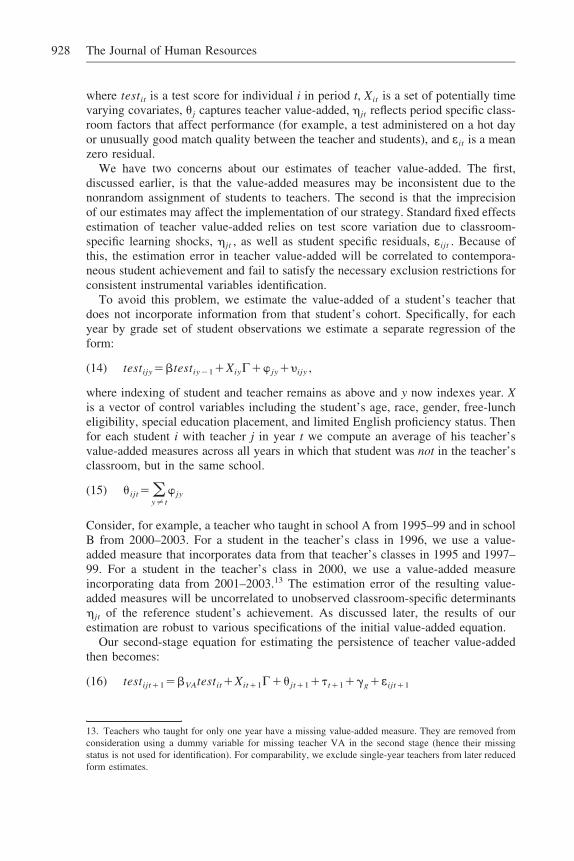
Table 2Estimates of the Persistence of Achievement
One Year Two Year
�̂OLS �̂LR �̂VA �̂OLS �̂LR �̂VA
A. ReadingPrior year achievementcoefficient
0.68**(0.001)
0.97**(0.001)
0.20**(0.02)
0.62**(0.002)
0.90**(0.002)
0.18**(0.02)
F-Statistic of instruments 300,000 2,192 260,000 2,347[p-value]
—[0.00] [0.00]
—[0.00] [0.00]
Observations 1.3 mil 1.3 mil 1.3 mil 1.1 mil 1.1 mil 1.1 milR-Squared 0.74 0.58 0.50 0.69 0.51 0.42
B. MathPrior year achievementcoefficient
0.71**(0.001)
0.95**(0.001)
0.27**(0.01)
0.63**(0.001)
0.87**(0.001)
0.16**(0.008)
F-Statistic of instruments 370,000 14,000 290,000 13,000[p-value]
—[0.00] [0.00]
—[0.00] [0.00]
Observations 1.3 mil 1.3 mil 1.3 mil 1.1 mil 1.1 mil 1.1 milR-Squared 0.80 0.67 0.58 0.78 0.59 0.46
Notes: Reported standard errors in parentheses correct for clustering at the classroom level. ** indicates 5percent significance.
where from Equation 15 serve as the excluded instruments in the first stage. The�ijt
specification includes the above mentioned student level controls as well as grade,year, and contemporary classroom (teacher) fixed effects. In our second stage, weinclude classroom fixed effects (which subsume school fixed effects). Thus, ourestimation relies exclusively on variation in teacher quality within a school.
V. Results
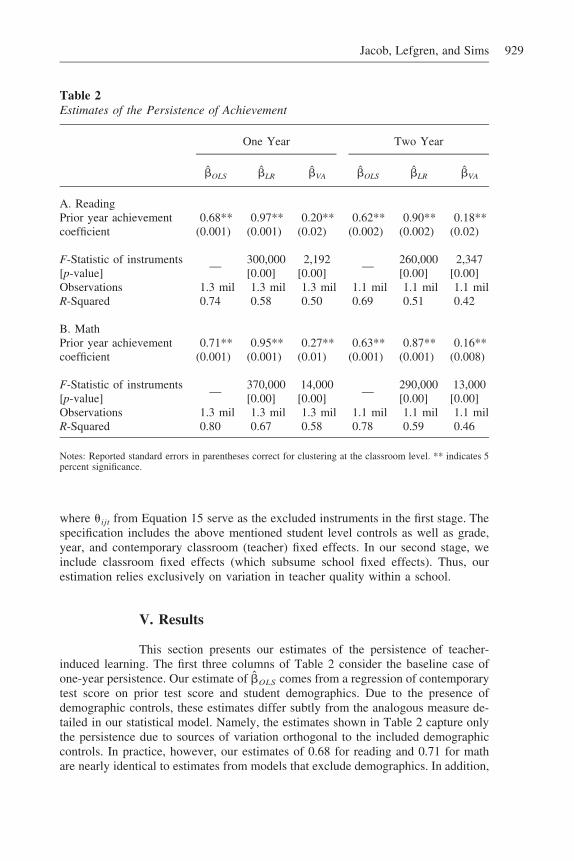
This section presents our estimates of the persistence of teacher-induced learning. The first three columns of Table 2 consider the baseline case ofone-year persistence. Our estimate of comes from a regression of contemporary�̂OLS
test score on prior test score and student demographics. Due to the presence ofdemographic controls, these estimates differ subtly from the analogous measure de-tailed in our statistical model. Namely, the estimates shown in Table 2 capture onlythe persistence due to sources of variation orthogonal to the included demographiccontrols. In practice, however, our estimates of 0.68 for reading and 0.71 for mathare nearly identical to estimates from models that exclude demographics. In addition,
930 The Journal of Human Resources
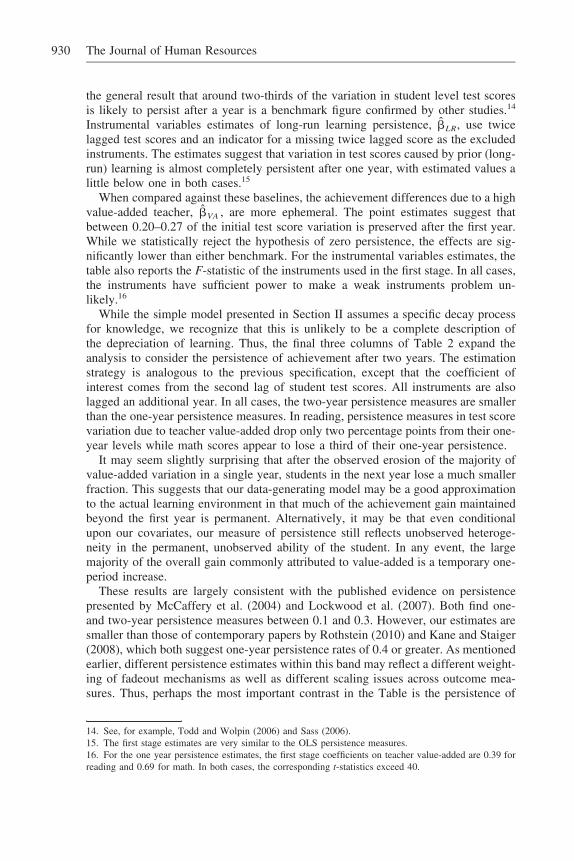
the general result that around two-thirds of the variation in student level test scoresis likely to persist after a year is a benchmark figure confirmed by other studies.14
Instrumental variables estimates of long-run learning persistence, , use twice�̂LR
lagged test scores and an indicator for a missing twice lagged score as the excludedinstruments. The estimates suggest that variation in test scores caused by prior (long-run) learning is almost completely persistent after one year, with estimated values alittle below one in both cases.15
When compared against these baselines, the achievement differences due to a highvalue-added teacher, , are more ephemeral. The point estimates suggest that�̂VA
between 0.20–0.27 of the initial test score variation is preserved after the first year.While we statistically reject the hypothesis of zero persistence, the effects are sig-nificantly lower than either benchmark. For the instrumental variables estimates, thetable also reports the F-statistic of the instruments used in the first stage. In all cases,the instruments have sufficient power to make a weak instruments problem un-likely.16
While the simple model presented in Section II assumes a specific decay processfor knowledge, we recognize that this is unlikely to be a complete description ofthe depreciation of learning. Thus, the final three columns of Table 2 expand theanalysis to consider the persistence of achievement after two years. The estimationstrategy is analogous to the previous specification, except that the coefficient ofinterest comes from the second lag of student test scores. All instruments are alsolagged an additional year. In all cases, the two-year persistence measures are smallerthan the one-year persistence measures. In reading, persistence measures in test scorevariation due to teacher value-added drop only two percentage points from their one-year levels while math scores appear to lose a third of their one-year persistence.
It may seem slightly surprising that after the observed erosion of the majority ofvalue-added variation in a single year, students in the next year lose a much smallerfraction. This suggests that our data-generating model may be a good approximationto the actual learning environment in that much of the achievement gain maintainedbeyond the first year is permanent. Alternatively, it may be that even conditionalupon our covariates, our measure of persistence still reflects unobserved heteroge-neity in the permanent, unobserved ability of the student. In any event, the largemajority of the overall gain commonly attributed to value-added is a temporary one-period increase.
These results are largely consistent with the published evidence on persistencepresented by McCaffery et al. (2004) and Lockwood et al. (2007). Both find one-and two-year persistence measures between 0.1 and 0.3. However, our estimates aresmaller than those of contemporary papers by Rothstein (2010) and Kane and Staiger(2008), which both suggest one-year persistence rates of 0.4 or greater. As mentionedearlier, different persistence estimates within this band may reflect a different weight-ing of fadeout mechanisms as well as different scaling issues across outcome mea-sures. Thus, perhaps the most important contrast in the Table is the persistence of
14. See, for example, Todd and Wolpin (2006) and Sass (2006).15. The first stage estimates are very similar to the OLS persistence measures.16. For the one year persistence estimates, the first stage coefficients on teacher value-added are 0.39 forreading and 0.69 for math. In both cases, the corresponding t-statistics exceed 40.
Jacob, Lefgren, and Sims 931
Table 3Robustness Checks
Reading Math
One YearPersistence
Two YearPersistence
One YearPersistence
Two YearPersistence
(1) Baseline 0.20**(0.02)
0.18**(0.02)
0.27**(0.01)
0.16**(0.01)
(2) Controlling only for grade,school, and year in secondstage
0.54**(0.02)
0.46**(0.02)
0.49**(0.01)
0.36**(0.02)
(3) Omitting year t classroomfixed effects from baseline
0.32**(0.02)
0.24**(0.02)
0.33**(0.01)
0.19**(0.01)
(4) Value-added using estimatedachievement gains
0.10**(0.02)
0.06**(0.02)
0.25**(0.01)
0.13**(0.01)
(5) Value-added using estimatedachievement gainsnormalized by initial score
0.15**(0.02)
0.12**(0.02)
0.26**(0.01)
0.14**(0.01)
(6) Top third of teacher qualitycompared to middle third
0.13**(0.05)
0.03(0.06)
0.27**(0.01)
0.12**(0.02)
(7) Bottom third of teacherquality compared to middlethird
0.25**(0.04)
0.26**(0.04)
0.29**(0.02)
0.19**(0.02)
(8) Test performance measuredin percentiles
0.20**(0.02)
0.17**(0.02)
0.28**(0.01)
0.16**(0.01)
(9) Test performance measuredin scale scores
0.20**(0.02)
0.18**(0.02)
0.28**(0.01)
0.16**(0.01)
Notes: Reported standard errors in parentheses correct for clustering at the classroom level.** indicates 5 percent significance. Though not reported, estimation results for benchmark are quite�̂LRconsistent across the table’s specifications with estimates on always in the 0.95–0.99 range for readingscores and the 0.93–0.97 range for math scores.
teacher value-added in relation to the benchmarks. If we think of as transfor-�̂LR
mative learning, we find that teacher value-added is only one-fourth to one-fifth aspersistent, as well as less than half as persistent as the average inputs mark repre-sented by .�̂OLS
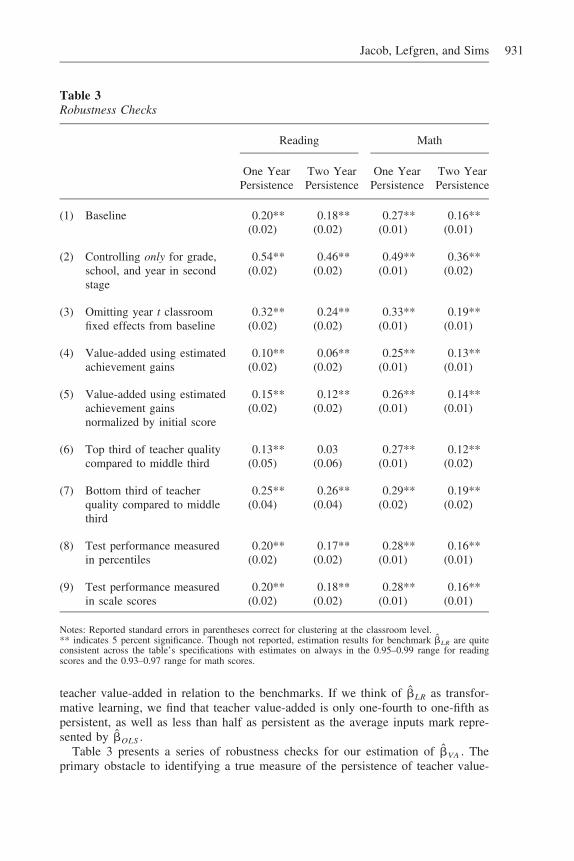
Table 3 presents a series of robustness checks for our estimation of . The�̂VA
primary obstacle to identifying a true measure of the persistence of teacher value-
932 The Journal of Human Resources
added is the possibility of nonrandom assignment of students to teachers, both con-temporaneously, and in prior years. Although we attempt to deal with this possibilitywith a value-added model and the inclusion of student characteristics in the regres-sion, it is still possible that we fail to account for systematic variation in the assign-ment of students to teachers. The first three rows of the table show that relaxing ourcontrol strategy results in increases to the estimated persistence. For example, omit-ting classroom effects (Row 3) from the regression leads to significant increases inthe estimated persistence, while dropping all other student controls leads the coef-ficients to increase by a third or more (Row 2). This demonstration of positiveselection on observables is consistent with our belief that our estimate reflects�̂VA
an upper bound in the face of likely positive selection on unobservables. Thus themost likely identification failure suggests an even lower persistence than we find inTable 2.
We have estimated our model using a representation of teacher value-added thatcontrols for lagged student achievement as it may avoid many of the problemsassociated with the value-added models denominated in terms of test score gains.However, the gains formulation remains popular and Rows 4–5 show the robustnessof our estimates to the use of a gains model in calculating our teacher value-addedmeasures. In the case of math, the switch to a gains specification of value-addedhas no meaningful effect and in the case of reading it serves only to decrease theestimated persistence by 25–50 percent.
To this point, we have only been measuring the average persistence of teacher-induced test score variation without considering whether the effects are symmetricwith respect to the sign of the shocks. Given that persistence measures might bedriven by students at the bottom catching up due to nonrandom school interventions,it seems important to examine the symmetry of the persistence effects. In otherwords, we wish to see whether the test score consequences of having an uncom-monly bad teacher are more or less lasting than the benefits of having an excep-tionally good teacher. Rows 6–7 of Table 3 show the comparison between effectsat the top and bottom of the respective distributions. In all cases, we are unable toreject equal persistence values for both sides of the teacher distribution, though thepoint estimates are larger for the lower tail.17
In the final two rows of Table 3, we examine the sensitivity of our estimates tothe scaling of the exam. In Row 8, we measure test performance as the achievedpercentile within state*year. In Row 9, we use the scale score measures, which arecommonly treated as if they possessed a cardinal interpretation. Despite ex-anteconcerns that the results may differ, they are surprisingly similar to our baselinesuggesting that our finding is not sensitive to the choice among a variety of sensible
17. To perform this comparison, we divide teachers into terciles on the basis of their value-added. Whenexamining the impact of being assigned a teacher in the top third, we instrument lagged value-added witha dummy variable that takes on a value of 1 if prior year teacher was in the top third of the value-addeddistribution. We include in the second stage a dummy variable indicating whether the prior year teacherwas in the bottom third. Thus we exploit only variation due to assignment to a teacher in the top third ofvalue-added relative to the middle third (the omitted category). When looking at the impact of assignmentto a poor teacher, we do the opposite.
Jacob, Lefgren, and Sims 933
academic performance measures. Furthermore, examination of the benchmark�̂LR
for scaled scores finds an estimate of 0.96 for both reading and math, quite close tothe standardized benchmark.
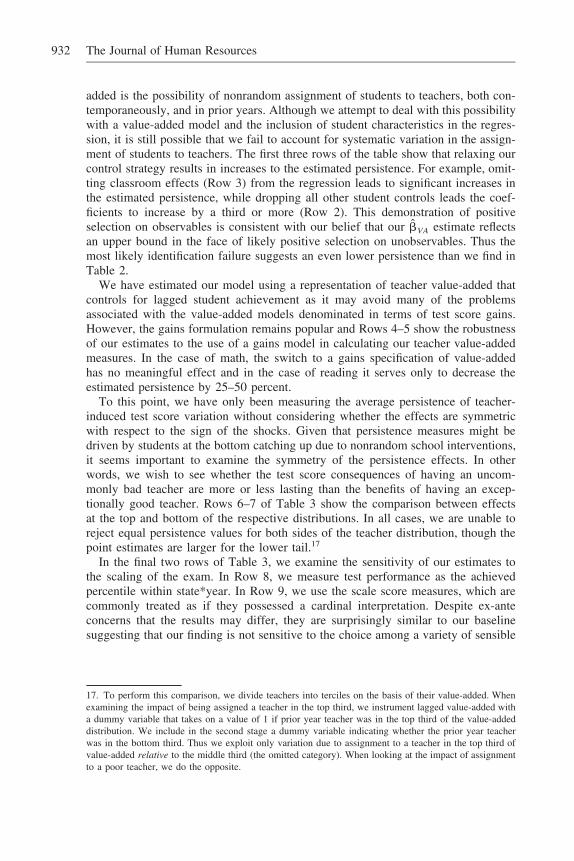
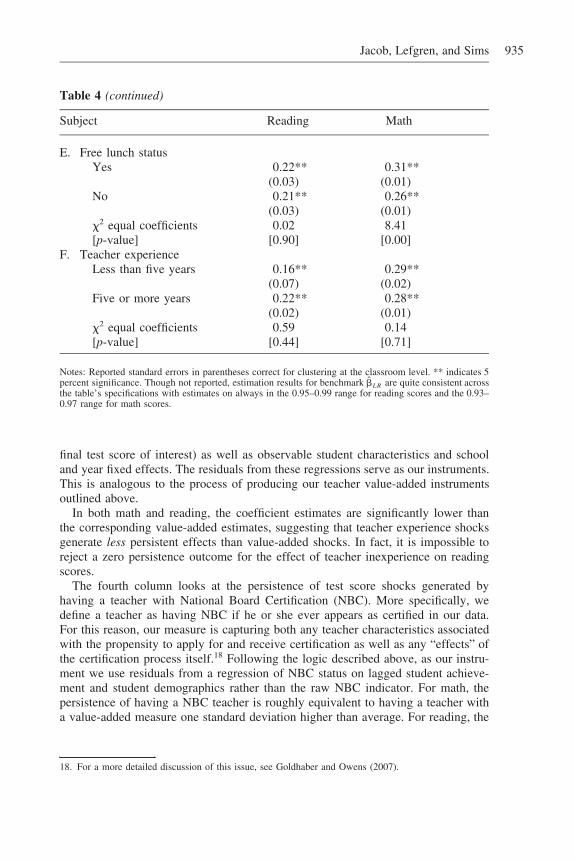
Since conclusions concerning the persistence of teacher quality might depend onthe heterogeneity of persistence across different groups of students, Table 4 showshow persistence estimates differ across measurable student characteristics as well asyear, grade, and teacher experience. For reading scores, there is no evidence ofstatistically significant heterogeneity of persistence effects across grade, gender, race,test year or free lunch status. For math scores, on the other hand, there appears tobe statistically significant differences in persistence across all the above groups ex-cept gender. However, the difference in actual magnitudes is small, with a rangebetween 0.03–0.05 for all categories except test year. This uniformity across studentgroups suggests our measure may be capturing a common effect. The final panel ofthe table suggests that the persistence of teacher effects is not meaningfully differentfor experienced versus inexperienced teachers.
For the specifications reported in Tables 3 and 4 it is also possible to estimateour benchmark . The results are quite consistent across specifications with es-�̂LR
timates always in the 0.95–0.99 range for reading scores and the 0.93–0.97 rangefor math scores. Given this small range we have chosen not to report all these valuesin the tables. Nevertheless, the benchmark results strengthen our case for comparingthe results of across specifications.�̂VA
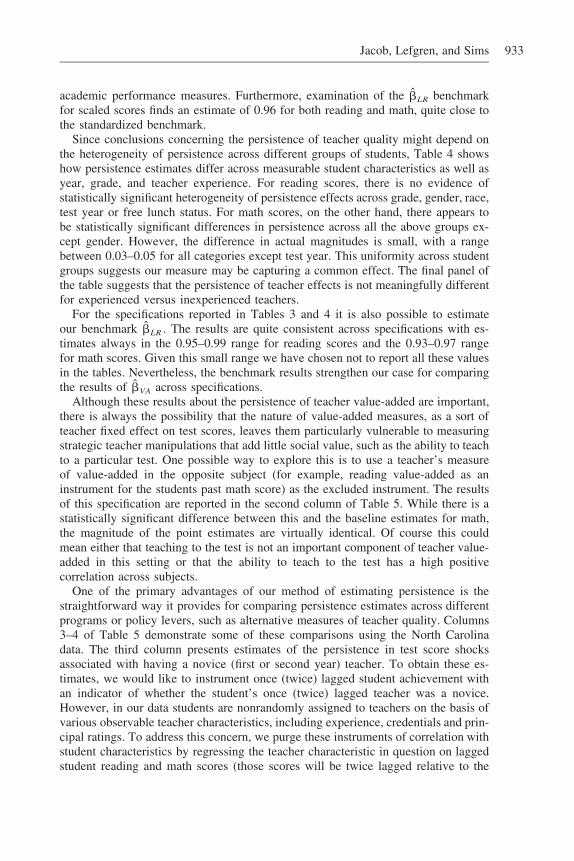
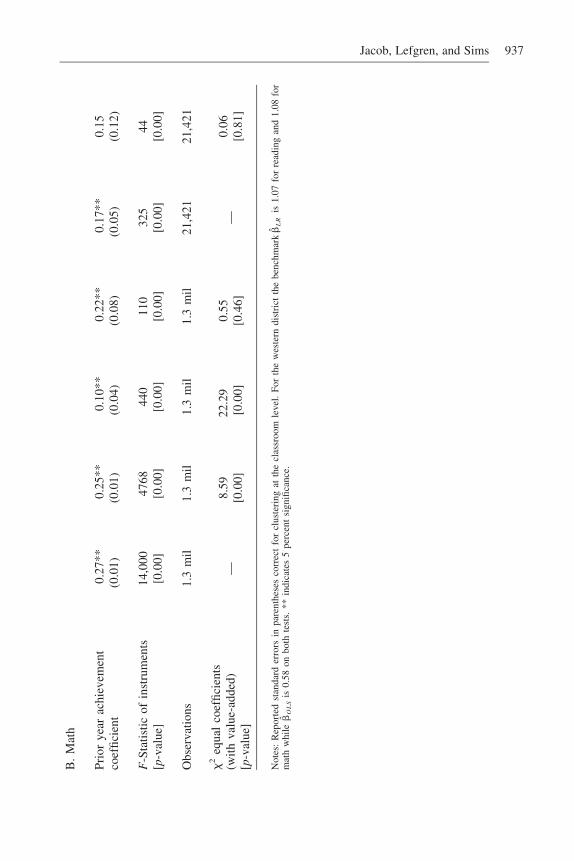
Although these results about the persistence of teacher value-added are important,there is always the possibility that the nature of value-added measures, as a sort ofteacher fixed effect on test scores, leaves them particularly vulnerable to measuringstrategic teacher manipulations that add little social value, such as the ability to teachto a particular test. One possible way to explore this is to use a teacher’s measureof value-added in the opposite subject (for example, reading value-added as aninstrument for the students past math score) as the excluded instrument. The resultsof this specification are reported in the second column of Table 5. While there is astatistically significant difference between this and the baseline estimates for math,the magnitude of the point estimates are virtually identical. Of course this couldmean either that teaching to the test is not an important component of teacher value-added in this setting or that the ability to teach to the test has a high positivecorrelation across subjects.
One of the primary advantages of our method of estimating persistence is thestraightforward way it provides for comparing persistence estimates across differentprograms or policy levers, such as alternative measures of teacher quality. Columns3–4 of Table 5 demonstrate some of these comparisons using the North Carolinadata. The third column presents estimates of the persistence in test score shocksassociated with having a novice (first or second year) teacher. To obtain these es-timates, we would like to instrument once (twice) lagged student achievement withan indicator of whether the student’s once (twice) lagged teacher was a novice.However, in our data students are nonrandomly assigned to teachers on the basis ofvarious observable teacher characteristics, including experience, credentials and prin-cipal ratings. To address this concern, we purge these instruments of correlation withstudent characteristics by regressing the teacher characteristic in question on laggedstudent reading and math scores (those scores will be twice lagged relative to the

934 The Journal of Human Resources
Table 4Heterogeneity of One-Year Depreciation Rates
Subject Reading Math
A. GradeFifth 0.21**
(0.03)0.26**
(0.01)Sixth 0.20**
(0.03)0.29**
(0.01) 2 equal coefficients 0.06 4.81[p-value] [0.81] [0.03]
B. GenderMale 0.18**
(0.03)0.27**
(0.01)Female 0.24**
(0.03)0.29**
(0.01) 2 equal coefficients 2.47 1.92[p-value] [0.11] [0.17]
C. Year1998 0.14**
(0.06)0.25**
(0.02)1999 0.17**
(0.06)0.24**
(0.02)2000 0.25**
(0.05)0.28**
(0.02)2001 0.23**
(0.05)0.26**
(0.02)2002 0.27**
(0.05)0.31**
(0.02)2003 0.17**
(0.05)0.26**
(0.02)2004 0.20**
(0.06)0.33**
(0.02) 2equal coefficients 5.39 17.59[p-value] [0.49] [0.01]
D. RaceWhite 0.19**
(0.03)0.26**
(0.01)Black 0.21**
(0.04)0.30**
(0.01) 2 equal coefficients 0.16 5.18[p-value] [0.69] [0.02]
(continued)
Jacob, Lefgren, and Sims 935
Table 4 (continued)
Subject Reading Math
E. Free lunch statusYes 0.22**
(0.03)0.31**
(0.01)No 0.21**
(0.03)0.26**
(0.01) 2 equal coefficients 0.02 8.41[p-value] [0.90] [0.00]
F. Teacher experienceLess than five years 0.16**
(0.07)0.29**
(0.02)Five or more years 0.22**
(0.02)0.28**
(0.01) 2 equal coefficients 0.59 0.14[p-value] [0.44] [0.71]
Notes: Reported standard errors in parentheses correct for clustering at the classroom level. ** indicates 5percent significance. Though not reported, estimation results for benchmark are quite consistent across�̂LRthe table’s specifications with estimates on always in the 0.95–0.99 range for reading scores and the 0.93–0.97 range for math scores.
final test score of interest) as well as observable student characteristics and schooland year fixed effects. The residuals from these regressions serve as our instruments.This is analogous to the process of producing our teacher value-added instrumentsoutlined above.
In both math and reading, the coefficient estimates are significantly lower thanthe corresponding value-added estimates, suggesting that teacher experience shocksgenerate less persistent effects than value-added shocks. In fact, it is impossible toreject a zero persistence outcome for the effect of teacher inexperience on readingscores.
The fourth column looks at the persistence of test score shocks generated byhaving a teacher with National Board Certification (NBC). More specifically, wedefine a teacher as having NBC if he or she ever appears as certified in our data.For this reason, our measure is capturing both any teacher characteristics associatedwith the propensity to apply for and receive certification as well as any “effects” ofthe certification process itself.18 Following the logic described above, as our instru-ment we use residuals from a regression of NBC status on lagged student achieve-ment and student demographics rather than the raw NBC indicator. For math, thepersistence of having a NBC teacher is roughly equivalent to having a teacher witha value-added measure one standard deviation higher than average. For reading, the
18. For a more detailed discussion of this issue, see Goldhaber and Owens (2007).

936 The Journal of Human Resources
Tab
le5
Com
pari
ngV
alue
-Add
edP
ersi
sten
cew
ith
Oth
erT
each
erP
olic
ies
Nor
thC
arol
ina
Wes
tern
U.S
.di
stri
ct
Inst
rum
ent:
Val
ue-A
dded
Oth
erSu
bjec
tV
alue
-Add
edIn
expe
rien
ced
Tea
cher
Nat
iona
lB
oard
Cer
tifica
tion
Val
ue-A
dded
Prin
cipa
lR
atin
g
(1)
(2)
(3)
(4)
(5)
(6)
A.
Rea
ding
Prio
rye
arac
hiev
emen
tco
effic
ient
0.20
**(0
.02)
0.23
**(0
.02)
0.01
(0.0
7)0.
01(0
.36)
0.15
**(0
.05)
0.22
(0.1
8)
F-S
tatis
ticof
inst
rum
ents
[p-v
alue
]2,
192
[0.0
0]23
92[0
.00]
228
[0.0
0]8
[0.0
1]33
5[0
.00]
27[0
.00]
Obs
erva
tions
1.3
mil
1.3
mil
1.3
mil
1.3
mil
21,4
2121
,421
2
equa
lco
effic
ient
s(w
ithva
lue-
adde
d)[p
-val
ue]
—1.
42[0
.23]
16.1
9[0
.00]
0.61
[0.4
3]—
0.16
[0.6
9]
Jacob, Lefgren, and Sims 937
B.
Mat
h
Prio
rye
arac
hiev
emen
tco
effic
ient
0.27
**(0
.01)
0.25
**(0
.01)
0.10
**(0
.04)
0.22
**(0
.08)
0.17
**(0
.05)
0.15
(0.1
2)
F-S
tatis
ticof
inst
rum
ents
[p-v
alue
]14
,000
[0.0
0]47
68[0
.00]
440
[0.0
0]11
0[0
.00]
325
[0.0
0]44
[0.0
0]
Obs
erva
tions
1.3
mil
1.3
mil
1.3
mil
1.3
mil
21,4
2121
,421
2
equa
lco
effic
ient
s(w
ithva
lue-
adde
d)[p
-val
ue]
—8.
59[0
.00]
22.2
9[0
.00]
0.55
[0.4
6]—
0.06
[0.8
1]
Not
es:
Rep
orte
dst
anda
rder
rors
inpa
rent
hese
sco
rrec
tfo
rcl
uste
ring
atth
ecl
assr
oom
leve
l.Fo
rth
ew
este
rndi
stri
ctth
ebe
nchm
ark
is1.
07fo
rre
adin
gan
d1.
08fo
r�̂
LR
mat
hw
hile
is0.
58on
both
test
s.**
indi
cate
s5
perc
ent
sign
ifica
nce.
�̂O
LS
938 The Journal of Human Resources
point estimate of the NBC persistence is nearly zero, although the estimate is quiteimprecise.
As a further specification check, we perform a similar analysis of teacher value-added and another teacher quality measure on a separate longitudinal data set thatmatches students to teachers from 1998 to 2004 in an anonymous mid-sized Westernschool district. This allows us to check whether our persistence estimates might besensitive to the particular set of institutions or tests given in North Carolina. Usingthis data in standard deviation units, we constructed analogous measures of teachervalue-added and examined the persistence of test scores due to the resulting variationin teacher value-added.
The presentation of results in Columns 5–6 shows the estimated persistence ofteacher value-added in this district is even lower than in North Carolina. The pointestimates suggest a one-year persistence of 0.15 for reading and 0.17 for math.19 Inboth cases, we reject the hypothesis of zero persistence. This school district also hasan alternative available measure of teacher quality, a numeric principal evaluationof the teacher’s performance. The persistence estimates in Column 6 suggest thatthe components of teacher quality captured in principal evaluations have similarpersistence to those captured by value-added measures, although these estimates arealso quite imprecise. These results are important because they suggest that the lowmeasured persistence of teacher value-added is not a peculiarity of North Carolinaschools or one specific test metric.
While our preferred estimation strategy has a number of advantages relative toother approaches, we should be able to recover similar persistence measures usinga reduced form strategy. One potential difficulty is that we do not observe actualteacher quality but rather a noisy proxy leading a regression of student achievementon raw value-added measures to exhibit substantial attenuation bias.20 To overcomethis problem, we can construct empirical Bayes measures of teacher quality, which“shrink” a teacher’s estimated value-added to the grand mean of teacher qualityaccording to the precision of the estimate. The goal is to estimate the expectedteacher quality conditional upon the observed noisy signal.
Morris (1983) describes a method for implementing parametric empirical Bayes(EB) estimators.21 Briefly, to obtain EB estimates of teacher quality, we multiplyeach raw value-added measure by its statistical reliability. This shrinks each estimatetoward zero, which is the mean of teacher quality by construction.22 For our reli-
19. The benchmark estimates show an estimated persistence of student achievement captured by OLS at0.58 on both tests and an estimated persistence of long-run knowledge of 1.07 for reading and 1.08 formath. If the slightly elevated long-run estimates are an estimate of scale, the western districts teacher value-added fadeout looks even steeper relative to North Carolina.20. This is not a problem in the context of our instrumental variables strategy, which is robust to mea-surement error in teacher quality as long as it is uncorrelated to the second-stage residual.21. Education researchers often use Hierarchical Linear Modeling (HLM) to obtain Bayesian estimates ofteacher quality. Kane and Staiger (2008) employ an approach similar to our own and determine that thecorrelation between their EB estimates of teacher quality and those obtained by HLM have a correlationthat exceeds .99.22. For simplicity, we have treated each classroom as if it had the same number of students. If thisassumption were relaxed, the variance of the estimation error would depend on the number of students ineach of a teacher’s classes.
Jacob, Lefgren, and Sims 939
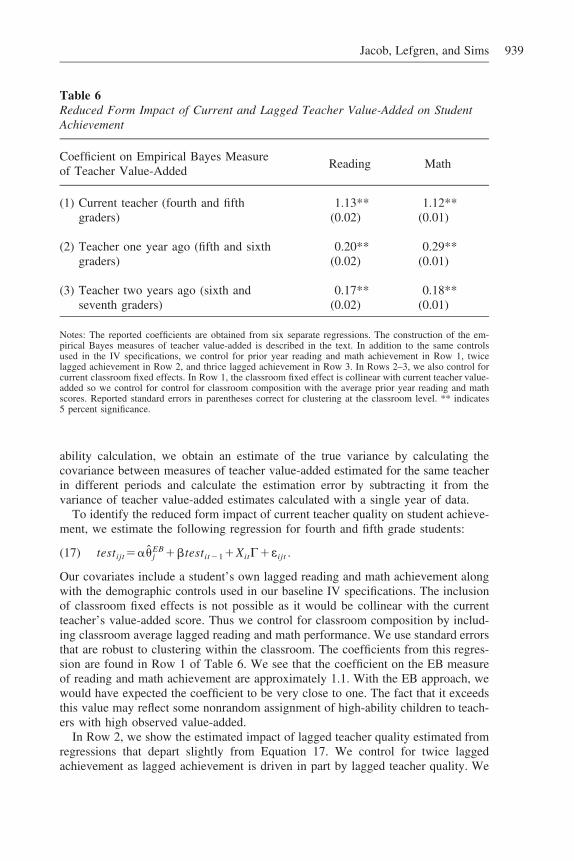
Table 6Reduced Form Impact of Current and Lagged Teacher Value-Added on StudentAchievement
Coefficient on Empirical Bayes Measureof Teacher Value-Added
Reading Math
(1) Current teacher (fourth and fifthgraders)
1.13**(0.02)
1.12**(0.01)
(2) Teacher one year ago (fifth and sixthgraders)
0.20**(0.02)
0.29**(0.01)
(3) Teacher two years ago (sixth andseventh graders)
0.17**(0.02)
0.18**(0.01)
Notes: The reported coefficients are obtained from six separate regressions. The construction of the em-pirical Bayes measures of teacher value-added is described in the text. In addition to the same controlsused in the IV specifications, we control for prior year reading and math achievement in Row 1, twicelagged achievement in Row 2, and thrice lagged achievement in Row 3. In Rows 2–3, we also control forcurrent classroom fixed effects. In Row 1, the classroom fixed effect is collinear with current teacher value-added so we control for control for classroom composition with the average prior year reading and mathscores. Reported standard errors in parentheses correct for clustering at the classroom level. ** indicates5 percent significance.
ability calculation, we obtain an estimate of the true variance by calculating thecovariance between measures of teacher value-added estimated for the same teacherin different periods and calculate the estimation error by subtracting it from thevariance of teacher value-added estimates calculated with a single year of data.
To identify the reduced form impact of current teacher quality on student achieve-ment, we estimate the following regression for fourth and fifth grade students:
EBˆtest ��� ��test �X C�ε .(17) ijt j it�1 it ijt
Our covariates include a student’s own lagged reading and math achievement alongwith the demographic controls used in our baseline IV specifications. The inclusionof classroom fixed effects is not possible as it would be collinear with the currentteacher’s value-added score. Thus we control for classroom composition by includ-ing classroom average lagged reading and math performance. We use standard errorsthat are robust to clustering within the classroom. The coefficients from this regres-sion are found in Row 1 of Table 6. We see that the coefficient on the EB measureof reading and math achievement are approximately 1.1. With the EB approach, wewould have expected the coefficient to be very close to one. The fact that it exceedsthis value may reflect some nonrandom assignment of high-ability children to teach-ers with high observed value-added.
In Row 2, we show the estimated impact of lagged teacher quality estimated fromregressions that depart slightly from Equation 17. We control for twice laggedachievement as lagged achievement is driven in part by lagged teacher quality. We
940 The Journal of Human Resources
include current classroom fixed effects that subsume the average classroom perfor-mance measures and control more effectively for classroom composition and selec-tion. The reduced form estimates of the impact of lagged teacher quality are 0.20for reading and 0.29 for math. These are virtually identical to our IV persistencemeasures. If we divide them by the initial period effects, they are slightly lowerthough substantively the same.
Row 3 shows the impact of twice lagged teacher value-added. Relative to thelagged specification, the only differences are that we examine students in the seventhand eighth grades and control for thrice lagged achievement. The coefficients on thetwice lagged teacher value-added measures are 0.17 for reading and 0.18 for math,again very consistent with our IV persistence estimates.
VI. Conclusions
This paper develops a statistical framework to empirically assess andcompare the persistence of treatment effects in education. We present a model ofstudent learning that incorporates permanent as well as transitory learning gains, andthen demonstrates that an intuitive instrumental variables estimator can recover thepersistence parameter.
The primary claim of the recent teacher value-added literature is that teacherquality matters a great deal for student achievement. This claim is based on consis-tent findings of a large dispersion in teachers’ ability to influence contemporarystudent test scores. While this claim may well be true relative to other policy alter-natives, our results indicate that contemporaneous value-added measures are a poorindicator of long-term value-added. Indeed, test score variation due to teacher value-added is only about one-fifth as persistent as true long-run knowledge and perhapsone-third as persistent as the overall variation in test scores. Thus when measuredagainst intuitive benchmarks, contemporary teacher value-added measures almostcertainly overstate the ability of teachers, even exceptional ones, to influence theultimate level of student knowledge.
Furthermore, when measured against other potential policy levers that involveteacher quality, value-added induced variations do not have statistically differentpersistence than those of principal ratings or national board certification measures.We do find, however, that value-added variation in student achievement is signifi-cantly more persistent than the variation generated by inexperienced teachers.
Taken at face value, our results for two-year persistence imply that a policy in-tervention to raise teacher value-added by a standard deviation would produce along-run effect on student math achievement closer to 0.02 standard deviations thanthe 0.10 standard deviation increase found in the literature (Aaronson, Barrow, andSander 2007; Rivkin, Hanushek, and Kain 2005; Rockoff 2004).
This is likely to change how we evaluate the net benefits of programs that purportto improve, identify or retain high value-added teachers. For example, Clotfelter,Ladd, and Vigdor (2007) suggest that a teacher testing program can identify differ-ences in teacher ability that translate into a �0.062 standard deviation effect onshort-run student achievement for teachers two standard deviations below averageand a 0.068 standard deviation effect for equivalently above average teachers. Ac-
Jacob, Lefgren, and Sims 941
cording to Figlio and Kenney (2007), a merit pay program to move beyond identi-fication to retention might be expected to improve student achievement by 0.05–0.09 standard deviations. However, the cost of testing and bonuses for such aprogram becomes significantly harder to justify if the relevant effect size is at most0.009–0.016 standard deviations when measured just two years later.
As mentioned earlier, our statistical model captures knowledge fadeout stemmingfrom a variety of different sources, ranging from poor measurement of studentknowledge to structural elements in the education system that lead to real knowledgedepreciation. Although it is impossible in the present context to definitively labelone or more explanations as verified, we can make some progress in this area. Forexample, our results show that the low persistence of teacher quality-induced vari-ation is not due to some flaw in the construction or use of value-added measures,but is common to other methods of measuring teacher quality.
Our results also provide some evidence that the observed fadeout is not due tocompensatory teacher assignment. Indeed, measured persistence declines when con-trolling for the current class-room fixed effects suggesting that teacher quality ispositively correlated over time. This positive autocorrelation is observed directlywhen we look at the correlation between the measured value-added of the student’sprior year teacher and the student’s teacher two years ago.
Should the particular explanation for fadeout change how we should think aboutthe policy possibilities of value-added? To examine this, consider under what cir-cumstances exceptional teachers could have widespread and enduring effects in waysthat belie our estimates. Three criteria would have to be met: The knowledge thatstudents could obtain from these exceptional teachers would have to be valuable tothe true long-run outcomes of interest (such as wages or future happiness), retainedby the student, and not tested on future exams. To the degree that all three of theseconditions exist, the implications of this analysis should be tempered.
Although it is certainly possible that these conditions are all met, we believe it isunlikely that the magnitude of fadeout we observe can be completely (or evenmostly) explained by these factors. For example, there are few instances in elemen-tary school mathematics where knowledge is not cumulative. Although fourth gradeexams may not include exercises designed to measure subtraction, for example, thatskill is implicitly tested in problems requiring long division.
Finally, the econometric framework we use to measure the persistence of teacherinduced learning gains is more broadly applicable. It can be used to measure thepersistence of any educational intervention. Relative to the methods previously used,our approach allows straightforward statistical inference and comparisons acrosspolicies. It also relates the empirical results to the assumed data generating process.This may be useful as researchers and policymakers expand their efforts to moreaccurately measure the long-run impact of education policies and programs.
References
Angrist, Joshua D., and Victor Lavy. 1999. “Using Maimonides Rule to Estimate the Effectof Class Size on Scholastic Achievement.” Quarterly Journal of Economics 114(2):533–75.
942 The Journal of Human Resources
Aaronson, Daniel, Lisa Barrow, and William Sander. 2007. “Teachers and StudentAchievement in the Chicago Public High Schools.” Journal of Labor Economics25(1):95–135.
Andrabi, Tahir, Jishnu Das, Asim I. Khwaja, and Tristan Zajonc. 2008. “Do Value-AddedEstimates Add Value? Accounting for Learning Dynamics.” Working Paper 158.Cambridge: Harvard Center for International Development.
Barnett, W. Steven. 1985. “Benefit-Cost Analysis of the Perry Preschool Program and ItsPolicy Implications.” Educational Evaluation and Policy Analysis 7(4):333–42.
Carrell, Scott, and J. West. 2008. “Does Professor Quality Matter? Evidence from RandomAssignment of Students to Professors.” Working Paper 14081. Cambridge: NationalBureau of Economic Research.
Clotfelter, Charles T., Helen F. Ladd, and Jacob L. Vigdor. 2007. “How and why doteacher credentials matter for student achievement?” Working Paper 12828. Cambridge:National Bureau of Economic Research.
———. 2006. “Teacher-Student Matching and the Assessment of Teacher Effectiveness.”Journal of Human Resources 41(4):778–820.
Currie, Janet, and Duncan Thomas. 1995. “Does Head Start Make A Difference?” TheAmerican Economic Review 85(3):341–64.
Doran, Harold, and Lance Izumi. 2004. “Putting Education to the Test: A Value-AddedModel for California.” San Francisco: Pacific Research Institute.
Figlio, David N., and Lawrence W. Kenney. 2007. “Individual Teacher Incentives andStudent Performance.” Journal of Public Economics 91(5):901–14.
Goldhaber, Dan, and Emily Anthony 2007. “Can Teacher Quality be Effectively Assessed?National Board Certification as a Signal of Effective Teaching.” Review of Economicsand Statistics 89(1):134–50.
Imbens, Guido W and Angrist, Joshua D., 1994. “Identification and Estimation of LocalAverage Treatment Effects.” Econometrica 62(2):467–75.
Jacob, Brian A., and Lars Lefgren 2008. “Can Principals Identify Effective Teachers?Evidence on Subjective Performance Evaluation in Education.” Journal of LaborEconomics 26(1):101–36.
———. 2007. “What Do Parents Value in Education? An Empirical Investigation ofParents’ Revealed Preferences for Teachers.” Quarterly Journal of Economics 122(4):1603–37.
———. 2004. “Remedial Education and Student Achievement: A Regression-DiscontinuityAnalysis.” Review of Economics and Statistics 86(1):226–44.
Jacob, Brian A., and Steven Levitt. 2003. “Rotten Apples: An Investigation of thePrevalence and Predictors of Teacher Cheating.” Quarterly Journal of Economics118(3):843–77.
Kane, Thomas J., Jonah E. Rockoff, and Douglas O. Staiger. 2008. “What DoesCertification Tell Us About Teacher Effectiveness? Evidence from New York City.”Economics of Education Review 27(6):615–31.
Kane, Thomas J., and Douglas O. Staiger. 2008. “Estimating Teacher Impacts on StudentAchievement: An Experimental Evaluation.” Working Paper 14607. Cambridge: NationalBureau of Economic Research.
———. 2002. “The Promises and Pitfalls of Using Imprecise School AccountabilityMeasures.” Journal of Economic Perspectives 16(4):91–114.
Krueger, Alan B., and Diane M. Whitmore. 2001. “The Effect of Attending a Small Classin the Early Grades on College-Test Taking and Middle School Test Results: Evidencefrom Project STAR.” Economic Journal 111(468):1–28.
Lockwood, J. R., Daniel F. McCaffrey, Louis T. Mariano, and Claude Setodji. 2007.“Bayesian Methods for Scalable Multivariate Value-Added Assessment.” Journal ofEducational and Behavioral Statistics 32(2):125–50.
Jacob, Lefgren, and Sims 943
McCaffrey, Daniel F., J. R. Lockwood, Daniel Koretz, Thomas A. Louis, and LauraHamilton. 2004. “Models for Value-Added Modeling of Teacher Effects.” Journal ofEducational and Behavioral Statistics 29(1):67–101.
Morris, Carl N. 1983. “Parametric Empirical Bayes Inference: Theory and Applications.”Journal of the American Statistical Association 78(381):47–55.
Nye, Barbara, Larry V. Hedges, and Spyros Konstantopoulos. 1999. “The Long-TermEffects of Small Classes: A Five-Year Follow-Up of the Tennessee Class SizeExperiment.” Educational Evaluation and Policy Analysis 21(2):127–42
Rivkin, Steven G., Eric A. Hanushek, and John F. Kain. 2005. “Teachers, Schools, andAcademic Achievement.” Econometrica 73(2):417–58.
Rockoff, Jonah E. 2004. “The Impact of Individual Teachers on Student Achievement:Evidence from Panel Data,” American Economic Review 94(2):247–52.
Rothstein, Jesse. 2010. “Teacher Quality in Educational Production: Tracking, Decay andStudent Achievement.” Quarterly Journal of Economics 125(1):175–214.
Sass, T. 2006. “Charter Schools and Student Achievement in Florida.” Education Financeand Policy 1(1):91–122.
Todd, P., and K. Wolpin. 2003. “On the Specification and Estimation of the ProductionFunction for Cognitive Achievement.” Economic Journal 113(485):3–33.———. 2006. “The Production of Cognitive Achievement in Children: Home, School and
Racial Test Score Gaps.” Working Paper 04-019. Philadelphia: Penn Institute forEconomic Research.