J U LY 2 0 0 6 P r i m e Fa c t 197 Growing eight tonnes a ... · Growing eight tonnes a hectare of...
12
J U L Y 2 0 0 6 P R I M E F A C T 197 Growing eight tonnes a hectare of irrigated wheat in southern NSW John Lacy Rice Farming Systems Leader, Yanco Agricultural Institute Kirstie Giblin Cropcheck Project Officer, NSW DPI, Finley Over the past 15 years, many irrigation farmers have aimed to achieve 7 to 8 t/ha wheat yields. The success rate has been around 1 in 10, with few, if any, farmers consistently obtaining yields in this range. There are two major limiting factors: • The first is excessive vegetative growth during winter and spring, which makes lodging more likely. Lodging also occurs when soils are saturated during irrigation, which greatly reduces the anchoring strength of plants, particularly at high plant densities (Stapper 2006). Lodging is a major risk when high yields are being targeted. It may lead to high screenings, low test weight, increased risk of weather damage and a slowed harvest. • The second major factor limiting yields is foliar diseases such as Septoria tritici blotch (until the mid 1990s) and yellow leaf spot (Pyrenophora triti-repentis). Other factors impacting on achieving 8 t/ha yield potential and grain quality include black point, leaf death tipping, late watering, waterlogging, screenings, difficulty of predicting nitrogen needs and delays in topdressing nitrogen in wet winters. Given that, due to these limitations, the chance of achieving a high yield is low, most farmers have adopted a low risk but profitable strategy of targeting a 4 to 5 t/ha yield and watering only once, in spring, particularly when water allocations have been low. Although this has been a successful strategy, and returns per megalitre are attractive, the potential for lifting yield and profit per megalitre of water is limited. Targeting 5 t/ha or 8 t/ha? Up until the first node wheat growth stage, the risks in targeting a yield of 8 t/ha are not much higher than those of targeting a 5 t/ha crop. This is because the costs in establishing an 8 t/ha crop are similar to those for a 5 t/ha crop. If crop prices, crop potential or water security are lower than planned, the decision can be made at the first node stage to target a 5 t/ha crop instead of an 8 t/ha crop. The biggest difference between 5 t/ha and 8 t/ha is the extra management needed in achieving 8 tonnes, chiefly extra monitoring to ensure crops meet the key management checks or practices for higher yields. Neglecting one particular keycheck factor or a combination of factors may cause significant yield loss, reducing the chances of attaining a yield of 8 tonnes. What this Primefact covers This Primefact outlines a nitrogen management strategy which minimises the risk of overvegetative and lodged crops. This nitrogen management strategy has been combined with the latest ‘Irrigated Wheatcheck’ best management practices. This combination greatly increases the ability to grow high yielding profitable wheat crops for each hectare and each megalitre of water.
Transcript of J U LY 2 0 0 6 P r i m e Fa c t 197 Growing eight tonnes a ... · Growing eight tonnes a hectare of...

J U L Y 2 0 0 6 P r i m e F a c t 1 9 7
Growing eight tonnes a hectare of irrigated wheat in southern NSW
John Lacy Rice Farming Systems Leader, Yanco Agricultural Institute
Kirstie Giblin Cropcheck Project Officer, NSW DPI, Finley
Over the past 15 years, many irrigation farmers have aimed to achieve 7 to 8 t/ha wheat yields. The success rate has been around 1 in 10, with few, if any, farmers consistently obtaining yields in this range.
There are two major limiting factors:
• The first is excessive vegetative growth during winter and spring, which makes lodging more likely. Lodging also occurs when soils are saturated during irrigation, which greatly reduces the anchoring strength of plants, particularly at high plant densities (Stapper 2006). Lodging is a major risk when high yields are being targeted. It may lead to high screenings, low test weight, increased risk of weather damage and a slowed harvest.
• The second major factor limiting yields is foliar diseases such as Septoria tritici blotch (until the mid 1990s) and yellow leaf spot (Pyrenophora triti-repentis).
Other factors impacting on achieving 8 t/ha yield potential and grain quality include black point, leaf death tipping, late watering, waterlogging, screenings, difficulty of predicting nitrogen needs and delays in topdressing nitrogen in wet winters.
Given that, due to these limitations, the chance of achieving a high yield is low, most farmers have adopted a low risk but profitable strategy of targeting a 4 to 5 t/ha yield and watering only once, in spring, particularly when water allocations have
been low. Although this has been a successful strategy, and returns per megalitre are attractive, the potential for lifting yield and profit per megalitre of water is limited.
Targeting 5 t/ha or 8 t/ha?
Up until the first node wheat growth stage, the risks in targeting a yield of 8 t/ha are not much higher than those of targeting a 5 t/ha crop. This is because the costs in establishing an 8 t/ha crop are similar to those for a 5 t/ha crop.
If crop prices, crop potential or water security are lower than planned, the decision can be made at the first node stage to target a 5 t/ha crop instead of an 8 t/ha crop.
The biggest difference between 5 t/ha and 8 t/ha is the extra management needed in achieving 8 tonnes, chiefly extra monitoring to ensure crops meet the key management checks or practices for higher yields. Neglecting one particular keycheck factor or a combination of factors may cause significant yield loss, reducing the chances of attaining a yield of 8 tonnes.
What this Primefact covers
This Primefact outlines a nitrogen management strategy which minimises the risk of overvegetative and lodged crops.
This nitrogen management strategy has been combined with the latest ‘Irrigated Wheatcheck’ best management practices. This combination greatly increases the ability to grow high yielding profitable wheat crops for each hectare and each megalitre of water.

Marketing your crop
Before planting:
• decide on the quality that you are going to produce
• ensure that you understand the specifications for this product
• determine how much it costs to grow the crop, both production (variable) and fixed (overhead) costs. This will help you determine the price at which a profit can be achieved. Use a gross margin from the NSW DPI website to determine variable costs and gross margin per hectare and per megalitre. (An example of a gross margin comparing 5 t/ha and 8 t/ha is shown in Table 6.)
The Wheatcheck Approach
In 1984 a crop monitoring wheat package called the ‘Irrigated Wheat Five Tonne Club’ was developed. It used objective factors for growing irrigated wheat from Siragcrop (Stapper 1984). As part of this package, farmers had to monitor crops and check to see if the crop had attained the benchmarks or checks in achieving higher yields at various growth stages. The checks were obtained by monitoring and recording the best practices from the higher yielding crops.
The crop checking approach is called ‘Irrigated Wheatcheck’. The ‘Eight Tonne Irrigated Wheat Club’ monitoring package is a high yielding and profitable version of ‘Irrigated Wheatcheck.’
Eight-tonne key checks
This Primefact contains the best management practices or ‘checks’ for growing 8 t/ha wheat yields. The key checks are:
• monitoring
• irrigation layout
• paddock history
• soil structure
• subsoil moisture
• nitrogen at pre-sowing and at sowing
• sowing date
• variety selection
• fertiliser at sowing
• plant establishment
• weed control
• crop nitrogen at late tillering
• crop nitrogen at head emergence
• soil moisture at stem elongation
• three green leaves at flowering
• Wheatcheck recording
primefact 197, GrowinG eiGht tonnes a hectare of irriGated wheat in southern nsw �
Monitoring
You need a willingness to monitor and record the key checks.
Growing 8 tonnes of wheat per hectare requires a higher level of management, particulary in monitoring the crop to determine whether the checks are being adopted.
If you record paddock, crop practices and crop measurements then the crop can be benchmarked against other crops. This helps identify best practices for high yielding crops, and any barriers to attaining high yields.
You can obtain record cards from NSW DPI District Agronomists, who have supplies of Wheatcheck cards.
Irrigation layout
Use a layout which allows water application and drainage within 15 hours.
This check is to avoid waterlogging, which can be responsible for large yield losses from nitrogen deficiency, lack of tillering, poor grain filling and lower grain weight. Layouts such as beds, steeper border check layouts, terrace bankless channels and spray irrigation with effective water delivery and drainage are suitable.
Paddock history
Sow wheat after a break crop or long fallow to improve soil health, reduce root disease and reduce weed populations.
Paddock history is an important check, since wheat crops following break crops regularly show yield responses that are 20% above those of wheat crops following wheat.
Selection of a paddock which has had a break crop or legume pasture with minimal grass content minimises the risk of the root diseases take-all (Gaeumannomyces graminis) and crown rot (Fusarium pseudograminearum). Good break crops in irrigated rotations include the winter crops canola and fababeans and summer crops rice, soybeans and maize.
Avoiding high fertility legume pastures is important, as the high soil nitrogen following these pastures is likely to produce excessive vegetative growth in wheat crops, leading to the risk of lodging and foliar diseases. Refer to NSW DPI’s Winter crop variety guide, updated each year, for the latest information on disease identification and control.
Soil structure
Choose paddocks with moderate to good soil structure, that is, the better paddocks.
Good to moderate soil structure is one of the most important checks for high yield potential. Paddocks with poor soil structure usually have poor water infiltration and generally give lower or inconsistent yields. Waterlogging and drainage can be a problem during wet periods.
Soils with moderate to good soil structure usually have an exchangeable sodium % (ESP) less than 6%: any greater than this indicates structural problems. Surface crusting may also be an indication of sodic soils. (Sodicity refers to the amount of sodium (Na) in a soil and indicates the structural condition of the soil.)
Another general indicator of good soil structure is an organic carbon level > 1.5%. Organic carbon % is the standard used by soil testing laboratories to measure the organic matter (OM) content of a soil. Organic matter consists of all living and dead plant and animal matter occurring in the topsoil. It acts as a ‘glue’ to bind soil particles into aggregates. The average organic carbon content of soil organic matter is approximately 58%.
Organic matter % = organic carbon % × 1.72
Subsoil moisture
Provide adequate subsoil moisture at sowing.
Although wheat crops need only low to moderate biomass in winter for high yield potential, significant moisture stress in dry winters will lower wheat growth and therefore potential yield. Moisture stress may be avoided by pre-watering before sowing or watering up just before or after sowing.
Alternatively, farmers may assess rainfall predictions and, in winters with above-average rainfall predicted, may decide to rely on rainfall for subsoil moisture. One study (Fisher 2001), based on 51 years rainfall, found a definite benefit from pre-irrigating in April in 44 of the years.
With paddocks to be pre-watered, water use and timing need to be considered. Pre-irrigation timing depends on the amount of rainfall in late autumn and winter. Experience has demonstrated that in wet winters the best timing of pre-watering is in February or early autumn. This early timing provides subsoil moisture and allows drying of the topsoil, so that, in wet winters, the dryness of the topsoil buffers against waterlogging. Paddocks with good drainage can be pre-watered until late March.
GrowinG eiGht tonnes a hectare of irriGated wheat in southern nsw, primefact 197 �
Gra
in y
ield
(t/h
a)
10
9
8
7
6
5 0 200 400 600 800 1000 1200 1400
Shoot number per m2
Chara 03
H45 03
H.Mercury 03
Chara 04
H45 04
H.Mercury 04
Shoot count
primefact 197, GrowinG eiGht tonnes a hectare of irriGated wheat in southern nsw �
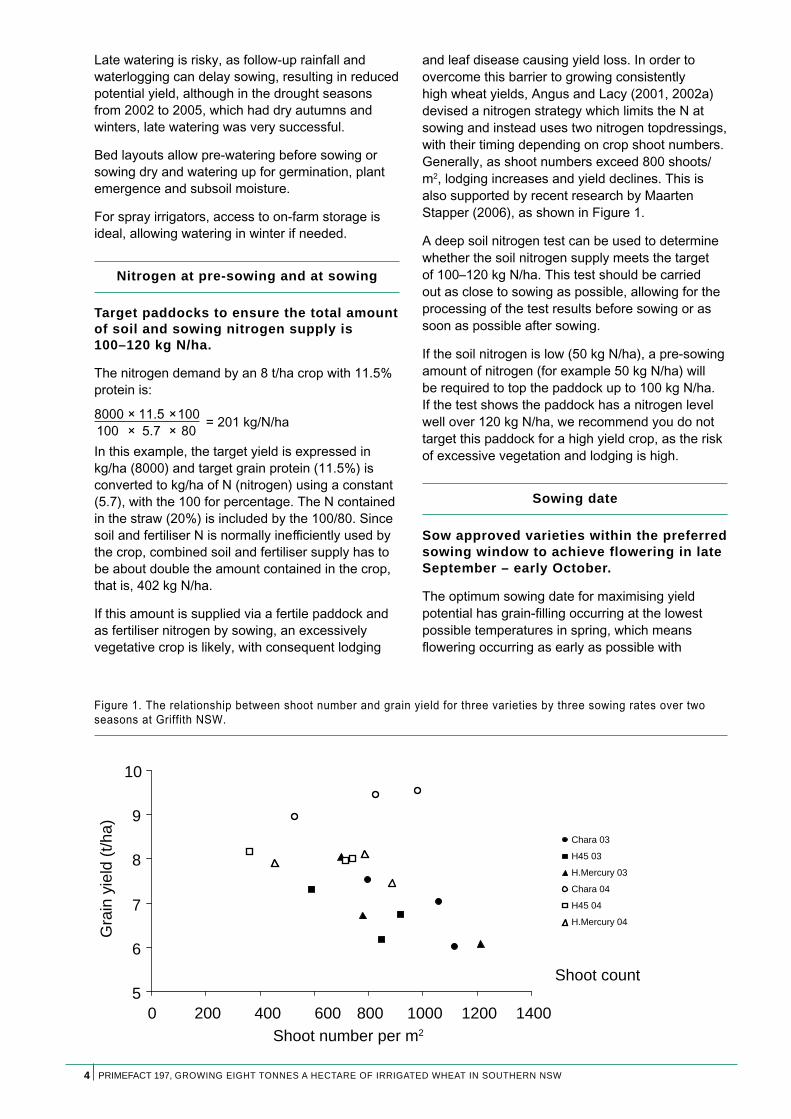
Late watering is risky, as follow-up rainfall and and leaf disease causing yield loss. In order to waterlogging can delay sowing, resulting in reduced overcome this barrier to growing consistently potential yield, although in the drought seasons high wheat yields, Angus and Lacy (2001, 2002a) from 2002 to 2005, which had dry autumns and devised a nitrogen strategy which limits the N at winters, late watering was very successful. sowing and instead uses two nitrogen topdressings,
with their timing depending on crop shoot numbers.Bed layouts allow pre-watering before sowing or Generally, as shoot numbers exceed 800 shoots/sowing dry and watering up for germination, plant emergence and subsoil moisture.
m2, lodging increases and yield declines. This is also supported by recent research by Maarten
For spray irrigators, access to on-farm storage is Stapper (2006), as shown in Figure 1. ideal, allowing watering in winter if needed. A deep soil nitrogen test can be used to determine
whether the soil nitrogen supply meets the target Nitrogen at pre-sowing and at sowing of 100–120 kg N/ha. This test should be carried
out as close to sowing as possible, allowing for the Target paddocks to ensure the total amount processing of the test results before sowing or as of soil and sowing nitrogen supply is soon as possible after sowing. 100–1�0 kg N/ha. If the soil nitrogen is low (50 kg N/ha), a pre-sowing The nitrogen demand by an 8 t/ha crop with 11.5% amount of nitrogen (for example 50 kg N/ha) will protein is: be required to top the paddock up to 100 kg N/ha.
If the test shows the paddock has a nitrogen level8000 × 11.5 ×100 = 201 kg/N/ha well over 120 kg N/ha, we recommend you do not100 × 5.7 × 80 target this paddock for a high yield crop, as the riskIn this example, the target yield is expressed in of excessive vegetation and lodging is high.kg/ha (8000) and target grain protein (11.5%) is converted to kg/ha of N (nitrogen) using a constant (5.7), with the 100 for percentage. The N contained Sowing date in the straw (20%) is included by the 100/80. Since soil and fertiliser N is normally inefficiently used by Sow approved varieties within the preferred the crop, combined soil and fertiliser supply has to sowing window to achieve flowering in late be about double the amount contained in the crop, September – early October. that is, 402 kg N/ha.
The optimum sowing date for maximising yield If this amount is supplied via a fertile paddock and potential has grain-filling occurring at the lowest as fertiliser nitrogen by sowing, an excessively possible temperatures in spring, which means vegetative crop is likely, with consequent lodging flowering occurring as early as possible with
Figure 1. The relationship between shoot number and grain yield for three varieties by three sowing rates over two seasons at Griffith NSW.

August September October
Maximum 16.2 19.6 23.2
Minimum 4.0 6.0 9.1
Average 10.1 12.8 16.2
minimal frost risk. Yields decrease by 5% for every 1°C increase in average daily post-flowering temperature above 14°C (Stapper 2006). Thus sowing is a compromise between wanting to sow earlier, and risking frost damage, and sowing later, resulting in flowering at higher temperatures and lowering yield potential.
The optimum flowering period which meets these criteria in southern NSW is late September to early October. Select sowing dates for any variety to achieve flowering at this time. Earlier flowering also helps to save one irrigation watering.
Table 1. Average Griffith CSIRO Temperatures (°C)
Variety selection
Use varieties which have yielded consistently well in trials over several years.
The new National Variety Trials (NVT) web-based database shows the variety results from all trials. Approved varieties offer the best combination of yield potential, grain quality and disease resistance.
Stapper (2006) found maturity and stem strength are also important variety traits for high yields under irrigation, with disease resistance facilitating ease of achievement. Varieties consistently achieving 8 t/ha under irrigation with efficient use of resources were identified as requiring a combination of these traits:
• good stem and anchorage strength (e.g. Chara)
• high sink strength (e.g. H45)
• restricted tillering capacity (e.g. H45)
• early maturity (e.g. H45)
• big grains (e.g. Arrivato) to lower screenings
• longer green leaf area duration (e.g. Chara)
• not susceptible to black point
• competitive growth
Fertiliser at sowing
Fertilise with � kg phosphorus per tonne of target yield.
Phosphorus is important for seed germination, early root development, leaf size, tillering, grain yield and the ripening process of grain.
Since each tonne of grain removes 4 kg phosphorus, this amount needs to be added to maintain soil phosphorus levels. Hence, for an eight-tonne yield target, apply 32 kg P/ha. This amount should be banded near the seed, commonly as starter fertiliser DAP or MAP (i.e. 160 kg DAP/ha or 145 kg MAP/ha).
Plant establishment
Aim for 150–�00 plants/m�.
A uniform plant population with adequate numbers is vital for maximising yield potential and to compete with weeds. The recommended population is 150–200 plants/m2, which normally requires sowing rates of 90–110 kg/ha: difficult establishment conditions, such as heavier crusty soils, may need 150 kg/ha.
The target plant population, seed size, germination % and establishment affect sowing rate as follows:
Sowing target plants/m2 × 1000 gw (g) x 100 rate = (kg/ha) germination % × establishment %
(gw: grain weight)
Example:
Target plant population = 170 plants/m2
1000 grain weight = 42 Germination % = 95 Establishment % = 80
Sowing rate = (170 × 42 × 100)(95 × 80)
= 94 kg/ha
Lower sowing rates with good tillering conditions may also achieve good yields, as recent research shows (Table 2, Stapper 2006).
GrowinG eiGht tonnes a hectare of irriGated wheat in southern nsw, primefact 197 5

row spacing. Plant anchorage was strongest with nodal roots evenly distributed around the crown, which occurred when the next plant was at least 2.5 cm away. The average intra-row distance with increasing rates in Table 2 were 10, 3 and 1.5 cm. To lower lodging risk, adjust sowing rates at wider rows to obtain a maximum intra-row distance of 2.5 cm.
Weed control
Undertake weed control before and after sowing to avoid yield loss.
Early removal of weeds with pre-emergent herbicides consistently produces greater yield increases than if weeds are left until the crop has tillered. It is important to check crops regularly during the first 6 weeks after sowing and monitor weed germinations and density.
Annual weeds compete with wheat during the tillering period. Therefore, remove weeds no later than 6 weeks after sowing to minimise losses.
Consult the latest edition of Weed control in winter crops, available from NSW DPI offices and website, for details on suitable herbicides and weed control. Other valuable sources of information on weed control include retail agronomists.
Crop nitrogen at late tillering
According to Stapper (2006), row spacing influences the distance between plants and lodging effects.
Wider row spacing is increasingly being used to facilitate direct drilling into stubble. Plot trials as in Table 2 were all done with standard 17 cm
At the late tillering to initial stem elongation stage (DC�0), check whether the crop has the target population of 500–800 shoots/m�, and assess crop nitrogen.
The late tillering to first node stage is important for deciding whether the crop will be managed for 8 tonne or 5 tonne yield potential.
If there are constraints to achieving 8 tonnes (late sowing, poor tillering, low water allocations preventing the ability to apply a minimum of 3 spring irrigations, low wheat prices or other agronomic factors), you can decide to manage for 5 tonnes rather than 8 tonnes.
Conduct shoot counts to determine the nitrogen topdressing rates for either 5 or 8 tonnes potential (see Table 3).
For 8 tonnes yield, the target population is 500–800 shoots/m2.
�5 100 �00 mean
low medium high
H�5
�00� 7.3 6.2 6.7 6.7
�00� 8.2 8.0 8.0 8.0
total 15.5 14.2 14.7 14.8
mean 7.7 7.1 7.3 7.4
Hybrid Mercury
�00� 8.0 6.7 6.1 6.9
�00� 7.9 8.1 7.5 7.8
total 16.0 14.8 13.5 14.8
mean 8.0 7.4 6.8 7.4
Chara
�00� 7.5 7.0 6.0 6.9
�00� 9.0 9.4 9.5 9.3
total 16.5 16.5 15.5 16.2
mean 8.2 8.2 7.8 8.1
mean
�00� 7.6 6.6 6.3 6.8
�00� 8.3 8.5 8.3 8.4
total 16.0 15.� 1�.6 15.�
�-year 8.0 7.6 7.3 7.6 average
Table 2. Grain yield (t/ha) for three varieties sown 28 May 2003 and 20 May 2004 with three sowing rates at Griffith NSW
Treatment lsd for a variety is 0.4 t/ha.
This sowing rate trial was conducted over two seasons with rates of 35, 100 and 200 kg/ha for each of H45, Hybrid Mercury and Chara (Table 2), all with a 1000 grain weight of 39 g. The lowest sowing rate resulted in only 60 plants/m2.
Lodging was a problem in 2003, with low sowing rates having the lowest and latest onset of lodging, resulting in highest yields. There were no consistent yield differences between rates in 2004, a season without severe lodging.
Total production over two years was significantly higher for the lowest sowing rate.
The results in Table 2 relate to trials conducted in optimum conditions on a sandy loam soil, with high soil nitrogen and good soil moisture and plant emergence. Most wheat paddocks have varying soiltypes and soil moisture conditions at sowing which require moderate sowing rates, as represented by the 100 kg rate in Table 2.
primefact 197, GrowinG eiGht tonnes a hectare of irriGated wheat in southern nsw 6

8/ha 5 t/ha
First node Booting to head First node Booting to head Shoots/m2 (kg N/ha) emergence Shoots/m2 (kg N/ha) emergence
(kg N/ha) (kg N/ha)
400 – – 400 45–60 –
500 50 90 500 60–75 –
600 40 60–90 600 60 –
700 0–30 60–90 700 30–45 –
800 0 60–90 800 0 –
Table 3. Nitrogen topdressing rates based on shoot counts for 5 and 8 t/ha potential
Note: If there is obvious nitrogen deficiency before first node, topdress 30–45 kg N/ha at mid tillering.
• If the shoot population is 750–800 shoots/m2, there is no need to topdress at this stage, as the crop has more than enough shoots for 8 tonnes.
• If the shoot number is below 750 shoots/m2, topdress with a ‘top-up’ rate of 30–50 kg N/ha.
If the shoot number is below 500, achieving 8 tonnes is less likely.
The chance of crops with shoot numbers above 800 for yielding 8 tonnes are also slim because the crops are too thick, with a greater chance of yield loss from lodging and extra disease risk.
Topdressing should be carried out before the first node (Z31) or second node (Z32) stage, preferably before a minimum of 5 mm rain. Trials and farmer experience show volatilisation losses without rain are low under southern NSW conditions during winter, but rain or an irrigation is needed to incorporate the nitrogen.
Crop nitrogen at head emergence
Reassess the crop for nitrogen at the head emergence to flowering stage and apply 60–90 kg N/ha.
If water is available in the spring for another 2 or 3 irrigations, and leaf diseases are under control, and the decision has been made to target 8 tonnes, a late application of nitrogen topdressing can be considered. This is after the flag leaf stage when stripe rust susceptible crops will require treatment.
This late application of 60–90 kg N/ha between head emergence (Z50) and flowering is designed to reduce the potential for lodging and extra disease. If 90 kg N/ha was applied at the first node stage to a crop with 600–800 shoots/m2 there would be a significant vegetative response and risk of lodging. This strategy is for high yield potential 7–8 t/ha
crops which had 500 to 800 shoots/m2 at the first node stage and with 3 to 4 green leaves per shoot. It is very important the crop is watered immediately after nitrogen application to avoid volatilisation losses with this late nitrogen application.
Late topdressing was evaluated by Stapper (2006) for Arrivato durum wheat (Table 4), a variety well suited to the high yielding irrigation environment, although grain quality for this variety is an issue. The base treatment yielded 7.3 t/ha and 8.5% protein with just 30 kg N/ha at sowing, indicating the high soil nitrogen status of this site. Topdressing with 60 kg N/ha at DC32 before the first irrigation increased yield to 9.1 t/ha with 8.8% protein. Another 40 kg N/ha at the next irrigation during early flowering raised yield to 9.7 t/ha with 10.4% protein.
Further evidence of the yield responses to late applied nitrogen (Angus and Lacy 2002b) is shown in Table 5. This table shows large yield and protein responses to N topdressed between tillering and flowering in irrigated and favourable dryland conditions.
The Ariah Park experiments were in collaboration with Tony Good, formerly of Incitec Fertilisers, and Kevin Harper, landholder. The Stockinbingal experiment was in collaboration with Bernard Hart. The Leeton experiment was at Leeton Research Farm in collaboration with John Thompson. At Ariah Park in 1995 and Stockinbingal in 2000 there was adequate rain after late topdressing, leading to large yield responses as well as additional grain protein. In the drier season of 1996, the yield response was smaller but the grain protein response greater. Under irrigation at Leeton, topdressing at tillering gave larger yield responses than topdressing at booting. The Leeton experiment included Suneca which lodged badly with topdressing at tillering.
GrowinG eiGht tonnes a hectare of irriGated wheat in southern nsw, primefact 197 �

Treatment 0 0N0 0NN N00 N0N N0N
Grain yield (t/ha) 7.3 8.3 8.8 9.1 9.7 9.6
Protein (%) 8.5 12.0 12.5 8.8 110.4 10.6
Screenings 1.9 3.5 3.4 2.6 2.8 3.4
Kernel weight (mg) 54.4 58.6 58.9 55.6 57.7 58.7
Kernel number (1000/m2) 13.4 14.1 15.0 16.4 16.8 16.3
Nitrogen applications
1 – sowing 20 May DC00 30 30 30 30 30 30
2 – 2nd node 26 Aug DC32 0 0 0 60 60 60
3 – late boot 16 Sep DC46 0 60 60 0 0 0
4 – early flowering 30 Sep DC63 0 0 40 0 40 40
Total N fertiliser (kg/ha) 30 90 130 90 130 130
Sowing rate (kg/ha) 100 100 100 100 100 60
Yield (t/ha) Protein (%) Fertiliser recovery %
Ariah Park 1995 variety Janz, dryland
Control 4.1 10.2
50N sowing
50N sowing+ 50 N flowering
6.1
7.1
11.1
12.9
91
87
Ariah Park 1996, variety Janz, dryland
Control 5.1 10.0
50 N sowing
50 N sowing + 50 N flowering
5.5
5.8
11.2
13.3
37
46
Stockinbingal 2000, variety H45, dryland
Control 5.2 9.2
50 N tillering
50 N flowering
7.0
6.9
10.0
11.5
78
100
Leeton 1990, variety Wyuna, irrigated
Control 3.9 7.8
60 N at tillering (DC30)
120 N at tillering
60 N at booting (DC45)
120 N at booting
6.6
8.2
4.9
6.4
8.3
9.0
9.6
11.0
71
63
49
59
Table 4. Grain yield, protein, screenings, grain weight and grain number of nitrogen treatments for Arrivato sown 20 May 2004 at Griffith NSW
Yield lsd is 0.6 t/ha. The trial site was the second wheat crop after canola following several years of lucerne on sandy loam soil. Soil nitrogen was high.
Table 5. Evidence for wheat responses to late topdressing with nitrogen fertiliser
primefact 197, GrowinG eiGht tonnes a hectare of irriGated wheat in southern nsw 8

Soil moisture at stem elongation
Available soil moisture from stem elongation to the mid dough stage needs to be 50% or more to avoid yield losses from moisture stress.
Crops with an 8 tonne yield potential will have a higher moisture demand than crops with a lower yield potential, so any moisture stress will be more critical and could cause a significant dip in yield.
The stem elongation growth phase coincides with rapid growth and higher water use, so it is more important to maintain good soil moisture between elongation and the mid dough stage than at the tillering growth stage.
As a rule, soil moisture should be kept above 50% of the plant available water (PAW) in the root zone to minimise plant moisture stress. This amount is often referred to as readily available water (RAW) or allowable depletion. (Depending on the soil type, wheat RAW may vary from 45% to 65% of PAW.) Once below 50% of PAW, plants use a lot of energy extracting the remaining moisture from the soil. Less energy is available for growth, and so production falls.
Soil moisture at head emergence
Check soil moisture regularly for the full rooting zone.
The most critical moisture stress stage is head emergence. The first 10 days after flowering, when grains are enlarging and forming, decide grain size, so this is also important. In most seasons it is likely there will be a need to water crops during the elongation stage, just prior to head emergence and at the early milk stage to allow good grain fill up to the mid dough stage. In very dry seasons up to 5 spring irrigations may be required to maximise yield potential.
Check soil moisture regularly for the full rooting zone, which is commonly 60 cm deep. Checking soil moisture to 15 cm with a shovel usually leads to inaccurate or a misleading diagnosis. Irrigations can be scheduled using a variety of different methods: for example, there are tensiometers, gypsum blocks, neutron probes, gophers and evapotranspiration, which require observation or measurement of plant growth, soil moisture, the weather or a combination of these. All methods aim to determine when to irrigate to avoid water stress and how much water to apply to refill the soil.
Three green leaves at flowering
For high wheat yield potential, maintain as large a photosynthetic area as possible by maintaining � green leaves per shoot at flowering to maximise filling of grain.
Adequate nutrition, soil moisture and disease control through a combination of disease-resistant varieties and fungicide seed treatments and leaf control should result in crops with 3 green leaves per shoot at flowering.
Foliar stripe rust: fungicide timing for stripe rust is very important to prevent loss of photosynthetic area. Because management strategies for stripe rust control are constantly being updated, make sure you keep in regular contact with your local District Agronomist or retail agronomist for the latest control measures.
Wheatcheck record
After harvest, complete a Wheatcheck record showing the crop yield and quality and the practices used to grow the crop.
Return the record to your District Agronomist for benchmarking in the Cropcheck database. Feedback results comparing crop practices with the highest yielding and most profitable crops are sent to each participating farmer.
GrowinG eiGht tonnes a hectare of irriGated wheat in southern nsw, primefact 197 9

5 t/ha 8 t/ha
Income $150/t $750.00 $1200.00
Variable costs (per hectare)
Cultivation Burn Scarify Landplane
$7.71 $7.71
$7.71 $7.71
Pre-irrigate 1.5 ML/ha $26/ML $39.00 $39.00
Knockdown herbicide Roundup CT®
Application 1 L/ha @ $6 $6.00
$2.50 $6.00 $2.50
Presow Urea Application
125 kg/ha at $520/t $65.00 $10.48
$65.00 $10.48
Presow herbicide e.g. Logran®
Application 35 g/ha $5.60
$2.50 $5.60 $2.50
Sowing Seed Application
100 kg/ha $61.00 $10.48
$61.00 $10.48
Seed treatment Sowing fertiliser
e.g. Baytan®
DAP 150 mL/ha 150 kg/ha, $520/t
$7.65 $78.00
$7.65 $78.00
Broadleaf herbicide e.g. Kamba M®
Application 1.7 L/ha contract
$15.75 $10.00
$15.75 10.00
Subtotal variable costs up to first node stage $��9.�8 $��9.�8
First topdress Urea Application
125 kg/ha, 520/t $65.00 $10.48
Urea Application
100 kg/ha, $520/t $52.00 $10.00
Stripe rust e.g. Bayleton®
Application by air 1 L/ha @ $9.50 $9.50
$10.00 $9.50
$10.00
Second topdress Urea Application by air
185 kg/ha, $520/t $96.20 $25.00
Spring irrigation Tail drains First Second Third
1 ML/ha 1 ML/ha 0.75 ML/ha
$12.08 $26.00
$12.08 $26.00 $26.00 $19.50
Harvest Contract Chaser bin
$12.90/t $70.95 $9.91
$103.20 $11.00
Levies 1.02% Insurance 2.28%
$7.65 $17.10
$12.24 $27.36
Variable costs, 1st node to harvest $238.67 $440.08
Total variable cost VC/tonne GM/ha
$568.05 $11�.61 $181.95
$�69.�6 $96.18
$��0.5�
GM/ML �.5 ML/ha $��.�8
�.�5 ML/ha $101.�0
Table 6. Irrigated wheat gross margin budgets for 5 t/ha and 8 t/ha yields
primefact 197, GrowinG eiGht tonnes a hectare of irriGated wheat in southern nsw 10
Summary of the steps in growing 8 t/ha
• Determine the marketing strategy and the returns and costs.
• Be prepared to monitor the crop and record the key checks.
• Select a paddock which had a break crop or non-grass pasture last season.
• Choose paddocks with moderate to good soil structure.
• Use a layout which allows water application and drainage within 15 hours.
• Avoid paddocks with high nitrogen, that is, over 120 kg N/ha.
• Ensure there is a minimum of 50% available soil moisture at sowing.
• Sow on time.
• At sowing or before sowing top up soil nitrogen if needed so that the total soil and fertiliser nitrogen is 100–120 kg N/ha.
• Fertilise with 4 kg phosphorus for each tonne of target yield.
• Aim for 150–200 plants/m2 at the plant emergence stage.
• Undertake pre-sowing and post-sowing weed control to avoid yield loss due to weed competition.
• At the late tillering to first node stage, count shoots to determine whether the crop has the target population of 500–800 shoots/m2 for 8 tonnes. Assess seasonal factors such as wheat price, irrigation allocation and crop health and decide whether to manage for 8 tonnes or 5 tonnes.
• If the decision is to manage for 8 tonnes, refer to the first node nitrogen topdressing rate table.
• Manage irrigations to maintain 50% soil moisture from stem elongation to the mid dough stage, budgeting 2 to 3 spring irrigations. Plan the last irrigation at the early milk stage to allow good grain fill up to the mid dough stage.
• Maintain three green leaves per shoot at flowering using foliar fungicide sprays for stripe rust and other diseases.
• Apply a second nitrogen topdressing of 60–90 kg N/ha (125–188 kg urea/ha) between the booting to head emergence stages and water in the fertiliser.
• Complete a Wheatcheck record of the crop yield and quality and the practices used to grow the crop. Return the record to your District Agronomist who can arrange for the crop practices to be benchmarked with other crops.
GrowinG eiGht tonnes a he
Acknowledgements
Particular thanks to Rachael Whitworth, NSW DPI, Griffith for her editing and other valuable input in developing this Primefact. Maarten Stapper, CSIRO, Canberra John Angus, CSIRO, Canberra
References
Giblin, K & Lacy, J (eds) 2003, Wheatcheck recommendations: best management practices for irrigated and dryland wheat in the southern Murray– Darling Basin, contribs S Anderson, J Angus, G Barron, L Evans, D Gray, M Stapper, J Thompson and R Whitworth, NSW Agriculture, Finley.
Angus, J and Lacy, J 2001, Targeting nitrogen for an 7–8 tonne/ha irrigated wheat crop, handout, GRDC Grains Update, Finley RSL Club, August.
Angus, J and Lacy, J 2002a, ‘N management for an 8 tonne/ha wheat under irrigation in south-eastern Australia’, Farmers Newsletter, no. 161, Spring.
Angus, J and Lacy, J 2002b, ‘A targeted nitrogen budget lifts irrigated crop yields’, Farming Ahead, no. 129, September.
Stapper, M & Murray, D 1986, SIRAGCROP: field observations and crop standards for wheat, SIRAGCROP Technical Report No. 1, CSIRO and Department of Agriculture New South Wales, Griffith.
Stapper, M 2006, Irrigated winter cereals – variety choice and management, Research Update for Growers – Northern Region, GRDC Code: CSP342 Agronomy Soils Environment, available at http://www.grdc.com. au/growers/res_upd/north/n06/stapper.htm
ALWAYS READ THE LABEL
Users of agricultural or veterinary chemical products must always read the label and any Permit, before using the product, and strictly comply with the directions on the label and the conditions of any Permit. Users are not absolved from compliance with the directions on the label or the conditions of the Permit by reason of any statement made or not made in this publication.
Published by NSW Department of Primary Industries © State of New South Wales 2006
ISSN 1832-6668 Job number 6612
Updates of this Primefact are available at www.dpi.nsw.gov.au/primefacts
Disclaimer: The information contained in this publication is based on knowledge and understanding at the time of writing (July 2006). However, because of advances in knowledge, users are reminded of the need to ensure that information upon which they rely is up to date and to check currency of the information with the appropriate officer of New South Wales Department of Primary Industries or the user’s independent adviser.
ctare of irriGated wheat in southern nsw, primefact 197 11