Am J Physiol Heart Circ Physiol-2010-López-Novoa-H959-74 (1)
DOI: 10.1113/jphysiol.2006.112094
2006;575;901-911; originally published online Jul 6, 2006; J. Physiol.
Burgomaster, Adeel Safdar, Sandeep Raha and Mark A. Tarnopolsky Martin J. Gibala, Jonathan P. Little, Martin van Essen, Geoffrey P. Wilkin, Kirsten A.
adaptations in human skeletal muscle and exercise performance
traditional endurance training: similar initialversusShort-term sprint interval
This information is current as of July 13, 2008
publication unless article is open access. This version of the article may not be posted on a public website for 12 months after
http://jp.physoc.org/cgi/content/full/575/3/901
This is the final published version of this article; it is available at:
[email protected]: after publication. No part of this article may be reproduced without the permission of Blackwell
articles are free 12 monthsThe Journal of Physiology Online. http://jp.physoc.org/subscriptions/ go to: The Journal of Physiology Onlinepublished continuously since 1878. To subscribe to
is the official journal of The Physiological Society. It has beenThe Journal of Physiology Online
at UNIVERSITY OF ARIZONA on July 13, 2008 jp.physoc.orgDownloaded from
J Physiol 575.3 (2006) pp 901–911 901
Short-term sprint interval versus traditional endurancetraining: similar initial adaptations in human skeletalmuscle and exercise performance
Martin J. Gibala1, Jonathan P. Little1, Martin van Essen1, Geoffrey P. Wilkin1, Kirsten A. Burgomaster1,
Adeel Safdar2, Sandeep Raha2 and Mark A. Tarnopolsky2
1Exercise Metabolism Research Group, Department of Kinesiology, McMaster University, Hamilton, Ontario, L8S 4K1, Canada2Departments of Pediatrics and Medicine, McMaster University, Hamilton, Ontario, L8N 3Z5, Canada
Brief, intense exercise training may induce metabolic and performance adaptations comparable
to traditional endurance training. However, no study has directly compared these diverse training
strategies in a standardized manner. We therefore examined changes in exercise capacity and
molecular and cellular adaptations in skeletal muscle after low volume sprint-interval training
(SIT) and high volume endurance training (ET). Sixteen active men (21 ± 1 years, V̇O2peak =4.0 ± 0.21 min−1) were assigned to a SIT or ET group (n = 8 each) and performed six training
sessions over 14 days. Each session consisted of either four to six repeats of 30 s ‘all out’ cycling
at ∼250% V̇O2peak with 4 min recovery (SIT) or 90–120 min continuous cycling at ∼65% V̇O2peak
(ET). Training time commitment over 2 weeks was ∼2.5 h for SIT and ∼10.5 h for ET, and total
training volume was ∼90% lower for SIT versus ET (∼630 versus ∼6500 kJ). Training decreased
the time required to complete 50 and 750 kJ cycling time trials, with no difference between
groups (main effects, P ≤ 0.05). Biopsy samples obtained before and after training revealed
similar increases in muscle oxidative capacity, as reflected by the maximal activity of cytochrome
c oxidase (COX) and COX subunits II and IV protein content (main effects, P ≤ 0.05), but COX
II and IV mRNAs were unchanged. Training-induced increases in muscle buffering capacity and
glycogen content were also similar between groups (main effects, P ≤ 0.05). Given the large
difference in training volume, these data demonstrate that SIT is a time-efficient strategy to
induce rapid adaptations in skeletal muscle and exercise performance that are comparable to ET
in young active men.
(Received 27 April 2006; accepted after revision 29 June 2006; first published online 6 July 2006)
Corresponding author M. J. Gibala: Department of Kinesiology IWC AB122, McMaster University, 1280 Main Street
West, Hamilton, Ontario, L8S 4K1, Canada. Email: [email protected]
Regular endurance training induces numerousphysiological adaptations that facilitate improvedexercise capacity, i.e. the ability to sustain a givensubmaximal workload for a longer period of time orachieve a higher average power output over a fixed distanceor time (Coyle, 1995; Hawley, 2002). One of the mostprominent adaptations to training is a change in skeletalmuscle substrate metabolism (Holloszy & Coyle, 1984).For example, even a short period of endurance training(5–7 days) increases glycogen availability but reducesthe rate of glycogen catabolism during matched-workexercise (Green et al. 1992; Chesley et al. 1996), resultingin improved endurance capacity (Green et al. 1995).Training-induced shifts in substrate utilization areclassically attributed to the improved respiratory controlsensitivity that results from an increase in mitochondrial
density, as reflected by changes in the maximal activityor protein content of enzymes in the tricarboxylic acidcycle and electron transport chain (Saltin & Gollnick,1983; Holloszy & Coyle, 1984). However, other factorsmust also contribute to the training response, as shownby studies that show metabolic (Green et al. 1992; Clarket al. 2004) or performance adaptations (Coyle et al. 1988;Weston et al. 1997) despite no change in muscle oxidativecapacity.
In contrast to traditional endurance training (ET),high-intensity sprint interval training (SIT) is generallythought to have less of an effect on muscle oxidativecapacity, substrate utilization and endurance performance(Gleeson, 2000; Kubukeli et al. 2002). However, SITincreases the maximal activities of mitochondrial enzymes(Henriksson & Reitman, 1976; Saltin et al. 1976;
C© 2006 The Authors. Journal compilation C© 2006 The Physiological Society DOI: 10.1113/jphysiol.2006.112094
at UNIVERSITY OF ARIZONA on July 13, 2008 jp.physoc.orgDownloaded from
902 M. J. Gibala and others J Physiol 575.3
Burgomaster et al. 2005), reduces glycogen utilizationand lactate accumulation during matched-work exercise(Harmer et al. 2000; Clark et al. 2004; Burgomasteret al. 2006) and improves performance during tasks thatprimarily rely on aerobic metabolism (Burgomaster et al.2005; Burgomaster et al. 2006; Eddy et al. 1977). SITmay also be more effective than ET for improving otherimportant determinants of endurance performance, suchas muscle buffering capacity (Weston et al. 1997; Edgeet al. 2006). Low volume SIT may therefore represent atime-efficient strategy to induce muscle and performanceadaptations similar to high volume ET (Coyle, 2005).However, no study has directly compared these diversetraining approaches in a standardized manner.
The unique purpose of the present study was to comparechanges in exercise capacity and molecular and cellularadaptations in skeletal muscle after low volume SIT andhigh volume ET. The SIT protocol was based on recentwork from our laboratory (Burgomaster et al. 2005,2006) and consisted of six sessions of brief, repeated‘all out’ 30 s cycling efforts, interspersed with a shortrecovery, over 14 days. The ET protocol was modelledafter work by others (Green et al. 1992; Spina et al. 1996)and consisted of six sessions of 90–120 min of moderateintensity cycling exercise, with 1–2 days of recoveryinterspersed between training sessions. As a result, subjectsin both groups performed the same number of trainingsessions on the same days with the same number ofrecovery days; however, total training volume was ∼90%lower in the SIT group. Needle biopsy samples wereobtained before and after training to examine changesin muscle factors related to exercise tolerance, includingmuscle oxidative capacity and buffering capacity (Hawley,2002). Performance tests included 50 kJ and 750 kJ cyclingtime trials, which required ∼2 min and ∼1 h to complete,respectively, and thus differed considerably in the relativeenergy contribution from oxidative and non-oxidativemetabolism. We hypothesized that both SIT and ET wouldincrease muscle oxidative capacity and 750 kJ time trialperformance, given the major contribution from aerobicmetabolism during this task. In contrast, we hypothesizedthat SIT but not ET would increase muscle bufferingcapacity and 50 kJ time trial performance given the largecontribution from non-oxidative metabolism during thistask.
Methods
Subjects
Sixteen healthy men were recruited to take part in theexperiment (Table 1). All subjects were physically activestudents at McMaster University who took part in someform of recreational exercise two to three times per week(jogging, cycling, etc.). None of the subjects were engagedin regular training for a particular sporting event. Eight
Table 1. Subject characteristics
Variable SIT group ET group
Age (years) 22 ± 1 21 ± 1Weight (kg) 78 ± 2 81 ± 4Height (cm) 183 ± 2 184 ± 2Body mass index 23.3 ± 0.5 24.0 ± 1.0V̇O2peak (l min−1) 4.1 ± 0.2 4.0 ± 0.3
Values are means ± S.E.M., n = 8 per group. SIT, sprint intervaltraining: ET, endurance training: V̇O2peak, peak oxygen uptake.There were no differences between groups in any descriptivecharacteristic.
subjects were randomly assigned to a SIT group and theother eight were assigned to an ET group. Followingroutine medical screening, subjects were advised of thepurpose of the study and associated risks, and all providedwritten informed consent. The experimental protocolwas approved by the McMaster University and HamiltonHealth Sciences Research Ethics Board and conformed tothe Declaration of Helsinki.
Pre-experimental procedures
Prior to baseline measurements, subjects made severalfamiliarization visits to the laboratory in order to becomeorientated with the testing procedures and trainingdevices. During one of these visits, subjects performed anincremental test to exhaustion on an electronically brakedcycle ergometer (Lode Excalibur Sport V2.0, Groningen,the Netherlands) to determine V̇O2peak using an onlinegas collection system (Moxus modular oxygen uptakesystem, AEI technologies, Pittsburgh, PA, USA). Followinga 5 min warm-up at 50 W, the test began with the workloadincreasing by 1 W every 2 s until volitional exhaustion. Thevalue used for V̇O2peak corresponded to the highest valueachieved over a 30 s collection period. All subjects alsoperformed a 50 kJ time trial and 750 kJ time trial in orderto become familiarized with the exercise tests employedduring the main experimental trials. Subjects in the SITgroup also performed a familiarization Wingate test, andsubjects in the ET group performed a submaximal exercisetest to determine the workload that elicited ∼65% V̇O2peak.All exercise tests performed during the familiarizationperiod were performed on separated days, separated byat least 24 h, and at least 3 days prior to baseline testing.
Details of exercise performance tests
Time trials. Subjects were instructed to complete 50and 750 kJ self-paced laboratory time trials on anelectronically braked cycle ergometer (Lode) as quicklyas possible with no temporal, verbal or physiologicalfeedback. The only feedback provided during the timetrials was work completed, which was presented as
C© 2006 The Authors. Journal compilation C© 2006 The Physiological Society
at UNIVERSITY OF ARIZONA on July 13, 2008 jp.physoc.orgDownloaded from
J Physiol 575.3 Rapid adaptations to sprint or endurance training in humans 903
Table 2. Training protocols
Parameter SIT group ET group
Work intensity ‘All out’ supramaximal 65% V̇O2peak
(∼700 w) (∼175 w)Exercise protocol 30 s × 4–6 repeats, 90–120 min of
(per session) 4 min recovery continuous exercise
Total exercise/training time 2–3 min (intervals only) 90–120 mincommitment per session 18–27 min (incl. recovery)
Total exercise/training time 15 min (intervals only) 630 mincommitment over 2 weeks 135 min (incl. recovery)
Total exercise volume1 ∼630 kJ (intervals only) ∼6500 kJover 2 weeks ∼950 kJ (incl. recovery)2
SIT, sprint interval training; ET, endurance training; V̇O2peak, peak oxygen uptake.1Based on average workloads sustained during training and 2assuming subjectscycled at the highest workload permitted during recovery (30 W) for the maximumduration (4 min) after every interval performed during training (total of 30 intervalsover 2 weeks).
‘distance covered’ on a computer monitor (i.e. 50 kJ wasequated to 2 km, and 750 kJ was equated to 30 km, suchthat visual feedback at any point during the time trial waspresented in units of distance rather than work completed).Exercise duration and average power were recorded uponcompletion of each test.
Wingate test. Subjects in the SIT group completed a 30 smaximal effort on an electronically braked cycle ergometer(Lode) at a resistance equivalent to 7.5% of their bodymass. The ergometer was interfaced with a computerloaded with software (Wingate Software Version 1.11, LodeBV) that applied the appropriate load for each subject.Subjects were instructed to begin pedalling as fast aspossible ∼2 s before the computer applied the load andreceived extensive verbal encouragement throughout thetest. Peak power, mean power and fatigue index werecalculated and recorded by an online data acquisitionsystem.
Experimental protocol
The experimental protocol consisted of (i) baseline testing(i.e. following familiarization); (ii) a 2 week trainingintervention, and (iii) post-training procedures.
Baseline testing. Prior to training, all subjects underwenta resting needle muscle biopsy procedure. The lateralportion of one thigh was anaesthetized (1% xylocaine)and a small incision made through the skin and underlyingfascia in order to obtain a tissue sample from the vastuslateralis muscle. The muscle sample was immediatelyfrozen in liquid nitrogen after removal from the leg.Subjects also performed two baseline performance testsand the timing of the tests was standardized for allsubjects. Subjects performed a 50 kJ cycling time trial 1 h
after the biopsy procedure, followed 48 h later by a 750 kJcycling time trial.
Training. The training protocol commenced ∼48 h afterthe 750 kJ time trial and consisted of six sessions spreadover 14 days, with 1–2 days recovery between trainingsessions (Table 2). Both groups performed training onMondays, Wednesdays and Fridays for 2 weeks. For the SITgroup, training consisted of repeated 30 s maximal cyclingefforts, interspersed with 4 min of recovery (rest or lightcycling at 30 W). Training progression was implementedby increasing the number of repeats from four repetitionsduring sessions 1 and 2, to five repetitions during sessions3 and 4, and finally to six repetitions during sessions 5and 6. For the ET group, training consisted of 90–120 minof continuous cycling at an intensity corresponding to65% of V̇O2peak. Training progression in the ET groupwas implemented by increasing the duration of exercisefrom 90 min during sessions 1 and 2, to 105 min duringsessions 3 and 4, and finally to 120 min during sessions 5and 6. All training sessions for both groups were directlysupervised by one of the study investigators.
Post-training procedures. The nature and timing of thepost-training tests was identical in all respects to thepre-training procedures. A resting needle muscle biopsysample was obtained ∼72 h after the final training session,using the same leg as for the pre-training sample butseparated by a minimum of 5 cm from the first incision.A 50 kJ time trial was performed 1 h after the biopsyprocedure, followed 48 h later by the 750 kJ time trial.
Physical activity and nutritional controls
Subjects were instructed to continue their normal dietaryand physical activity practices throughout the experiment.
C© 2006 The Authors. Journal compilation C© 2006 The Physiological Society
at UNIVERSITY OF ARIZONA on July 13, 2008 jp.physoc.orgDownloaded from
904 M. J. Gibala and others J Physiol 575.3
Subjects were also instructed to refrain from any exerciseaside from activities of daily living for 2 days prior tothe biopsy procedures and exercise performance tests.In order to minimize diet-induced variability in musclemetabolism, subjects were also instructed to consumethe same types and quantities of food for 2 days priorto the resting muscle biopsy and the time trials. Subjectswere required to complete food diaries prior to the baselinebiopsy and performance tests. The food diaries werecollected, photocopied and returned to the subjectsbefore the post-training tests so that subjects couldreplicate their individual pattern of food intake.
Muscle analyses
Frozen wet muscle samples were initially sectioned intoseveral pieces under liquid nitrogen and stored at –80◦C.One piece of frozen muscle was freeze dried, powderedand dissected free of all non-muscle elements and storedat –80◦C.
Enzyme activity. One piece of frozen wet muscle washomogenized using a glass tissue grinder in a buffercontaining 50 mm K2HPO4, 1 mm EDTA and 1 mm DTT(pH 7.4). The maximal activity of cytochrome c oxidase(COX) was determined on a spectrophotometer (CaryBIO 300, Varian Cary Instruments, Toronto, ON, Canada)using previously described methods (Carter et al. 2001).Reactions were carried out over a 3 min period and allassays were performed in duplicate. Protein content ofthe muscle homogenate was determined by the methodof Lowry et al. (1951) and enzyme activity was calculatedin mol (kg protein)−1 h−1.
Western blotting. The amounts of COX subunit II(mitochondrial encoded) and COX subunit IV (nuclearencoded) were quantified using Western blotting aspreviously described (Raha et al. 2002). One piece offrozen wet muscle was homogenized and proteins wereseparated using 12.5% Tris–glycine polyacrylamide gelelectrophoresis for 1.5 h at 110 V constant voltage(Bio-Rad Protean III, Bio-Rad Laboratories Ltd,Mississauga, ON, Canada). The electrophoretogram wastransferred to nitrocellulose using 100 V for 1 h in 1 ×transfer buffer (25 mm Tris base, 192 mm glycine, 24%v/v methanol and 0.1% SDS). The nitrocellulose wasblocked with 5% skim milk in Tris-buffered saline (TBST:137 mm NaCl, 2.7 mm KCl, 25 mm Tris-Cl, pH 8.0, 0.1%Tween-20) for 2 h at room temperature. The membranewas incubated with monoclonal antibodies againstCOX II and COX IV (Mitosciences, Eugene, OR, Canada)using 1 : 2500 and 1 : 1000 dilutions, respectively, andincubated in TBST supplemented with 3% skim milk.The two antibodies were used simultaneously to probe theWestern blot in a volume of 10 ml at 4◦C for 16 h. The blots
Table 3. Primer sequences
Gene Forward primer Reverse primer
β2M ggctatccagcgtactccaa gatgaaacccagacacatagcaCOX II cgactacggcggactaatct tcgattgtcaacgtcaaggaCOX IV cgagcaatttccacctctgt ggtcacgccgatccatataa
β2M, beta2-microglobulin; COX, cyctochrome c oxidase.
were developed using horseradish peroxidase conjugatedsecondary antibody targeted to mouse and/or rabbit inconjunction with an enhanced chemiluninescence kit(ECL Plus, Amersham Biosciences, Laval, PQ, Canada)and analysed using a software package (Image J, NIH,Bethesda, MD, USA).
RNA extraction, reverse transcription and RT-PCR. TotalRNA was extracted from wet muscle using a commerciallyavailable TRIzol Reagent (Invitrogen Canada, Burlington,ON, Canada) following the manufacturer’s instructions.The concentration and purity of the RNA was determinedspectrophotometrically by measuring the absorbance at260 (OD260) and 280 (OD280) with an OD260/OD280 ratioof 1.5–1.6. The integrity of RNA samples were assessedby RNA agarose–formaldehyde gel electrophoresis andevaluating the ratio of 28S to 18S rRNA bands.
One microgram of RNA, DNase treated (DNA-free,Ambion Inc., Austin, TX, USA), was converted to cDNAusing a commercially available kit (1st Strand cDNASynthesis Kit for RT-PCR (AMV), Roche Applied Science,Laval, PQ, Canada). Briefly, the reaction volume of 20 μlfor RT contained: 1 × reaction buffer, 5 mm MgCl2, 1 mm
dNTP mixture, 3.2 μg of random primer p(dN)6, 50 URNase inhibitor, 0.8 μl avian myeloblastosis virus (AMV)reverse transcriptase, and 1 μg DNA-free RNA. Reversetranscription was performed in a thermal cycler (AppliedBiosystems, Foster City, CA, USA): 25◦C for 10 min, 42◦Cfor 60 min, 99◦C for 5 min, and 4◦C for 5 min. All RNAsamples were converted to cDNA together to preventtechnical variation. Negative controls (no RNA or noreverse transcriptase enzyme) were run simultaneouslywith samples to control for RNA and genomic DNAcontamination.
The primers for real-time PCR were designedusing Primer3 software (Whitehead Institute forBiomedical Research) and their thermodynamic specificitywas determined using BLAST sequence alignments(NCBI) and Oligo analyser software (Integrated DNATechnologies, Coralville, IA, USA). Real-time PCR wasperformed using an iCycler real-time PCR system(Bio-Rad Laboratories, CA) using SYBR Green 1chemistry (iQ SYBR Green Supermix) according to themanufacturer’s instructions. Briefly, the reaction volumeof 25 μl for PCR contained: 1 × iQ SYBR Green Super-mix, forward and reverse primers (Table 3) and 10 ngcDNA template. The application was performed for 1 cycle(50◦C for 2 min, 95◦C for 10 min) followed by 40 cycles
C© 2006 The Authors. Journal compilation C© 2006 The Physiological Society
at UNIVERSITY OF ARIZONA on July 13, 2008 jp.physoc.orgDownloaded from
J Physiol 575.3 Rapid adaptations to sprint or endurance training in humans 905
(95◦C for 15 s, 60◦C for 60 s) and the beta2-microglobulin(β2M) signal was used as a housekeeping gene to normalizethreshold cycle (CT) values. All samples were run induplicate simultaneously with RNA- and RT-negativecontrols. In addition, the melting point dissociation curvegenerated by the instrument was also used to confirm thespecificity of the amplified product.
Muscle buffering capacity. The in vitro method of Marlin& Harris (1991) was employed, except that NaF as opposedto iodoacetic acid was used to inhibit glycolysis becauseit is acid–base neutral and would not affect the initialpH measurement (Mannion et al. 1993). Briefly, ∼3 mgof freeze-dried muscle was homogenized to a dilution of5.0 mg ml−1 in a solution of 145 mm KCl, 10 mm NaCland 5 mm NaF. After homogenization, the muscle samplewas incubated for 5 min in a hot water bath at 37◦Cand an initial pH measurement was obtained using amicroelectrode (MI-415, Microelectrodes, Inc., Bedford,NH, USA) connected to a pH meter (Denver Instruments,Denver, CO, USA). If the initial pH was below 7.10, itwas adjusted to 7.10 with 10 mm NaOH (Marlin & Harris,1991; Mannion et al. 1993). The sample was then titratedacross a physiological pH range from 7.10 to 6.50 by theaddition of 2.5 μl aliquots of 10 mm HCl. Muscle bufferingcapacity was subsequently calculated in μmol H+ (g drymuscle)−1 pH unit−1.
Muscle glycogen. Briefly, ∼2 mg of freeze-dried musclewas incubated in 2.0 n HCl and heated for 2 h at 100◦C tohydrolyse the glycogen to glucosyl units. The solution wassubsequently neutralized with an equal volume of 2.0 n
NaOH and analysed for glucose using an enzymatic assayadapted for fluorometry (Passoneau & Lowry, 1993).
Statistical analyses
All data were analysed using a 2-factor analysis of variance,with one between factor (group; SIT versus ET) and onewithin factor (time; pre-training versus post-training).Analyses of mRNA data were performed by comparing thedifference between the target and reference CT values (deltaCT) as previously described (Livak & Schmittgen, 2001;Mahoney et al. 2004). The differences in the CT valuesare expressed numerically using the equation mRNA =2−deltaCT . The level of significance for all analyses was set atP = 0.05. All data are presented as means ± s.e.m. basedon n = 8 subjects per group, except for glycogen wheren = 7 for the SIT group only.
Results
Exercise performance
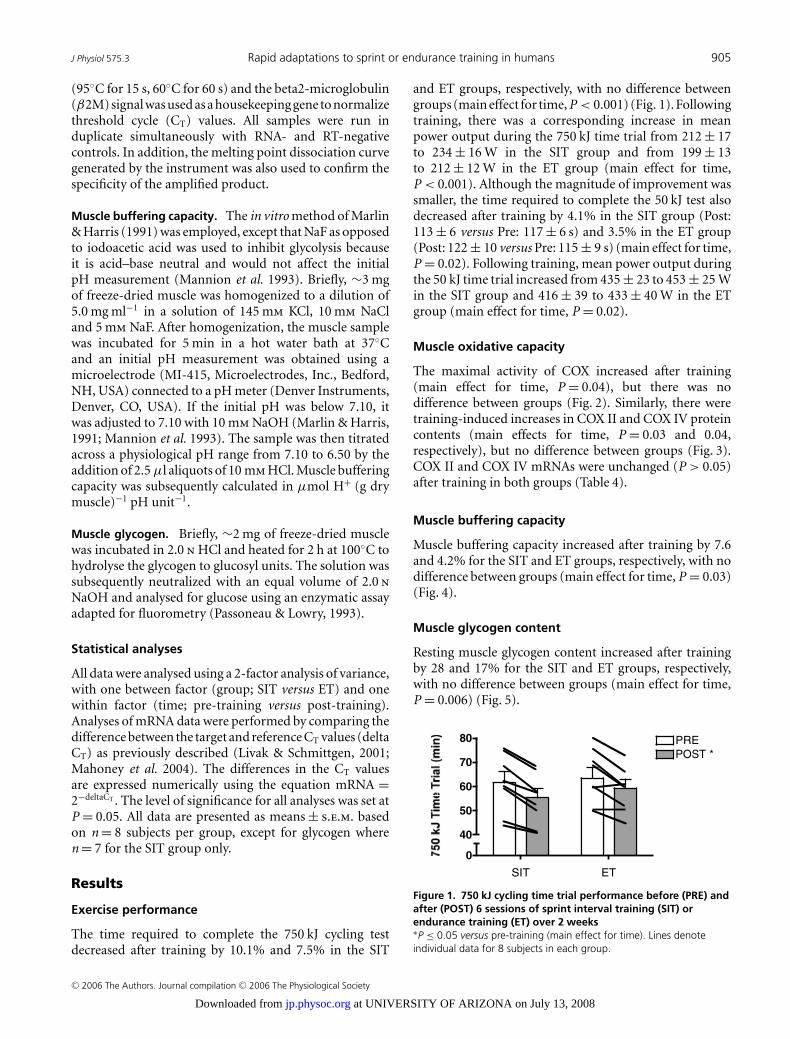
The time required to complete the 750 kJ cycling testdecreased after training by 10.1% and 7.5% in the SIT
and ET groups, respectively, with no difference betweengroups (main effect for time, P < 0.001) (Fig. 1). Followingtraining, there was a corresponding increase in meanpower output during the 750 kJ time trial from 212 ± 17to 234 ± 16 W in the SIT group and from 199 ± 13to 212 ± 12 W in the ET group (main effect for time,P < 0.001). Although the magnitude of improvement wassmaller, the time required to complete the 50 kJ test alsodecreased after training by 4.1% in the SIT group (Post:113 ± 6 versus Pre: 117 ± 6 s) and 3.5% in the ET group(Post: 122 ± 10 versus Pre: 115 ± 9 s) (main effect for time,P = 0.02). Following training, mean power output duringthe 50 kJ time trial increased from 435 ± 23 to 453 ± 25 Win the SIT group and 416 ± 39 to 433 ± 40 W in the ETgroup (main effect for time, P = 0.02).
Muscle oxidative capacity
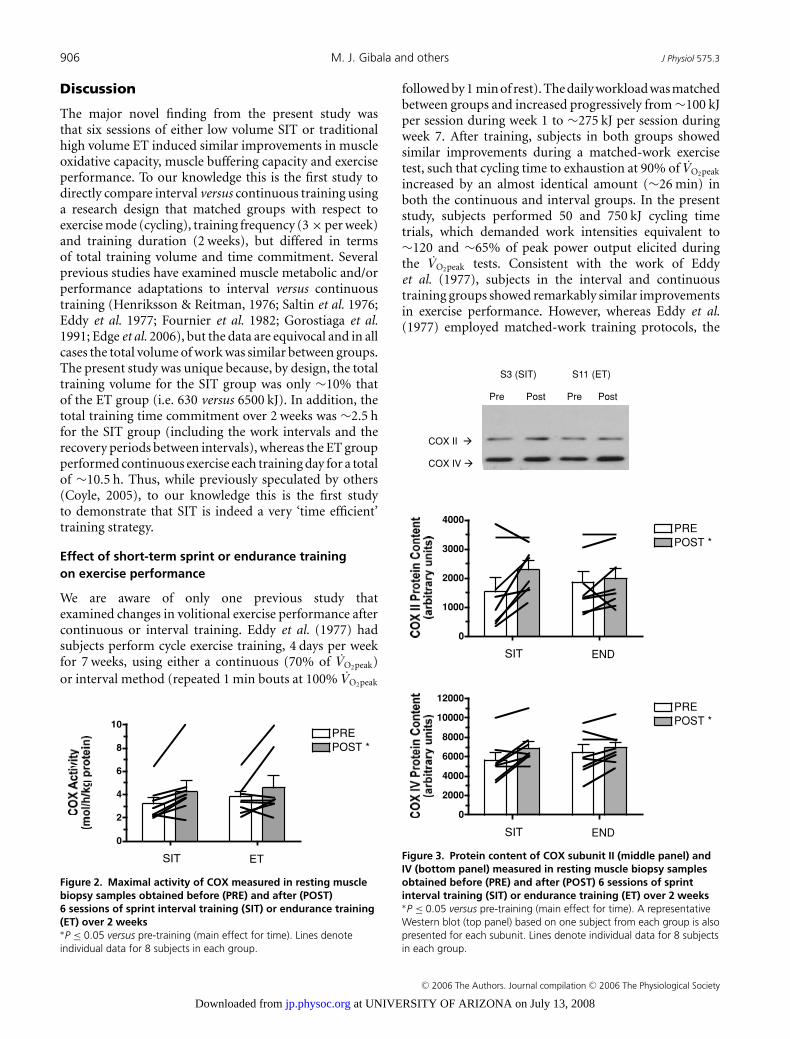
The maximal activity of COX increased after training(main effect for time, P = 0.04), but there was nodifference between groups (Fig. 2). Similarly, there weretraining-induced increases in COX II and COX IV proteincontents (main effects for time, P = 0.03 and 0.04,respectively), but no difference between groups (Fig. 3).COX II and COX IV mRNAs were unchanged (P > 0.05)after training in both groups (Table 4).
Muscle buffering capacity
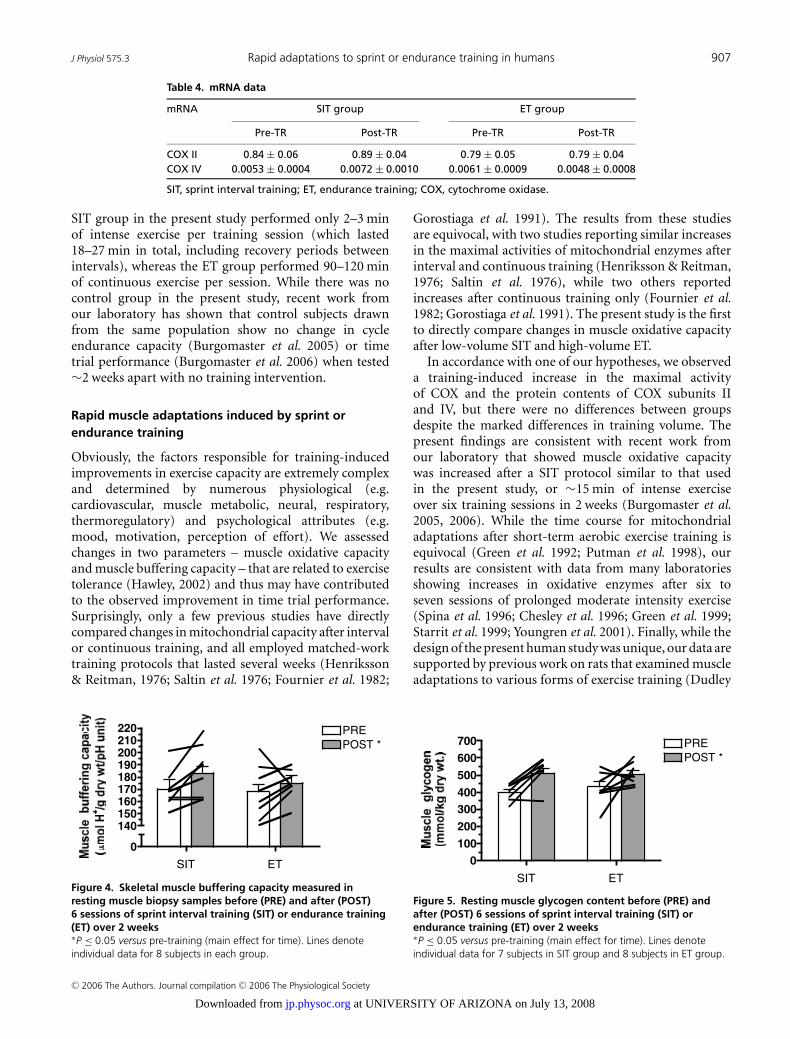
Muscle buffering capacity increased after training by 7.6and 4.2% for the SIT and ET groups, respectively, with nodifference between groups (main effect for time, P = 0.03)(Fig. 4).
Muscle glycogen content
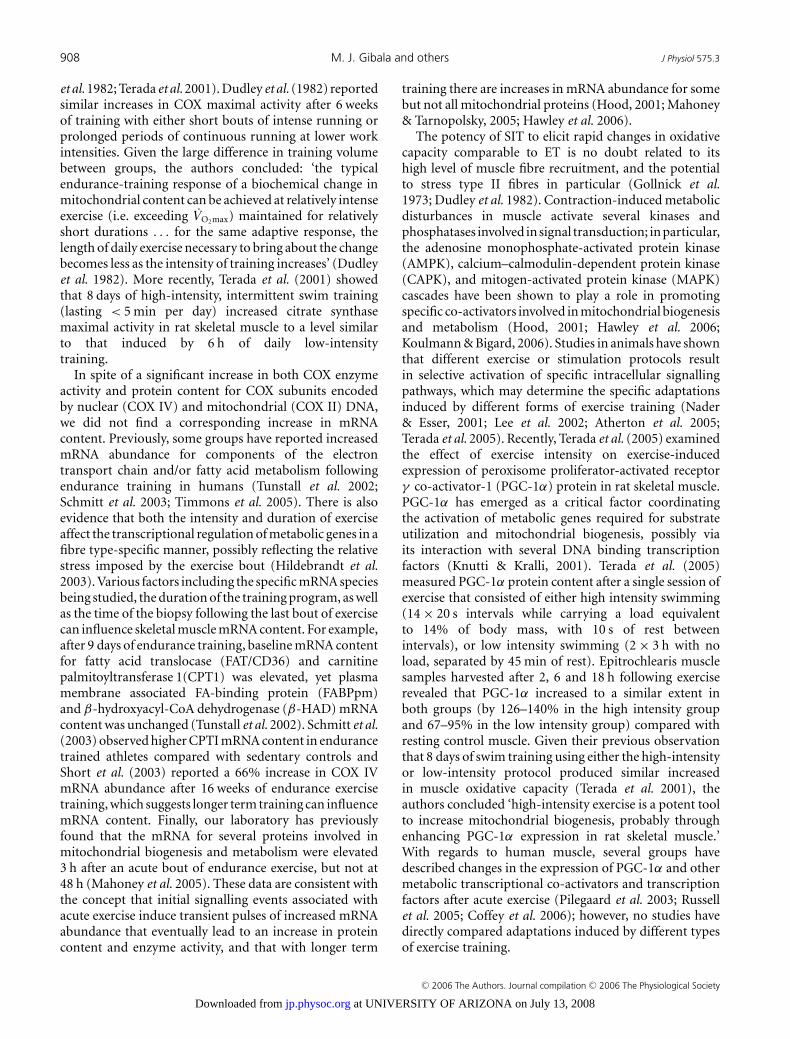
Resting muscle glycogen content increased after trainingby 28 and 17% for the SIT and ET groups, respectively,with no difference between groups (main effect for time,P = 0.006) (Fig. 5).
0
PRE
SIT ET
40
50
60
70
80
POST *
Figure 1. 750 kJ cycling time trial performance before (PRE) andafter (POST) 6 sessions of sprint interval training (SIT) orendurance training (ET) over 2 weeks∗P ≤ 0.05 versus pre-training (main effect for time). Lines denoteindividual data for 8 subjects in each group.
C© 2006 The Authors. Journal compilation C© 2006 The Physiological Society
at UNIVERSITY OF ARIZONA on July 13, 2008 jp.physoc.orgDownloaded from
906 M. J. Gibala and others J Physiol 575.3
Discussion
The major novel finding from the present study wasthat six sessions of either low volume SIT or traditionalhigh volume ET induced similar improvements in muscleoxidative capacity, muscle buffering capacity and exerciseperformance. To our knowledge this is the first study todirectly compare interval versus continuous training usinga research design that matched groups with respect toexercise mode (cycling), training frequency (3 × per week)and training duration (2 weeks), but differed in termsof total training volume and time commitment. Severalprevious studies have examined muscle metabolic and/orperformance adaptations to interval versus continuoustraining (Henriksson & Reitman, 1976; Saltin et al. 1976;Eddy et al. 1977; Fournier et al. 1982; Gorostiaga et al.1991; Edge et al. 2006), but the data are equivocal and in allcases the total volume of work was similar between groups.The present study was unique because, by design, the totaltraining volume for the SIT group was only ∼10% thatof the ET group (i.e. 630 versus 6500 kJ). In addition, thetotal training time commitment over 2 weeks was ∼2.5 hfor the SIT group (including the work intervals and therecovery periods between intervals), whereas the ET groupperformed continuous exercise each training day for a totalof ∼10.5 h. Thus, while previously speculated by others(Coyle, 2005), to our knowledge this is the first studyto demonstrate that SIT is indeed a very ‘time efficient’training strategy.
Effect of short-term sprint or endurance trainingon exercise performance
We are aware of only one previous study thatexamined changes in volitional exercise performance aftercontinuous or interval training. Eddy et al. (1977) hadsubjects perform cycle exercise training, 4 days per weekfor 7 weeks, using either a continuous (70% of V̇O2peak)
or interval method (repeated 1 min bouts at 100% V̇O2peak
0
2
4
6
8
10PRE
POST *
SIT ET
Figure 2. Maximal activity of COX measured in resting musclebiopsy samples obtained before (PRE) and after (POST)6 sessions of sprint interval training (SIT) or endurance training(ET) over 2 weeks∗P ≤ 0.05 versus pre-training (main effect for time). Lines denoteindividual data for 8 subjects in each group.
followed by 1 min of rest). The daily workload was matchedbetween groups and increased progressively from ∼100 kJper session during week 1 to ∼275 kJ per session duringweek 7. After training, subjects in both groups showedsimilar improvements during a matched-work exercisetest, such that cycling time to exhaustion at 90% of V̇O2peak
increased by an almost identical amount (∼26 min) inboth the continuous and interval groups. In the presentstudy, subjects performed 50 and 750 kJ cycling timetrials, which demanded work intensities equivalent to∼120 and ∼65% of peak power output elicited duringthe V̇O2peak tests. Consistent with the work of Eddyet al. (1977), subjects in the interval and continuoustraining groups showed remarkably similar improvementsin exercise performance. However, whereas Eddy et al.(1977) employed matched-work training protocols, the
S3 (SIT) S11 (ET)
Pre Post Pre Post
COX II
COX IV
0
1000
2000
3000
4000PREPOST *
SIT END
0
2000
4000
6000
8000
10000
12000PREPOST *
SIT END
Figure 3. Protein content of COX subunit II (middle panel) andIV (bottom panel) measured in resting muscle biopsy samplesobtained before (PRE) and after (POST) 6 sessions of sprintinterval training (SIT) or endurance training (ET) over 2 weeks∗P ≤ 0.05 versus pre-training (main effect for time). A representativeWestern blot (top panel) based on one subject from each group is alsopresented for each subunit. Lines denote individual data for 8 subjectsin each group.
C© 2006 The Authors. Journal compilation C© 2006 The Physiological Society
at UNIVERSITY OF ARIZONA on July 13, 2008 jp.physoc.orgDownloaded from
J Physiol 575.3 Rapid adaptations to sprint or endurance training in humans 907
Table 4. mRNA data
mRNA SIT group ET group
Pre-TR Post-TR Pre-TR Post-TR
COX II 0.84 ± 0.06 0.89 ± 0.04 0.79 ± 0.05 0.79 ± 0.04COX IV 0.0053 ± 0.0004 0.0072 ± 0.0010 0.0061 ± 0.0009 0.0048 ± 0.0008
SIT, sprint interval training; ET, endurance training; COX, cytochrome oxidase.
SIT group in the present study performed only 2–3 minof intense exercise per training session (which lasted18–27 min in total, including recovery periods betweenintervals), whereas the ET group performed 90–120 minof continuous exercise per session. While there was nocontrol group in the present study, recent work fromour laboratory has shown that control subjects drawnfrom the same population show no change in cycleendurance capacity (Burgomaster et al. 2005) or timetrial performance (Burgomaster et al. 2006) when tested∼2 weeks apart with no training intervention.
Rapid muscle adaptations induced by sprint orendurance training
Obviously, the factors responsible for training-inducedimprovements in exercise capacity are extremely complexand determined by numerous physiological (e.g.cardiovascular, muscle metabolic, neural, respiratory,thermoregulatory) and psychological attributes (e.g.mood, motivation, perception of effort). We assessedchanges in two parameters – muscle oxidative capacityand muscle buffering capacity – that are related to exercisetolerance (Hawley, 2002) and thus may have contributedto the observed improvement in time trial performance.Surprisingly, only a few previous studies have directlycompared changes in mitochondrial capacity after intervalor continuous training, and all employed matched-worktraining protocols that lasted several weeks (Henriksson& Reitman, 1976; Saltin et al. 1976; Fournier et al. 1982;
0
PRE
SIT ET
POST *
140150160170180190200210220
Figure 4. Skeletal muscle buffering capacity measured inresting muscle biopsy samples before (PRE) and after (POST)6 sessions of sprint interval training (SIT) or endurance training(ET) over 2 weeks∗P ≤ 0.05 versus pre-training (main effect for time). Lines denoteindividual data for 8 subjects in each group.
Gorostiaga et al. 1991). The results from these studiesare equivocal, with two studies reporting similar increasesin the maximal activities of mitochondrial enzymes afterinterval and continuous training (Henriksson & Reitman,1976; Saltin et al. 1976), while two others reportedincreases after continuous training only (Fournier et al.1982; Gorostiaga et al. 1991). The present study is the firstto directly compare changes in muscle oxidative capacityafter low-volume SIT and high-volume ET.
In accordance with one of our hypotheses, we observeda training-induced increase in the maximal activityof COX and the protein contents of COX subunits IIand IV, but there were no differences between groupsdespite the marked differences in training volume. Thepresent findings are consistent with recent work fromour laboratory that showed muscle oxidative capacitywas increased after a SIT protocol similar to that usedin the present study, or ∼15 min of intense exerciseover six training sessions in 2 weeks (Burgomaster et al.2005, 2006). While the time course for mitochondrialadaptations after short-term aerobic exercise training isequivocal (Green et al. 1992; Putman et al. 1998), ourresults are consistent with data from many laboratoriesshowing increases in oxidative enzymes after six toseven sessions of prolonged moderate intensity exercise(Spina et al. 1996; Chesley et al. 1996; Green et al. 1999;Starrit et al. 1999; Youngren et al. 2001). Finally, while thedesign of the present human study was unique, our data aresupported by previous work on rats that examined muscleadaptations to various forms of exercise training (Dudley
0
100
200
300
400
500
600
700 PRE
SIT ET
POST *
Figure 5. Resting muscle glycogen content before (PRE) andafter (POST) 6 sessions of sprint interval training (SIT) orendurance training (ET) over 2 weeks∗P ≤ 0.05 versus pre-training (main effect for time). Lines denoteindividual data for 7 subjects in SIT group and 8 subjects in ET group.
C© 2006 The Authors. Journal compilation C© 2006 The Physiological Society
at UNIVERSITY OF ARIZONA on July 13, 2008 jp.physoc.orgDownloaded from
908 M. J. Gibala and others J Physiol 575.3
et al. 1982; Terada et al. 2001). Dudley et al. (1982) reportedsimilar increases in COX maximal activity after 6 weeksof training with either short bouts of intense running orprolonged periods of continuous running at lower workintensities. Given the large difference in training volumebetween groups, the authors concluded: ‘the typicalendurance-training response of a biochemical change inmitochondrial content can be achieved at relatively intenseexercise (i.e. exceeding V̇O2max) maintained for relativelyshort durations . . . for the same adaptive response, thelength of daily exercise necessary to bring about the changebecomes less as the intensity of training increases’ (Dudleyet al. 1982). More recently, Terada et al. (2001) showedthat 8 days of high-intensity, intermittent swim training(lasting < 5 min per day) increased citrate synthasemaximal activity in rat skeletal muscle to a level similarto that induced by 6 h of daily low-intensitytraining.
In spite of a significant increase in both COX enzymeactivity and protein content for COX subunits encodedby nuclear (COX IV) and mitochondrial (COX II) DNA,we did not find a corresponding increase in mRNAcontent. Previously, some groups have reported increasedmRNA abundance for components of the electrontransport chain and/or fatty acid metabolism followingendurance training in humans (Tunstall et al. 2002;Schmitt et al. 2003; Timmons et al. 2005). There is alsoevidence that both the intensity and duration of exerciseaffect the transcriptional regulation of metabolic genes in afibre type-specific manner, possibly reflecting the relativestress imposed by the exercise bout (Hildebrandt et al.2003). Various factors including the specific mRNA speciesbeing studied, the duration of the training program, as wellas the time of the biopsy following the last bout of exercisecan influence skeletal muscle mRNA content. For example,after 9 days of endurance training, baseline mRNA contentfor fatty acid translocase (FAT/CD36) and carnitinepalmitoyltransferase 1(CPT1) was elevated, yet plasmamembrane associated FA-binding protein (FABPpm)and β-hydroxyacyl-CoA dehydrogenase (β-HAD) mRNAcontent was unchanged (Tunstall et al. 2002). Schmitt et al.(2003) observed higher CPTI mRNA content in endurancetrained athletes compared with sedentary controls andShort et al. (2003) reported a 66% increase in COX IVmRNA abundance after 16 weeks of endurance exercisetraining, which suggests longer term training can influencemRNA content. Finally, our laboratory has previouslyfound that the mRNA for several proteins involved inmitochondrial biogenesis and metabolism were elevated3 h after an acute bout of endurance exercise, but not at48 h (Mahoney et al. 2005). These data are consistent withthe concept that initial signalling events associated withacute exercise induce transient pulses of increased mRNAabundance that eventually lead to an increase in proteincontent and enzyme activity, and that with longer term
training there are increases in mRNA abundance for somebut not all mitochondrial proteins (Hood, 2001; Mahoney& Tarnopolsky, 2005; Hawley et al. 2006).
The potency of SIT to elicit rapid changes in oxidativecapacity comparable to ET is no doubt related to itshigh level of muscle fibre recruitment, and the potentialto stress type II fibres in particular (Gollnick et al.1973; Dudley et al. 1982). Contraction-induced metabolicdisturbances in muscle activate several kinases andphosphatases involved in signal transduction; in particular,the adenosine monophosphate-activated protein kinase(AMPK), calcium–calmodulin-dependent protein kinase(CAPK), and mitogen-activated protein kinase (MAPK)cascades have been shown to play a role in promotingspecific co-activators involved in mitochondrial biogenesisand metabolism (Hood, 2001; Hawley et al. 2006;Koulmann & Bigard, 2006). Studies in animals have shownthat different exercise or stimulation protocols resultin selective activation of specific intracellular signallingpathways, which may determine the specific adaptationsinduced by different forms of exercise training (Nader& Esser, 2001; Lee et al. 2002; Atherton et al. 2005;Terada et al. 2005). Recently, Terada et al. (2005) examinedthe effect of exercise intensity on exercise-inducedexpression of peroxisome proliferator-activated receptorγ co-activator-1 (PGC-1α) protein in rat skeletal muscle.PGC-1α has emerged as a critical factor coordinatingthe activation of metabolic genes required for substrateutilization and mitochondrial biogenesis, possibly viaits interaction with several DNA binding transcriptionfactors (Knutti & Kralli, 2001). Terada et al. (2005)measured PGC-1α protein content after a single session ofexercise that consisted of either high intensity swimming(14 × 20 s intervals while carrying a load equivalentto 14% of body mass, with 10 s of rest betweenintervals), or low intensity swimming (2 × 3 h with noload, separated by 45 min of rest). Epitrochlearis musclesamples harvested after 2, 6 and 18 h following exerciserevealed that PGC-1α increased to a similar extent inboth groups (by 126–140% in the high intensity groupand 67–95% in the low intensity group) compared withresting control muscle. Given their previous observationthat 8 days of swim training using either the high-intensityor low-intensity protocol produced similar increasedin muscle oxidative capacity (Terada et al. 2001), theauthors concluded ‘high-intensity exercise is a potent toolto increase mitochondrial biogenesis, probably throughenhancing PGC-1α expression in rat skeletal muscle.’With regards to human muscle, several groups havedescribed changes in the expression of PGC-1α and othermetabolic transcriptional co-activators and transcriptionfactors after acute exercise (Pilegaard et al. 2003; Russellet al. 2005; Coffey et al. 2006); however, no studies havedirectly compared adaptations induced by different typesof exercise training.
C© 2006 The Authors. Journal compilation C© 2006 The Physiological Society
at UNIVERSITY OF ARIZONA on July 13, 2008 jp.physoc.orgDownloaded from
J Physiol 575.3 Rapid adaptations to sprint or endurance training in humans 909
With respect to our other marker of exercise tolerance,both the SIT and ET protocols induced similar increases inskeletal muscle buffering capacity, which was in contrastto one of our hypotheses. Previous studies have yieldedequivocal data with respect to exercise training andbuffering capacity (Nevill et al. 1989; Bell & Wenger, 1988;Weston et al. 1997) and to our knowledge only one grouphas specifically examined the issue of training intensity(Edge et al. 2006). Recently, Edge et al. (2006) studiedthe effect of 5 weeks of interval (4–10 repeats × 2 minat ∼90–100% V̇O2peak) or continuous training (∼20 min
at ∼60–75% V̇O2peak) on muscle buffering capacity inrecreationally active women. Following training, bufferingcapacity in the interval training group increased by ∼25%but there was no change in the group that performedcontinuous exercise. While these data (Edge et al. 2006)are in contrast to the present results, there are markeddifferences between studies in terms of the trainingstimulus. Edge et al. (2006) matched the interval andcontinuous training groups in terms of the total workperformed during each session, which meant that thecontinuous training group performed only 20 min ofmoderate intensity exercise per session. The trainingstimulus in that study (Edge et al. 2006) was thereforemodest compared with the exercise bouts performed bythe ET group in the present study (90–120 min of cyclingat ∼65% V̇O2peak per session). The present study is the firstto report improvements in muscle buffering capacity aftershort-term exercise training (<4 week) and we speculatethat changes in this parameter might represent a relativelyrapid muscle adaptation that contributes to the observedimprovement in exercise capacity. It should be notedthat the in vitro method employed in this study isolatesfor the physico-chemical buffering capacity of skeletalmuscle, which is dominated by cytosolic phosphates andproteins/peptides. Histidine-related compounds appear tobe the most important determinant of muscle bufferingcapacity, particularly across the physiological pH range(Abe, 2000), and thus in theory any protein or peptidewith histidine residues that are exposed to the cytosol couldcontribute to buffering capacity.
Perspective: limitations and implicationsof the present work
The adaptive response to physical training is obviouslyinfluenced by a multitude of complex molecular, cellularand physiological changes, and the present data should notbe interpreted to suggest that SIT is necessarily adequatepreparation for prolonged endurance-type activities. Theduration of the training program in the present study wasrelatively short (6 sessions over 2 weeks) and it remains tobe determined whether similar adaptations are manifestafter many weeks or months of interval and continuoustraining. It is possible that the time course for physio-
logical adjustments differs between training protocols; thevery intense nature of the SIT protocol may stimulaterapid changes, whereas the adaptations induced by lowerintensity ET may occur more slowly. The present studyexamined only a few specific muscle parameters, and futurestudies should examine whether low volume SIT inducesother physiological adjustments typically associated withhigh volume ET (e.g. increased maximal capacity for lipidoxidation, improvements in cardiorespiratory function,changes in blood health status markers, potential forweight loss, etc.). Although pulmonary oxygen uptake(V̇O2
) remains high during recovery between intervals,energy expenditure during a 20–30 min SIT session isnonetheless lower than a 90–120 min bout of enduranceexercise. We estimate, based on calculations of heart ratereserve, that V̇O2
during Wingate-based interval trainingaverages ∼65–70% of V̇O2peak over the course of each 30 ssprint and subsequent 4 min recovery period. Thus, basedon the average duration of each training session in thepresent study, absolute energy expenditure in the SITgroup was ≤25% of the ET group. A detailed discussion ofthe potential health benefits of various training strategiesis beyond the scope of this paper; however, obesity expertshave recognized a role for high intensity exercise inbody weight management (Hunter et al. 1998). There isalso a growing appreciation of the potential for intense,interval-based training to stimulate cardiovascular andmuscular adaptations in various populations, includingdisease states (e.g. Rognmo et al. 2004; Vogiatzis et al.2005).
In conclusion, the most striking finding from thepresent study was that two very diverse forms of traininginduced remarkably similar changes in exercise capacityand selected muscle adaptations that are related to exercisetolerance. Given the markedly lower training volume in theSIT group, our results suggest that intense interval trainingis indeed a time-efficient strategy to induce rapid muscleand performance adaptations comparable to traditionalendurance training. Additional research is warranted toclarify the effect of different acute exercise ‘impulses’ onmolecular signalling events in human skeletal muscle, andthe precise time course and mechanisms responsible forthe contraction-induced changes that facilitate the trainingadaptation.
References
Abe H (2000). Role of histidine-related compounds asintracellular proton buffering constituents in vertebratemuscle. Biochemistry (Moscow) 65, 757–765.
Atherton PJ, Babraj J, Smith K, Singh J, Rennie MJ &Wackerhage H (2005). Selective activation ofAMPK-PGC-1alpha or PKB-TSC2-mTOR signaling canexplain specific adaptive responses to endurance orresistance training-like electrical muscle stimulation.FASEB J 19, 786–788.
C© 2006 The Authors. Journal compilation C© 2006 The Physiological Society
at UNIVERSITY OF ARIZONA on July 13, 2008 jp.physoc.orgDownloaded from

910 M. J. Gibala and others J Physiol 575.3
Bell GJ & Wenger HA (1988). The effect of one-legged sprinttraining on intramuscular pH and nonbicarbonate bufferingcapacity. Eur J Appl Physiol 58, 158–164.
Burgomaster KA, Heigenhauser GJF & Gibala MJ (2006). Effectof short-term sprint interval training on humanskeletal muscle carbohydrate metabolism during exerciseand time trial performance. J Appl Physiol 100, 2041–2047.
Burgomaster KA, Hughes SC, Heigenhauser GJF, Bradwell SN& Gibala MJ (2005). Six sessions of sprint interval trainingincreases muscle oxidative potential and cycle endurancecapacity in humans. J Appl Physiol 98, 1985–1990.
Carter SL, Rennie CD, Hamilton SJ & Tarnopolsky M (2001).Changes in skeletal muscle in males and femalesfollowing endurance training. Can J Physiol Pharmacol 79,386–392.
Chesley A, Heigenhauser GJ & Spriet LL (1996). Regulation ofmuscle glycogen phosphorylase activity following short-termendurance training. Am J Physiol Endocrinol Metab 270,E328–E235.
Clark SA, Chen ZP, Murphy KT, Aughey RJ, McKenna MJ,Kemp BE & Hawley JA (2004). Intensified exercise trainingdoes not alter AMPK signaling in human skeletal muscle.Am J Physiol Endocrinol Metab 286, E737–E743.
Coffey VG, Zhong Z, Shield A, Canny BJ, Chibalin AV, ZierathJR & Hawley JA (2006). Early signaling responses todivergent exercise stimuli in skeletal muscle fromwell-trained humans. FASEB J 20, 190–192.
Coyle EF (1995). Integration of the physiological factorsdetermining endurance performance ability. Exerc Sport SciRev 23, 25–63.
Coyle EF (2005). Very intense exercise-training is extremelypotent and time efficient: a reminder. J Appl Physiol 98,1983–1984.
Coyle EF, Coggan AR, Hopper MK & Walters TJ (1988).Determinants of endurance in well-trained cyclists. J ApplPhysiol 64, 2622–2630.
Dudley GA, Abraham WM & Terjung RL (1982). Influence ofexercise intensity and duration on biochemical adaptationsin skeletal muscle. J Appl Physiol 53, 844–850.
Eddy DO, Sparks KL & Adelizi DA (1977). The effects ofcontinuous and interval training in women and men.Eur J Appl Physiol Occup Physiol 37, 83–92.
Edge J, Bishop D & Goodman C (2006). The effects of trainingintensity on muscle buffer capacity in females. Eur J ApplPhysiol 96, 97–105.
Fournier M, Ricci J, Taylor AW, Ferguson RJ, Montpetit RR &Chaitman BR (1982). Skeletal muscle adaptation inadolescent boys: sprint and endurance training anddetraining. Med Sci Sports Exerc 14, 453–456.
Gleeson M (2000). Biochemistry of Exercise. In TheEncyclopedia of Sports Medicine, VII, Nutrition in Sport ,ed.Maughan RJ, pp. 17–38. Blackwell Science, Oxford, UK.
Gollnick PD, Armstrong RB, Saltin B, Saubert CW 4th,Sembrowich WL & Shepherd RE (1973). Effect of trainingon enzyme activity and fibre composition of human skeletalmuscle. J Appl Physiol 34, 107–111.
Gorostiaga EM, Walter CB, Foster C & Hickson RC (1991).Uniqueness of interval and continuous training at the samemaintained exercise intensity. Eur J Appl Physiol OccupPhysiol 63, 101–107.
Green HJ, Ball-Burnett M, Symon S, Grant S & Jamieson G(1995). Short-term training, muscle glycogen, and cycleendurance. Can J Appl Physiol 20, 315–324.
Green H, Grant S, Bombardier E & Ranney D (1999). Initialaerobic power does not alter muscle metabolic adaptationsto short-term training. Am J Physiol Endocrinol Metab 277,E39–E48.
Green HJ, Helyar R, Ball-Burnett M, Kowalchuk N, Symon S &Farrance B (1992). Metabolic adaptations to training precedechanges in muscle mitochondrial capacity. J Appl Physiol 72,484–491.
Harmer AR, McKenna MJ, Sutton JR, Snow RJ, Ruell PA, BoothJ, Thompson MW, Mackay NA, Stathis CG, Crameri RM,Carey MF & Enger DM (2000). Skeletal muscle metabolicand ionic adaptations during intense exercise followingsprint training in humans. J Appl Physiol 89, 1793–1803.
Hawley JA (2002). Adaptations of skeletal muscle to prolonged,intense endurance training. Clin Exp Pharmacol Physiol 29,218–222.
Hawley JA, Tipton KD & Millard-Stafford ML (2006).Promoting training adaptations through nutritionalinterventions. J Sports Sci 24, 1–13.
Henriksson J & Reitman JS (1976). Quantitative measures ofenzyme activities in type I and type II muscle fibres of manafter training. Acta Physiol Scand 97, 392–397.
Hildebrandt AL, Pilegaard H & Neufer PD (2003). Differentialtranscriptional activation of select metabolic genes inresponse to variations in exercise intensity and duration.Am J Physiol Endocrinol Metab 285, E1021–E1027.
Holloszy JO & Coyle EF (1984). Adaptations of skeletal muscleto endurance training and their metabolic consequences.J Appl Physiol 70, 2032–2038.
Hood DA (2001). Contractile activity-induced mitochondrialbiogenesis in skeletal muscle. J Appl Physiol 90, 1137–1157.
Hunter GR, Weinsier RL, Bamman MM & Larson DE (1998). Arole for high intensity exercise on energy balance and weightcontrol. Int J Obes Relat Metab Disord 22, 489–493.
Knutti D & Kralli A (2001). PGC-1, a versatile coactivator.Trends Endocrinol Metab 12, 360–365.
Koulmann N & Bigard AX (2006). Interaction betweensignalling pathways involved in skeletal muscle responses toendurance exercise. Pflugers Arch 452, 125–139.
Kubukeli ZN, Noakes TD & Dennis SD (2002). Trainingtechniques to improve endurance exercise performances.Sports Med 32, 489–509.
Lee JS, Bruce CR, Spurrell BE & Hawley JA (2002). Effect oftraining on activation of extracellular signal-related kinase1/2 and p38 mitogen-activated protein kinase pathways inrat skeletal muscle. Clin Exp Pharmacol Physiol 29, 655–660.
Livak KJ & Schmittgen TD (2001). Analysis of relative geneexpression data using real-time quantitative PCR and the2−��CT method. Methods 25, 402–408.
Lowry OH, Rosebrough NJ, Farr AL & Randall RJ (1951).Protein measurement with the Folin phenol reagent. J BiolChem 193, 265–275.
Mahoney DJ, Carey K, Fu MH, Snow R, Cameron-Smith D,Parise G & Tarnopolsky MA (2004). Real-time RT-PCRanalysis of housekeeping genes in human skeletalmuscle following acute exercise. Physiol Genomics 18,226–231.
C© 2006 The Authors. Journal compilation C© 2006 The Physiological Society
at UNIVERSITY OF ARIZONA on July 13, 2008 jp.physoc.orgDownloaded from
J Physiol 575.3 Rapid adaptations to sprint or endurance training in humans 911
Mahoney DJ, Parise G, Melov S, Safdar A & Tarnopolsky MA(2005). Analysis of global mRNA expression in humanskeletal muscle during recovery from endurance exercise.FASEB J 19, 1498–1500.
Mahoney DJ & Tarnopolsky MA (2005). Understandingskeletal muscle adaptation to exercise training in humans:contributions from microarray studies. Phys Med RehabilClin N Am 16, 859–873.
Mannion AF, Jakeman PM & Willan PL (1993). Determinationof human skeletal muscle buffer value by homogenatetechnique: methods of measurement. J Appl Physiol 75,1412–1418.
Marlin DJ & Harris RC (1991). Titrimetric determination ofmuscle buffering capacity (Bm titr) in biopsy samples.Equine Vet J 23, 193–197.
Nader GA & Esser KA (2001). Intracellular signaling specificityin skeletal muscle in response to different modes of exercise.J Appl Physiol 90, 1936–1342.
Nevill ME, Boobis LH, Brooks S & Williams C (1989). Effect oftraining on muscle metabolism during treadmill sprinting.J Appl Physiol 67, 2376–2382.
Passoneau JV & Lowry OH (1993). Enzymatic Analysis: aPractical Guide. Humana Press, Totowa, NJ, USA.
Pilegaard H, Saltin B & Neufer PD (2003). Exercise inducestransient transcriptional activation of the PGC-1α gene inhuman skeletal muscle. J Physiol 546, 851–858.
Putman CT, Jones NL, Hultman E, Hollidge-Horvat MG,Bonen A, McConachie DR & Heigenhauser GJ (1998).Effects of short-term submaximal training in humans onmuscle metabolism in exercise. Am J Physiol EndocrinolMetab 275, E132–E139.
Raha S, Myint T, Johnstone L & Robinson BH (2002). Controlof oxygen free radical formation from mitochondrialcomplex I: Roles for protein kinase A and pyruvatedehydrogenase kinase. Free Rad Biol Med 32, 421–430.
Rognmo O, Hetland E, Helgerud J, Hoff J & Slordahl SA(2004). High intensity aerobic interval exercise is superior tomoderate intensity exercise for increasing aerobic capacity inpatients with coronary artery disease. Eur J Cardiovasc PrevRehabil 11, 216–222.
Russell AP, Hesselink MK, Lo SK & Schrauwen P (2005).Regulation of metabolic transcriptional co-activators andtranscription factors with acute exercise. FASEB J 19,986–988.
Saltin B & Gollnick PD (1983). Skeletal muscle adaptability.Significance for metabolism and performance. In Handbookof Physiology, Skeletal Muscle, ed.Peachey LD, pp. 555–631.American Physiological Society, Bethesda, MD, USA.
Saltin B, Nazar K, Costill DL, Stein E, Jansson E, Essen B &Gollnick D (1976). The nature of the training response;peripheral and central adaptations of one-legged exercise.Acta Physiol Scand 96, 289–305.
Schmitt B, Fluck M, Decombaz J, Kreis R, Boesch C, WittwerM, Graber F, Vogt M, Howald H & Hoppeler H (2003).Transcriptional adaptations of lipid metabolism in tibialisanterior muscle of endurance-trained athletes. PhysiolGenomics 15, 148–157.
Short KR, Vittone JL, Bigelow ML, Proctor DN, Rizza RA,Coenen-Schimke JM & Nair KS (2003). Impact of aerobicexercise training on age-related changes in insulin sensitivityand muscle oxidative capacity. Diabetes 52, 1888–1896.
Spina RJ, Chi MM, Hopkins MG, Nemeth PM, Lowry OH &Holloszy JO (1996). Mitochondrial enzymes increase inmuscle in response to 7–10 days of cycle exercise. J ApplPhysiol 80, 2250–2254.
Starritt EC, Angus D & Hargreaves M (1999). Effect ofshort-term training on mitochondrial ATP production ratein human skeletal muscle. J Appl Physiol 86, 450–454.
Terada S, Kawanaka K, Goto M, Shimokawa T & Tabata I(2005). Effects of high-intensity intermittent swimming onPGC-1α protein expression in rat skeletal muscle. ActaPhysiol Scand 184, 59–65.
Terada S, Yokozeki T, Kawanaka K, Ogawa K, Higuchi M, EzakiO & Tabata I (2001). Effects of high-intensity swimmingtraining on GLUT-4 and glucose transport activity in ratskeletal muscle. J Appl Physiol 90, 2019–2024.
Timmons JA, Larsson O, Jansson E, Fischer H, Gustafsson T,Greenhaff PL, Ridden J, Rachman J, Peyrard-Janvid M,Wahlestedt C & Sundberg CJ (2005). Human muscle geneexpression responses to endurance training provide a novelperspective on Duchenne muscular dystrophy. FASEB J 19,750–760.
Tunstall RJ, Mehan KA, Wadley GD, Collier GR, Bonen A,Hargreaves M & Cameron-Smith D (2002). Exercise trainingincreases lipid metabolism gene expression in human skeletalmuscle. Am J Physiol Endocrinol Metab 283, E66–E72.
Vogiatzis I, Terzis G, Nanas S, Stratakos G, Simoes DC,Georgiadou O, Zakynthinos S & Roussos C (2005). Skeletalmuscle adaptations to interval training in patients withadvanced COPD. Chest 128, 3838–3845.
Weston AR, Myburgh KH, Lindsay FH, Dennis SC, Noakes TD& Hawley JA (1997). Skeletal muscle buffering capacity andendurance performance after high-intensity interval trainingby well-trained cyclists. Eur J Appl Physiol Occup Physiol 75,7–13.
Youngren JF, Keen S, Kulp JL, Tanner CJ, Houmard JA &Goldfine ID (2001). Enhanced muscle insulin receptorautophosphorylation with short-term aerobic exercisetraining. Am J Physiol Endocrinol Metab 280, E528–E533.
Acknowledgements
We thank our subjects for their time and effort, and John
Moroz, Todd Prior and Heath D’Sa for technical assistance. This
project was supported by the Natural Sciences and Engineering
Research Council of Canada (NSERC). J.P.L. received an Under-
graduate Summer Research Award from the Faculty of Social
Sciences, McMaster University. M.V.E. held an Ontario Graduate
Scholarship and K.A.B. was supported by a NSERC Canada
Graduate Scholarship.
C© 2006 The Authors. Journal compilation C© 2006 The Physiological Society
at UNIVERSITY OF ARIZONA on July 13, 2008 jp.physoc.orgDownloaded from
DOI: 10.1113/jphysiol.2006.112094
2006;575;901-911; originally published online Jul 6, 2006; J. Physiol.
Burgomaster, Adeel Safdar, Sandeep Raha and Mark A. Tarnopolsky Martin J. Gibala, Jonathan P. Little, Martin van Essen, Geoffrey P. Wilkin, Kirsten A.
adaptations in human skeletal muscle and exercise performance traditional endurance training: similar initialversusShort-term sprint interval
This information is current as of July 13, 2008
& ServicesUpdated Information
http://jp.physoc.org/cgi/content/full/575/3/901including high-resolution figures, can be found at:
Subspecialty Collections
http://jp.physoc.org/cgi/collection/skeletal_muscle_and_exercise Skeletal Muscle and Exercise
following collection(s): This article, along with others on similar topics, appears in the
Permissions & Licensing
http://jp.physoc.org/misc/Permissions.shtmlor in its entirety can be found online at: Information about reproducing this article in parts (figures, tables)
Reprints http://jp.physoc.org/misc/reprints.shtml
Information about ordering reprints can be found online:
at UNIVERSITY OF ARIZONA on July 13, 2008 jp.physoc.orgDownloaded from