J P E L Annual Report and Financial Statements/media/Files/J/JPEL-Corp/investor/reports/2015/... ·...
67
| J | P | E | L | J.P.Morgan Private Equity Limited Annual Report and Financial Statements for the year ended 30 June 2015
Transcript of J P E L Annual Report and Financial Statements/media/Files/J/JPEL-Corp/investor/reports/2015/... ·...

| J |P|E| L |J.P.Morgan Private Equity Limited
Annual Report andFinancial Statementsfor the year ended 30 June 2015

Financial Summary (Company Information) 1
Historical Performance 2
Overview & Strategy 3
Investment Policy 4
Chairman’s Statement 5
Corporate Actions 9
Managers’ Report 11
Market Overview 11
Portfolio Review 13
Capital Calls and Distributions 16
Top 20 Funds & Companies Information 17
Top 10 Investments 18
Directors’ Report 20
Independent Auditors’ Report 28
Financial Statements: 29
Statement of Comprehensive Income 29
Statement of Financial Position 30
Statement of Changes in Equity 31
Statement of Cashflows 32
Notes to the Financial Statements 33
Information about the Company 64
Table of Contents

PERFORMANCE AS AT 30 JUNE 2015
Financial Summary (Company Information)
30 June 2015
US$ Equity Shares
NAV per Share $1.27
Share Price $1.00
Shares in Issuance (excluding shares held in treasury) 337.9m
2015 ZDP Shares
NAV per Share(1) 84.84p
Share Price 86.13p
Shares in Issuance (excluding shares held in treasury) 67.1m
2017 ZDP Shares
NAV per Share(1) 88.55p
Share Price 99.13p
Shares in Issuance (excluding shares held in treasury) 30.4m
Statement of Financial Position (extract)
Investments at Fair Value $533.1m
Bank Deposits $20.5m
Other Assets(2) $8.0m
Other Liabilities(3) ($1.5m)
Zero Dividend Preference Shares ($131.7m)
US$ Equity Net Asset Value(4) $428.6m
(1) Throughout the document, the term Net Asset Value per share or “NAV per Share” for each of JPEL’s two classes of zero dividend Preference Shares (2015 ZDP Shares and 2017 ZDPShares) refers to the carrying value of the ZDP Shares as at 30 June 2015. ZDP shareholders are entitled to a final gross redemption amount that is increased daily at such a dailycompound rate as would give a final entitlement as referenced in Note 15 to the financial statements on pages 56 and 57.
(2) Includes accrued interest income and derivative assets.(3) Includes fee accruals and other payables.(4) Information presented as non-consolidated. The Net Asset Value represents the capital of the Company which includes the Net Asset Value of the ZDP Shares as well as the Net Asset
Value of the US$ Equity Shares. Numbers may not sum due to rounding.(5) Source: Managers, Bloomberg as at 30 June 2015, JPEL NAV data as at 30 June 2015, released via the London Stock Exchange on 20 August 2015.
JPEL Performance Since Inception(5)
Past performance is not an indication of future performance.
In U
S$
JPEL Equity ShareJPEL NAV
$0.50
$0.75
$1.00
$1.25
$1.50
$1.75
$2.00
Jun 15Dec 14Jun 14Dec 13Jun 13Dec 12Jun 12Dec 11Jun 11Dec 10Jun 10Dec 09Jun 09Dec 08Jun 08Dec 07Jun 07Dec 06Jun 06Dec 05Jun 05
J.P. MORGAN PRIVATE EQUITY LIMITED ANNUAL REPORT AND FINANCIAL STATEMENTS 2015 1

2015 JPEL ZDP NAV and Share Price Development through 30 June 2015(1) (Since Inception)
Past performance is not an indication of future performance.
JPZZ2015 ZDP NAV
45.0p
50.0p
55.0p
60.0p
65.0p
70.0p
75.0p
80.0p
85.0p
90.0p
Jun 15Dec 14Jun 14Dec 13Jun 13Dec 12Jun 12Dec 11Jun 11Dec 10Jun 10Dec 09Jun 09Dec 08
In G
BP
2017 JPEL ZDP NAV and Share Price Development through 30 June 2015(1) (Since Inception)
Past performance is not an indication of future performance.
In G
BP
JPSZ2017 ZDP NAV
65.0p
70.0p
75.0p
80.0p
85.0p
90.0p
95.0p
100.0p
Jun 15Mar 15Dec 14Sep 14Jun 14Mar 14Dec 13Sep 13Jun 13Mar 13Dec 12Sep 12Jun 12Mar 12Dec 11Sep 11
(1) Source: Bloomberg, Managers. As at 30 June 2015.
Historical Performance
The charts above reflect the NAV and share price of J.P. Morgan Private Equity Limited 2015 Zero Dividend Preference Shares
(“JPZZ”) due 31 October 2015 and J.P. Morgan Private Equity Limited’s 2017 Zero Dividend Preference Shares (“JPSZ”) due
31 October 2017.
2 J.P. MORGAN PRIVATE EQUITY LIMITED ANNUAL REPORT AND FINANCIAL STATEMENTS 2015

J.P. MORGAN PRIVATE EQUITY LIMITED ANNUAL REPORT AND FINANCIAL STATEMENTS 2015 3
OVERVIEW
J.P. Morgan Private Equity Limited (“JPEL” or the “Company”)
is a Guernsey registered and incorporated closed ended
investment company that trades on the London Stock
Exchange (LSE: JPEL, JPZZ, JPSZ). The Company is designed
primarily to invest in the global private equity market. The fair
value of the Company’s total assets as at 30 June 2015 was
$561.7 million.
JPEL held its initial public offering on 30 June 2005 under the
name “Bear Stearns Private Equity Limited”. The Company
currently has three classes of shares: US$ Equity Shares,
2015 Zero Dividend Preference Shares (“2015 ZDP Shares”)
and 2017 Zero Dividend Preference Shares (“2017 ZDP
Shares”). At 30 June 2015 the capital of the Company
comprised of 16.0% 2015 ZDP Shares, 7.6% 2017 ZDP
Shares and 76.5% US$ Equity Shares.
JPEL is managed by Bear Stearns Asset Management Inc.
(“BSAM Inc.”), JPMorgan Asset Management (UK) Limited
(“JPMAM UK”) and JF International Management Inc. (“JFIMI”)
(together, the “Managers”), all of whom are wholly-owned
subsidiaries of JPMorgan Chase & Co. The Company’s
investment decisions are made by Non EU Alternative
Investment Fund Managers (BSAM Inc. and JFIMI). Following
the acquisition of The Bear Stearns Companies Inc. by
JPMorgan Chase & Co., the investment management team
within BSAM Inc. that has managed the Company since its
inception joined J.P. Morgan Asset Management (“JPMAM”).
The Company has entered into a management agreement
with the Managers to invest the assets of the Company on a
discretionary basis, subject to the overall supervision of the
Board of Directors (the “Directors”), a majority of whom are
independent Directors of the Company. The Directors have
overall responsibility for the Company’s investment policy and
the Company’s activities. Subsequent to the year end, the
Board has entered into discussions to transition the existing
investment management contract from JPMAM to an affiliate
of Fortress Investment Group LLC (“Fortress”) (the “Potential
Transaction”). As part of the Potential Transaction, the
investment management team that has been responsible for
managing JPEL since its inception in 2005 led by Troy
Duncan and Greg Getschow, would transition from JPMAM
to the credit business of Fortress. The Potential Transaction is
part of a broader spin-out involving the investment
management team led by Troy Duncan and Greg
Getschow.(1) Further information regarding the Potential
Transaction will be made available in due course if and as
discussions proceed.
JPMorgan Chase & Co. (NYSE: JPM) is a leading global
financial services firm with assets of $2.4 trillion and
operations in more than 60 countries. The firm is a leader in
investment banking, financial services for consumers, small
business and commercial banking, financial transaction
processing, asset management, and private equity.
Fortress is a highly diversified global investment firm with
$72.0 billion in assets under management as of 30 June
2015. Founded in 1998, Fortress manages assets on behalf
of approximately 1,700 institutional clients and private
investors worldwide across a range of private equity, credit
and real estate, liquid hedge funds and traditional asset
management strategies. Fortress is publicly traded on the
New York Stock Exchange (NYSE: FIG).
The key measure of performance used by the Board and
shareholders to assess the Company’s performance is the
NAV which is prepared on a monthly basis by Augentius
(Guernsey) Limited (the “Administrator”).
Overview & Strategy
INVESTMENT STRATEGY
The Company primarily pursues the following strategies to enhance shareholder value and to meet its investment objective:
• acquires secondary portfolios of direct investments and significantly invested partnership investments to accelerate
NAV development;
• opportunistically invests in buyout, venture capital, and special situations funds and investments throughout the world
based on attractive transaction values, advantageous market conditions, and compelling risk-adjusted return potential;
• obtains exposure to individual companies by co-investing alongside private equity sponsors in companies that offer
the potential for substantial equity appreciation;
• diversifies its portfolio by manager, industry, geography, investment stage, and vintage year; and
• actively manages the portfolio by repositioning its investment composition from time to time in order to capitalise on
changes in private equity market conditions.
In summary, the investment strategy of the Company is to achieve both short-term and long-term capital appreciation by
investing in a well-diversified portfolio of private equity interests and by capitalising on the inefficiencies of the global
secondary private equity market.
(1) None of JPEL, JPMAM or Fortress are under any obligation to consummate the Potential Transaction (or any other transaction) and there can be no
assurances as to if and when the Potential Transaction may be consummated. Among other things, the consummation of the Potential Transaction is subject
to due diligence and negotiations being completed to the satisfaction of JPEL, JPMAM and Fortress, the entering into of definitive documentation to effect
the Potential Transaction and all necessary legal, regulatory and board approvals being obtained or received by JPEL, JPMAM and Fortress.

4 J.P. MORGAN PRIVATE EQUITY LIMITED ANNUAL REPORT AND FINANCIAL STATEMENTS 2015
ASSET ALLOCATION
The majority of the Company Portfolio is allocated to buyout
funds, and the balance to venture capital, real estate and
multi-style funds.
• A buyout fund typically targets the acquisition of a
significant portion or majority control of businesses
which normally entails a change of ownership. Buyout
funds ordinarily invest in more mature companies with
established business plans to finance expansions,
consolidations, turnarounds and sales, or spinouts of
divisions or subsidiaries. A leveraged buyout, commonly
referred to as an LBO, is a buyout that uses debt
financing to fund a portion of the purchase price of the
targeted business.
• Venture capital refers to private equity capital typically
provided to early-stage, high-potential growth companies.
• Private Equity Real Estate is an asset class consisting of
equity and debt investments in property. Investments
typically involve an active management strategy ranging
from moderate reposition or releasing of properties to
development or extensive redevelopment.
• A multi-style investment strategy refers to fund managers
that make investments in companies in various stages of
development. A multi-style manager may make
investments in start-up enterprises, later-stage venture
companies and established businesses – all within the
same fund. These investments may involve control
positions or may be minority, passive positions.
By investing in a portfolio of private equity funds, the
Company is exposed to numerous underlying investments in
individual companies, ranging from start-up ventures to
large, multi-national enterprises. The Managers will
endeavour to purchase private equity fund interests and co-
investments in the secondary market to ensure that JPEL’s
portfolio contains investments that will be made and exited in
different economic cycles.
The Company may invest capital not otherwise allocated to
private equity into near cash and other investments. The
Company, in the Managers’ discretion, may invest in a wide
variety of investments and other financial instruments.
The Company will not enter into derivative transactions (such
as options, futures and contracts for difference) other than for
the purposes of efficient portfolio management.
The Company will not take any legal or management control
of any underlying company or fund in the Company Portfolio.
RISK DIVERSIFICATION
The Managers actively monitor the Company Portfolio and
attempt to mitigate risk primarily through diversification. Not
more than 20% of the Company’s Net Asset Value, at the
time of investment, is permitted to be invested in any single
investment. For the avoidance of doubt, if the Company
acquires a portfolio of companies in a single transaction, this
limitation shall be applied individually to each of the
underlying companies purchased and not to the portfolio as
a whole.
LEVERAGE
The Company has the ability to borrow up to 30% of its Total
Assets subject to and in accordance with the limitations and
conditions in its Articles. As part of its leverage policy, the
Company may borrow for short-term or temporary purposes
as is necessary for settlement of transactions, to facilitate the
operation of the over-commitment policy or to meet ongoing
expenses. The Directors and the Managers will not incur any
short-term borrowings to facilitate any tender or redemption
of Shares unless such borrowings have a repayment period
of 180 days or less. The Company is indirectly exposed to
borrowings to the extent that subsidiaries and underlying
funds in its portfolio are themselves leveraged.
Investment Policy

J.P. MORGAN PRIVATE EQUITY LIMITED ANNUAL REPORT AND FINANCIAL STATEMENTS 2015 5
2015 FISCAL YEAR HIGHLIGHTS
2015 was a strong year for the Company:
• US$ Equity Share Price increased by 29.8%.
• NAV per US$ Equity Share increased by 11.4%.
• Overall leverage reduced to 23.7% of total assets.
• Invested $85.2 million in market leading companies with
strong growth prospects.
The Company has continued to implement the strategic
initiatives that were announced to the market in January
2014. I believe that JPEL is ahead of plan and is in a
significantly better position than it was 18 months ago.
This Chairman’s statement will be more detailed than
usual as we will discuss the positive developments of
the 2015 fiscal year.
POTENTIAL TRANSACTION INVOLVINGTHE MANAGEMENT TEAM
I would like to inform shareholders that, subsequent to the
year end, the JPEL Board entered into discussions to
transition the existing investment management contract from
J.P. Morgan Asset Management (“JPMAM”) to an affiliate of
Fortress Investment Group LLC (“Fortress”) (the “Potential
Transaction”). As part of the Potential Transaction, the
investment management team that has been responsible for
managing JPEL since its inception in 2005 led by Troy
Duncan and Greg Getschow, would transition from JPMAM
to the credit business of Fortress. The Potential Transaction
is part of a broader spin-out involving the investment
management team led by Troy Duncan and Greg
Getschow.(1)
Further information regarding the Potential Transaction will be
made available in due course if and as discussions proceed.
NAV AND SHARE PRICE PERFORMANCE
In the twelve months ending 30 June 2015, JPEL’s NAV per
US$ Equity Share increased by $0.13 or 11.4% to $1.27.
JPEL’s US$ Equity Shares have responded to the initiatives
put forth and have increased by 29.8% from 30 June 2014,
and 37.6% since 30 June 2013.
As at 9 October 2015 the Company’s US$ Equity Shares
traded down by 2.74% from fiscal year-end to $0.975 which
represents a 23.2% discount to prevailing net asset value as
at 30 June 2015, versus the average discount of the selected
peer group of 21.7%.(2) The Board and the Managers
continue to believe that the current market price does not
reflect the underlying value of the Company’s portfolio, and
as such, the Company may seek to opportunistically
repurchase US$ Equity Shares in the open market.
During fiscal year 2015, the Company repurchased
8,475,000 US$ Equity Shares at an average price of
$0.795663 per Share.
JPEL’s two remaining classes of ZDP Shares have performed
well. The NAV of JPEL’s 2015 ZDP Shares rose 8.9% during
this period, from 77.94p per share to 84.84p per share. At
30 June 2015, JPEL’s 2015 ZDP Shares traded at a 1.51%
premium to NAV. The NAV of 2017 ZDP Shares rose 8.5%
during this period, from 81.63p per share to 88.55p per
share. At 30 June 2015, JPEL’s 2017 ZDP Shares traded at
a 11.94% premium to NAV.
SUCCESSFUL REPOSITIONING OFINVESTMENT PORTFOLIO
Since January 2014, JPEL deployed approximately
$120 million of capital in nine investments(3) which currently
represent approximately 30% of JPEL’s private equity value
at 30 June 2015.
In January 2014, JPEL’s stated goal was to create a more
concentrated portfolio with greater transparency, control and
growth prospects. I believe JPEL has succeeded in this
regard. According to Barwon Investment Partners, JPEL has
one of the most concentrated underlying investment
portfolios when compared to many of its fund of fund peers.(4)
The nine transactions completed share key attributes sought
by JPEL. Of the nine investments, eight were buyout related
investments acquired at attractive values with the average
purchase price of 6.1x LTM EBITDA with net debt coverage
of 2.9x LTM EBITDA.(5)
In deploying the $150 million, JPEL has focused on
concentrated secondary deals which are direct investments
in a single company or secondary transactions with one to
three companies. The reason for this is two-fold: (i) the
Chairman’s Statement
(1) None of JPEL, JPMAM or Fortress are under any obligation to consummate the Potential Transaction (or any other transaction) and there can be noassurances as to if and when the Potential Transaction may be consummated. Among other things, the consummation of the Potential Transaction is subjectto due diligence and negotiations being completed to the satisfaction of JPEL, JPMAM and Fortress, the entering into of definitive documentation to effectthe Potential Transaction and all necessary legal, regulatory and board approvals being obtained or received by JPEL, JPMAM and Fortress.
(2) Source: J.P. Morgan Cazenove Alternative Statistics, Bloomberg as at 9 October 2015 Peer Group members based on multi-manager listed private equityfunds and includes: SPCE, PEHN, APEF, HVPE, PEY, SEP, GPE, PIN, NBPE and FPEO.
(3) As at 30 June 2015. Includes initial investment amount only, excludes follow-on investment in Accela Investors LLC that was completed in June 2015.(4) Barwon Investment Partners, 2H 2015 Strategy Paper. July 2015.(5) As at 30 June 2015. Alliant Group is excluded from the $150 million investment program as the investment was completed before the program was
announced in January 2014. Prosper Marketplace is excluded from the EBITDA calculation.

6 J.P. MORGAN PRIVATE EQUITY LIMITED ANNUAL REPORT AND FINANCIAL STATEMENTS 2015
Chairman’s Statement continued
standard secondary market for diversified limited partnership
stakes is currently highly competitive with high pricing; and
(ii) JPEL is seeking to populate its top investments with
companies that have certain attributes. The attributes JPEL
seeks in companies include:
• Existing private equity backed company
• Potential for near-term liquidity (2-4 years)
• Discounted entry value
• Visible growth in profitability over the next 1 to 2 years
• Limited gearing
• Market leadership
RECENT INVESTMENTS
• In February 2014, JPEL invested $14.3 million in
Datamars SA, a leading supplier of animal identification
systems (including pet and livestock) and textile
identification systems.
• Also in February, JPEL invested $6.9 million in PlacidHoldings, a holding company with an investment in a
branded Asian handset distributor, with a leading market
position in smart phones and feature phones in India.
• In April 2014, JPEL participated in a syndicate of global
investors led by Arle Capital to acquire Innovia Filmsfrom the Candover 2001 Fund. JPEL invested
$14.0 million in Innovia, an international manufacturer of
high quality, specialty films for its key markets of labels,
overwrap, packaging and polymer banknote substrate.
• In October 2014, JPEL invested $16.0 million in
Celerion which provides support to the pharmaceutical
and biotechnology industries in the form of research
services outsourced on a contract basis.
• In November 2014, JPEL invested $18.4 million (out of a
$20 million commitment) in Mr. Bult’s Inc. a secondary
direct investment in the largest provider of municipal
solid waste transportation services in the niche
outsourced, long-haul market in the United States; and
• In November 2014, JPEL invested $24.2 million in
Swania, the spin out of three well-known French
consumer brands alongside Milestone, the manager that
successfully built and sold JPEL’s Baby Cadum
investment in 2013 in a similar industry. JPEL
contributed $19.2 million in equity financing to the
investment and $5.0 million in mezzanine debt financing.
• In December 2014, JPEL completed a $6.6 million
investment in the buyout of Pilosio S.p.A., a market
leading company that builds scaffolding and formwork
products for large international construction and
engineering groups. The company was purchased out of
administration and investors provided growth equity to
fund the order pipeline.
• In February 2015, JPEL completed a $7 million
investment in Accela, Inc., a leading US-based
Software-as-a-Service (“SaaS”) platform for state and
local government agencies worldwide. Accela provides
land management, asset management, financial and
civic engagement software to over 1,000 customers in
the U.S. and internationally.
• In April 2015, JPEL completed a $13 million investment
in Prosper Marketplace, Inc., a leading peer-to-peer
(“P2P”) marketplace lender.
Subsequent to the period, but prior to the publication of this
Annual Report in October 2015 and not included in the
$120 million total, JPEL completed a $15 million investment
in Corsicana Bedding Inc., a leading, low cost manufacturer
of generic and private label mattresses and foundations (box
springs) in the US.
Review of Significant Follow-on Investments
In June and July of 2015, JPEL completed two follow-on
investments in existing portfolio companies.
• Accela, Inc.: In June 2015, JPEL completed a
$10.2 million follow-on investment in Accela via a senior
preferred investment that accrues at a 13% PIK interest
rate (with a minimum 1.5x return), and includes warrants
in the company’s common equity. The proceeds of this
transaction are being used to fund add-on acquisitions.
• Deutsche Annington Immobilien SE (“DAIG”): JPEL
participated in a rights offering for DAIG. On 26 June
2015, JPEL purchased an additional 225,000 shares at a
price of €20.90 per share. The proceeds were used to
reduce indebtedness and to fund a €1.9 billion
acquisition of the Südewo Group, a strategic off-market
target with a meaningful footprint in Southern Germany.
In July, JPEL sold 325,000 shares of DAIG at an average
price of €27.65 per share. Subsequent to the period,
DAIG was renamed Vonovia SE (“VNA”). In September,
JPEL sold 115,426 shares of VNA at an average price of
€29.57 per share. The Company currently holds 534,574
shares. During the 2015 fiscal year, DAIG’s stock price
increased from €21.49 on 30 June 2014 to €25.465 on
30 June 2015, or 18.5%. Subsequent to the period,
DAIG’s stock price increased to €28.30, or 11.13% on 9
October 2015. JPEL has control over the DAIG shares
and values DAIG at the price on the last day of each
month. As a reminder, JPEL gained exposure to DAIG in
2006 through a €1.4 million investment in Terra Firma’s
DAIG co-investment fund (“TFDA”). In 2008, JPEL
purchased a larger investment in TFDA at a substantial
discount to the prevailing NAV at that time. Based on the
carrying value of DAIG at 30 June 2015, JPEL’s
investment has generated a return on investment of
approximately 2.77x JPEL’s cost.

J.P. MORGAN PRIVATE EQUITY LIMITED ANNUAL REPORT AND FINANCIAL STATEMENTS 2015 7
Existing Portfolio Companies that have PositivelyImpacted NAV Performance
Several of JPEL’s underlying companies have completed
initial public offerings during the last few years. Notable
investments include: DAIG (discussed above), Paratek,
Fibrogen and Egalet.
• Paratek: Paratek is an Omega Fund portfolio company
focused on the discovery, development, and
commercialisation of medicines designed to save lives
and alleviate suffering. The company’s lead product
candidate is a broad-spectrum antibiotic being
developed as a first-line monotherapy for serious
community-acquired bacterial infections where antibiotic
resistance is of concern. On 30 October 2014, Paratek
completed a merger with NASDAQ listed Transcept
Pharmaceuticals. In connection with the merger,
Transcept changed its name to Paratek
Pharmaceuticals, Inc. and commenced trading on the
NASDAQ on 31 October 2014 under the symbol
“PRTK”. Immediately prior to the merger, certain
Transcept stockholders and Paratek invested
~$93 million in the combined organization. Omega is a
leading investor in Paratek and participant in the
~$93 million investor syndicate. Although Paratek’s
stock price has experienced volatility in recent months,
during the Company’s fiscal year, Paratek’s stock price
increased over 77%, from $14.51 per share to $25.77
per share. JPEL valued Paratek based on a 10%
discount to the closing stock price at 30 June 2015.
• Fibrogen: Fibrogen is an Omega Fund portfolio company
focused on the discovery, development, and
commercialization of therapeutic agents for treatment of
fibrosis, anemia, cancer, and other medical needs. During
the month of June 2014, JPEL purchased two small
secondary interests totalling $1.2 million from former
employees at a discount to 2014 intrinsic value. On
14 November 2014, Fibrogen priced an initial public
offering on the NASDAQ (FGEN) at $18.00 per share.
Fibrogen’s stock price has increased 30.5% from its stock
price on 13 November 2014 to the 30 June 2015 closing
price of $23.50. JPEL valued Fibrogen based on a 10%
discount to the closing stock price at 30 June 2015.
• Egalet: Egalet is an Omega Fund portfolio company
focused on developing effective medicines for patients
with acute and chronic pain while helping to protect
physicians, families, and communities from the burden of
abuse. Egalet completed its IPO in February 2014.
During the 2015 fiscal year, Egalet’s stock price increased
by 10.0%. However, following a substantial decline in
price during the second half of 2014, Egalet’s stock price
has increased by 153.6% since 31 December 2014.
JPEL valued Egalet based on a 10% discount to the
closing stock price at 30 June 2015.
Strong Capital Position
JPEL’s capital position has improved as a result of efforts to
fortify the Company’s balance sheet. I would like to highlight
the following:
• JPEL’s overall leverage has been reduced by
$38.9 million or 22.8% since the Company announced
its strategic initiatives in January 2014. Leverage has
decreased from $170.6 million at 31 December 2013 to
$131.7 million at 30 June 2015. Total leverage is defined
as drawn capital under JPEL’s Lloyds facility as well as
2015 and 2017 ZDP liabilities.
• JPEL’s total leverage ratio decreased from 30.4% to
23.7% from 31 December 2012 to 30 June 2015. Total
leverage is defined as drawn capital under JPEL’s Lloyds
facility as well as 2015 and 2017 ZDP liabilities.
• During fiscal year 2015, the portfolio generated gross
distributions of $95.4 million. Capital calls received from
underlying investments were minimal during the fiscal
year, with JPEL receiving $12.22 of distributions for
every $1.00 of capital called.
• At 30 June 2015, JPEL had $25.9 million in cash and
cash equivalents and $27.6 million worth of public
shares in Deutsche Annington Immobilien Group
(“DAIG”). As discussed earlier in this Chairman’s
Statement, subsequent to the period, JPEL participated
in a rights offering and purchased an additional 225,000
shares of DAIG at a price of €20.90 per share. In July,
JPEL sold 325,000 shares of DAIG at an average price
of €27.65 per share. Subsequent to the period, DAIG
was renamed to Vonovia SE (“VNA”). In September,
JPEL sold 115,426 shares of VNA at an average price of
€29.57 per share. The Company currently holds
534,574 shares.
• On 31 October 2015, JPEL intends to redeem and
cancel its 2015 Zero Dividend Preference Share Class
(Ticker – LSE: JPZZ). The Final Capital Entitlement of the
2015 ZDP Shares is approximately £58.5 million and will
likely be financed by cash on hand and the utilisation of
the Company’s low-cost credit facility. As at 30 June
2015, the 2015 ZDP Shares represented approximately
68% of JPEL’s two remaining classes of zero dividend
preference shares. The repayment of the 2015 ZDP
Shares will reduce the overall leverage of JPEL and will
further simplify the Company’s capital structure.
Significant Distribution Activity
JPEL’s portfolio continued to produce positive net
distributions during the 2015 fiscal calendar year due in part
to the seasoned nature of the portfolio and an improved exit
environment in North America and Europe. Exclusive of new
investment purchases, JPEL received $95.4 million of gross
distributions or 19.7% of JPEL’s private equity portfolio value

8 J.P. MORGAN PRIVATE EQUITY LIMITED ANNUAL REPORT AND FINANCIAL STATEMENTS 2015
Chairman’s Statement continued
at 30 June 2014 and funded $7.8 million of capital calls
(excluding the follow-on investments discussed earlier in this
Chairman’s Statement).
JPEL’s pre-credit crisis portfolio generated strong
distributions during the 2015 fiscal year, representing 50.8%
of total distributions, or $48.5 million. JPEL’s pre-credit crisis
portfolio has decreased by over $122 million in the last
two years, from 54.9% of total private equity portfolio value
at 30 June 2013 to 38.9% of total private equity portfolio
value at 30 June 2015.
Pre-Credit Crisis Distribution Activity(1)
Pre-Credit Crisis Pre-Credit CrisisPre-Credit Crisis Distributions as Asset Value %Distributions as % of Prior Year of JPEL’s total
Fiscal Year % of Total Pre-Credit Crisis PE PortfolioEnded 30 June Distributions Portfolio Value Value
2013 61.0% 20.0% 54.9%
2014 63.6% 29.1% 47.6%
2015 50.8% 26.2% 38.9%
(1) Source: Managers. As at 30 June 2015. Pre-credit crisis is defined asthose investments made prior to 30 September 2008.
JPEL’s post-credit crisis portfolio has increased during the
last several quarters due to the Company’s reinvigorated
investment program and the strong performance of new
investments. JPEL’s post-credit crisis portfolio generated
49.2% of total distributions during fiscal year 2015, a ten
percentage point increase from 30 June 2013.
Post-Credit Crisis Distribution Activity(1)
Post-Credit Crisis Post-Credit CrisisPost-Credit Crisis Distributions as Asset Value %
Distributions as % of Prior Year of JPEL’s totalFiscal Year % of Total Post-Credit Crisis PE PortfolioEnded 30 June Distributions Porfolio Value Value
2013 39.0% 13.4% 45.1%
2014 36.4% 15.8% 52.4%
2015 49.2% 18.5% 61.1%
(1) Source: Managers. As at 30 June 2015. Post-credit crisis is defined asthose investments made subsequent to 30 September 2008.
MARKET OUTLOOK
JPEL’s Managers believe that the Company’s mature
portfolio will continue to generate positive net distribution
flows to fuel further reduction of debt through the repayment
of JPEL’s 2015 Zero Dividend Preference Shares in October
of 2015 as well as the continuation of the $150 million
investment program through December 2015.
JPEL’s Managers continue to be primarily focused on
investing in concentrated private equity secondaries and
secondary direct opportunities. There is an increasing
opportunity to invest in orphaned assets from tail-end funds.
Over 1,000 funds were raised prior to 2006 and have over
$180 billion in unrealised value and it is expected that there
is over $100 billion in unrealized value from funds raised
between 2006 and 2008.(2) As a result of this increase in
tail-end funds, the Managers believe that special situation
secondary transactions will continue to increase. This is an
area of the secondary market that the Managers have been
focused on for the last several years and have deployed
$120 million of the stated $150 million in transactions of this
nature. The Managers believe that the opportunity for special
situations secondary investments will continue to be robust
and due to the limited competition in this segment of the
market, the Managers believe that JPEL should continue to
enjoy a strong pipeline of special situation secondary
investment opportunities.
As discussed in January 2014, the Managers intend to create
a more concentrated portfolio by deploying up to $150 million
in 15-20 private companies through December 2015.
Through 30 June 2015, the Managers have completed nine
investments representing approximately $120 million. JPEL’s
Managers expect that JPEL’s top 30 companies will represent
a significant portion of private equity value by the end of the
stated investment period.
The Board is cognisant of its fiduciary responsibilities to
shareholders which includes, amongst other things, the
implementation of a Realisation Share Class (“RSC”) which
was created following the approval by shareholders at the
Company’s Annual General Meeting in May 2014 and are
due to be implemented no later than 31 March 2016. The
Board therefore intends to consult with shareholders
regarding the implementation of the RSC in due course.
JPEL’s Board and Managers remain committed to increasing
shareholder value and improving the Company’s NAV per
US$ Equity Share. I would like to thank shareholders for the
support that they have placed in the Company.
Trevor Ash
Chairman
26 October 2015
(2) Source: Private Equity’s Long Tail, Credit Suisse as at February 2015.

J.P. MORGAN PRIVATE EQUITY LIMITED ANNUAL REPORT AND FINANCIAL STATEMENTS 2015 9
2014 CORPORATE ACTIONS
• On 22 August 2014, JPEL announced that on 30 June
2014, Qualifying Bonus Issue Shareholders exercised
44,416 Warrants, representing Subscription Rights to
subscribe for 44,416 US$ Equity Shares Pursuant to the
Bonus Issue described in the prospectus published by
the Company on 18 June 2009.
o Application was made for the newly allotted
US$ Equity Shares to be admitted to the Official List
of the UKLA Listing Authority and to trading on the
Main Market of the London Stock Exchange with
the admission on 26 August 2014.
o Following this allotment, the Company’s issued
share capital will consist of 346,420,574 Shares of
no par value (excluding treasury shares) each
classified as US$ Equity Shares, 67,077,371 shares
of no par value (excluding treasury shares) each
classified as 2015 Zero Dividend Preference shares,
and 30,410,753 shares of no par value (excluding
treasury shares) each classified as 2017 Zero
Dividend Preference shares.
• On 19 September 2014, JPEL purchased 6,000,000
US$ Equity shares in to treasury at a price of $0.79474
per US$ Equity Share.
• On 23 October 2014, JPEL purchased 1,600,000
US$ Equity Shares at a price of $0.79675 per
US$ Equity Share for cancellation.
• On 18 November 2014, JPEL purchased 875,000
US$ Equity Shares at a price of $0.80 per US$ Equity
Share for cancellation.
2015 CORPORATE ACTIONS
• On 20 February 2015, JPEL announced the
appointment of Mr. Anthony Dalwood as an Independent
Non-Executive Director of the Company with immediate
effect.
• On 24 February 2015, JPEL was informed that on
23 February 2015, Mr. Anthony Dalwood acquired
127,747 US$ Equity Shares at 58.7p (approximately
$0.90) per US$ Equity Share.
• On 1 July 2015, JPEL announced a clarifying statement
relating to UK Financial Conduct Authority (“FCA”) rules
on the restrictions on the retail distribution of unregulated
collective investment schemes and close substitutes
(referred to as “non-mainstream pooled investments” or
“NMPI”), which came into effect on 1 January 2014, and
their applicability in relation to the Company. As a result
of legal advice, JPEL confirmed that JPEL’s US$ Equity
Shares, 2015 ZDP Shares and 2017 ZDP Shares (“JPEL
Shares”) will qualify as “excluded securities” and are
therefore excluded from the FCA’s restrictions that apply
to NMPI products.
• On 13 July 2015, JPEL published a circular to
Shareholders.
o The circular contains a notice of AGM to be held at
2.00 p.m. (London time) on 29 July 2015 at
Carinthia House, 9-12 The Grange, St. Peter Port,
Guernsey GY1 4BF.
o The following summarises all of the resolutions the
Company is seeking approval for at the Annual
General Meeting. All special and ordinary resolutions
were proposed to all Shareholders as a whole.
Special Resolutions
1. To renew the Company’s authority to make
purchases of up to 15% of each class of its own
issued shares pursuant to any proposed Tender
Offer.
2. To renew the Company’s general authority to
make market purchases of up to 14.99% of
each class of its own issued Shares.
3. To renew the disapplication of the pre-emption
rights for up to 10% of each class of its own
issued Shares as set out in the Articles of
Incorporation.
Ordinary Resolutions
4. To approve and adopt the Annual Report and
Financial Statements of the Company for the
year ended 30 June 2014.
5. To re-elect Gregory S. Getschow as a
non-executive Director of the Company, who
retires by rotation.
6. To re-elect Christopher P. Spencer as a
non-executive Director of the Company, who
retires by rotation.
7. To elect Anthony (Tony) Dalwood as a
non-executive Director of the Company, who
was appointed on 20 February 2015 and retires
by rotation.
8. To re-elect PricewaterhouseCoopers CI LLC as
Auditors to the Company.
9. To re-authorise the Directors to determine the
Auditors’ remuneration.
10. To re-authorise the Directors to determine their
remuneration in accordance with the Articles of
Incorporation.
11. To approve an increase to the cap on the
aggregate base remuneration payable to the
Directors as a whole to £250,000 per annum.
Corporate Actions

10 J.P. MORGAN PRIVATE EQUITY LIMITED ANNUAL REPORT AND FINANCIAL STATEMENTS 2015
Corporate Actions continued
• On 30 July 2015, JPEL announced that at the Annual
General Meeting (“AGM”) of the Company held on
29 July 2015, all special and ordinary resolutions put to
shareholders were duly passed.
• On 19 October 2015, JPEL announced the timing of the
retirement of its 2015 Zero Dividend Preference Shares
(“2015 ZDP Shares”) which are set to reach their Final
Capital Entitlement on 31 October 2015.

J.P. MORGAN PRIVATE EQUITY LIMITED ANNUAL REPORT AND FINANCIAL STATEMENTS 2015 11
MARKET OVERVIEW
As an opportunistic investor, JPEL seeks to capitalize on dislocations in the private equity markets. With the increasing price
of traditional private equity secondaries, JPEL has focused its attention on the underserved “tail-end fund” and fund
restructuring segments of the market. This sector offers the Company extensive deal flow, deep value investment
opportunities and less competition.
Tail-end funds (also called “zombie funds”) are generally considered private equity funds raised prior to 2006 that have
remaining assets yet to be exited. The typical private equity vehicle permits a 10 year life and allows for some extensions which
implies that funds created before 2006 are coming up on the end of their life. As of January 2015, Preqin estimates that there
are approximately 1,100 private equity and venture funds that were raised prior to 2006, with a total of $184 billion in unsold
assets.(1) Furthermore, this number is expected to increase over the next couple of years as a result of the large sums of money
raised for private equity from 2005-2008.
Solutions to tail-end fund scenarios are complicated by potentially diverging interests of the parties involved. In many
instances, funds raised during the “private equity boom” lack sufficient capital to support remaining companies. In addition,
limited partners invested in these funds are putting increased pressure on the sponsors to exit companies. But in a significant
number of cases the sponsors have not raised subsequent funds and have become defunct or have little incentive to sell-off
their remaining portfolios.
The resulting dislocation in the private equity markets provides JPEL a buying opportunity. With a flexible investment mandate,
the Company is well suited to pursue these specialised buying opportunities that do not fall within the mandate of traditional
“primary” or “secondary” private equity investing. With little competition and flexible capital, JPEL has been able to purchase
high quality companies from tail-end funds at discounts to market value.
The Managers believe that the key to successfully purchasing assets of this nature is to partner with incumbent fund managers
to extract value, while providing older investors with a liquidity option. The secondary direct model of replacing sponsors
eliminates the ability to incentivise sponsor-led spin-outs and other transactions.
JPEL has completed 10 new investments in the last 18 months (including the December 2013 investment in Alliant Group).
Eight of the 10 companies JPEL acquired were purchased directly from existing private equity funds, many in tail-end
situations. Typically, JPEL seeks single company exposures or top-heavy portfolios with 1-3 key company exposures. JPEL
also seeks to acquire companies that have visible growth prospects or market leadership.
Total Unrealised Value by Vintage Year: Over 180 Billion(1)
Managers’ Report
(1) Source: Private Equity’s Long Tail, Credit Suisse as at February 2015.
$15.2 $13.9
$7.0 $8.2 $7.9
$3.3
$16.6
$3.0
$19.8
$7.7
$65.1
$16.4
VentureBuyout
$0.0
$10.0
$20.0
$30.0
$40.0
$50.0
$60.0
$70.0
20052004200320022001Pre-2001

12 J.P. MORGAN PRIVATE EQUITY LIMITED ANNUAL REPORT AND FINANCIAL STATEMENTS 2015
Managers’ Report continued
Recent JPEL Investments
Purchased Preferred DiscountedCompany Description from Existing Funding Market Entry
Fund Structure Leadership Value
US based tax advisory services firm. 3 3 3 3
Swiss based supplier of ID systems. 3 3 3Asian based distributor of mobile Placid Holdingshandsets. 3 3 3 3
Speciality packaging company. 3 3 3
Clinical research organisation. 3 3 3Provider of municipal solid waste transportation services. 3 3 3Three leading household brands in France 3 3 3
Scaffolding and formwork products. 3 3Provider of vertical software to the state and local government market. 3 3 3 3
Peer-to-peer (“P2P”) market lender. 3 3

J.P. MORGAN PRIVATE EQUITY LIMITED ANNUAL REPORT AND FINANCIAL STATEMENTS 2015 13
PORTFOLIO REVIEW
Since the Company’s inception on 30 June 2005, JPEL’s portfolio has grown to include 86 separate fund interests,
20 co-investments and five funds of funds. With an investment portfolio value of $533.1 million, JPEL’s portfolio is diversified
globally across multiple investment strategies and industries as at 30 June 2015.
Investment Type(1)
Direct investments now comprise 46% of the portfolio up
from 29% of the portfolio in 2014 as a result of JPEL’s
recently reinvigorated investment strategy.
Consistent with JPEL’s investment strategy, the portfolio is
composed of “highly funded assets” which, in addition to
direct investments, includes assets acquired in the
secondary market and funded primary investments. In total,
secondary and funded primary investments represent 45%
of the portfolio.
Funded primary investments are portfolios that are partially
invested at the time of investment and tend to produce
distributions and NAV growth more quickly since they are
further along the private equity “J- Curve”.
From time to time, JPEL may make a primary commitment
to a fund, typically as part of a secondary transaction. As at
30 June 2015, primary investments made up 9% of JPEL’s
portfolio.
Investment Strategy(1) Buyout Fund Sizes(2)
Currently, buyout funds constitute approximately 59% of JPEL’s portfolio. Within this strategy, the majority of the Company’s
investments are with fund managers that focus on small to medium sized buyouts, which generally utilise less leverage.
Secondary41%
Primary 9% FundedPrimary 4%
DirectInvestments
46%
Infrastructure1%
Real Estate9%
VentureCapital17%
Buyout59%
SpecialSituations
14%
Mega0.3%
Large0.5% Medium
5%
Small52%
(1) Based on 30 June 2015 market value of investments, percentages based on underlying fund-level values.(2) Fund classifications for buyout strategy are based on total fund commitments: Small: $0 - $500 million; Medium: $500 - $2,000 million; Large: $2,000 million –
$5,000 million; Mega: over $5,000 million. Co-investments allocated by size of underlying sponsor fund.

14 J.P. MORGAN PRIVATE EQUITY LIMITED ANNUAL REPORT AND FINANCIAL STATEMENTS 2015
Managers’ Report continued
JPEL maintains a 14% allocation to special situation funds which includes mezzanine, debt, turnaround and distressed funds.
JPEL’s exposure to real estate (which is 9% of the portfolio) is primarily a result of the Company’s investment in Deustche
Annington Immobilien Group (“DAIG”) (XTR:ANN), a publicly traded German residential real estate company. Subsequent to
the period, DAIG was renamed to Vonovia SE (“VNA”). Infrastructure and venture capital funds represent 1% and 17% of
private equity net asset value, respectively.
Portfolio Age(1)
When making investment decisions, JPEL seeks more
mature assets that have the potential for near-term exits.
With an average age of 8.1 years, JPEL’s portfolio is well
positioned on the private equity “J-Curve” to receive
distributions. As venture assets often take longer to develop,
JPEL’s venture capital investments have a more mature
weighted average life of 8.8 years.
Geographic Footprint(2)
JPEL’s private equity portfolio is diversified with investments
in over 35 countries, helping to mitigate country and regional
risk as well as to capitalise on the growth of expanding
economies. North America and Europe represent the
majority of the Company’s portfolio at 43% and 40%,
respectively. JPEL’s allocation to Asia stands at 14% while
investments in the rest of the world represent 3% of the
portfolio.
Average Age of Portfolio by Investment Strategy
Average age of investments 8.1 years
• Buyout investments: 3.4 years
– Small buyout: 3.1 years
– Medium buyout: 5.6 years
– Large buyout: 6.6 years
– Mega buyouts: 11.3 years
• Venture Capital investments: 9.6 years
• Real Estate investments: 6.8 years
• Special Situations: 6.3 years
• Infrastructure investments: 8.8 years
Other3%
Asia14%
NorthAmerica
43%
Europe40%
(1) Based on 30 June 2015 market value of investments, percentages based on underlying company-level values. Average age of investments is based on thedate in which each individual portfolio company investment was made, subject to availability. Weighting is based on underlying portfolio company level values.Age calculated at 30 June 2015. Average is weighted based on investments at market value as at 30 June 2015 percentages based on underlyingcompany-level values.
(2) Based on 30 June 2015 market value of investments, percentages based on underlying company-level values.

J.P. MORGAN PRIVATE EQUITY LIMITED ANNUAL REPORT AND FINANCIAL STATEMENTS 2015 15
In addition to geographic diversification, the Managers diversify JPEL’s portfolio by industry composition. The portfolio is
currently weighted towards healthcare-oriented companies at 13.8% of the portfolio and technology hardware and equipment
with approximately 9.8% of investment value in this sector. JPEL’s exposure to real estate will continue to diminish as the
Company sells down its ownership in Deutsche Annington Immobilien Group.
The Company engages in a single segment of business, as detailed in note 1 to the financial statements, and the
diversification analysis is provided as supplementary information.
Industry Composition(1)
Currency Composition(2)
The Managers continue to monitor JPEL’s exposure to
foreign currencies and take currency exposure into
consideration when making investment decisions. The
currency composition of JPEL’s portfolio may change as the
Company continues to pursue an investment policy focused
on geographic diversification.
As at 30 June 2015, investments held in US Dollars made up
approximately 57% of JPEL’s private equity market value.
Investments held in Euros comprised 32% of the private
equity portfolio, while the Australian Dollar, Sterling, Swiss
Franc and UAE Dirham represented 3%, 3%, 4% and 1% of
the portfolio, respectively.
0.0% 2.0% 4.0% 6.0% 8.0% 10.0% 12.0% 14.0%
Semiconductors & Equipment
Household & Personal Products
Automobiles & Components
Banks
Transportation
Energy
Telecommunication Services
Food, Beverage & Tobacco
Food & Staples Retailing
Retailing
Utilities
Media
Insurance
Consumer Services
Education Services
Materials
LP Interest
Commercial & Professional Services
Health Care Equipment & Services
Software & Services
Capital Goods
Consumer Durables & Apparel
Diversified Financials
Real Estate
Technology Hardware & Equipment
Pharma, Biotech & Life Sciences
0.2%
0.2%
0.3%
0.3%
0.4%
0.7%
0.8%
0.8%
0.8%
1.5%
1.7%
2.2%
2.4%
3.1%
3.8%
4.0%
4.8%
5.0%
5.4%
6.1%
7.0%
7.3%
8.5%
8.8%
9.8%
13.8%
% of Investment Portfolio
GBP3%
CHF4%
AED1% AUD
3%
USD57%
EUR32%
(1) Based on 30 June 2015 market value of investments, percentages based on underlying company-level values.(2) Based on 30 June 2015 market value of investments, percentages based on underlying fund-level values. Please refer to pages 45 and 46 of the financial
statements for net currency exposure on the Company Level.

16 J.P. MORGAN PRIVATE EQUITY LIMITED ANNUAL REPORT AND FINANCIAL STATEMENTS 2015
Managers’ Report continued
CAPITAL CALLS AND DISTRIBUTIONS
JPEL invests with a goal of delivering consistent NAV growth and generating a high level of distributions.
Capital Call and Distribution Summary(1) (past four years)
JPEL’s portfolio continues to generate significant net distributions. In FY 2015, JPEL received net distributions of $87.6 million
down from FY 2014 where JPEL received $110.0 million in net distributions.
Cash Flow Breakout(1)
In FY 2015, approximately 40% of JPEL’s distributions resulted from the Company’s investment in Deutsche Annington
Immobilien Group (“DAIG”) which accounts for the large distribution flow from Real Estate investments and European
investments. Outside of DAIG, JPEL continues to receive strong cash flow from the Buyout portfolio and the US.
Mill
ions
of U
S$
FY 2012 Net Distributions$59.6 million
FY 2013 Net Distributions$64.9 million
FY 2014 Net Distributions$110.0 million
FY 2015 Net Distributions$87.6 million
DistributionsCapital Calls
$0.0
$5.0
$10.0
$15.0
$20.0
$25.0
$30.0
$35.0
$40.0
$45.0
$50.0
2Q 20151Q 20154Q 20143Q 20142Q 20141Q 20144Q 20133Q 2013Q2 2013Q1 2013Q4 2012Q3 20122Q 20121Q 20124Q 20113Q 2011
$5.8
$13.
2
$2.6
$19.
6
$6.7
$12.
2
$4.5
$34.
2
$7.4
$13.
5
$14.
1
$25.
8
$3.5
$10.
3
$2.3
$42.
6
$1.6
$22.
1
$1.7
$19.
4
$1.3
$31.
9
$3.4
$44.
6
$3.3
$28.
5
$1.7
$21.
9
$2.4
$26.
3
$0.4
$18.
7
Cash Flows by Investment Strategy Cash Flows by Geographic Region(12 months ending 30 June 2015) (12 months ending 30 June 2015)
(1) JPEL’s cash flows have been updated to reflect distributions from BoS Mezzanine Partners.
Mill
ions
of U
S$
Mill
ions
of U
S$
DistributionsCapital Calls DistributionsCapital Calls
$0.0
$10.0
$20.0
$30.0
$40.0
$50.0
Infra
struc
ture
Vent
ure
Capita
lRea
l
Estate
Special
Situat
ions
Buyou
t
$5.3
$30.0
$0.2
$15.3
$0.0
$38.9
$2.2$4.5
$0.2
$6.7
$0.0
$10.0
$20.0
$30.0
$40.0
$50.0
Other
Asia
Europ
eNor
th
Amer
ica
$5.0
$33.4
$2.6$0.1
$15.4
$0.1
$44.6
$2.0

J.P. MORGAN PRIVATE EQUITY LIMITED ANNUAL REPORT AND FINANCIAL STATEMENTS 2015 17
(1) Top 20 Funds and Top 20 Companies include underlying funds and companies indirectly owned through the purchase of secondary interest in Private EquityAccess Fund II Ltd, Bear Stearns Global Turnaround Fund, L.P., BoS Mezzanine Partners Fund, L.P. (BoS company-level exposure includes estimated prorated fund-level leverage), and Macquarie Private Capital Trust.
(2) Percentages are calculated based on 30 June 2015 market value of investments.
TOP 20 FUNDS & COMPANIES INFORMATION
Top 20 Funds(1),(2)
% of Private EquityFund Region Fund Strategy Investments
1 Life Sciences Holdings SPV I Fund, L.P. Europe Venture Capital 6.8%
2 Alcentra Euro Mezzanine No1 Fund L.P. Europe Special Situations 3.0%
3 Leeds Equity Partners V, L.P. North America Buyout 2.2%
4 Omega Fund III, L.P. Europe Venture Capital 2.2%
5 Beacon India Private Equity Fund Asia Buyout 2.0%
6 Black Diamond Capital Management North America Special Situations 1.3%
7 GSC European Mezzanine Fund II L.P. Europe Special Situations 1.3%
8 Almack Mezzanine I Fund L.P. Europe Special Situations 1.3%
9 Industry Ventures Fund V, L.P North America Venture Capital 1.2%
10 Liberty Partners II, L.P. North America Buyout 1.2%
11 10th Lane Finance Co., LLC North America Special Situations 1.1%
12 Global Buyout Fund, L.P. Other Buyout 1.1%
13 MezzVest II L.P. Europe Special Situations 1.0%
14 Alia Capital Fund I C.V. Europe Buyout 1.0%
15 Aqua Resources Fund Limited Europe Buyout 1.0%
16 Hutton Collins Capital Partners II LP Europe Special Situations 0.9%
17 Highstar Capital III Prism Fund, L.P. North America Infrastructure 0.9%
18 Global Opportunistic Fund Other Buyout 0.7%
19 PCG Special Situations Partnership North America Special Situations 0.7%
20 Macquarie Alternative Investment Trust III Asia Buyout 0.7%
Top 20 Companies(1),(2)
% of Private EquityCompany Country Industry Group Investments
1 Placid Holdings India Technology Hardware & Equipment 5.5%
2 Deutsche Annington Immobilien SE Germany Real Estate 5.2%
3 Swania France Consumer Durables & Apparel 4.1%
4 Celerion United States Pharma, Biotech & Life Sciences 4.1%
5 FibroGen Inc. United States Pharma, Biotech & Life Sciences 3.9%
6 Paratek Pharmaceuticals Inc. United States Pharma, Biotech & Life Sciences 3.8%
7 Datamars S.A. Switzerland Technology Hardware & Equipment 3.7%
8 RCR Industrial S.a.r.l Spain Capital Goods 3.7%
9 Mr. Bult’s, Inc. United States Commercial & Professional Services 3.5%
10 Accela, Inc. United States Software & Services 3.3%
11 Alliant Group United States Diversified Financials 3.3%
12 Prosper Marketplace, Inc. United States Diversified Financials 2.4%
13 Compre Group United Kingdom Insurance 2.3%
14 Innovia Films United Kingdom Materials 2.1%
15 Yangzhou Ya Tai Property Limited China Real Estate 2.1%
16 Gulf Healthcare International LLC United Arab Emirates Health Care Equipment & Services 1.7%
17 Diaverum Sweden Health Care Equipment & Services 1.5%
18 Luxury Optical Holdings United States Consumer Durables & Apparel 1.2%
19 Concorde Career Colleges, Inc. United States Education Services 1.1%
20 Pilosio S.p.A. Italy Capital Goods 1.1%

18 J.P. MORGAN PRIVATE EQUITY LIMITED ANNUAL REPORT AND FINANCIAL STATEMENTS 2015
Managers’ Report continued
(1) Top 10 Investments include fund investments and direct investments by size at 30 June 2015. Also includes interests indirectly owned through the purchaseof secondary interests.
TOP 10 INVESTMENTS(1)
JPEL’s ten largest investments are diversified across a broad range of managers and investment strategies. In total, these ten
investments account for $235.9 million, or 44.3% of total private equity investment value, at 30 June 2015.
1. Life Sciences Holdings SPV I Fund, L.P.
Sponsor Omega FundsGeographic Focus EuropeInvestment Type SecondaryInvestment Strategy Venture CapitalDate of Investment June 200930 June 2015 Value $36.4 million% of PE Investment Value 6.8%
2. Placid holdings
Sponsor Madison India CapitalGeographic Focus AsiaInvestment Type Direct InvestmentInvestment Strategy BuyoutDate of Investment February 201430 June 2015 Value $29.2 million% of PE Investment Value 5.5%
3. Deutsche Annington Immobilien SE
Sponsor Formerly Terra FirmaGeographic Focus EuropeInvestment Type SecondaryInvestment Strategy Real EstateDate of Investment December 200830 June 2015 Value $27.6 million% of PE Investment Value 5.2%
4. Swania
Sponsor Milestone InvestisseursGeographic Focus EuropeInvestment Type Direct InvestmentInvestment Strategy BuyoutDate of Investment December 201430 June 2015 Value $21.9 million% of PE Investment Value 4.1%
5. Celerion
Sponsor MTS Health InvestorsGeographic Focus North AmericaInvestment Type Direct InvestmentInvestment Strategy BuyoutDate of Investment October 201430 June 2015 Value $21.7 million% of PE Investment Value 4.1%
Placid holdings is a holding company with an investment in abranded Asian handset distributor, with a leading market positionin smart phones and feature phones in India.
Swania is the spin-out of three leading household brands in France:
• Maison Verte: laundry and hand dishwashing brand witheco-friendly credentials.
• O’Cedar: wood care brand with 60-year history.
• Baranne: oldest shoe care brand with a 100-year history.
Life Sciences Holding SPV I Funds, L.P. is a holding vehicle for aninvestment in a secondary portfolio of European life sciencecompanies.
Deutsche Annington Immobilien SE (“DAIG”) is a Germanresidential real estate company with approximately 350,000 leasedand managed properties. DAIG is the largest German residentialhousing company. Subsequent to the period, DAIG was renamedto Vonovia SE (“VNA”).
Celerion is a US-based leading clinical research organization whichprovides support to the pharmaceutical and biotechnologyindustries in the form of research services outsourced on acontract basis.

J.P. MORGAN PRIVATE EQUITY LIMITED ANNUAL REPORT AND FINANCIAL STATEMENTS 2015 19
(1) Top 10 Investments include fund investments and direct investments by size at 30 June 2015. Also includes interests indirectly owned through the purchaseof secondary interests.
TOP 10 INVESTMENTS(1) continued
6. FibroGen Inc.
Sponsor Omega FundsGeographic Focus North AmericaInvestment Type SecondaryInvestment Strategy Venture CapitalDate of Investment June 200930 June 2015 Value $20.7 million% of PE Investment Value 3.9%
7. Paratek Pharmaceuticals, Inc.
Sponsor Omega FundsGeographic Focus North AmericaInvestment Type SecondaryInvestment Strategy Venture CapitalDate of Investment June 200930 June 2015 Value $20.4 million% of PE Investment Value 3.8%
8. Datamars SA
Sponsor Columna PartnersGeographic Focus EuropeInvestment Type SecondaryInvestment Strategy Co-InvestmentDate of Investment February 201430 June 2015 Value $19.8 million% of PE Investment Value 3.7%
9. RCR Industrial S.a.r.l.
Sponsor Columna CapitalGeographic Focus EuropeInvestment Type Co-InvestmentInvestment Strategy BuyoutDate of Investment January 201130 June 2015 Value $19.7 million% of PE Investment Value 3.7%
10. Mr. Bult’s, Inc.
Sponsor American Working CapitalGeographic Focus North AmericaInvestment Type Direct InvestmentInvestment Strategy BuyoutDate of Investment November 201430 June 2015 Value $18.4 million% of PE Investment Value 3.5%
Bear Stearns Asset Management Inc.JPMorgan Asset Management (UK) LimitedJF International Management Inc.
26 October 2015
RCR Industrial S.a.r.l. is a global market leader for industrialflooring solutions. The Company is headquartered in Spain andoperates in Europe, Latin America and Africa.
Mr. Bult’s, Inc. is the largest provider of municipal solid wastetransportation services in the niche outsourced, long-haul marketin the United States.
Datamars SA is a leading supplier of animal identification systems(including pet and livestock) and textile identification systems.Datamars is based in Switzerland and operates globally.
Paratek Pharmaceuticals, Inc. is focused on the discovery,development, and commercialisation of medicines designed tosave lives and alleviate suffering. The company’s lead productcandidate is a broad-spectrum antibiotic being developed as afirst-line monotherapy for serious community-acquired bacterialinfections where antibiotic resistance is of concern.
FibroGen Inc. is a research-based pharmaceutical companyfocused on the discovery, development and commercialisation ofnovel therapeutic agents to treat serious unmet medical needs.The Company has a global approach to the development andcommercialization of its products.
20 J.P. MORGAN PRIVATE EQUITY LIMITED ANNUAL REPORT AND FINANCIAL STATEMENTS 2015
INTRODUCTION
The Directors present their annual report together with the
audited financial statements of J.P. Morgan Private Equity
Limited (the “Company”) for the year ended 30 June 2015
(the “Financial Year”). The financial summary is set out on
page 1. A detailed review of activities is contained in the
Managers’ Report on pages 11 to 19.
DIVIDENDS
The Directors do not propose the payment of a dividend for
the year ended 30 June 2015.
PRINCIPAL ACTIVITY
The Company is a closed ended investment fund
incorporated as a limited liability company in Guernsey under
The Companies (Guernsey) Law, 2008, authorised under The
Authorised Closed-Ended Investment Schemes Rules, 2008
and is regulated by the Guernsey Financial Services
Commission.
The Company’s primary activity is that of an investment
company investing in private equity funds, unquoted and
public companies and subsidiaries.
GOING CONCERN
The Directors have examined significant areas of possible
credit and liquidity risk and have satisfied themselves that no
material exposures exist. The Directors have taken into
consideration the Company’s expected cash flows over the
coming twelve months following the year end in respect of
commitments to invest, on-going fees, and the redemption
of the 2015 zero dividend preference shares. Given the
Company’s current cash position, and the vast sum undrawn
from the Lloyds facility which has been extended until
January 2018 (see note 14 of the audited financial
statements for further details on the loan facility), combined
with the expected distributions over the same twelve month
period, the Directors believe the Company has adequate
resources to continue in operational existence for the
foreseeable future. After due consideration of this, the
Directors believe it is appropriate to adopt the going concern
basis in preparing the financial statements.
CORPORATE GOVERNANCE
Principles Statement
The Directors are committed to high standards of corporate
governance and have made it the Company’s policy to
comply with best practice in this area, insofar as the Directors
believe it is relevant and appropriate to the Company, and in
compliance with the ‘UK Corporate Governance Code’ (i.e.
the code of best practice published by the Financial
Reporting Council (FRC), in respect of a financial year
beginning on or after 1 October 2012). The complete UK
Corporate Governance Code can be viewed on the Financial
Reporting Council website at http://www.frc.org.uk.
The Company is a member of the Association of Investment
Companies (the “AIC”). The Directors have considered the
principles and recommendations of the Association of
Investment Companies Code of Corporate Governance (“AIC
Code”) by reference to the Association of Investment
Companies Corporate Governance Guide for Investment
Companies (“AIC Guide”). The AIC Code, as explained by the
AIC Guide, addresses all the principles set out in the UK
Corporate Governance Code, as well as setting out
additional principles and recommendations on issues that
are of specific relevance to the Company. The Directors
consider reporting against principles and recommendations
of the AIC Code, by reference to the AIC Guide (which
incorporates the UK Corporate Governance Code), will
provide better information to shareholders.
The Company has complied with the provisions of the AIC
Code and the UK Corporate Governance Code, except for
the UK Corporate Governance Code provisions relating to:
• The role of the chief executive;
• The appointment of a Senior Independent Director;
• Executive Directors’ remuneration;
• The need for an internal audit function;
• Meeting with major shareholders to discuss governance
and strategy; and
• The appointment of external facilitators.
All of the Company’s day-to-day management and
administrative functions are outsourced to third parties,
namely the Administrator and the Managers. This means the
Company has no internal operations or employees with it
being an externally managed investment company.
For the reasons set out in the AIC Guide, and in the preamble
to the UK Corporate Governance Code, the Board considers
the above provisions not to be relevant to the Company, and
so has decided not to report further in respect of them.
The Guernsey Financial Services Commission has a standing
Code of Corporate Governance for the Finance Sector that
was issued in 2011 (the “Guernsey Code”). The Guernsey
Code states that “Companies which report against the
UK Corporate Governance Code or the AIC Code are also
deemed to comply with the Code”. As a company listed on
the London Stock Exchange the Company is subject to the
Disclosure Rules and Transparency Rules and the
UK Corporate Governance Code but uses the AIC code
instead as a member of the AIC and considers this
appropriate for a member company. As an AIC member
domiciled in Guernsey which reports against the AIC Code,
the Company is not required to report separately against the
Guernsey Code.
Directors’ Report

J.P. MORGAN PRIVATE EQUITY LIMITED ANNUAL REPORT AND FINANCIAL STATEMENTS 2015 21
Role of the Board
The Board has determined that its role is to consider and
determine the following principal matters which it considers
are of strategic importance to the Company:
• Review the overall objectives for the Company as
described in the prospectus dated 16 August 2011 and
set the Company’s strategy for fulfilling those objectives
within an appropriate risk framework;
• Consider any shifts in strategy that it considers may be
appropriate in light of market conditions;
• Review the capital structure of the Company including
consideration of an appropriate use of gearing both for
the Company and in any joint ventures in which the
Company may invest in from time to time;
• Evaluate its own performance and that of the individual
Directors;
• Appoint the Managers, Administrator and other
appropriately skilled service providers and monitor their
effectiveness through regular reports and meetings; and
• Review key elements of the Company’s performance
including NAV and payment of dividends.
Board Decisions
At its Board meetings, the Board ensures that all the strategic
matters listed under ‘Role of the Board’ are considered and
resolved by the Board. While issues associated with
implementing the Company’s strategy are generally
considered by the Board to be non-strategic in nature and
are delegated either to the Managers or the Administrator,
the Board considers that there are implementation matters
that are significant enough to be of strategic importance to
the Company and should be reserved to the Board.
Directors, Rotation of Directors and Directors Tenure
The Directors listed below were all appointed on 28 April
2005 except where detailed below:
Trevor Charles Ash(1) (Chairman)
John Loudon(1)
Christopher Paul Spencer(1)
Gregory Getschow(2) (appointed 11 June 2009)
Anthony Dalwood(1) (appointed 20 February 2015)
(1) Independent Non-Executive.(2) Non-Executive.
Mr. Trevor Charles Ash is Non-Executive Independent
Chairman of the Board of the Company. He spent 27 years with
the Rothschild Group, retiring in May 1999 as Managing
Director of the Guernsey-based Rothschild Asset Management
(C.I.) Limited and Non Executive Director of Rothschild Asset
Management Limited in London. He also recently retired as a
Non-Executive Director of N M Rothschild and Sons (C.I.)
Limited, the banking arm of the Rothschild Group in the
Channel Islands. In retirement Mr. Ash has retained a number
of Directorships of the Rothschild Group and joined the Boards
of a number of Offshore funds managed by groups including
Merrill Lynch, Thames River Capital, Dexion Capital
Management and ING. Mr. Ash is a Fellow of the Securities
Institute of England and Wales.
Mr. John Loudon is Non-Executive Independent Director of
the Company. He has been Chairman of Caneminster Ltd., a
British investment company, since June 1988. Mr. Loudon
serves as a director of GEMS Oriental & General Fund II
Limited and GEMS Oriental & General Fund III Limited.
Previously, Mr. Loudon was a Managing Director of
N.M. Rothschild & Sons from 1970 to 1988 and the
Chairman of Warrier International Limited from 1988 to 1991.
Mr. Loudon also served as a director of Exel Group plc from
1992 to 2004, XL Capital Ltd from 1992 to 2005 and Derby
Trust plc from 1989 to 2003.
Mr. Christopher Spencer is Non-Executive Independent
Director of the Company and Chairman of the Audit
Committee. He qualified as a chartered accountant in
London in 1975. Following two years in Bermuda he moved
to Guernsey where he now holds residency. Mr. Spencer,
who specialised in audit and fiduciary work, was Managing
Partner/Director of Pannell Kerr Forster (Guernsey) Limited
from 1990 until his retirement in May 2000. Mr. Spencer is a
member of the AIC Offshore Committee, a past President of
the Guernsey Society of Chartered and Certified
Accountants and a past Chairman of the Guernsey Branch of
the Institute of Directors. Mr. Spencer sits on the Board of
Directors of Real Estate Credit Investments PCC Limited, JP
Morgan Private Equity Limited, John Lang Infrastructure
Fund Limited, Ruffer Investment Company Limited, SQN
Asset Finance Income Fund Limited, each of which is listed
on the London Stock Exchange and also Summit Germany
Limited which is listed on AIM. Mr. Spencer is also a member
of the Board of Directors of a number of companies, details
of which can be found in the latest prospectus of the
Company which can be found at the investor section of the
Company’s website.
Mr. Gregory Getschow is Non-Executive Director of the
Company. He is a Managing Director of J.P. Morgan Asset
Management and a portfolio manager for the Company.
Mr. Getschow has been on the Company’s investment
committee since its inception on 30 June 2005. Prior to
joining J.P. Morgan Asset Management, Mr. Getschow was a
Senior Managing Director of BSAM Inc. Prior to joining
BSAM Inc., Mr. Getschow was a co-founder of BDC
Financial, Inc. Mr. Getschow began his career practicing law
at Bingham Dana LLP and Sullivan & Worcester LLP.
Mr. Getschow received a JD from Villanova Law School,
where he was a member of the Law Review, and an AB from
Colby College.

22 J.P. MORGAN PRIVATE EQUITY LIMITED ANNUAL REPORT AND FINANCIAL STATEMENTS 2015
Directors’ Report continued
Mr. Anthony Dalwood has been appointed as Non-
Executive Independent Director of the Company, with effect
from 20 February 2015. He was formerly Chairman of SVG
Investment Managers and CEO of SVG Advisers, the global
private equity funds business and manager of $5 billion in
AUM. He established the public equities business for
Schroder Ventures (London) Limited. Prior to this he was a
Director at UBS Global Asset Management (formerly Phillips
& Drew Fund Management) where he was a member of the
UK Equity Investment Committee and responsible for
managing over £1.5 billion of UK equities. He is currently
CEO of Gresham House plc, and a Board director of Branton
Capital and the London Pensions Fund Authority.
Mr. Dalwood has an honours degree in Economics &
Accounting from Bristol University, a degree in Management
Studies from Cambridge University (Judge Institute) and is a
member of the CFA Institute.
The Directors hold no significant shareholdings in any
investment in which the Company holds an interest.
Appointment and Rotation
The Directors have the power to appoint any person at any
time to the Board in accordance with the Company’s Articles
of Incorporation and taking into consideration Guernsey
Company Law, the UK Code of Corporate Governance, and
the AIC Code of Corporate Governance. Any new Board
members must be re-elected at the next AGM following their
appointment. Mr. Getschow will be put forward for re-
election as a Non-Independent, Non-Executive Director of
the Company on an annual basis and the other Directors on
a three year rotational basis.
On 20 February 2015, Anthony Dalwood was appointed to
the Board as an Independent Non-Executive Director.
In accordance with the Appointment and Rotation policy,
Mr. Getschow, Mr. Spencer and Mr. Dalwood were re-elected
as Non-Executive and Independent Non-Executive Directors
at the Annual General Meeting held on 29 July 2015,
following their retirements by rotation.
No Director has a service contract with the Company. The
Company did not use open advertising to appoint the
Directors of the Company.
Board Meetings
The Board meets quarterly and as required from time to time
to consider specific issues reserved to the Board. At the
quarterly meetings it considers papers circulated seven days
in advance including reports provided by the Managers and
the Administrator. The Managers’ report comments on:
• The investment market including recommendations for
any changes in strategy that the Managers consider may
be appropriate;
• Performance of the Company’s portfolio and key asset
management initiatives;
• Transactional activity undertaken over the previous
quarter and being contemplated for the future; and
• The Company’s financial position including its
relationship with its bankers and lenders.
The Administrator provides a compliance report at each
quarterly meeting. These reports enable the Board to assess
the success with which the Company’s investment strategy
and other associated matters are being implemented and
also to consider any relevant risks and how they should
properly be managed.
The table below shows the attendance at Board Meetings
during the year to 30 June 2015.
9 Jul 2 Oct 19 Feb 5 MayDirector Name 2014 2014 2015 2015
Trevor Charles Ash 3 3 3 3
John Loudon 3 3 3 3
Christopher Paul Spencer 3 3 3 3
Gregory Getschow 3 3 3 3
Anthony Dalwood — — 3 3
In between its quarterly meetings, the Board has also met on
one additional occasion during the year to approve various
corporate actions. The Board also uses these meetings to
evaluate its own performance by recognising the strengths
and weaknesses of the individual Directors as well as the
effectiveness of the Board as a whole. It has not always been
possible for all Directors to attend these meetings. The
Company maintains liability insurance for its Directors and
Officers although the Company has no employees and none
of its Directors are executive.
The Board has access to accurate, timely and clear
information about the Company in order to enable it to
discharge its duties. The Company Secretary, Augentius
(Guernsey) Limited, ensures that Board procedures are
complied with and that good information flows between the
Board and the Managers. The Board has the right to access
independent, professional advice at the Company’s expense
when deemed necessary.
The Chairman is responsible for leadership and ensuring the
Board’s effectiveness on all aspects of its role. The Board
discusses quarterly the training and development needs of
the Directors, and assess whether their balance of skills,
experience, diversity, independence and knowledge are
sufficient in fulfilling their duties. The Chairman ensures that
there is adequate time available for discussion of all agenda
items and works with the Board and Managers to promote a
culture of openness, support and co-operation.
Directors’ Interests
Mr. Getschow is a senior executive of Bear Stearns Asset
Management Inc., one of the Managers to the Company and

J.P. MORGAN PRIVATE EQUITY LIMITED ANNUAL REPORT AND FINANCIAL STATEMENTS 2015 23
a subsidiary of JPMorgan Chase & Co. Other than
Mr. Spencer who, as at 30 June 2015, owns 30,067
US$ Equity Shares and Mr. Dalwood who, as at 30 June
2015, owns 127,747 US$ Equity Shares, no other Director
holds directly or indirectly shares in the Company. Other than
Mr. Getschow, all Directors are independent of the Company.
Audit Committee
The Audit Committee consists of Trevor Ash, John Loudon
and Christopher Spencer, who is currently the chairman. All
members served on the committee throughout the year. The
members have relevant and recent commercial and financial
knowledge, and experience to satisfy the provisions of the
AIC Code by virtue of their holding or having held various
executive and Non-Executive roles in other financial and
asset management organisations.
The Audit Committee operates within clearly defined terms of
reference in order to assist the Board in discharging its duties
and responsibilities for financial reporting, internal control and
the appointment and remuneration of an independent
external auditor. In summary, the Audit Committee’s main
functions are:
• To make recommendations on the appointment of the
Company’s external auditors, the scope of the audit, the
audit fee, and the tenure of the external auditors and
tendering process;
• As the day-to-day management and administrative
functions are outsourced to third parties there is no
requirement for an internal audit function. Consequently
the Audit Committee reviews and monitors reports on
the internal control systems and risk management
systems of the third parties on which the Company is
reliant;
• To review the annual reports and accounts in order to
assess whether they represent a fair, balanced, and
understandable view of the Company’s position and
performance, business model, and strategy;
• To act upon any significant financial reporting issues and
judgements that are made in connection with the
preparation of the Company’s financial statements;
• To meet with the external auditor and assess the
effectiveness of the entire audit process, and to review
the findings of the external auditor, as well as looking at
the proposed audit programme;
• To monitor the integrity of the semi, and annual, financial
statements in order to review the actions and
judgements of the Manager, challenging decisions if
necessary; and
• To continually monitor the independence, objectivity,
effectiveness, qualification, and resources of the external
auditor.
Report on the committee’s activities during the year
During the year the Audit Committee discharged its
responsibilities under its terms of reference by monitoring the
integrity of the financial statements and formal
announcements relating to the Company’s financial
performance, and reviewing, and challenging where
necessary, the actions and judgements of the Investment
Managers and any other relevant entities, in relation to the
financial statements before submission to the Board, paying
particular attention to:
• Reviewing the draft 2015 financial statements prior to
discussion and approval by the Board, and reviewing the
external auditor’s reports, both oral and written thereon;
• Receiving and reviewing confirmations of external
auditor independence and approving the terms of
engagement and proposed audit fees for the 2015 audit.
Also recommending the re-appointment of the external
auditor for 2016 and considering future tender
requirements.
• Critical accounting policies and practices and any
changes in them, as they relate to the results of the
Company;
• Decisions requiring a major element of judgement
including the impact of adopting any acceptable
alternative accounting treatment;
• The extent to which the financial statements are affected
by any unusual transactions in the year and how they are
disclosed;
• Reviewing and understanding the Company’s risk
management framework;
• The clarity of disclosures;
• The going concern assumption;
• Compliance with Accounting Standards;
• Compliance with Financial Conduct Authority and other
legal, regulatory or listing requirements.
Significant Issues
During its review of the Company’s financial statements for
the year ended 30 June 2015, the Audit Committee
considered the following significant issues, in particular those
communicated by the external auditors during their
reporting.
Valuation of investments
The Company has interests in various different types of
investments including: investments in subsidiaries,
investments in unquoted funds, direct investments in

24 J.P. MORGAN PRIVATE EQUITY LIMITED ANNUAL REPORT AND FINANCIAL STATEMENTS 2015
Directors’ Report continued
unquoted companies, and direct investments in public
companies.
Direct investments in public companies are valued at the
quoted market price at the reporting date and so carry
minimal risk of being valued incorrectly. Investments in
subsidiaries and investments in unquoted funds are valued at
the net asset value as reported by the general partner.
These net asset values are reviewed by the Managers, and if
they conclude that the value provided by the general partner
does not represent fair value, the Directors and Managers will
adjust the value of the investment from the general partner’s
estimate.
As the net asset values are reviewed, and adjusted as
necessary, the risk of an incorrect valuation is minimal. Direct
investments in unquoted companies are generally valued at
fair value as reported by the respective management. To limit
any risks that are associated with these valuations they are
reviewed by the Managers and then adjusted where
necessary.
The Audit Committee concludes that the Managers have the
appropriate control processes in place, in respect of
valuation of investments, and that they are reviewed on a
regular basis so that all valuations are reflected at fair value.
The Audit Committee has reviewed the contents of this year’s
annual report and financial statements and advised the
Board that, in its view, the report is fair, balanced and
understandable and provides the information necessary for
shareholders to assess the Company’s position and
performance, business model and strategy.
Remuneration Committee
The Board as a whole fulfils the function of a remuneration
committee in relation to the setting and periodic review of the
fees of the Directors and the Chairman, taking into account,
amongst other factors, prevailing market conditions and the
need to attract to the Board, and retain thereafter, suitable
persons. The Board considers that, given its size and the size
of the Company, it would not be appropriate to establish a
separate remuneration committee. Directors’ remunerations
reflect their duties, responsibilities and the value of their time
spent.
Mr. Ash is entitled to receive Directors fees of £40,000 per
annum, Mr. Loudon, Mr. Spencer and Mr. Dalwood are each
entitled to receive Directors fees of £30,000 per annum.
Mr. Getschow is an employee of BSAM Inc. and has waived
his right to Directors’ fees.
At the Company’s 29 July 2015 Annual General Meeting,
shareholders approved an increase to the cap on the
aggregate base remuneration payable to the Directors as a
whole to £250,000 per annum.
Nomination Committee
The Board as a whole fulfils the function of a nomination
committee. The Board considers that, given its size and the
size of the Company, it would not be appropriate to establish
a separate nomination committee.
Management Engagement Committee
The Board as a whole fulfils the function of a management
engagement committee. The Board considers that, given its
size and the size of the Company, it would not be appropriate
to establish a separate management engagement committee.
On 8 August 2012, the Company entered into an amended
and restated Investment Management Agreement. Under the
new agreement dated 8 August 2012 the Company agreed
that henceforth it be provided with investment management
services by JF International Management Inc. (“JFIMI”) in
addition to Bear Stearns Asset Management Inc. (“BSAM
Inc.”) and JPMorgan Asset Management (UK) Limited
(“JPMAM UK”).
The Directors believe that BSAM Inc., JPMAM UK and JFIMI
(together the “Managers”), subsidiaries of JPMorgan Chase
& Co have performed consistently since being appointed as
the Managers of the Company. As such, it is the view of the
Independent Directors that it is in the best interests of the
Shareholders to continue with the current appointment of the
Managers under the terms agreed.
The Board as a whole considers and reviews the
remuneration of the Managers.
Internal Controls
The Directors have reviewed the effectiveness of the
Company’s system of internal financial and operating
controls during the fiscal year and found they were operating
as expected.
The Board considers risk management and internal financial
and operating controls on a regular basis during the year
although such a system can only provide reasonable and not
absolute assurance against material misstatement or loss, as
it is designed to manage rather than eliminate risk of failure.
The key elements designed to provide effective internal
financial and operating controls are as follows:
• Financial reporting – A regular review of relevant financial
data including NAV calculations and performance
projections;
• Management and Administration Agreements –
Contractual documentation with appropriately regulated
entities which clearly describes responsibilities for the
two principal service providers;
• Management Systems – The Managers’ system of
internal controls is based on clear written processes, a
formal investment committee and clear lines of

J.P. MORGAN PRIVATE EQUITY LIMITED ANNUAL REPORT AND FINANCIAL STATEMENTS 2015 25
responsibility and reporting, all of which are monitored
by the Managers’ internal risk team;
• Administrator’s Systems – Augentius (Guernsey) Limited
(“Augentius” or the “Administrator”) is part of the largest
independent Private Equity and Real Estate
Administrator in the world. The Administrator’s systems
of internal controls are based on formalised processes
tailored specifically to JPEL. In addition, every
transaction and report is reviewed by at least two
qualified Accountants before release; and
• Administrator’s Technology – Augentius uses SunGard
Investran as its core accounting system and benefits
from structured change control processes and clear
audit trail functionality. Investran as a system is
recognised as a leading accounting technology for
Private Equity.
Administration and company secretarial services have been
provided by Augentius (Guernsey) Limited, effective
13 August 2012. Consideration was given to the internal
controls of the Administrator prior to appointment and will be
assessed on an ongoing basis. The Company’s system of
internal control is substantially reliant on the Managers’ and
Augentius’ internal controls and their internal audit. During
the period Augentius was awarded an SSAE16 Type II report
for its internal controls for the period ended 31 December
2013. The report for the period ended 31 December 2014 is
currently in process, however to date there have been no
issues with the internal financial and operating controls
arising from the Administrator. It is the view of the
independent Directors that it is in the best interest of
Shareholder’s to continue with the current appointment of
the Administrator as all of their duties and responsibilities
have been carried out successfully since their appointment.
Principal risks and uncertainties
The Company, the Company’s investments and the
underlying portfolio companies are materially affected by a
variety of risks and uncertainties in the global financial
markets and economic conditions throughout the world.
These risks and uncertainties include, but are not limited to,
interest rates, currency, investment prices, credit, liquidity,
investment managers, valuations, political, and regulatory.
These factors are outside the Company’s control and may
affect the level and volatility of securities prices, the amount
of distributions received, the liquidity and value of
investments in the portfolio. The Company may be unable to
mitigate its exposure to these conditions as efforts to
manage its exposure may or may not be effective. Please
refer to note 3 of the audited financial statements for a more
detailed discussion of the above principal risks and
uncertainties, and how they are managed or mitigated.
Operational risk is the risk of direct or indirect loss arising
from a wide variety of causes associated with the processes,
technology, and infrastructure supporting the Company’s
operations either internally within the Company or externally
at the Company’s service providers, and from external
factors other than credit, market, and liquidity risks such as
those arising from legal and regulatory requirements and
generally accepted standards of investment management
behaviour. Operational risks arise from all of the Company’s
activities.
The Company’s objective is to manage operational risk so as
to balance the limiting of financial losses and damage to its
reputation, whilst achieving its investment objective of
generating returns to investors.
The primary responsibility for the development and
implementation of controls over operational risk rests with
the Board of Directors. This responsibility is supported by the
development of overall standards for the management of
operational risk, which encompasses the controls and
processes at the service providers and the establishment of
service levels with the service providers, in the following
areas:
• Requirements for appropriate segregation of duties
between various functions, roles and responsibilities;
• Requirements for the reconciliation and monitoring of
transactions;
• Compliance with regulatory and other legal
requirements;
• Documentation of controls and procedures;
• Requirements for the periodic assessment of operational
risks faced, and the adequacy of controls and
procedures to address the risks identified;
• Contingency plans;
• Ethical and business standards; and
• Risk mitigation, including insurance where this is
effective.
The Directors’ assessment over the adequacy of the controls
and processes in place at the service providers with respect
to operational risks is carried out via regular discussions with
the service providers and a review of the Administrators’
SSAE16 reports on internal controls.
Managers
The Managers’ key responsibilities include proposing an
investment strategy to the Board, selecting investments for
acquisition and disposal and arranging appropriate lending
facilities. The Managers are also responsible for all issues
pertaining to asset management. The Directors agree
policies with the Managers covering key operational issues.
In conjunction with the Company’s acquisition of Macquarie
Private Capital Trust (“MPCT”), Macquarie Investment

26 J.P. MORGAN PRIVATE EQUITY LIMITED ANNUAL REPORT AND FINANCIAL STATEMENTS 2015
Management Limited (“MIML”) was retained as an advisor
and sub-administrator by BSPEL Australia Limited. Pursuant
to the management agreement between BSPEL Australia
Limited and MIML, BSAM Inc. has assumed day-to-day
control over the portfolio. During the fiscal year, the
management agreement between BSPEL Australia Limited
and MIML was novated from MIML to ROC Capital Pty
Limited. MIML sold a portion of its Macquarie Investment
Management Private Markets (“MIMPM”) business to senior
managers of MIMPM in a management buyout and the new
owner of the MIMPM business is ROC Capital Pty Limited.
The Board reviews the performance of the Managers,
including evaluation of performance and fees on an annual
basis. The Board is satisfied that the continuing appointment
of the Managers is in the interest of the shareholders as a
whole. The investment skills, performance, experience, and
commitment are the key factors taken into account in
reaching this decision.
Alternative Investment Fund Managers Directive(AIFMD)
The Managers have determined that the Company is out of
scope from the full Directive for the following reasons:
• The Company is a Non EU Alternative Investment Fund
(Guernsey);
• The Company’s investment decisions are made by Non
EU Alternative Investment Fund Managers (BSAM and
JFIMI); and
• The Company is not currently marketing into the EU.
Secretary
Augentius (Guernsey) Limited held the office of Company
Secretary through 30 June 2015. The registered office of the
Company is PO Box 60, Carinthia House, 9-12 The Grange,
St Peter Port, Guernsey, GY1 4BF.
Independent Auditors
PricewaterhouseCoopers CI LLP was reappointed as
independent external auditors during the year. The Board has
reviewed the effectiveness of the external auditor and considers
them to be independent, and is confident they take the
necessary steps in order to ensure their continued
independence and objectivity. The Board feels the external audit
work is done to an excellent standard, is in a timely manner, and
any issues are communicated in a clear and concise way in
order to gain a prompt result. A resolution to reappoint
PricewaterhouseCoopers CI LLP as independent external
auditors to the Company will be proposed at the forthcoming
Annual General Meeting. PricewaterhouseCoopers CI LLP does
not perform any non-audit services for the Company.
Shareholder Relations
Shareholder communications are a high priority for the
Board. The Managers produce a monthly fact sheet which is
distributed to shareholders and released to the London
Stock Exchange. Members of the Managers’ Investment
Committee make themselves available at all reasonable
times to meet with principal shareholders and key sector
analysts. Feedbacks from these sessions are provided by the
Managers at the quarterly Board meetings.
In addition, the Board is also kept fully appraised of all market
commentary on the Company by the Managers and other
professional advisers including the Company’s brokers.
Through this process the Board seeks to monitor the views
of shareholders and to ensure that the Company’s
communication program is effective.
The Chairman and the Managers will be available during
each Annual General Meeting to answer any questions that
attending shareholders may have.
Substantial Interests
Disclosure and Transparency Rules are comprised in the
Financial Conduct Authority Handbook. Such rules require
substantial shareholders to make relevant holding
notifications to the Company and the UK Financial Conduct
Authority. The Company must then disseminate this
information to the wider market.
Three shareholders remain from last year as investors with
more than 10% ownership in the total number of US$ Equity
Shares in issue, with an addition of one shareholder that has
increased their ownership to above 10% for this share type
within the year. In total, four shareholders hold greater than
10% of the total number of US$ Equity Shares in issue with
holdings of approximately 11.0%, 11.5%, 11.5% and 15.1%.
One nominee owns more than 10% of the US$ Equity Shares
in issue, with an ownership 17.9%.
The below tables list the shareholders and nominees with
greater than 10% ownership in the total number of US$
Equity Shares in issue as at year end.
2015
Shareholder Shares Ownership
Barwon Investment Partners 50,877,817 15.10%
Brooks Macdonald Asset Management 38,883,112 11.50%
Asset Value Investors Limited 38,749,094 11.50%
Baring Asset Management Ltd 37,264,148 11.00%
Nominee
HSBC Management (Guernsey) Ltd 60,531,753 17.90%
2014
Shareholder Shares Ownership
Baring Asset Management Ltd 59,090,631 17.10%
Barwon Investment Partners 53,596,246 15.50%
Directors’ Report continued

J.P. MORGAN PRIVATE EQUITY LIMITED ANNUAL REPORT AND FINANCIAL STATEMENTS 2015 27
Brooks Macdonald Asset Management 44,765,015 12.90%
Nominee
HSBC Management (Guernsey) Ltd 76,704,680 22.10%
STATEMENT OF THE DIRECTORS’RESPONSIBILITIES
The Directors are responsible for preparing the Directors’
Report, annual report and financial statements in accordance
with the applicable laws and regulations.
Guernsey company law requires the Directors to prepare
financial statements for each financial year. Under that law
they have elected to prepare the financial statements in
accordance with International Financial Reporting Standards
(IFRS) and applicable Guernsey law.
The financial statements are required by law to give a true
and fair view of the state of affairs of the Company and of the
profit or loss of the Company for that period.
In preparing those financial statements the Directors are
required to:
• Select suitable accounting policies and apply them
consistently;
• Make judgements and estimates that are reasonable
and prudent;
• State whether applicable accounting standards have
been followed, subject to any material departures
disclosed and explained in the financial statements;
• Prepare the financial statements on the going concern
basis unless it is inappropriate to presume that the
Company will continue in business; and
• Ensure, when taken as a whole, the financial statements
are fair, balanced and understandable.
The Directors confirm that they have complied with the above
requirements in preparing the financial statements.
The Directors are responsible for keeping proper accounting
records which disclose with reasonable accuracy at any time
the financial position of the Company and to enable them to
ensure that the financial statements comply with The
Companies (Guernsey) Law, 2008. They have a general
responsibility for taking such steps as are reasonably open to
them to safeguard the assets of the Company and to prevent
and detect fraud and other irregularities.
DISCLOSURE OF INFORMATION TOAUDITOR
The Directors who held office at the date of approval of this
Directors’ Report confirm that, so far as they are each aware,
there is no relevant audit information of which the Company’s
Auditors are unaware; and each Director has taken all the
steps that he ought to have taken as a Director to make
himself aware of any relevant audit information and to
establish that the Company’s Auditors are aware of that
information.
We also confirm that to the best of our knowledge:
• The financial statements, prepared in accordance with
the applicable set of accounting standards, give a true
and fair view of the assets, liabilities, financial position
and profit or loss of the Company taken as a whole as
required by Disclosure and Transparency Rules (“DTR”)
4.1.12R; and
• The Chairman’s Statement, Corporate Actions,
Managers’ Report and Directors’ Report (together
referred to as the “Management Report”) includes a fair
review of the development and performance of the
business and the position of the Company taken as a
whole, together with a description of the principal risks
and uncertainties that they face as required by DTR
4.1.12R.
By order of the Board
Trevor Ash Christopher Spencer
Director Director
Date: 26 October 2015

28 J.P. MORGAN PRIVATE EQUITY LIMITED ANNUAL REPORT AND FINANCIAL STATEMENTS 2015
INDEPENDENT AUDITORS’ REPORT TO THEMEMBERS OF J.P. MORGAN PRIVATEEQUITY LIMITED
REPORT ON THE FINANCIAL STATEMENTS
We have audited the accompanying financial statements of
J.P. Morgan Private Equity Limited (the “Company”) which
comprise the Statement of Financial Position as of 30 June 2015
and the Statement of Comprehensive Income, the Statement of
Changes in Equity and the Statement of Cash Flows for the year
then ended and a summary of significant accounting policies and
other explanatory information.
DIRECTORS’ RESPONSIBILITY FOR THEFINANCIAL STATEMENTS
The directors are responsible for the preparation of financial
statements that give a true and fair view in accordance with
International Financial Reporting Standards and with the
requirements of Guernsey law. The directors are also responsible
for such internal control as they determine is necessary to enable
the preparation of financial statements that are free from material
misstatement, whether due to fraud or error.
AUDITORS’ RESPONSIBILITY
Our responsibility is to express an opinion on these financial
statements based on our audit. We conducted our audit in
accordance with International Standards on Auditing. Those
Standards require that we comply with ethical requirements and
plan and perform the audit to obtain reasonable assurance
whether the financial statements are free from material
misstatement.
An audit involves performing procedures to obtain audit evidence
about the amounts and disclosures in the financial statements.
The procedures selected depend on the auditors’ judgement,
including the assessment of the risks of material misstatement of
the financial statements, whether due to fraud or error. In making
those risk assessments, the auditor considers internal control
relevant to the entity’s preparation and fair presentation of the
financial statements in order to design audit procedures that are
appropriate in the circumstances, but not for the purpose of
expressing an opinion on the effectiveness of the entity’s internal
control. An audit also includes evaluating the appropriateness of
accounting policies used and the reasonableness of accounting
estimates made by the directors, as well as evaluating the overall
presentation of the financial statements.
We believe that the audit evidence we have obtained is sufficient
and appropriate to provide a basis for our audit opinion.
OPINION
In our opinion, the financial statements give a true and fair view of
the financial position of the Company as of 30 June 2015, and of
its financial performance and its cash flows for the year then
ended in accordance with International Financial Reporting
Standards and have been properly prepared in accordance with
the requirements of The Companies (Guernsey) Law, 2008.
REPORT ON OTHER LEGAL ANDREGULATORY REQUIREMENTS
We read the other information contained in the Annual Report
and consider the implications for our report if we become aware
of any apparent misstatements or material inconsistencies with
the financial statements. The other information comprises only
the Financial Summary, Historical Performance, Overview and
Strategy, Investment Policy, Chairman’s Statement, Corporate
Actions, Managers’ Report and Directors’ Report.
In our opinion the information given in the Directors’ Report is
consistent with the financial statements.
This report, including the opinion, has been prepared for and only
for the Company’s members as a body in accordance with
Section 262 of The Companies (Guernsey) Law, 2008 and for no
other purpose. We do not, in giving this opinion, accept or
assume responsibility for any other purpose or to any other
person to whom this report is shown or into whose hands it may
come save where expressly agreed by our prior consent in
writing.
MATTERS ON WHICH WE ARE REQUIREDTO REPORT BY EXCEPTION
We have nothing to report in respect of the following matters
which we are required to review under the Listing Rules:
• the directors’ statement set out on page 20 in relation to
going concern and;
• the part of the Corporate Governance Statement relating to
the Company’s compliance with the ten provisions of the UK
Corporate Governance Code specified for our review.
Joanne Peacegood
For and on behalf of PricewaterhouseCoopers CI LLP
Chartered Accountants and Recognised Auditor
Guernsey, Channel Islands
26 October 2015
The maintenance and integrity of the J.P. Morgan Private Equity
Limited website is the responsibility of the Directors; the work
carried out by the auditors does not involve consideration of these
matters and, accordingly, the auditors accept no responsibility for
any changes that may have occurred to the financial statements
since they were initially presented on the website.
Legislation in Guernsey governing the preparation and
dissemination of the financial statements may differ from the
legislation in other jurisdictions.
Independent Auditors’ Report

J.P. MORGAN PRIVATE EQUITY LIMITED ANNUAL REPORT AND FINANCIAL STATEMENTS 2015 29
Statement of Comprehensive Incomefor the year ended 30 June 2015
2015 2014Notes $’000 $’000
Income
Interest and distribution income 4 5,195 6,557
Other net changes in fair value of financial assets and financial liabilities through profit or loss 7 34,289 40,607
Realised gain on forward currency contracts 14,036 836
Total net income 53,520 48,000
Expenses
Investment management fees 18 (5,421) (5,525)
Accounting and administration fees 18 (621) (253)
Audit fees (262) (274)
Directors’ fees 20 (157) (164)
Other expenses 6 (3,501) (3,521)
Total expenses (9,962) (9,737)
Net profit before finance costs 43,558 38,263
Finance costs
Interest expense – Loans 5 (201) (1,409)
Interest expense – Zero dividend preference shares 15 (10,574) (10,139)
Net foreign exchange gain/(loss) 8 8,708 (15,845)
Profit for the year 41,491 10,870
Other comprehensive income – –
Total comprehensive income for the year 41,491 10,870
Earnings per share
Earnings per Equity share 19 $0.12 $0.03
All items in the above statement are derived from continuing operations.
The notes on pages 33 to 63 form an integral part of these financial statements.

30 J.P. MORGAN PRIVATE EQUITY LIMITED ANNUAL REPORT AND FINANCIAL STATEMENTS 2015
Statement of Financial Positionas at 30 June 2015
2015 2014Notes $’000 $’000
Non-current assets
Financial assets at fair value through profit or loss 11 533,102 484,291
Current assets
Cash and cash equivalents 20,547 25,410
Receivables 9 2,688 3,173
Financial assets at fair value through profit or loss –Derivative financial assets 13 5,334 –
28,569 28,583
Non-current assets held for sale 3, 11 – 36,588
Current liabilities
Payables and accruals 10 (1,452) (2,283)
Financial liabilities at fair value through profit or loss – Derivative financial liabilities 13 – (1,023)
Zero dividend preference shares – Short term 15 (89,374) –
Net current (liabilities)/assets (62,257) 25,277
Non-current liabilities
Loan balances 14 – (20,545)
Zero dividend preference shares – Long term 15 (42,294) (131,873)
(42,294) (152,418)
Net Assets 428,551 393,738
Represented by:
Share capital 16 453,199 459,877
Accumulated loss (24,648) (66,139)
Total equity 428,551 393,738
NAV per US$ Equity share 19 $1.27 $1.14
The financial statements on pages 29 to 63 are approved by the Board of Directors on 26 October 2015 and are signed onits behalf by:
Trevor Ash Chris SpencerDirector Director
The notes on pages 33 to 63 form an integral part of these financial statements.

J.P. MORGAN PRIVATE EQUITY LIMITED ANNUAL REPORT AND FINANCIAL STATEMENTS 2015 31
Statement of Changes in Equityfor the year ended 30 June 2015
Share Accumulatedcapital loss Total
Notes $’000 $’000 $’000
At 1 July 2014 459,877 (66,139) 393,738
Profit for the year – 41,491 41,491
Total comprehensive income for the year – 41,491 41,491
Share buy backs 16 (6,743) – (6,743)
Shares issued on warrant conversion 17 65 – 65
Total transactions with owners of the Company for the year ended 30 June 2015 (6,678) – (6,678)
At 30 June 2015 453,199 (24,648) 428,551
Share Accumulatedcapital loss Total
Notes $’000 $’000 $’000
At 1 July 2013 467,108 (84,240) 382,868
Profit for the year – 10,870 10,870
Total comprehensive income for the year – 10,870 10,870
Expiry of warrant subscription rights 17 (7,231) 7,231 –
Total transactions with owners of the Company for the year ended 30 June 2014 (7,231) 7,231 –
At 30 June 2014 459,877 (66,139) 393,738
The notes on pages 33 to 63 form an integral part of these financial statements.

32 J.P. MORGAN PRIVATE EQUITY LIMITED ANNUAL REPORT AND FINANCIAL STATEMENTS 2015
Statement of Cash Flowsfor the year ended 30 June 2015
2015 2014Notes $’000 $’000
Operating activities
Profit for the year 41,491 10,870
Adjustments for:
Interest income 4 (92) (42)
Distributions from investments 4 (5,103) (6,515)
Interest expense 5,15 10,775 11,548
Net unrealised (gains)/losses on derivative financial instruments 7 (6,357) 1,400
Net realised gains on derivative financial instruments (14,036) (838)
Net gains on investment portfolio 7 (27,932) (42,007)
Net foreign exchange (gain)/loss 8 (8,708) 15,845
Operating cash flows before changes in working capital (9,962) (9,739)
(Increase)/decrease in receivables (572) 315
Decrease in payables (222) (124)
Cash used in operations (10,756) (9,548)
Investing activities
Purchase of investments (138,846) (126,703)
Net proceeds from sale of investments 155,008 179,380
Cash received on settlement of derivative financial instruments 14,036 838
Interest received 89 45
Other income distributions from investments 4 5,103 6,515
Cash from investing activities 35,390 60,075
Financing activities
Equity shares buy back 16 (6,743) –
Shares issued on warrant conversion 17 65 –
Loans received 14 12,377 –
Loans paid 14 (32,921) (37,137)
Interest paid (203) (1,439)
Cash used in financing activities (27,425) (38,576)
Net (decrease)/increase in cash and cash equivalents (2,791) 11,951
Cash and cash equivalents at the beginning of the year 25,410 13,032
Effects of exchange difference arising from cash and cash equivalents (2,072) 427
Cash and cash equivalents at the end of the year 20,547 25,410
The notes on pages 33 to 63 form an integral part of these financial statements.
J.P. MORGAN PRIVATE EQUITY LIMITED ANNUAL REPORT AND FINANCIAL STATEMENTS 2015 33
Notes to the Financial Statementsfor the year ended 30 June 2015
1. SIGNIFICANT ACCOUNTING POLICIES
J.P. Morgan Private Equity Limited (the “Company”) is a closed ended investment fund incorporated as a limited liabilitycompany in Guernsey under The Companies (Guernsey) Law, 2008. As at 30 June 2015, the Company’s capital structureconsisted of three classes of shares, US$ Equity Shares and two series of zero dividend preference shares, all of which arelisted on the London Stock Exchange.
The primary objective of the Company is to achieve capital growth, with income as a secondary objective, from a diversifiedportfolio consisting predominantly of private equity limited partnership interests. The Company may also invest directly inprivate equity investments.
The accounting policies set out below have been applied consistently by the Company to all periods presented in thesefinancial statements.
Statement of compliance
The financial statements have been prepared in accordance with International Financial Reporting Standards (“IFRS”) issuedand adopted by the International Accounting Standards Board (the “IASB”) and interpretations issued by the InternationalFinancial Reporting Interpretations Committee. They give a true and fair view and are in compliance with applicable legal andregulatory requirements of The Companies (Guernsey) Law, 2008 and the Listing Rules of the UK Listing Authority.
Standards and amendments to existing standards effective for annual periods beginning on or after 1 July 2014 thatare relevant and have been adopted by the Company
Amendments to IAS 32, ‘Offsetting Financial Instruments Assets and Liabilities’
The amendments do not change the offsetting model in IAS 32, ‘Financial Instruments: Presentation’, but clarify that in orderto offset financial assets and liabilities, the right of set-off must not be contingent on future events, and must be legallyenforceable in the normal course of business. The amendments also clarify that master netting agreements where offset isonly legally enforceable when future events occur (e.g. defaults), do not allow offsetting. Finally, the amendments specifysituations when offsetting is permitted when gross settlement mechanisms are used. The amendment is effective for annualperiods beginning on or after 1 January 2014. The Directors have adopted these amendments and there is no impact on theCompany’s financial statements.
Annual Improvements to IFRSs 2010-2012 Cycle (Amendment to IAS 24, ‘Related Party Disclosures’)
On 12 December 2013, the International Accounting Standards Board (IASB) issued Annual Improvements toIFRSs 2010-2012 Cycle which provided clarification on ‘management entity’. The IASB considered that an entity that provideskey management personnel services to the reporting entity or to the parent of the reporting entity is also a related party of thatreporting entity. These amendments are effective for periods beginning on or after 1 July 2014. The Directors have adoptedthese amendments and there is no impact on the Company’s financial statements.
IFRS 12 ‘Disclosures of Interests in Other Entities’
IFRS 12 ‘Disclosures of Interests in Other Entities’ does not affect the amounts recognised in the financial statements, butrequires new disclosures about judgements made by the Board to determine whether control exists and to requiresummarised information on the Company’s investees.
There are no other standards, interpretations or amendments to existing standards that are effective for the first time in thefinancial year beginning 1 July 2014 that would be expected to have a material effect on the Company.
New standards and amendments to existing standards that are relevant but have not yet been adopted by theCompany
A number of new standards, amendments to standards and interpretations in issue are not yet effective for the year ended30 June 2015, and have not been applied in preparing these financial statements. The Directors are considering the potentialeffect of the implementation of the new standards.

34 J.P. MORGAN PRIVATE EQUITY LIMITED ANNUAL REPORT AND FINANCIAL STATEMENTS 2015
Notes to the Financial Statements continued
1. SIGNIFICANT ACCOUNTING POLICIES continued
Statement of compliance continued
FRS 9, ‘Financial Instruments’ (effective for accounting periods beginning on or after 1 January 2018)
IFRS 9, ‘Financial instruments’, addresses the classification, measurement and recognition of financial assets and financialliabilities. The complete version of IFRS 9 was issued in July 2014. It replaces the guidance in IAS 39 that relates to theclassification and measurement of financial instruments. IFRS 9 retains but simplifies the mixed measurement model andestablishes three primary measurement categories for financial assets: amortised cost, fair value through other comprehensiveincome and fair value through profit or loss. The basis of classification depends on the entity’s business model and thecontractual cash flow characteristics of the financial asset. Investments in equity instruments are required to be measured atfair value through profit or loss with the irrevocable option at inception to present changes in fair value in other comprehensiveincome. There is now a new expected credit losses model that replaces the incurred loss impairment model used in IAS 39.
For financial liabilities there were no changes to classification and measurement except for the recognition of changes in owncredit risk in other comprehensive income for liabilities designated at fair value through profit or loss.
IFRS 9 relaxes the requirements for hedge effectiveness by replacing the bright line hedge effectiveness tests. It requires aneconomic relationship between the hedged item and hedging instrument and for the ‘hedged ratio’ to be the same as the onemanagement actually use for risk management purposes. Contemporaneous documentation is still required but is different tothat currently prepared under IAS 39.
The standard is not applicable until 1 January 2018 but is available for early adoption. The Company has yet to assess IFRS 9’sfull impact.
IFRS 15, ‘Revenue from Contracts with Customers’ (effective for accounting periods beginning on or after 1 January 2018)
In May 2014, IASB issued IFRS 15 ‘Revenue from Contracts with Customers’. The core principle of the new Standard is forcompanies to recognise revenue to depict the transfer of goods or services to customers in amounts that reflect theconsideration (that is, payment) to which the Company expects to be entitled in exchange for those goods or services. Thenew Standard will also result in enhanced disclosures about revenue, provide guidance for transactions that were notpreviously addressed comprehensively (for example, service revenue and contract modifications) and improve guidance formultiple-element arrangements.
IFRS 15 is effective for annual periods beginning on or after 1 January 2018. Earlier application is permitted. The Companyhas yet to assess IFRS 15’s full impact.
Investment Entities, ‘Applying the Consolidation Exception (Amendments to IFRS 10, IFRS 12 and IAS 28)’
In December 2014, IASB issued the amendments to IFRS 10, IFRS 12 and IAS 28 providing clarification on the application ofconsolidation exception for investment entities including its subsidiaries.
The amendments clarify that intermediate parent entities which are subsidiaries of investment entities can also avail theexception from preparing a consolidated financial statements. The amendments also clarify that a subsidiary that providesservices related to the investment activities of its investment entity parent should be consolidated. However, if such subsidiaryis also an investment entity, then such subsidiary should also be measured at fair value through profit or loss by the parentinvestment entity. The amendments now also allow a non-investment entity parent to retain the fair value measurement appliedby the investment entity associate or joint venture to its subsidiaries.
The amendments are effective for annual periods beginning on or after 1 January 2016. Earlier application is permitted. TheCompany will apply the new requirements when these amendments become effective. The Directors believe that the adoptionof these amendments will not have a material impact in the financial statements of the Company.
There are no other standards, interpretations or amendments to existing standards that are not yet effective that would beexpected to have a significant impact on the Company.
Basis of preparation
These financial statements have been prepared on a going concern basis in US Dollars under the historical cost conventionexcept for investments and derivative financial instruments that are measured at fair value with changes in fair value recognisedin the statement of comprehensive income. Other financial assets and financial liabilities including receivables, payables,accruals, loans and zero dividend preference shares are stated at amortised cost.

J.P. MORGAN PRIVATE EQUITY LIMITED ANNUAL REPORT AND FINANCIAL STATEMENTS 2015 35
The preparation of financial statements in conformity with IFRS requires management to make judgements, estimates andassumptions that affect the application of policies and the reported amounts of assets and liabilities, income and expenses.The estimates and associated assumptions are based on historical experience and various other factors that are believed tobe reasonable under the circumstances, the results of which form the basis of making judgements about the carrying valuesof assets and liabilities that are not readily apparent from other sources. Actual results may differ from these estimates.
In particular, information about significant areas of estimation uncertainty and critical judgements in applying accountingpolicies that have the most significant effect on the amounts recognised in the financial statements are described below inNote 2 ‘Key estimates and assumptions’.
These financial statements are the only financial statements presented by the Company.
Investment entity
The Company has been deemed to meet the definition of an investment entity per IFRS 10 as the following conditions exist:
• The Company has obtained funds for the purpose of providing investors with investment management services.
• The Company’s business purpose, which was communicated directly to investors, is investing solely for returns fromcapital appreciation and investment income, through the use of investment vehicles.
• The performance of investments made through the investment vehicles are measured and evaluated on a fair value basis.
• The Company has more than one investment and more than one investor.
• The Company has investors who are not its related parties.
• The Company has ownership interests in the form of equity.
Subsidiaries
The Company is required to consider all facts and circumstances when assessing whether an entity is an investment entity,including its purpose and design. The absence of any of these typical characteristics, as listed above, does not necessarilydisqualify an entity from being classified as an investment entity. The subsidiaries are also deemed to meet the definition of aninvestment entity per IFRS 10, as they have been formed in connection with JPEL for legal, regulatory, tax or similar businessreasons. The subsidiaries do not render investment advisory or management services, or administrative services to any of theinvestments in the portfolio.
Please refer to note 12 for details of the Company’s subsidiaries.
Financial instruments
Financial assets and financial liabilities are recognised in the statement of financial position when the Company becomes aparty to the contractual provisions of the instrument. Financial assets and financial liabilities are only offset and the net amountreported in the statement of financial position and statement of comprehensive income when there is a currently enforceablelegal right to offset the recognised amounts and the Company intends to settle on a net basis or realise the asset and liabilitysimultaneously.
(i) Financial assets
The classification of financial assets at initial recognition depends on the purpose for which the financial asset wasacquired and its characteristics. All financial assets are initially recognised at fair value plus, for an item not at fair valuethrough profit or loss, transaction costs that are directly attributable to its acquisition or issue. All purchases of financialassets are recorded at trade date, being the date on which the Company became party to the contractual requirementof the financial asset. The Company’s financial assets comprise of assets designated as financial assets at fair valuethrough profit or loss and loans and receivables. Unless otherwise indicated the carrying amounts of the Company’sfinancial assets approximate to their fair values.
(a) Financial assets at fair value through profit or loss
The Company manages its investments with a view to profiting from the receipt of dividends and changes in fair valueof equity investments. The Company may also make loan investments and these are designated as financial assetsat fair value through profit or loss. Therefore, all quoted investments, unquoted equity investments and debt securitiesare designated at fair value through profit or loss and subsequently carried in the statement of financial position atfair value. Equity investments at fair value through profit or loss are initially recognised at fair value and relatedtransaction costs are recognised immediately in the statement of comprehensive income within other expenses.

36 J.P. MORGAN PRIVATE EQUITY LIMITED ANNUAL REPORT AND FINANCIAL STATEMENTS 2015
Notes to the Financial Statements continued
1. SIGNIFICANT ACCOUNTING POLICIES continued
Financial instruments continued
(i) Financial assets continued
Investments in subsidiaries are valued at the fair value of the Company’s percentage holding based on the net assetvalues of the subsidiaries. The Company reviews the net asset values of the subsidiaries to make any adjustments inorder to obtain the best estimate of fair value. “Other net changes in fair value of financial assets and financial liabilitiesat fair value through profit or loss” in the statement of comprehensive income include the change in fair value of thesubsidiaries.
Investments in funds are recorded at the fair value of the Company’s percentage holding as reported by the generalpartners of those funds per the capital statement. The underlying investments held by those funds are measured atfair value, which is based on the general partners’ estimate. In estimating the fair value of underlying investments theobjective of the general partners is to replicate the assumptions and estimates that parties in an arm’s lengthtransaction would make. In arriving at the estimated value of underlying investments, the general partners considermarket multiples, net assets, industry benchmarks, prices of recent transactions, negotiated sales prices, projectedoperational and financial results of the company and discounted cash flow valuations. The Company believes thatthis value, in most cases, represents fair value as of the relevant statement date, although, if other factors lead theCompany to conclude that the value provided by the general partners does not represent fair value, the Directors andManagers will adjust the value of the investment from the general partners’ estimate.
The valuation policies used by many of the private equity general partners and sponsors in undertaking suchvaluations are generally in line with the recommendations of the International Private Equity and Venture CapitalValuation Guidelines (IPEVCG) or standard industry practice. Changes in fair value are recognised in the statement ofcomprehensive income under “Other net changes in fair value of financial assets and financial liabilities at fair valuethrough profit or loss”.
Investments made by the Company are generally considered to be long term investments and are not intended to bedisposed of on a short term basis. Accordingly, while the valuation at the year end represents the Directors’ bestestimate of the realisable amount at the year end they do not necessarily represent the amounts which may eventuallybe realised from sales or other disposals of investments. The key estimates and assumptions used to arrive at thevaluation of unlisted investments are stated on pages 40 to 41.
The disclosure requirements in IFRS 13 establish a hierarchal disclosure framework, which prioritises and ranks thelevel of market price observability used in measuring investments at fair value. Market price observability is impactedby a number of factors, including the type of investment and characteristics specific to the investment. Investmentswith readily available actively quoted prices or for which fair value can be measured from actively quoted pricesgenerally will have a higher degree of market price observability and a lesser degree of judgement used in measuringfair value.
Investments measured and reported at fair value are classified and disclosed in one of the following categories:
• Level I – Quoted prices are available in active markets for identical investments as of the reporting date. The typesof investments that would generally be included in Level I include listed equities and listed or highly liquidderivatives. The Company, to the extent it holds such investments, does not adjust the quoted price for theseinvestments, even in situations where the Company holds a large position and a sale could reasonably impactthe quoted price.
• Level II – Pricing inputs other than quoted prices in active markets, which are either directly or indirectlyobservable as of the reporting date, and fair value is determined through the use of models or other valuationmethodologies. The types of investments that would generally be included in this category include corporatebonds and loans, less liquid and restricted equity securities and certain over-the-counter derivatives.
• Level III – Pricing inputs are unobservable for the investment and include situations where there is little, if any,market activity for the investment. The inputs into the determination of fair value require significant managementjudgement or estimation. The types of investments that would generally be included in this category includeequity and/or debt securities issued by private entities.

J.P. MORGAN PRIVATE EQUITY LIMITED ANNUAL REPORT AND FINANCIAL STATEMENTS 2015 37
In certain cases, the inputs used to measure fair value may fall into different levels of the fair value hierarchy. In suchcases, an investment’s level within the above hierarchy is based on the lowest level of input that is significant to thefair value measurement. The Company’s assessment of the significance of a particular input to the fair valuemeasurement in its entirety requires judgement and considers factors specific to the investment.
(b) Loans and receivables
These assets are non-derivative financial assets with fixed or determinable payments that are not quoted in an activemarket. They principally comprise trade and other receivables. They are initially recognised at fair value plustransaction costs that are directly attributable to the acquisition, and subsequently carried at amortised cost usingthe effective interest rate method, less provision for impairment.
(c) Derivative financial instruments
Derivatives are initially recognised at fair value on the date that a derivative contract is entered into and aresubsequently re-measured at their fair values.
The Company’s derivative instruments do not qualify for hedge accounting. Changes in the fair value of any of thesederivative instruments are recognised immediately in the statement of comprehensive income within “Other netchanges in fair value on financial assets and financial liabilities at fair value through profit and loss” and “Realisedgains/(losses) on forward currency contracts”.
The Company’s derivative financial instruments comprise of foreign exchange forward contracts. The fair value ofthese instruments are based on their quoted price. If a quoted price is not available, then fair value is estimated bydiscounting the difference between the contractual forward price and the current forward price for the residualmaturity of the contract using a risk-free interest rate.
(d) De-recognition of financial assets
A financial asset (in whole or in part) is de-recognised either:
• When the Company has transferred substantially all the risk and rewards of ownership; or
• When it has neither transferred nor retained substantially all the risk and rewards and when it no longer hascontrol over the asset or a portion of the asset; or
• When the contractual right to receive cash flow has expired; or
• When the Company enters into transactions whereby it transfers assets recognised on its statement of financialposition, but retains either all or substantially all of the risks and rewards of the transferred assets or a portion ofthem. If all or substantially all risks and rewards are retained, then the transferred assets are not de-recognised.
(ii) Financial liabilities
The classification of financial liabilities at initial recognition depends on the purpose for which the financial liability wasissued and its characteristics. All financial liabilities are initially recognised at fair value net of transaction costs incurred.All purchases of financial liabilities are recorded on trade date, being the date on which the Company becomes party tothe contractual requirements of the financial liability. Unless otherwise indicated the carrying amounts of the Company’sfinancial liabilities approximate to their fair values.
(a) Financial liabilities measured at amortised cost
These include trade payables and other short-term monetary liabilities, loans and zero dividend preference shares whichare initially recognised at fair value and subsequently carried at amortised cost using the effective interest rate method.
(b) De-recognition of financial liabilities
A financial liability (in whole or in part) is de-recognised when the Company has extinguished its contractual obligations,it expires or is cancelled. Any gain or loss on de-recognition is taken to the statement of comprehensive income.
Cash and cash equivalents
Cash comprises deposits with banks. Cash equivalents are short-term highly liquid investments that are readily convertiblewithin a three month maturity period to known amounts of cash, are subject to an insignificant risk of changes in value andare held for the purpose of meeting short term cash commitments rather than for investment or other purposes.
38 J.P. MORGAN PRIVATE EQUITY LIMITED ANNUAL REPORT AND FINANCIAL STATEMENTS 2015
Notes to the Financial Statements continued
1. SIGNIFICANT ACCOUNTING POLICIES continued
Zero dividend preference shares
Zero dividend preference shares (“ZDP Shares”) are classified as a liability in the financial statements.
ZDP shares are initially recognised at their capital entitlement being fair value less issuance costs. Subsequent to the initialrecognition, ZDP Shares are carried at amortised cost using the effective interest rate method. Increases in the carrying valueof ZDP Shares due to accrued but unpaid interest are recognised in the statement of comprehensive income.
Costs incurred for the issuance of participating shares
Incremental external costs directly attributable to the equity transaction and costs associated with the establishment of theCompany that would otherwise have been avoided are written off against the share capital account.
Earnings per share
The Company presents basic and diluted earnings per Equity share data for its participating shares. Basic earnings per shareis calculated by dividing the profit or loss attributable to participating shareholders of the Company by the weighted averagenumber of participating shares outstanding during the year, adjusted for own shares held. Diluted earnings per share isdetermined by adjusting the profit or loss attributable to participating shareholders and the weighted average number ofparticipating shares outstanding, adjusted for own shares held, and for the effects of the dilutive potential participating sharesof the warrants outstanding. When the basic and diluted earnings per Equity share are the same, only the basic earnings pershare are reported.
Treasury shares
When share capital recognised as equity is repurchased, the amount of the consideration paid, which includes directlyattributable costs, is recognised as a deduction from the share capital account. Repurchased shares are classified as treasuryshares. When treasury shares are sold or reissued subsequently, the amount received is recognised as an increase in equity,and the resulting surplus or deficit on the transaction is presented in the share capital account.
Other net changes in fair value of financial assets and financial liabilities through profit or loss
“Other net changes in fair value of financial assets and financial liabilities at fair value through profit or loss” includes all realisedand unrealised fair value changes and foreign exchange differences, but excludes interest and dividend income. Net realisedgains on investments at fair value through profit or loss are recognised when the de-recognition criteria for financial assets aremet. Gain or loss is recognised when persuasive evidence exists, usually in the form of a sale agreement, that the significantrisks and rewards of ownership have transferred to the buyer, recovery of the consideration is probable, there is no continuingmanagement involvement with the investment, and the amount of gain or loss can be measured reliably.
Dividend and other distribution income
Dividend and other distribution income is measured at the fair value of the consideration received or receivable. Dividends andother distribution income is recognised when persuasive evidence exists, usually in the form of a dividend or distribution noticethat payment will be made, and the amount of the dividend or distribution can be measured reliably.
Interest
Interest income and expense is recognised in the statement of comprehensive income as it accrues using the original effectiveinterest rate of the instrument calculated at the acquisition or origination date.
Expenses
Expenses are recognised on an accruals basis in the statement of comprehensive income.
Segmental information
The Board of Directors has considered the requirements of IFRS 8 – “Operating Segments”. The Board of Directors is of theview that the Company is engaged in a single segment of business, being Private Equity. The Board of Directors, as a whole,has been determined as constituting the chief operating decision maker of the Company.
Five shareholders hold greater than 10% of the total number of US$ Equity Shares in issue. The holdings are displayed under“Substantial Interests” in the Directors’ Report.

J.P. MORGAN PRIVATE EQUITY LIMITED ANNUAL REPORT AND FINANCIAL STATEMENTS 2015 39
The Board is charged with setting the Company’s investment strategy in accordance with the Company’s prospectus, dated16 August 2011. They have delegated the day-to-day implementation of this strategy to the Managers but retain responsibilityto ensure that adequate resources of the Company are directed in accordance with their decisions. The Managers have beengiven full authority to act on behalf of the Company in the management of the Company’s assets in accordance with theAmended and Restated Investment Management Agreement on behalf of the Company and to carry out other actions asappropriate to give effect thereto.
Whilst the Managers may take investment decisions on a day-to-day basis regarding the allocation of funds to differentinvestments, any changes to the investment strategy or major allocation decisions have to be approved by the Board ofDirectors, even though they may be proposed by the Managers. The Board of Directors therefore retain full responsibility asto the major allocation decisions made on an ongoing basis. The Managers will act under the terms of the Amended andRestated Investment Management Agreement which cannot be changed without the approval of the parties to the agreement.
The key measure of performance used by the Board of Directors to assess the Company’s performance and to allocateresources is the Net Asset Value which is prepared on a monthly basis by Augentius (Guernsey) Limited (the “Administrator”).The NAV reported by the Administrator is prepared on a basis consistent with International Financial Reporting Standards.
The Company’s investments held as of the year end and their geographical areas are presented in the table below. TheCompany does not hold any non-current assets other than financial assets at fair value through profit or loss.
2015 2014
Region $’000 % $’000 %
Europe 243,690 46% 283,467 54%
North America 193,587 36% 143,885 28%
Asia 77,835 15% 73,457 14%
Other 17,990 3% 20,070 4%
Total 533,102 100% 520,879 100%
Foreign Exchange
Functional and presentation currency
The Board of Directors has resolved that the financial statements of the Company be presented in the US Dollar. The Boardof Directors considers the US Dollar as the currency that most faithfully represents the economic effects of the underlyingtransactions, events and conditions. The financial statements are presented in the US Dollar, which is also the Company’sfunctional currency.
Foreign currency transactions are translated into the functional currency using the exchange rates prevailing at the dates ofthe transactions. Foreign currency assets and liabilities are translated into the functional currency using the exchange rateprevailing at the reporting date.
Foreign exchange gains and losses arising from translation are included in the statement of comprehensive income.
Foreign exchange gains and losses relating to cash and cash equivalents are presented in the statement of comprehensiveincome within “Net foreign exchange gain/(loss)”.
Foreign exchange gains and losses relating to the financial assets and liabilities carried at fair value through profit or loss arepresented in the statement of comprehensive income within “Other net changes in fair value of financial assets and financialliabilities at fair value through profit or loss”.
Taxation
The Company falls under the Zero-Ten Guernsey tax regime and has its investment income assessed for tax at a taxable rateof 0%.
Offsetting
Financial instruments are offset and the net amounts reported in the statement of financial position only when there is currentlya legally enforceable right to offset the recognised amounts and there is an intention to settle on a net basis, or realise theassets and settle the liability simultaneously.

40 J.P. MORGAN PRIVATE EQUITY LIMITED ANNUAL REPORT AND FINANCIAL STATEMENTS 2015
Notes to the Financial Statements continued
2. KEY ESTIMATES AND ASSUMPTIONS
Estimates and judgements used in preparing the financial information are continually evaluated and are based on historicalexperience and other factors, including expectations of future events that are believed to be reasonable. The resultingestimates will, by definition, seldom equal the related actual results.
The only estimates and assumptions that have a significant risk of causing a material adjustment to the carrying amounts ofassets and liabilities relate to the valuation of unquoted investments.
Valuation of investments
The Company has interests in various different types of investments including: investments in subsidiaries, investments inunquoted funds, direct investments in unquoted companies, direct investments in public companies and investments in debtsecurities.
Investments in subsidiaries
Investments in subsidiaries are valued on the latest available net asset values of the subsidiaries. The Company reviews thenet asset values and considers the liquidity of the subsidiaries or its underlying investments, value date of the net asset valuesand any restrictions on dividends from the subsidiaries. If necessary, the Company makes adjustments to net asset values ofthe subsidiaries to obtain the best estimate of its fair value.
Investments in unquoted funds
The investments in unquoted funds are valued in accordance with IPEVCG as set out in financial assets policy above.Investments in private equity funds do not have a readily available market and are generally valued based on the fair value ofeach private equity fund as reported by the respective general partner as per the capital statement, which necessarilyincorporates estimates made by those general partners. The Company believes that this value, in most cases, represents fairvalue as of the relevant statement date, although, if other factors lead the Company to conclude that the value provided bythe general partner does not represent fair value, the Directors and Managers will adjust the value of the investment from thegeneral partner’s estimate. The Company estimates fair value based on publicly available information and the most recentfinancial information provided by the general partners, as adjusted for cash flows since the date of the most recent financialinformation.
Where no valuation is available from the general partner or an independent valuation agent, the Directors and Managers willestimate the fair value in accordance with IPEVCG. The public equity securities known to be owned within the purchasedprivate equity fund are based on the most recent information reported to the Company by the general partners.
Where such securities have publically available stock prices, these are adjusted by applying the appropriate discount to reflectlimited marketability and illiquidity.
Direct investments in unquoted companies
Direct investments in unquoted investments are generally valued based on the fair value of each investment as reported bythe respective management.
Direct investments in unquoted investments where no fair value is being provided to the Company by the management orsponsor are carried at fair value, as estimated by the Directors and Managers. In estimating fair value, the Directors andManagers also consider the value assigned to each investment by the lead investor (if any) with which the Company hasco-invested, to the extent known.
The Directors and Managers also consider the estimated fair value based on the projected enterprise value at which theunderlying company could be sold in an orderly disposition over a reasonable period of time and in a transaction betweenwilling parties other than in a forced sale or liquidation. In these instances, market multiples considering specified financialmeasures (such as EBITDA, adjusted EBITDA, cash flow, net income, revenues or NAV) and/or a discounted cash flow orliquidation analysis can be used.
Consideration may also be given to such factors as the company’s historical and projected financial data, valuations given tocomparable companies, the size and scope of the company’s operations, the company’s strengths, weaknesses, applicablerestrictions on transfer, industry information and assumptions, general economic and market conditions and other factorsdeemed relevant. The Directors and Managers may also engage the services of a third party valuation firm to assist withvaluing the asset.

J.P. MORGAN PRIVATE EQUITY LIMITED ANNUAL REPORT AND FINANCIAL STATEMENTS 2015 41
The table below summarises only the valuation of direct investments in unquoted companies that are estimated by theDirectors and Managers and shows the effect of changing one or more of the assumptions behind the valuation techniquesadopted, based on reasonable possible alternative assumptions.
2015
ReasonableFair Value Valuation Unobservable Average possible shift +/- Change in
Description ($000’s) Technique Inputs Input (absolute value) Valuation +/-
Asia
Equity 5,236 Comparable EBITDA 6.9x +/- 5% 232,100/trading multiples (232,100)
North America
Equity 6,511 Comparable EBITDA 13.5x +/- 5% 416,074/trading multiples (416,074)
2014
ReasonableFair Value Valuation Unobservable Average possible shift +/- Change in
Description ($000’s) Technique Inputs Input (absolute value) Valuation +/-
Asia
Equity 19,994 Comparable EBITDA 8.6x +/- 5% 394,958/trading multiples (394,958)
North America
Equity 5,373 Comparable EBITDA 13.2x +/- 5% 235,596/trading multiples (241,684)
Investments in debt securities
Valuation techniques are used primarily to value debt securities and other debt instruments for which markets were or havebeen inactive during the financial year. Some of the inputs to these techniques may not be market observable and are thereforeestimated based on assumptions.
Direct investments in public companies
When valuing direct investments in public companies the Company uses the quoted market price at the reporting date.
Unconsolidated structured entities
The Company invests in certain investment funds which meet the definition of unconsolidated structured entities inaccordance with IFRS 12 ‘Disclosures of Interests in Other Entities’. The investment funds are primarily closed-ended privateequity limited partnerships or investment companies which invest in underlying companies for the purposes of capitalappreciation. These entities are generally financed through committed capital from limited partners or shareholders, with cashbeing drawn down for financing investment activity.
As at 30 June 2015, the Company’s maximum exposure to loss attributable to these entities comprises the current carryingvalue of the assets, along with the uncalled committed capital relating to those investments, as summarised below:
2015$’000
Financial assets at fair value through profit or loss 211,669
Uncalled commitments 44,336
Maximum loss exposure 256,005

42 J.P. MORGAN PRIVATE EQUITY LIMITED ANNUAL REPORT AND FINANCIAL STATEMENTS 2015
3. FINANCIAL INSTRUMENTS AND FINANCIAL RISK MANAGEMENT OBJECTIVES
Introduction and overview
The following table details the categories of financial assets and liabilities held by the Company at the reporting date:
2015 2014$’000 $’000
Assets
Financial assets at fair value through profit or loss:
Financial assets designated at fair value through profit or loss upon initial recognition:
– Investment portfolio 533,102 484,291
– Non-current assets held for sale – 36,588
Held for trading:
– Derivative financial instruments 5,334 –
Cash and receivables 23,235 28,583
Total financial assets 561,671 549,462
Liabilities
Financial liabilities at fair value through profit or loss:
Held for trading:
– Derivative financial instruments – (1,023)
Financial liabilities measured at amortised cost (133,120) (154,701)
Total financial liabilities (133,120) (155,724)
This note presents information about the Company’s exposure to each significant area of risk arising from holding financialinstruments, the Company’s objectives, policies and processes for measuring and managing risk, and the Company’smanagement of capital.
Risk management framework
The Company, its investments and the underlying portfolio companies are materially affected by a variety of conditions in theglobal financial markets and economic conditions throughout the world, including, but not limited to rising interest rates,inflation, business and consumer confidence, availability of credit, currency exchange rates and controls and changes in laws.These factors are outside the Company’s control and may affect the level and volatility of securities prices, the amount ofdistributions received from investments in the portfolio and the liquidity and the value of investments. The Company may beunable to mitigate its exposure to these conditions as efforts to manage its exposure may or may not be effective.
The primary investment objective is to achieve both short and long-term capital appreciation by investing in a well-diversifiedportfolio of private equity fund interests and direct investments primarily purchased in the secondary market. The Companyalso makes investments in individual companies by co-investing with private equity sponsors. While the Company intends tomake investments that will create long-term value for shareholders, the investments made may not appreciate in value and,in fact, may decline in value. Moreover, the Company’s historical financial performance, in particular its Net Asset Value, reflectsunrealised gains on investments as of applicable measurement dates which may never be realised due to many factors, someof which are not in the Company’s control, which may adversely affect the ultimate value realised from the Company’sinvestments. The success of any of the investments in the portfolio will depend upon:
• the quality of its management and the management of the portfolio companies in which it invests;
• its ability to select successfully investment opportunities;
• general economic conditions; and
• its ability to liquidate its investments.
The Company can offer no assurance that its investments will generate gains or income or that any gains or income that maybe generated on particular investments will be sufficient to offset any losses that may be sustained.
Notes to the Financial Statements continued
J.P. MORGAN PRIVATE EQUITY LIMITED ANNUAL REPORT AND FINANCIAL STATEMENTS 2015 43
The Company anticipates that the scope of risk management activities it undertakes will vary based on the level and volatilityof interest rates and public equity indexes, prevailing foreign currency exchange rates, the type of investments that are madeand other changing market conditions. The use of hedging transactions and other derivative instruments to reduce the effectsof a decline in the value of a position does not eliminate the possibility of fluctuations in the value of the position or preventlosses if the value of the position declines.
Market risk
Market risk embodies the potential for both gains and losses and includes currency risk, interest rate risk and price risk.
The private equity investments held through subsidiaries, private equity funds and direct private equity investments in theCompany’s portfolio may be materially affected by conditions in the global financial markets and economic conditions. Thecapital and credit markets have experienced unprecedented volatility and disruption over recent periods. Uncertainty createdby market and economic conditions and a tightening of credit could lead to declines in valuations of equity and debt securitieswithout regard to the underlying financial condition of the issuer in certain cases.
The global financial markets and economic conditions may become dislocated or deteriorate, due to a variety of factorsbeyond the control of the Company. The general partners of the funds held by the Company may face reduced opportunitiesto sell and realise value from their existing portfolio companies, and portfolio companies may employ substantial indebtednessthat may be difficult to extend or replace and which may magnify the impact of any valuation changes.
In addition, while difficult market conditions may increase opportunities to make certain distressed asset investments, suchconditions also increase the risk of default with respect to portfolio companies with debt investments. Such defaults wouldadversely affect the profitability and net asset values of the investment funds in the Company Portfolio, and consequently, theprofitability, Net Asset Value and share price of the Company. Furthermore, during periods of adverse economic conditions,the Company may have difficulty accessing financial markets, which could make it more difficult or impossible for theCompany to obtain funding for additional investments and harm its profitability, Net Asset Value and share price. Deterioratingconditions in the global financial markets, and actions by governments to address them, have created a great deal ofuncertainty for the asset management industry, which may adversely affect the Company’s investments, access to financing,competitive landscape and overall performance.
Management of market risks
The Company’s strategy on the management of market risk is driven by its investment objective. The primary investmentobjective is to achieve both short and long-term capital appreciation by investing in a well diversified portfolio of private equityfund interests and direct investments primarily purchased in the secondary market. The Company also makes investments inindividual companies by co-investing with private equity sponsors. These investments are generally illiquid and non-public,however the Company may at times invest in publicly listed securities. The Company’s market risks are managed on anongoing basis by the Managers and are discussed with the Board of Directors on a quarterly basis.
The Managers work to mitigate risk by building a diversified portfolio, focusing on achieving a balance across managers,investment styles, industrial sectors and geographical focus. The Managers will also seek to invest in funds created duringdifferent vintage years to dampen systemic economic conditions that may impact the private equity market in any given year.Details of the nature of the Company’s investment portfolio at the reporting date are disclosed in the Portfolio Review onpages 13 to 15.
The Managers invest on a highly selective basis and seek opportunities with high quality private equity investment firms thathave proven track records and capabilities. The Managers will validate a given firm’s underlying investment thesis and evaluateits ability to successfully invest in private equity prior to proceeding with any investment. In addition, the Company’s secondaryinvestment strategy enables the Managers to evaluate specific private equity assets.
This permits the Managers to diversify its portfolio at the company level as well as the fund manager level and to determinethat assets are purchased at valuations acceptable to the Managers. The Managers actively manage the investment portfolioby meeting with private equity sponsors to discuss current and prospective investments.

3. FINANCIAL INSTRUMENTS AND FINANCIAL RISK MANAGEMENT OBJECTIVEScontinued
Exposure to interest rate risk
The Company’s exposure to the risk of changes in interest rates relates primarily to cash and cash equivalents and floatingrate debt obligations. The Company has incurred, and expects to continue to incur, indebtedness to fund its liquidity needsand to potentially leverage certain investments. Due to the foregoing, the Company is, and believes that it will continue to be,exposed to risks associated with movements in prevailing interest rates. An increase in interest rates could make it moredifficult or expensive to obtain debt financing, could negatively impact the values of debt securities, and could decrease thereturns that investments generate or cause them to generate losses.
The Company is, and believes that it will continue to be, subject to additional risks associated with changes in prevailinginterest rates due to the fact that its capital is invested in underlying portfolio companies whose capital structures may havea significant degree of indebtedness. Investments in leveraged companies are inherently more sensitive to declines inrevenues, increases in expenses and interest rates and adverse economic, market and industry developments. A leveragedcompany’s income and net assets also tend to increase or decrease at a greater rate than would be the case if money hadnot been borrowed. As a result, the risk of loss associated with an investment in a leveraged company is generally greaterthan for companies with comparably less debt.
During the year the Company returned all borrowings outstanding from its $150 million secured credit facility, leaving a balanceof €NIL (2014: €15 million ($20.5 million)).This capital is a floating rate debt with the interest expenses incurred from this facilitybased on the US Dollar London Interbank Offer Rate (LIBOR) or Euro Interbank Offered Rate (EURIBOR) as applicable.
The majority of the Company’s assets are non-interest bearing, however the assets that do have interest rate exposure areprimarily related to investments in mezzanine and special situation private equity funds. In addition, excess cash held by theCompany may be invested in short-term fixed deposit accounts that are rolled over on a weekly basis and are impacted byinterest rate fluctuations as such giving the Company variable loans and cash deposits. The Company is therefore notsignificantly exposed to interest rate risk on its assets and liabilities.
The Company also maintains zero dividend preference shares (“ZDP Shares”) at a fixed rate, and is therefore not impacted byinterest rate fluctuations. The market value of the ZDP Shares from time to time will be affected by changes in general interestrates, with upward movements in interest rates likely to lead to reductions in the market value of the ZDP Shares.
Recourse on external borrowings will only be undertaken if the Directors and the Managers consider the prevailing interestrates favourable and that the terms and conditions attaching to such borrowings are acceptable, having regard to theinvestment objective and policy of the Company.
Such borrowings are also limited in size by the Company’s internal policies. On 5 September 2012, a shareholder resolutionwas passed amending the Company’s borrowing powers to 30% of Total Assets, as defined in the Company’s Articles ofIncorporation. The Company’s overall interest risks and day-to-day decision making are managed on an ongoing basis by theManagers in accordance with its internal policies. The Board of Directors are consulted on a quarterly basis, or more frequentlyas the case may be.
In respect of income-earning financial assets and interest-bearing financial liabilities, the following table classifies the financialassets and liabilities by fixed and variable rate instruments.
2015 2014$’000 $’000
Fixed rate instruments
Financial assets – debt securities 4,535 –
Financial liabilities – ZDP shares (131,668) (131,873)
(127,133) (131,873)
Variable rate instruments
Financial assets – cash and cash equivalents 20,547 25,410
Financial liabilities – loan balances – (21,568)
20,547 3,842
Total interest sensitivity gap (106,586) (128,031)
44 J.P. MORGAN PRIVATE EQUITY LIMITED ANNUAL REPORT AND FINANCIAL STATEMENTS 2015
Notes to the Financial Statements continued

An increase in 100 basis points in interest rates as at the reporting date would have increased shareholders equity by$205,470 (2014: $38,417). A decrease of 100 basis points would have had an equal but opposite effect. Moreover, theaverage outstanding loan and cash balances for the fiscal year ended 30 June 2015 may differ materially from the fiscal yearended 30 June 2014, which would impact the results of the sensitivity analysis.
Exposure to currency risk
Currency risk arises from the possibility that fluctuations in foreign currency exchange rates will affect the value of theCompany’s assets and liabilities, the Net Asset Value and the market price of the US$ Equity Shares. The Company’sfunctional currency is the US Dollar. As a result, foreign currency assets and liabilities will be translated to US Dollars. TheCompany maintains investments in Euros, Sterling, Australian Dollars, and other currencies, and may invest in financialinstruments and enter into transactions denominated in currencies other than US Dollars.
When valuing investments that are denominated in currencies other than the functional currency, the Company is required toconvert the values of such investments into its functional currency based on prevailing exchange rates as at the end of theapplicable accounting period. Changes in exchange rates between the functional currency and other currencies could lead tosignificant changes in the Net Asset Values that the Company reports from time to time and could subject such Net AssetValues to favourable or unfavourable fluctuations. Among the factors that may affect currency values are trade balances, levelsof short term interest rates, differences in relative values of similar assets in different currencies, long-term opportunities forinvestment and capital appreciation and political developments.
The Company currently has three currency hedges in place to partially mitigate fluctuations in its foreign exchange exposure.The Managers may engage in currency hedging to limit the Company’s exposure to currency fluctuations. Currency hedgingby the Managers may be by means of spot and forward currency contracts or options on such contracts or by using suchother derivative instruments as may be available and having the same or similar effect. To date, the Company has employedput options, spot and forward currency contracts.
During the year the Company realised a net foreign exchange gain of $10,912,179 (2014: $966,122). This was largely a resultof the currency hedges placed to mitigate the Company’s exposure to the Australian Dollar and Euro and realised currencygain on the disposal of investments.
The success of any hedging or other derivative transactions that the Company may enter into will generally depend on itsability to correctly predict market changes. As a result, while the Company may enter into such transactions for a particularclass of shares in order to reduce its exposure to currency fluctuations, unanticipated market changes may negatively affectthe outcome of such transactions. The Company is also subject to the risk that counterparties in any hedging or otherderivative transactions will be unable or unwilling to perform their obligations.
The Company’s counterparty risk has increased as credit and liquidity have become constrained in the global financialmarkets. There can be no assurance that currency hedging will be effective and that the Company’s financial condition will notbe adversely affected by fluctuations in currency exchange rates. Furthermore, if any of the Company’s counterparties wereto default on their obligations under derivative contracts, it could have a material adverse effect on the Company’s business,financial condition or results of operations. See discussion on credit risk for how the Company manages counterparty risk.
The Company’s underlying investments are denominated in Euros, Sterling, Australian Dollars, Swiss Francs, UAE Dirham andUS Dollars. Any distributions in respect of the ZDP Shares will be made in Sterling and the market prices and Net Asset Valuesof the ZDP Shares are reported in Sterling. Any distributions in respect of the US$ Equity Shares have been made in US Dollarsand the market prices and Net Asset Values of the US$ Equity Shares are reported in US Dollars.
The Managers consider currency risk when making investments into non-US Dollar denominated assets and monitor currencymovements on an on-going basis. The Managers discuss their policies with the Board of Directors on a quarterly basis andmay choose to alter its asset allocation or currency risk strategies as a result in their absolute discretion.
At the reporting date the carrying value of the Company’s financial assets and financial liabilities held in individual foreigncurrencies as a percentage of its net assets were as follows:
Currency 2015 2014
Euro 41% 31%
Sterling (26%) (24%)
Swiss Franc 5% 5%
UAE Dirham 2% 2%
Australian Dollar 7% 8%
29% 22%
J.P. MORGAN PRIVATE EQUITY LIMITED ANNUAL REPORT AND FINANCIAL STATEMENTS 2015 45

3. FINANCIAL INSTRUMENTS AND FINANCIAL RISK MANAGEMENT OBJECTIVEScontinued
Exposure to currency risk continued
The following table sets out the aforementioned total exposure to foreign currency risk and the net exposure to foreigncurrencies of the monetary assets and liabilities:
2015
Financial Financial Foreign exchange Net assets liabilities currency contracts exposure$’000 $’000 $’000 $’000
Euro 173,658 (82) 2,192 175,767
Sterling 15,700 (131,695) 3,096 (112,899)
Swiss Franc 19,896 – – 19,896
UAE Dirham 9,199 – – 9,199
Australian Dollar 30,186 – 46 30,232
2014
Financial Financial Foreign exchange Net assets liabilities currency contracts exposure$’000 $’000 $’000 $’000
Euro 213,045 (21,177) (747) 191,121
Sterling 39,011 (131,939) – (92,928)
Swiss Franc 18,949 – – 18,949
UAE Dirham 7,784 – – 7,784
Australian Dollar 45,217 – (276) 44,941
Amounts on the above table are based on the carrying value of monetary assets and liabilities and the underlying principalamount of forward currency contracts. Based on the standard deviation of currency fluctuations, the volatility of each currencyhas been assessed at the year end; had the reporting currency of each investment (where the functional currency is notUS Dollar) strengthened by the following amounts in relation to US Dollar, shown in the table below with all other variables heldconstant, shareholders’ equity would have decreased/(increased) by the amounts shown below:
Standard Deviation
2015 2014US Dollar % %
Euro 9.4 3.8
Sterling 7.0 3.4
Swiss Franc 9.7 4.3
Australian Dollar 7.8 9.2
2015 2014US Dollar $’000 $’000
Euro 16,522 7,263
Sterling (7,903) (3,160)
Swiss Franc 1,930 815
Australian Dollar 2,358 4,135
Total 12,907 9,053
The relevant weakening of the reporting currency against the above currencies would have resulted in an equal but oppositeeffect on shareholders’ equity by amounts shown above, on the basis that all other variables remain constant.
46 J.P. MORGAN PRIVATE EQUITY LIMITED ANNUAL REPORT AND FINANCIAL STATEMENTS 2015
Notes to the Financial Statements continued

J.P. MORGAN PRIVATE EQUITY LIMITED ANNUAL REPORT AND FINANCIAL STATEMENTS 2015 47
Exposure to other price risk
Other price risk is the risk that the value of the instrument will fluctuate as a result of changes in market prices (other thanthose arising from interest rate risk or currency risk), whether caused by factors specific to an individual investment, its issueror all factors affecting all instruments traded in that market. As the Company’s financial instruments are carried at fair valuewith fair value changes recognised in the statement of comprehensive income, all changes in market conditions will directlyaffect net gains on investments and Net Asset Value.
The valuation of unquoted investments depends upon a combination of market factors and the performance of the underlyingasset. The Company manages price risk by actively pursuing investment opportunities that are acquired at what the Managersbelieve to be relatively attractive purchase multiples and may therefore be less susceptible to negative fluctuations in fair valuecalculations. In addition, the Managers consult with a variety of other private equity investors and industry experts to betterascertain fair value pricing before proceeding with an investment, and may also refrain from making commitments to fundsthat are acquiring assets at relatively expensive valuations. Moreover, the Managers seek to maximise the diversification of itsportfolio by investment type, investment strategy, vintage year, geography, and industry in an effort to minimise the impact offluctuations in value of any single investment. The Managers monitor price risk and consult with the Board of Directors on aquarterly basis, or more frequently as the case may be.
The Company also has direct exposure to assets that are publicly traded on various equity markets. These represent 5.17%(2014: 10.45%) of the Company’s portfolio value as at 30 June 2015. Under IFRS, the Company is required to valueinvestments in traded securities at their fair value at the end of each accounting period, which could lead to significant changesin the Net Asset Values and results of operations of the Company.
At 30 June 2015, the impact on the Company’s net assets due to a change of 5% in the benchmark used to measure theperformance of the Company’s listed equity securities would be $1,378 million (2014: $2,672 million).
The impact on net assets of increasing/decreasing the unobservable inputs used in the Company’s valuation of directinvestments in unquoted companies where the value is estimated by the Directors and Manager is presented in note 2.
Credit risk
Credit risk is the risk that an issuer or counterparty will be unable or unwilling to meet a commitment that it has entered intowith the Company. The carrying amounts of financial assets best represent the maximum credit risk exposure at the reportingdate. This relates also to financial assets carried at amortised cost, as they have a short term to maturity.
At the reporting date, the Company’s financial assets exposed to credit risk amounted to the following:
2015 2014$’000 $’000
Derivative financial instruments 5,334 –
Cash and cash equivalents 20,547 25,410
Receivables 2,688 3,173
Debt securities 4,535 –
Total 33,104 28,583
In respect of credit risk arising from cash and cash equivalents and derivative financial instruments, the Company’s exposure tocredit risk arises from default of the counterparty with a maximum exposure equal to the carrying amounts of these instruments.In order to mitigate such risks substantially all of the Company’s cash and forward currency contracts are maintained with LloydsBank and ING Luxembourg SA. In addition, the Managers monitor the financial position of both banks on an ongoing basis byreviewing earnings releases. As at 30 June 2015, Moody’s has given the long term credit ratings for Lloyds Bank and ING Bankas A1. In the event that the credit quality of either bank deteriorates significantly, the Managers will move the cash holdings toanother bank. Substantially all of the cash assets of the Company are held by Lloyds Bank. Bankruptcy or insolvency of thecustodian may cause the Company’s rights with respect to securities held by the custodian to be delayed or limited. The Companymonitors its risk by monitoring the credit quality and financial position of the custodian the Company uses.
The Company is exposed to the risk of non-payment of debt securities or the interest due on loans given to the portfoliocompanies. No collateral is received from the underlying companies. For those assets that are not past due, it is believed that therisk of default is low, and the capital repayments and interest payments will be made in accordance with the agreed terms andconditions. No terms and conditions have been renegotiated.

3. FINANCIAL INSTRUMENTS AND FINANCIAL RISK MANAGEMENT OBJECTIVEScontinued
Credit risk continued
No financial assets were past due or impaired at 30 June 2015 or 30 June 2014.
The Company’s exposure to credit risk is managed on an ongoing basis by the Managers. The Company’s overall credit risk ismanaged on a quarterly basis by the Board of Directors.
Liquidity risk
The Company’s financial instruments primarily include investments in unlisted equity investments that are not publicly tradedand therefore may be illiquid. As a result the Company may not be able to liquidate some of its investments in theseinstruments at an amount close to their fair value should such liquidation be necessary to meet liquidity requirements, includingthe need to meet outstanding undrawn commitments and other obligations as and when these fall due.
The Company’s exposure to liquidity risk is actively managed and monitored on an ongoing basis by the Managers, and bythe Board of Directors on a quarterly basis. The Managers frequently consult with their underlying fund managers aboutupcoming capital requirements as well as potential exit and other monetisation events. Allocations to new investments takeinto consideration the near-term capital needs within the Company’s broader private equity portfolio. Where the Managersbelieve there may be upcoming liquidity requirements, they will take necessary action to ensure that adequate funds areavailable.
The Company’s liquidity may also be impacted by its existing tender offer facility. While any tender of shares is offered at theBoard of Director’s sole discretion, in the event that the facility is utilised, it may require the use of a material amount of excesscash that the Company may otherwise be able to invest in private equity or reduce outstanding indebtedness.
The Company has entered into a $150 million revolving loan facility agreement with Lloyds Bank which will provide theCompany with both short-term and long-term liquidity. Per the credit agreement, the Company and the lender monitor theloan covenants on a quarterly basis. As at 30 June 2015, the Company was in compliance with all such covenants. The loanwill mature in January 2018. The undrawn amount of the loan facility as of 30 June 2015 was $150,000,000 (2014:$129,463,500).
The Company also maintains cash and cash equivalents in excess of what the Managers believe will be required in the comingquarters. As at 30 June 2015 the Company held cash and cash equivalents of $20.55 million (2014: $25.41 million). TheManagers pursue an investment strategy with respect to all uninvested cash in the Company Portfolio that is designed tobalance the need for appropriate liquidity to meet its present and future private equity commitment obligations with the desireto increase the returns of the Company Portfolio.
The investment commitments presented in note 11 represent commitments to invest capital to underlying investments at suchtime as the managers of those assets request. The precise timing of future calls, and whether such calls will be made at all,is at the discretion of the investment managers of each individual asset within the investment portfolio.
The table below analyses the Company’s financial liabilities into relevant maturity groupings based on the remaining period atthe reporting date to the contractual maturity date. The amounts in the table are the contractual undiscounted cash flows.Balances due within 12 months equal their carrying balances, as the impact of discounting is not significant
2015
Carrying Contracted Less than 1 month to 3 months More thanamounts cash flows 1 month 3 months to 1 year 1 year
Financial liabilities $’000 $’000 $’000 $’000 $’000 $’000
Other payables 1,452 1,452 1,452 – – –
ZDP shares 131,668 143,117 – – 91,966 51,151
133,120 144,569 1,452 – 91,966 51,151
48 J.P. MORGAN PRIVATE EQUITY LIMITED ANNUAL REPORT AND FINANCIAL STATEMENTS 2015
Notes to the Financial Statements continued

2014
Carrying Contracted Less than 1 month to 3 months More thanamounts cash flows 1 month 3 months to 1 year 1 year
Financial liabilities $’000 $’000 $’000 $’000 $’000 $’000
Other payables 2,283 2,283 2,283 – – –
Derivative financial instruments 1,023 1,023 1,023 – – –
Loans 20,545 20,537 – – – 20,537
ZDP shares 131,873 155,857 – – – 155,857
155,724 179,700 3,306 – – 176,394
Other risks
The Company is exposed to various other risks with respect to its financial assets. A summary of these risks is as follows:
(a) Valuation risk
Valuations of the private equity investments incorporated in the Company’s reported Net Asset Value are made, in part,on valuation information provided by the managers of investments in the Company’s portfolio. If other factors lead theManagers to conclude that fair value provided by the underlying managers or general partners does not represent actualfair value, the Managers will adjust the value of the investment from the underlying managers and general partners’estimate.
(b) Reliance on Managers
Quality and execution of management is key to a successful business development. The Company will be relying on theManagers and their ability to evaluate investment opportunities and to further develop the Company’s investments. TheManagers exercise a central role in the investment decision process. Accordingly, the returns of the Company will primarilydepend on the performance and abilities of the Managers.
(c) Political and/or regulatory riskThe Net Asset Value of the Company’s assets may be affected by uncertainties such as international politicaldevelopments, changes in governmental policies, taxation, restrictions on foreign investment and currency repatriation,currency fluctuations and other developments in the laws and regulations of the countries in which the Company’s assetsare invested.
4. INTEREST AND DISTRIBUTION INCOME
The following table details the interest and other distribution income earned during the year:
2015 2014$’000 $’000
Interest income from cash and cash equivalents 92 42
Distributions from financial assets at fair value through profit or loss 5,103 6,515
5,195 6,557
5. LOAN INTEREST EXPENSE
The following table details the interest expense incurred during the year:
2015 2014$’000 $’000
Interest expense from financial liabilities at amortised cost 201 1,409
J.P. MORGAN PRIVATE EQUITY LIMITED ANNUAL REPORT AND FINANCIAL STATEMENTS 2015 49

50 J.P. MORGAN PRIVATE EQUITY LIMITED ANNUAL REPORT AND FINANCIAL STATEMENTS 2015
Notes to the Financial Statements continued
6. OTHER EXPENSES
The following table details the other expenses incurred during the year:
2015 2014$’000 $’000
Legal and professional fees 520 606
Travel expenses 189 171
Bank charges 1 1
Sundry expenses 2,791 2,743
3,501 3,521
7. OTHER NET CHANGES IN FAIR VALUE OF FINANCIAL ASSETS AND FINANCIALLIABILITIES AT FAIR VALUE THROUGH PROFIT OR LOSS
The following table summarises the gains/(losses) from financial assets and liabilities at fair value through profit or loss forthe year:
2015 2014$’000 $’000
Designated at fair value through profit or loss
Investment portfolio 27,932 38,711
Non-current assets held for sale – 3,296
Held for trading
Derivative financial instruments 6,357 (1,400)
Net gain from financial assets and liabilities at fair value through profit or loss 34,289 40,607
8. NET FOREIGN CURRENCY GAIN/(LOSS)
The following table details the unrealised foreign currency gains/(losses) during the year:
2015 2014$’000 $’000
Cash and cash equivalents (2,072) 427
ZDP shares 10,779 (13,875)
Lloyds loan – (2,389)
Other 1 (8)
8,708 (15,845)
9. RECEIVABLES
The following table details the receivables at the reporting date:
2015 2014$’000 $’000
Accrued distributions 1,297 2,358
Other receivables 1,391 815
2,688 3,173

J.P. MORGAN PRIVATE EQUITY LIMITED ANNUAL REPORT AND FINANCIAL STATEMENTS 2015 51
10. PAYABLES AND ACCRUALS
The following table details the payables and accruals at the reporting date:
2015 2014$’000 $’000
Administration fee (note 18) 56 302
Audit fee 262 262
Management fee (note 18) 928 909
Directors’ fees – 42
Accrued capital calls 88 696
Other fees 118 72
1,452 2,283
Maturity profile
Due within one year 1,452 2,283
11. FINANCIAL ASSETS AT FAIR VALUE THROUGH PROFIT OR LOSS
All investments are designated at fair value through profit or loss at initial recognition, therefore all gains and losses arise oninvestments designated at fair value through profit or loss. Given the nature of the Company’s investments the fair value lossesrecognised in these financial statements are not considered to be readily convertible to cash in full at the reporting date andtherefore the movements in these fair values are treated as unrealised.
Commitments
The Company has committed to invest in certain private equity funds and investments. Such commitments are payable upondemand at the request of the fund’s administrator or general partner. As of 30 June 2015, the Company held interests inprivate equity funds, including fund-of-funds, direct investments and publicly traded equity securities and had unfundedcommitments to private equity funds of $53.2 million (2014: $57.7 million) that may be called by the underlying limitedpartnerships. Approximately 90.32% of the Company’s unfunded commitments, or approximately $48.0 million, representsfunds with vintage years of 2008 and earlier and are unlikely to be called. In addition, the Company may make capitalcommitments to private equity funds in the future and may make purchases of existing private equity funds in the secondarymarket, many of which will be subject to additional funding requirements.
The Company may employ an over-commitment strategy when making investments in private equity funds in order tomaximise the amount of its capital that is invested at any given time. When an over-commitment strategy is employed, theaggregate amount of capital committed by the Company to private equity funds at a given time may exceed the aggregateamount of cash that the Company has available for immediate investment.
Because the managers of private equity funds will typically be permitted to make calls for capital contributions following theexpiration of a relatively short notice period, employing an over-commitment approach requires the Company to timeinvestments and manage available cash in a manner that allows the funding of its capital commitments when capital calls aremade. The Managers are primarily responsible for managing the Company’s cash and the timing of its investments. TheManagers take into account current cash balances and expected cash flows when planning investment and cashmanagement activities with the objective of seeking to ensure that the Company is able to honour its commitments to fundswhen they become due.
The Company believes it currently has sufficient liquidity to meet an over-commitment strategy.
In September 2014, the Company completed the sale for $36.6 million of selected non-core assets, Parallel Ventures LimitedPartnership and Parallel Private Equity Limited Partnership, (collectively the “Parallel Portfolio”) at a 3.75% discount to thesponsor’s reported Net Asset Value at 31 March 2014. The Parallel Portfolio was recognised in the comparatives for thesefinancial statements as ‘non-current assets held for sale’, valued at the cash amount received from the sale.

52 J.P. MORGAN PRIVATE EQUITY LIMITED ANNUAL REPORT AND FINANCIAL STATEMENTS 2015
Notes to the Financial Statements continued
11. FINANCIAL ASSETS AT FAIR VALUE THROUGH PROFIT OR LOSS continuedCommitments continued
The following table is an analysis of the investment portfolio and non-current assets held for sale disclosing fair value balancesand fair value movements of the investments:
2015 2014$’000 $’000
Fair value at the beginning of the year 520,879 533,935
Purchase of investment and funding of capital calls 138,239 126,673
Distributions from limited partnership interests and proceeds from disposal of investments (153,948) (181,736)
Net fair value movement in the year (including foreign exchange gains and losses) 27,932 42,007
Fair value at the end of the year 533,102 520,879
Reconciliation of accumulated unrealised movements
Accumulated unrealised losses at beginning of the year (121,967) (84,629)
Net unrealised gains/(losses) in the year (including foreign exchange gains and losses) 22,386 (37,338)
Accumulated unrealised losses at the end of the year (99,581) (121,967)
Details of underlying investments are presented in the supplementary schedule of investments in note 23.
The following tables summarises the valuation of the Company’s financial assets and liabilities measured at fair value by thefair value hierarchy as of 30 June 2015:
2015
Total Level I Level II Level III$’000 $’000 $’000 $’000
Financial assets designated at fair value through profit or loss:
– Investment portfolio 533,102 27,554 – 505,548
Held for trading:
– Derivative financial instruments 5,334 – 5,334 –
538,436 27,554 5,334 505,458
2014
Total Level I Level II Level III$’000 $’000 $’000 $’000
Financial assets designated at fair value through profit or loss:
– Investment portfolio 484,291 54,416 – 429,875
– Non-current assets held for sale 36,588 – – 36,588
520,879 54,416 – 466,463
Financial liabilities designated at fair value through profit or loss:
– Derivative financial instruments (1,023) – (1,023) –
519,855 54,416 (1,023) 466,463
Level I classification represents direct equity investments in public companies that trade actively on recognised stockexchanges.
Level II classification represents the Company’s forward currency contracts. The forward currency contracts are not traded inactive markets and their prices are not publicly available but are derived from underlying assets or elements that are publiclyavailable. These have been fair valued using observable forward exchange rates and interest rates corresponding to thematurity of the contract. The effects of non-observable inputs are not significant for forward currency contracts.

J.P. MORGAN PRIVATE EQUITY LIMITED ANNUAL REPORT AND FINANCIAL STATEMENTS 2015 53
Level III classification represents investments in unquoted funds, unquoted companies and debt securities.
Generally redemptions from the investments are not permitted unless agreed by the general partner of the investments andliquidity is available to the extent of distributable realised events.
Although such investments may be sold in a secondary market transaction, subject to meeting certain requirements of thegoverning documents of each investment, the secondary market is not active and individual transactions are not necessarilyobservable. It is therefore reasonably possible that if the Company were to sell an investment in the secondary market, thesale could occur at an amount different than the reported fair value, and the difference could be material. The Companyexpects to receive distributions from the investment as their underlying investments are sold. The timing of such liquidationsis uncertain.
Refer to note 2 on how the Company values these investments and the sensitivity of the fair value to changes in unobservableinputs. A sensitivity analysis has not been presented for investments in unquoted companies and funds where these are valuedbased on the fair values as reported by the respective management or general partners.
There have been no transfers between Levels I, II and III during the year.
The changes in the fair value of investments which the Company has classified as Level III are as follows:
2015 2014$’000 $’000
Fair value at beginning of the year 466,463 530,001
Purchase of investment and funding of capital calls 132,906 57,294
Distributions from limited partnership interests (118,956) (164,914)
Net fair value movement in the year (including foreign exchange gains and losses) 25,135 44,082
Fair value at the end of the year 505,548 466,463
The Level III portfolio gains and losses included in profit or loss for the year ended 30 June 2015 are as follows:
2015 2014$’000 $’000
Reconciliation of accumulated unrealised movements
Accumulated unrealised losses at beginning of the year (111,282) (75,222)
Net unrealised gains/(losses) in the year (including foreign exchange gains and losses) 24,197 (36,606)
Accumulated unrealised losses at the end of the year (87,632) (111,828)
Total realised and unrealised gains and losses recorded for Level III investments, if any, are reported in “Other net changes infair value of financial assets and financial liabilities at fair value through profit or loss” in the statement of comprehensiveincome.
The following table summarises within the fair value hierarchy the Company’s assets and liabilities not measured at fair valuebut for which fair value is disclosed:
2015
Total Level I Level II Level III$’000 $’000 $’000 $’000
Assets
Other receivables 2,688 – 2,688 –
Cash and cash equivalents 20,547 20,547 – –
Total financial assets at fair value 23,235 20,547 2,688 –
Liabilities
Zero dividend preference shares (131,668) – (131,668) –
Other payables, accrued expenses and otherfinancial liabilities (1,452) – (1,452) –
Total financial liabilities at fair value (133,120) – (133,120) –
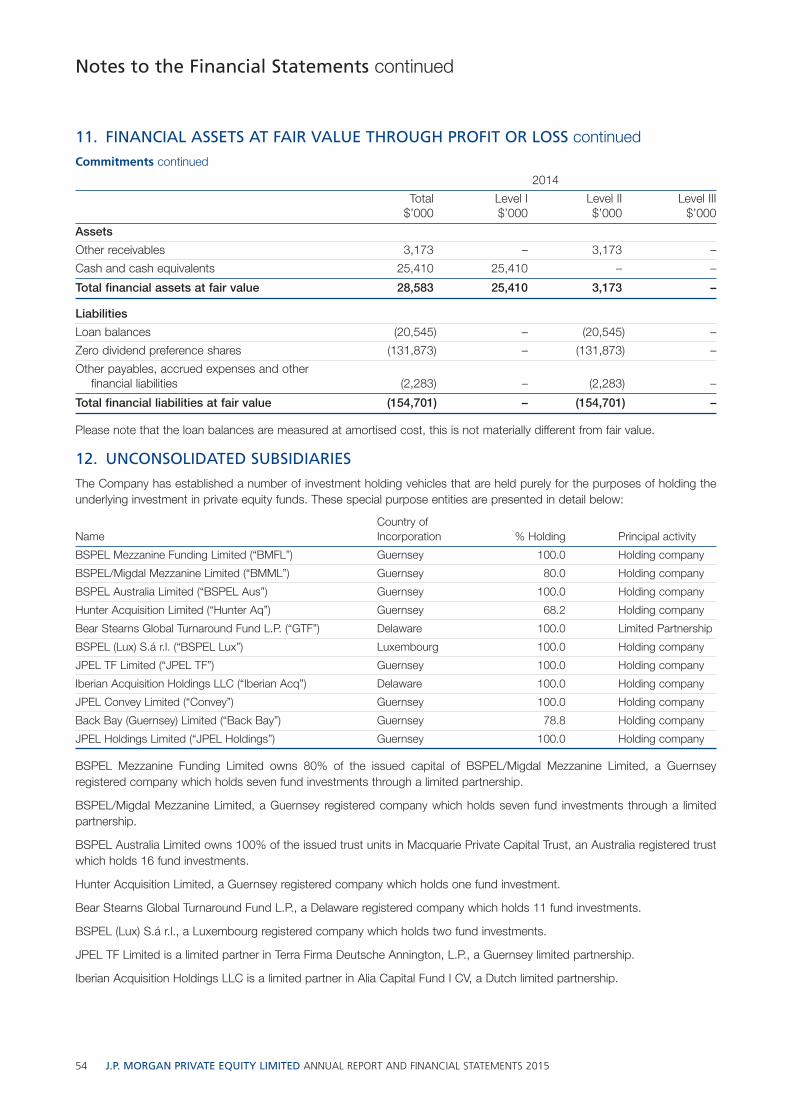
54 J.P. MORGAN PRIVATE EQUITY LIMITED ANNUAL REPORT AND FINANCIAL STATEMENTS 2015
Notes to the Financial Statements continued
11. FINANCIAL ASSETS AT FAIR VALUE THROUGH PROFIT OR LOSS continuedCommitments continued
2014
Total Level I Level II Level III$’000 $’000 $’000 $’000
Assets
Other receivables 3,173 – 3,173 –
Cash and cash equivalents 25,410 25,410 – –
Total financial assets at fair value 28,583 25,410 3,173 –
Liabilities
Loan balances (20,545) – (20,545) –
Zero dividend preference shares (131,873) – (131,873) –
Other payables, accrued expenses and otherfinancial liabilities (2,283) – (2,283) –
Total financial liabilities at fair value (154,701) – (154,701) –
Please note that the loan balances are measured at amortised cost, this is not materially different from fair value.
12. UNCONSOLIDATED SUBSIDIARIES
The Company has established a number of investment holding vehicles that are held purely for the purposes of holding theunderlying investment in private equity funds. These special purpose entities are presented in detail below:
Country ofName Incorporation % Holding Principal activity
BSPEL Mezzanine Funding Limited (“BMFL”) Guernsey 100.0 Holding company
BSPEL/Migdal Mezzanine Limited (“BMML”) Guernsey 80.0 Holding company
BSPEL Australia Limited (“BSPEL Aus”) Guernsey 100.0 Holding company
Hunter Acquisition Limited (“Hunter Aq”) Guernsey 68.2 Holding company
Bear Stearns Global Turnaround Fund L.P. (“GTF”) Delaware 100.0 Limited Partnership
BSPEL (Lux) S.á r.l. (“BSPEL Lux”) Luxembourg 100.0 Holding company
JPEL TF Limited (“JPEL TF”) Guernsey 100.0 Holding company
Iberian Acquisition Holdings LLC (“Iberian Acq”) Delaware 100.0 Holding company
JPEL Convey Limited (“Convey”) Guernsey 100.0 Holding company
Back Bay (Guernsey) Limited (“Back Bay”) Guernsey 78.8 Holding company
JPEL Holdings Limited (“JPEL Holdings”) Guernsey 100.0 Holding company
BSPEL Mezzanine Funding Limited owns 80% of the issued capital of BSPEL/Migdal Mezzanine Limited, a Guernseyregistered company which holds seven fund investments through a limited partnership.
BSPEL/Migdal Mezzanine Limited, a Guernsey registered company which holds seven fund investments through a limitedpartnership.
BSPEL Australia Limited owns 100% of the issued trust units in Macquarie Private Capital Trust, an Australia registered trustwhich holds 16 fund investments.
Hunter Acquisition Limited, a Guernsey registered company which holds one fund investment.
Bear Stearns Global Turnaround Fund L.P., a Delaware registered company which holds 11 fund investments.
BSPEL (Lux) S.á r.l., a Luxembourg registered company which holds two fund investments.
JPEL TF Limited is a limited partner in Terra Firma Deutsche Annington, L.P., a Guernsey limited partnership.
Iberian Acquisition Holdings LLC is a limited partner in Alia Capital Fund I CV, a Dutch limited partnership.

J.P. MORGAN PRIVATE EQUITY LIMITED ANNUAL REPORT AND FINANCIAL STATEMENTS 2015 55
JPEL Convey Limited owned a 35% interest in China Media Enterprises Limited, a limited liability BVI company, which wasrestructured in the prior year.
Back Bay (Guernsey) Limited, a Guernsey registered company which holds one fund investment.
JPEL Holdings Limited, a Guernsey registered company which holds 17 fund investments.
13. DERIVATIVE FINANCIAL INSTRUMENTS
The derivatives held are forward currency contracts.
Forward currency contracts are primarily used by the Company to hedge against foreign exchange rate risks on its non-USdollar dominated trading securities. The Company agrees to deliver a fixed quantity of foreign currency for an agreed uponprice on an agreed future date. Forward currency contracts are valued at the prevailing bid price at the reporting date. TheCompany recognises a gain or loss equal to the change in fair value at the reporting date.
The following forward currency contracts were outstanding as at the reporting date:
2015
Currency Currency Fair Currency amount sold Currency amount bought Settlement valuesold 000 bought 000 date $’000
AUD 15,000 USD 11,615 13 Jul 2015 46
EUR 110,000 USD 124,677 23 Jul 2015 2,192
USD 67,576 GBP 45,000 21 Oct 2015 3,096
5,334
2014
Currency Currency Fair Currency amount sold Currency amount bought Settlement valuesold 000 bought 000 date $’000
AUD 15,000 USD 13,875 7 Jul 2014 (276)
EUR 50,000 USD 67,709 17 Jul 2014 (747)
(1,023)
14. LOAN BALANCES
2015 2014$’000 $’000
Lloyds Bank – 20,545
Maturity profile
Due after more than one year – 20,545
The Company has entered into a multi-currency loan facility agreement with Lloyds Bank. The facility is for $150,000,000 andbears interest of US$ LIBOR/EURIBOR + 330 bps on drawn amounts with leverage of greater than 10% loan to value. At aleverage ratio of below 10%, the loan bears interest of US$ LIBOR/EURIBOR +285 bps. A flat 0.9% rate is paid on undrawnamounts.
The facility agreement was amended on 16 June 2014 and is due to expire 31 January 2018. The facility also contains anumber of covenants that restrict total leverage and promote asset diversification. Specifically, the Company has the ability toborrow up to 30% of its Total Assets. Furthermore, the asset base from which the Company may borrow funds may bereduced if certain diversity criteria are breached; including geography, investment strategy, investment type, and company andmanager concentration limitations. As at 30 June 2015, the Company’s leverage ratio was 0.3 per cent. per the creditagreement and the Company was in compliance with all of the diversification restrictions. The facility is undrawn at 30 June2015 as the Company paid off all the loans during the financial year (2014: €15,000,000 ($20,545,106)).

56 J.P. MORGAN PRIVATE EQUITY LIMITED ANNUAL REPORT AND FINANCIAL STATEMENTS 2015
Notes to the Financial Statements continued
15. ZERO DIVIDEND PREFERENCE SHARES
The Company has in issue two classes of zero dividend preference shares (“ZDP Shares”) as at the year end: 2015 ZDPShares ($89,374,460 (2014: $89,414,335)) and 2017 ZDP Shares ($42,293,498 (2014: $42,458,744)).
The holders of the 2015 ZDP Shares are entitled to a redemption amount of 48.75 pence per ZDP Share as increased dailyat such a daily compound rate as would give a final entitlement of 87.30 pence on 31 October 2015. The effective interestrate is 8.48% p.a. based on the placing price of 50 pence per ZDP Share. ZDP Shares rank prior to the US$ Equity Sharesin respect of the repayment of their entitlement of up to 87.30 pence per ZDP Share. However, they rank behind anyborrowings made by the Company that remain outstanding. They carry no entitlement to income and the whole of their returntakes the form of capital.
The holders of the 2017 ZDP Shares are entitled to a redemption amount of 65 pence per ZDP Share as increased daily atsuch a daily compound rate as would give a final entitlement of 107.13 pence on 31 October 2017. The effective interest rateis 8.14% p.a. based on the placing price of 65 pence per ZDP Share. ZDP Shares rank prior to the US$ Equity Shares inrespect of the repayment of their entitlement of up to 107.13 pence per ZDP Share and pari passu to the 2015 ZDP Sharesand 2015 ZDP Shares. However, they rank behind any borrowings made by the Company that remain outstanding. They carryno entitlement to income and the whole of their return takes the form of capital.
ZDP shareholders will not be entitled to receive any part of the revenue profits, including any accumulated revenue reservesof the Company on a winding-up.
The movement of the ZDP Shares in the year was as follows:
Number of 2015shares $’000
Balance at start of year 97,488,124 131,873
Interest accretion – 10,574
Unrealised foreign exchange movement – (10,779)
Balance at end of year 97,488,124 131,668
Number of 2014shares $’000
Balance at start of year 97,488,124 107,859
Interest accretion – 10,139
Unrealised foreign exchange movement – 13,875
Balance at end of year 97,488,124 131,873
ZDP 2015 SharesNumber of
Date shares
Balance at the beginning of the year 67,077,371
Balance at the end of the year 67,077,371
Issue date 19 December 2008
Valuation date 30 June 2015
Days from issue 2,384
Daily compound rate 0.0232434%
Initial price 48.75 pence
Price at valuation 84.84 pence

J.P. MORGAN PRIVATE EQUITY LIMITED ANNUAL REPORT AND FINANCIAL STATEMENTS 2015 57
ZDP 2017 SharesNumber of
Date shares
Balance at the beginning of the year 30,410,753
Balance at the end of the year 30,410,753
Issue date 12 September 2011
Valuation date 30 June 2015
Days from issue 1,387
Daily compound rate 0.0222971%
Initial price 65 pence
Price at valuation 88.55 pence
The interest charge accrued for the year on the ZDP Shares was $10,573,986 (2014: $10,139,086).
At 30 June 2015 the fair value of the 2015 ZDP Shares was $89,374,460 (2014: $96,080,033) and the fair value of the 2017ZDP Shares was $42,293,498 (2014: $49,736,007).
16. SHARE CAPITAL
Capital management
The Board’s policy is to maintain a strong capital base so as to maintain investor, creditor and market confidence and tosustain future development of the Company. The Company’s capital is represented by the share capital, zero dividendpreference shares (“ZDP Shares”), warrants on US$ Equity Shares and other reserves. The capital of the Company is managedin accordance with its investment policy, in pursuit of its investment objectives, both of which are detailed in the Overview &Strategy section and Investment Policy on pages 3 and 4. The Board of Directors also monitors the level of discount betweenthe market price of its US$ Equity Shares and the Company’s Net Asset Value per share.
The Company attempts to minimise any discount between the market price of its US$ Equity Shares and the Company’s NAVper share through open market purchases of shares at the discretion of the Directors. The Company may hold the acquiredshares in its treasury and may re-issue such shares to the market at the current prevailing NAV per share to avoid dilution ofexisting shareholders. At the Annual General Meeting of 20 December 2007, the shareholders entitled the Board of Directorsin accordance with the Companies (Purchase of Own shares) Ordinance, 1998, to make market purchases (within themeaning of section 5 of the said ordinance) of US$ Equity Shares and ZDP Shares of up to 14.99% of the issued shares. Atthe Annual General Meeting (AGM) held on 29 July 2015, the Directors’ authority to make such market purchases has beenrenewed for an additional year. The Directors at their sole discretion may accept redemption requests for up to 15% ofUS$ Equity Shares during each financial year.
The balance of shares held in treasury at the year end was 72,267,252 (2014: 66,267,252) US$ Equity and 2,344,176(2014: 2,344,176) 2015 ZDP Shares. At the year end no 2017 ZDP Shares were held in treasury (2014: NIL).
It is the intention of the Company to reduce the number of equity shares held in treasury to less than 10% of the total sharesby 30 June 2016.
There were no changes in the Company’s approach to capital management during the year.
Authorised share capital
The authorised share capital of the Company is £100 divided into 100 founder shares of £1 each, and an unlimited numberof redeemable participating preference shares of no par value each, which may be issued and designated as US$ EquityShares, GBP Equity Shares, EUR Equity Shares, ZDP Shares or any other shares (denominated in any currency) as may bedetermined by the Board of Directors from time to time in accordance with Article 3(4)(d) of the Company’s Articles ofAssociation.

58 J.P. MORGAN PRIVATE EQUITY LIMITED ANNUAL REPORT AND FINANCIAL STATEMENTS 2015
16. SHARE CAPITAL continued
Issued share capital
The movement of the US$ Equity Shares in the year was as follows:
NumberDate of shares Price ($)
Balance as at 30 June 2014 346,376,158
Warrants Exercised 26 August 2014 44,416 1.47
Share buyback 18 September 2014 (6,000,000) 0.79
Share buyback 22 October 2014 (1,600,000) 0.80
Share buyback 17 November 2014 (875,000) 0.80
Balance as at 30 June 2015 337,945,574
NumberDate of shares Price ($)
Balance as at 30 June 2013 346,376,158
Movement in period – –
Balance as at 30 June 2014 346,376,158
The US$ Equity Shares carry the right to receive all revenue profits of the Company (including accumulated revenue reserves)which are available for distribution and from time to time determined to be distributed by way of interim and/or final dividendsand at such times as the Directors may determine. On winding-up, equity shareholders will be entitled to the net assets of theCompany after any payables have been paid and the accrued entitlement of the ZDP Shares has been met. As at 30 June2015 the total share capital was $453,199,652 (2014: $459,877,476). Please refer to the Statement of Changes in Equity onpage 31 for details of the movements in share capital.
17. SHAREHOLDER WARRANTS
On 17 August 2009, the Company issued 58,075,764 shareholder warrants by way of a Bonus Issue on the basis of onewarrant for every six US$ Equity Shares held as at that date. Each Warrant conferred the right (but not the obligation) tosubscribe, for cash, for one US$ Equity Share at the Subscription Price on any Business Day during the period from 1 October2009 until 30 June 2014 (both dates inclusive), after which the Subscription Rights under the Warrants lapsed.
Each Warrant was capable of conversion into one US$ Equity Share upon exercise of the Subscription Right and on paymentof the Subscription Price as set out below.
Notice of the exercise of the Subscription Right may be given by warrant holders at any time from 1 October 2009 until30 June 2014 (both dates inclusive).
The Subscription Prices, which were determined by reference to the Net Asset Value of the Company as at 30 June 2009 were:
Date Subscription Noticereceived by the Company(inclusive) Relevant Subscription Price
1 October 2009 to 30 June 2010 US$1.35 (being a 1% premium to the NAV per US$ equity share as at 30 June 2009)
1 July 2010 to 30 June 2011 US$1.37 (being a 2% premium to the NAV per US$ equity share as at 30 June 2009)
1 July 2011 to 30 June 2012 US$1.39 (being a 4% premium to the NAV per US$ equity share as at 30 June 2009)
1 July 2012 to 30 June 2013 US$1.45 (being an 8% premium to the NAV per US$ equity share as at 30 June 2009)
1 July 2013 to 30 June 2014 US$1.47 (being a 10% premium to the NAV per US$ equity share as at 30 June 2009)
At 30 June 2014, the subscription rights of the shareholder warrants expired. The value attributed to the unexercisedshareholder warrants was transferred from share capital to reserves on expiry as shown in the Statement of Changes in Equityon page 31 of the financial statements. This is due to an amount of $7,231,000 which was previously credited to the sharecapital account on issue of these warrants, and this amount has now been reversed.
At 30 June 2015, there were no shareholder warrants remaining due to the expiry of the Subscription Rights on 30 June 2014.Following the expiration date of 30 June 2014, 44,416 warrants were exercised during the reporting period due to delay inobtaining confirmation from the participating warrant holder.
Notes to the Financial Statements continued

J.P. MORGAN PRIVATE EQUITY LIMITED ANNUAL REPORT AND FINANCIAL STATEMENTS 2015 59
18. MATERIAL AGREEMENTS
The Managers, Bear Stearns Asset Management Inc., J.P. Morgan Asset Management UK and JF International ManagementInc. are entitled to a base management fee, payable monthly in arrears of 1.0% per annum of the Company’s Total Assets.The management fee due for the year was $5,420,837 (2014: $5,524,925) and the amount payable at the end of the yearwas $928,477 (2014: $908,728).
The Managers are also entitled to a performance fee if the aggregate Net Asset Value of the US$ Equity Shares and theZDP Shares at the end of the performance period exceeds: (i) the aggregate Net Assets at the start of the performance periodby more than 8%; and (ii) the highest previously recorded aggregate Net Asset Value of Equity and ZDP Shares as at end ofperformance period of which performance fee was last paid.
The amount of such performance fee will be 7.5% of the total increase in aggregate Net Asset Value above the performancehurdle. The performance fee paid during the year was $NIL (2014: $NIL).
On 4 July 2012, HSBC Management (Guernsey) Limited resigned as administrator, effective no later than 1 October 2012.HSBC Management (Guernsey) Limited was entitled to an annual fee in respect of administration and company secretarialservices provided during the year before the date of resignation calculated on the Total Assets of the Company of 0.125% onthe first $100 million, 0.1% on the next $50 million, 0.08% on the next $50 million and 0.05% on the balance subject to aminimum of $125,000. The amount payable at the end of the year was $NIL (2014: $200,000).
On 8 August 2012, the Guernsey Financial Services Commission approved Augentius (Guernsey) Limited as administrator andcompany secretary. Augentius (Guernsey) Limited is entitled to an annual fee in respect of accounting, company secretarial,administration and investment tracking services calculated on a flat fee basis of $660,652 per annum. The fee is payablemonthly in arrears. Total fees for the year were $620,541 (2014: $253,367). In addition $67,783 (2014: $411,015) was inrelation to other administration fees included in other expenses in the statement of comprehensive income. At 30 June 2015$55,550 (2014: $101,945) was outstanding in respect of administration fees.
19. EARNINGS PER SHARE AND NET ASSET VALUE PER SHARE
Earnings per Share
Earnings per share is calculated by dividing the net profit for the year attributable to the US$ Equity Shares by the weightedaverage number of shares outstanding during the year. Net profit for the year was $41,490,164 (2014: $10,870,093). Theweighted average number of US$ Equity Shares in issue during the year was 340,065,951 (2014: 346,376,158).
Weighted average number of US$ Equity SharesIn thousands of shares Note 2015
Issued shares at 30 June 2014 16 346,376
Effect of shares issued/(bought back) on:
26 August 2014 16 38
18 September 2014 16 (4,701)
22 October 2014 16 (1,105)
17 November 2014 16 (542)
Weighted average number of US$ Equity Shares at 30 June 2015 340,065
Weighted average number of US$ Equity SharesIn thousands of shares Note 2014
Issued shares at 30 June 2013 16 346,376
Effect of shares issued/(bought back) on:
No movement in period –
Weighted average number of US$ Equity Shares at 30 June 2014 346,376
Net Asset Value per Share
Net Asset Value per share is calculated by dividing the Net Assets attributable to the US$ Equity Shares at the end ofthe year by the number of shares outstanding at the end of the year. The Net Asset Value for the year was $428,551,138(2014: $393,738,408). The total number of US$ Equity Shares outstanding at the end of the year was 337,945,574(2014: 346,376,158).
60 J.P. MORGAN PRIVATE EQUITY LIMITED ANNUAL REPORT AND FINANCIAL STATEMENTS 2015
Notes to the Financial Statements continued
20. RELATED PARTY TRANSACTIONS
JPMorgan Asset Management (UK) Limited, Bear Stearns Asset Management Inc. and JF International Management Inc. (the“Managers”) are all related parties of the Company.
Please refer to Note 18 for a breakdown of fees paid during the year.
Mr. Getschow is a senior executive of Bear Stearns Asset Management Inc, one of the Managers to the Company and asubsidiary of JPMorgan Chase & Co.
Other than Mr. Spencer who owns 30,067 US$ Equity Shares and Mr. Dalwood who owns 127,747 US$ Equity Shares, noother Director holds directly or indirectly shares in the Company.
Mr. Ash is entitled to receive Directors fees of £40,000 ($65,500) per annum, Mr. Loudon and Mr. Spencer are each entitledto receive Directors fees of £30,000 ($49,000) per annum. Mr. Getschow has waived his right to Directors Fees. Mr. Dalwoodis entitled to receive Directors fees of £30,000 ($49,000) per annum following the confirmation to increase the cap on totalDirectors remuneration in aggregate from £100,000 to £250,000 at the AGM held on 29 July 2015. Mr. Getschow has waivedhis right to Directors Fees.
21. ULTIMATE CONTROLLING PARTY
The company does not have an ultimate controlling party.
22. POST BALANCE SHEET EVENTS
Subsequent to the year end, but prior to the publication of this Annual Report, Deutsche Annington Immobilien Group wasrenamed to Vonovia SE.
Subsequent to the year end, but prior to the publication of this Annual Report, JPEL completed a $15 million investment inCorsicana Bedding Inc., a leading, low cost manufacturer of generic and private label mattresses and foundations (boxsprings) in the US.
Subsequent to the year end, but prior to the publication of this Annual Report, the JPEL Board has entered into discussionsto transition the existing investment management contract from J.P. Morgan Asset Management (“JPMAM”) to an affiliate ofFortress Investment Group LLC (“Fortress”) (the “Potential Transaction”). As part of the Potential Transaction, the investmentmanagement team that has been responsible for managing JPEL since its inception in 2005 led by Troy Duncan andGreg Getschow, would transition from JPMAM to the credit business of Fortress. The Potential Transaction is part of a broaderspin-out involving the investment management team led by Troy Duncan and Greg Getschow. Further information regardingthe Potential Transaction will be made available in due course if and as discussions proceed.
Fortress is a highly diversified global investment firm with $72.0 billion in assets under management as of 30 June 2015.Founded in 1998, Fortress manages assets on behalf of approximately 1,700 institutional clients and private investorsworldwide across a range of private equity, credit and real estate, liquid hedge funds and traditional asset managementstrategies. Fortress is publicly traded on the New York Stock Exchange (NYSE: FIG).
The Directors are not aware of any further post balance sheet events which require further disclosure in the financialstatements.

J.P. MORGAN PRIVATE EQUITY LIMITED ANNUAL REPORT AND FINANCIAL STATEMENTS 2015 61
23. SCHEDULE OF INVESTMENTS
2015 2014Vehicle Investment $’000 $’000
Back Bay Stoneleigh Back Bay Associates LLC 5,936 6,319
BMFL/BMML* BoS Mezzanine Partners, LP 39,757 43,496
BSPEL Aus Macquarie Private Capital Trust 30,097 45,216
BSPEL Lux Alto Capital II 856 2,175
BSPEL Lux Realza Capital Fondo, FCR 2,384 2,553
Convey** China Media Enterprises Limited – 19,994
Iberian Acq Alia Capital Fund I C.V. 5,466 1,203
JPEL 10th Lane Finance Co., LLC 6,016 6,304
JPEL Aksia Capital III 3,467 3,761
JPEL Apollo Investment Fund V, L.P. 183 504
JPEL Apollo Real Estate Investment Fund IV, L.P. 709 783
JPEL Ares European Real Estate Fund I (IF), L.P. 836 720
JPEL Argan Capital Fund 3,897 5,092
JPEL Arlington Capital Partners II, L.P. 1,269 1,326
JPEL Arrow Path Fund II, L.P. 2,080 1,718
JPEL Bain Capital Fund VI, L.P. – 9
JPEL BCP V Co-Investors (Cayman) L.P. 2,436 1,431
JPEL Beacon India Private Equity Fund 10,585 6,961
JPEL Bear Stearns Global Turnaround Fund LP 11,724 16,331
JPEL Black Diamond Capital Management 7,122 7,490
JPEL Blackstone Real Estate Partners IV, L.P. 1,213 1,569
JPEL Blue River Capital I, LLC 3,335 4,648
JPEL Candover 2001 Fund – 20
JPEL Candover 2005 Fund 1,801 2,283
JPEL Clearwater Capital Partners Fund I, L.P. 290 1,840
JPEL Clearwater Capital Partners Opportunities Fund (Cayman) Ltd. 28 228
JPEL Colony Investors VI, L.P. 175 132
JPEL CPC RD Investment LLC – 415
JPEL Deutsche Annington Immobilien Group 27,554 53,444
JPEL DFJ Esprit Capital III L.P. 3,844 3,666
JPEL Esprit Capital I Fund 3,851 4,396
JPEL Gemini Israel III, L.P. – 23
JPEL Global Buyout Fund, L.P. 5,811 5,512
JPEL Global Opportunistic Fund 3,998 3,952
JPEL Gridiron Capital Fund, L.P. 3,438 3,779
JPEL Guggenheim Aviation Offshore Investment Fund II, L.P. 295 5,309
JPEL Highstar Capital III Prism Fund, L.P. 4,552 3,955
JPEL Hupomone Capital Fund, L.P. 101 1,598
JPEL Hutton Collins Capital Partners II LP 805 1,281
JPEL Industry Ventures Fund IV, L.P 1,656 1,799
JPEL Industry Ventures Fund V, L.P 6,490 4,333
JPEL Leeds Equity Partners IV Co-Investment Fund A, L.P. – 973

62 J.P. MORGAN PRIVATE EQUITY LIMITED ANNUAL REPORT AND FINANCIAL STATEMENTS 2015
23. SCHEDULE OF INVESTMENTS continued
2015 2014Vehicle Investment $’000 $’000
JPEL Leeds Equity Partners IV, L.P. 1,993 5,609
JPEL Leeds Equity Partners V, L.P. 11,733 12,838
JPEL Liberty Partners II, L.P. 6,360 11,522
JPEL Life Sciences Holdings SPV I Fund, L.P. 36,437 19,380
JPEL Luxury Optical Holding Co. 6,511 4,958
JPEL Main Street Resources I, L.P. 598 243
JPEL Main Street Resources II, L.P. 884 1,653
JPEL Markstone Capital Partners, L.P. 308 2,649
JPEL Milestone 2010, L.P 11,126 10,109
JPEL Milestone Link Fund, L.P. 3,195 2,638
JPEL Montagu III L.P. 1 346
JPEL Morning Street Partners, L.P. 775 775
JPEL Omega Fund III, L.P. 7,722 7,041
JPEL Oxford Bioscience Partners IV, L.P. 175 298
JPEL Primopiso Acquisition S.a.r.l 19,746 25,150
JPEL Private Equity Access Fund II Ltd 2,552 2,610
JPEL Private Opportunity Ventures, L.P. 1,211 1,740
JPEL Quadrangle Capital Partners, L.P. 164 828
JPEL Strategic Value Global Opportunities Feeder Fund I-A, LP 477 1,676
JPEL Strategic Value Global Opportunities Master Fund, LP 599 2,393
JPEL SVE Star Ventures – 148
JPEL Terra Firma Deutsche Annington L.P. 3 –
JPEL Thomas H. Lee Equity Fund V, L.P. 22 584
JPEL Trumpet Feeder Ltd 1,437 1,208
JPEL Warburg Pincus Private Equity VIII, L.P. 1,748 2,970
JPEL Wellington Partners Ventures II GMBH & CO.KG (B) 894 1,228
JPEL Wellington Partners Ventures III Life Science Fund L.P. 2,445 2,765
JPEL Holdings Accela Investors, LLC 17,625 –
JPEL Holdings Accurate Result Investments Limited 5,236 –
JPEL Holdings Alliant Investor A, LLC 17,438 14,393
JPEL Holdings Aqua Resources Fund Limited 5,242 7,056
JPEL Holdings Britania Investments S.a.r.l – 3,276
JPEL Holdings Cavalier International SA 4,535 –
JPEL Holdings Fairfield L.P. 11,015 13,896
JPEL Holdings Gulf Healthcare International LLC 7,873 7,784
JPEL Holdings Identitag Secondary Opportunities S.A.R.L 19,765 18,949
JPEL Holdings Industry Ventures Fund VI, L.P. 2,342 2,380
JPEL Holdings MBI Holding, Inc. 18,392 –
JPEL Holdings Milestone Investisseurs 2014 SLP 17,383 –
JPEL Holdings MTS Celerion Holdings, LLC 21,683 –
JPEL Holdings Omega Fund IV, L.P. 2,186 1,181
Notes to the Financial Statements continued

J.P. MORGAN PRIVATE EQUITY LIMITED ANNUAL REPORT AND FINANCIAL STATEMENTS 2015 63
2015 2014Vehicle Investment $’000 $’000
JPEL Holdings*** Parallel Ventures Limited Partnership and Parallel Private Equity Limited Partnership – 36,588
JPEL Holdings Placid Holdings 29,199 13,471
JPEL Holdings Polo Holdings S.à.r.l. 6,013 –
JPEL Holdings Prosper Marketplace, Inc. 13,000 –
JPEL Holdings Yangzhou Ya Tai Property Limited 10,935 –
JPEL TF Terra Firma Deutsche Annington L.P. (JPEL TF Limited) 72 –
Total market value of Investments held by the Company 533,102 520,879
* The value attributed to BoS Mezzanine Partners, LP represents the valuation of JPEL’s interest in BMML. This comprises BoS Mezzanine Partners, LP,$36,764,585 (2014: $49,094,764) and net assets of $2,992,455 (2014: net liabilities of $5,598,269).
** In 2014, the Managers restructured the Company’s investment in China Media Enterprises Limited (“CME”). In particular, the Managers worked to mitigatethe Company’s exposure to the non-Hong Kong advertising operations. As part of this restructuring, the Company held an interest in CME’s Hong Kongadvertising operations as well as a separate investment in a large residential and commercial real estate development project in Yangzhou, China. TheCompany’s 30 June 2014 valuation reflects the combined interest of CME’s Hong Kong advertising operations as well as the value of the real estate assets.
*** In September 2014, The Company completed the sale for $36.6 million of selected non-core assets, Parallel Ventures Limited Partnership and Parallel PrivateEquity Limited Partnership, (collectively the “Parallel Portfolio”) at a 3.75% discount to the sponsor’s reported NAV at 31 March 2014. The sale pricerepresented an approximate 1.7% discount to the Company’s US$ carrying value as reported in the Company’s 31 May 2014 NAV or $617,282. The value ofthe Parallel Portfolio in the above table for the comparative period is based on the sale proceeds received by the Company.
Investment Vehicle Abbreviation
JPMorgan Private Equity Limited JPELBack Bay (Guernsey) Limited Back BayBSPEL Australia Limited BSPEL AusBSPEL (Lux) S.á r.l. BSPEL LuxBSPEL Mezzanine Funding Limited BMFLBSPEL/Migdal Mezzanine Limited BMML Iberian Acquisition Holdings LLC Iberian AcqJPEL Convey Limited ConveyJPEL Holdings Limited JPEL HoldingsJPEL TF Limited JPEL TF

64 J.P. MORGAN PRIVATE EQUITY LIMITED ANNUAL REPORT AND FINANCIAL STATEMENTS 2015
DIRECTORS:
Trevor Charles Ash (Chairman) Anthony DalwoodGregory GetschowJohn LoudonChristopher Paul Spencer
MANAGERS
(as to the Private Equity Portfolio):
Bear Stearns Asset Management Inc.c/o J.P. Morgan Asset Management 320 Park AvenueNew York, NY 10022 United States of America
JPMorgan Asset Management (UK) Limited60 Victoria EmbankmentLondon EC4Y 0JPUnited Kingdom
JF International Management IncChater House8 Connaught RoadHong Kong
ADMINISTRATOR ANDCOMPANY SECRETARY:
Augentius (Guernsey) LimitedCarinthia House9-12 The GrangeSt Peter PortGuernsey GY1 4BF
INDEPENDENT AUDITOR:
PricewaterhouseCoopers CI LLPRoyal Bank Place1 Glategny EsplanadeSt Peter PortGuernsey GY1 4ND
SOLICITORS
(as to English and US law):
Herbert Smith Freehills LLPExchange HousePrimrose StreetLondon EC2A 2HSUnited Kingdom
Akin Gump LLP (formerly Bingham McCutchen(London) LLP)41 LothburyLondon EC2R 7HFUnited Kingdom
LEGAL ADVISERS
(as to Guernsey Law):
Carey Olsen7 New StreetSt Peter PortGuernsey GY1 4BZ
REGISTRAR:
Capita IRG (CI) Limited2nd Floor1 Le TruchotSt Peter PortGuernsey GY1 4AE
REGISTERED OFFICE:
Carinthia House9-12 The GrangeSt Peter PortGuernsey GY1 4BF
Information about the Company

J.P.Morgan Private Equity LimitedCarinthia House9-12 The GrangeSt Peter PortGuernsey GY1 4BF