
J. Nutr.-1992-Brune-442-9.pdf
8
Human and Clinical Nutrition Iron Absorption from Bread in Humans: Inhibiting Effects of Cereal Fiber, Phytate and Inositol Phosphates with Different Numbers of Phosphate Groups1 MATS BRUNE, LENA ROSSANDER-HÃoeLTÉN,LEIF HALLBERG/ ANN GLEERÃoePAND ANN-SOFIE SANDBERG* Department of Medicine II and Clinical Nutrition, University of Göteborg, Sahlgrenska Hospital, and *Department of Food Science, Chalmers University of Technology, S-413 45 Göteborg,Sweden ABSTRACT Iron absorption was measured from five kinds of bread made from various types of flour and fermented in different ways in order to obtain a wide variation in the content of fiber, phytate (inositol hex- aphosphate) and its degradation products, inorganic phosphate and inositol phosphates with fewer numbers of phosphate groups (inositol pentaphosphate through monophosphate). Each experiment had 9-10 subjects and, in each subject, iron absorption was measured from control rolls made from low extraction wheat flour and one kind of test roll using two different radioiron tracers: 55pe and ^Fe. 7he inhibition of iron absorption was closely related to the content of phytate-phosphorous as determined using the AOAC method, and to the sum of the tri- through hexaphosphate groups as determined using the HPLC method. As an example, prolonged fer mentation of whole-rye bread reduced total inositol phosphates to the same amount as in the control rolls and increased fractional iron absorption to the same high level, in spite of a fiber content five times as great. The results strongly suggest that the inhibitory effect of bran on iron absorption is due to its content of phytate and other inositol phosphates present after fermenta tion, rather than to its content of fiber or other constitu ents. Thus, effective fermentation will increase the bio- availability of iron in whole-meal bread. J. Nutr. 122: 442-449, 1992. INDEXING KEY WORDS: •iron absorption •phytate •Inositol phosphates •fiber •humans The primary dietary factors determining the amount of iron absorbed in humans are the contents of heme and nonheme iron and the balance between factors influencing the bioavailability of nonheme iron in particular (1). Some dietary factors enhance iron absorption in humans, e.g., ascorbic acid and meat or fish, whereas others inhibit the absorption of nonheme iron, e.g., iron-binding phenolic compounds (2), calcium (3) and, notably, phytate (4). Bread is a staple food in many countries and is an important source of both iron and the inhibiting phy tate. The chemical composition of flour depends on the proportion of the cereal grain removed by the milling process. Low extraction white flour mainly originates from the endosperm, whereas flours with higher extraction also contain increasing amounts of bran. White flour has a low native iron content and is therefore enriched with iron in several countries. The higher the extraction of the flour, the higher the content of iron and phytate that originates from the bran. Iron absorption from bread baked from high ex traction flour is often poor in spite of its higher iron content. The lower absorption has been ascribed to its content of bran. The inhibitory effect of bran on iron absorption in humans has been clearly demonstrated using both the chemical balance method (5) and the extrinsic radioiron technique (6). However, the negative effect of bran on iron absorption is not seen in all species. Results from a careful comparative study (7) on humans and rats explain why the inhib itory effect of bran is not observed in a rat model (8, 9). Supported by grants from the Swedish Medical Research Council Project, B88 - 19X-04721-13B, the Swedish Council for Forestry and Agriculture Research, 864/86, 31:2 and 599-89L-135:2 and the Swedish Agency for Research Co-operation with De veloping Countries 9.49/SAREC 85/46:2. ^To whom correspondence and reprint requests should be ad dressed. 0022-3166/92 $3.00 ©1992 American Institute of Nutrition. Received 19 November 1990. Accepted 22 August 1991. 442 by guest on August 26, 2015 jn.nutrition.org Downloaded from
-
Upload
cristina-alexandra -
Category
Documents
-
view
232 -
download
3
Transcript of J. Nutr.-1992-Brune-442-9.pdf

Human and Clinical Nutrition
Iron Absorption from Bread in Humans: InhibitingEffects of Cereal Fiber, Phytate and InositolPhosphates with Different Numbers ofPhosphate Groups1
MATS BRUNE, LENA ROSSANDER-HÜLTÉN,LEIF HALLBERG/ANN GLEERÜPANDANN-SOFIE SANDBERG*
Department of Medicine II and Clinical Nutrition, University of Göteborg,Sahlgrenska Hospital, and *Department of Food Science,Chalmers University of Technology, S-413 45 Göteborg,Sweden
ABSTRACT Iron absorption was measured from fivekinds of bread made from various types of flour andfermented in different ways in order to obtain a widevariation in the content of fiber, phytate (inositol hex-aphosphate) and its degradation products, inorganicphosphate and inositol phosphates with fewer numbersof phosphate groups (inositol pentaphosphate throughmonophosphate). Each experiment had 9-10 subjectsand, in each subject, iron absorption was measured fromcontrol rolls made from low extraction wheat flour andone kind of test roll using two different radioiron tracers:55pe and ^Fe. 7he inhibition of iron absorption wasclosely related to the content of phytate-phosphorous asdetermined using the AOAC method, and to the sum ofthe tri- through hexaphosphate groups as determinedusing the HPLC method. As an example, prolonged fermentation of whole-rye bread reduced total inositolphosphates to the same amount as in the control rollsand increased fractional iron absorption to the samehigh level, in spite of a fiber content five times as great.The results strongly suggest that the inhibitory effect ofbran on iron absorption is due to its content of phytateand other inositol phosphates present after fermentation, rather than to its content of fiber or other constituents. Thus, effective fermentation will increase the bio-availability of iron in whole-meal bread. J. Nutr. 122:442-449, 1992.
INDEXING KEY WORDS:
•iron absorption •phytate•Inositol phosphates •fiber•humans
The primary dietary factors determining theamount of iron absorbed in humans are the contentsof heme and nonheme iron and the balance betweenfactors influencing the bioavailability of nonhemeiron in particular (1). Some dietary factors enhance
iron absorption in humans, e.g., ascorbic acid andmeat or fish, whereas others inhibit the absorption ofnonheme iron, e.g., iron-binding phenolic compounds(2), calcium (3) and, notably, phytate (4).
Bread is a staple food in many countries and is animportant source of both iron and the inhibiting phytate. The chemical composition of flour depends onthe proportion of the cereal grain removed by themilling process. Low extraction white flour mainlyoriginates from the endosperm, whereas flours withhigher extraction also contain increasing amounts ofbran. White flour has a low native iron content and istherefore enriched with iron in several countries. Thehigher the extraction of the flour, the higher thecontent of iron and phytate that originates from thebran.
Iron absorption from bread baked from high extraction flour is often poor in spite of its higher ironcontent. The lower absorption has been ascribed to itscontent of bran. The inhibitory effect of bran on ironabsorption in humans has been clearly demonstratedusing both the chemical balance method (5) and theextrinsic radioiron technique (6). However, thenegative effect of bran on iron absorption is not seenin all species. Results from a careful comparativestudy (7) on humans and rats explain why the inhibitory effect of bran is not observed in a rat model (8,9).
Supported by grants from the Swedish Medical ResearchCouncil Project, B88 - 19X-04721-13B, the Swedish Council forForestry and Agriculture Research, 864/86, 31:2 and 599-89L-135:2and the Swedish Agency for Research Co-operation with Developing Countries 9.49/SAREC 85/46:2.
^To whom correspondence and reprint requests should be ad
dressed.
0022-3166/92 $3.00 ©1992 American Institute of Nutrition. Received 19 November 1990. Accepted 22 August 1991.
442
by guest on August 26, 2015
jn.nutrition.orgD
ownloaded from

BREAD AND IRON ABSORPTION 443
It was suggested early that the inhibitory effect ofbran on iron absorption in humans was due to thephytate content of bran (5).This was not confirmed ina study comparing the effect on iron absorption ofnative bran and dephytinized bran (10). Thedephvtinization, however, was not complete in thatstudy. Further studies on the effect of removingphytate from bran (11) and studies showing that evensmall amounts of phytate have a marked inhibitoryeffect on iron absorption (4) may well explain whyseemingly contradictory results were obtained. Thereis thus much evidence that phytate is one of the keynutritional factors influencing the bioavailability ofdietary nonheme iron.
The high content of fiber in bran has also beensuggested as an explanation of its inhibitory effect onthe absorption of iron. This effect, however, has neverbeen established.
The content of phytate-P in flour can vary from afew milligrams to several hundred milligrams per 100g of flour (12). In unprocessed flours and bran theinositol phosphates occur mainly in the hexa-phosphate form (phytate) and to a small extent in thepentaphosphate form (13, 14). During bread fermentation these inositol phosphates are partly orcompletely degraded to inorganic phosphates and toinositol phosphates with fewer numbers of phosphategroups, mono- through pentaphosphate (14, 15). Thecontents of the different inositol phosphates remaining in bread after fermentation and bakingdepend on 1} the choice of cereal (e.g., wheat, rye,oats); 2) the extent of extraction during milling of thegrain; 3) the freshness of the flour (influencing thephytase activity); and 4} the techniques employedduring fermentation and baking (e.g., leavening time,temperature, amounts and properties of the yeastused).
It currently is possible to determine the inositolphosphates remaining in bread after fermentation andbaking by employing a recently described HPLCmethod (16, 17). Using this method, Larsson andSandberg (14) demonstrated that it is possible toreduce the phytate content of bread containing ryebran by 97% by means of rye sourdough fermentationor, in rye bread, by scalding with 70°Cwater and
adjusting the pH to 4.5 with lactic acid.In vitro studies suggest that inositol phosphates
with fewer numbers of phosphate groups (the tri-through pentaphosphate groups) may induce a smallerinhibition of iron absorption than inositol hex-aphosphate (16), and that complete reduction ofphytate by soaking, germination and fermentationleads to a marked increase in the bioavailability ofiron (14, 18). It is not known, however, to what extentdifferent inositol phosphates inhibit the absorption ofiron in humans and hence it is not known to whatextent variations in bread-making techniques mayinfluence iron absorption in humans.
The main purpose of the present study was todetermine the amount of different inositol phosphatesin bread prepared in different ways and to relate theseamounts to the bioavailability of iron in humans. Theuse of two readily measurable radioiron isotopesmakes it possible to compare iron absorption fromdifferently prepared breads by relating the absorptionin each subject to a standard white wheat bread withalmost no remaining inositol phosphates. Anotherpurpose of the study was to compare the amounts ofphytate in bread and flour as determined by theanion-exchange resin method (AOAC method) (19)and an HPLC method (16, 17) determining individualinositol phosphates in the triphosphate to hex-aphosphate range. Moreover, we examined the possibility of reducing the inhibiting effect of inositolphosphates on the absorption of iron from bread bymore effective fermentation.
MATERIALS AND METHODS
Experimental design. Each experiment had 9-10subjects and iron absorption was measured in eachsubject using two different radioiron tracers, from onecontrol meal and one kind of test meal. Thus, eachsubject served as his or her own control. The controlmeal (two rolls), served in each experiment, consistedof white wheat bread, butter and water. The testmeals in the five experiments also consisted of tworolls, butter and water. The test rolls, however, weremade from different kinds of flours, or flour mixtures,and fermented in different ways in order to obtaindifferent contents of inositol phosphates. The controlrolls were prepared in a standardized way from lowextraction (55%) wheat flour to produce rolls with avery low content of inositol phosphate.
Test rolls and control rolls (a and b) were served onalternate mornings after an overnight fast on fourconsecutive days in the order abba or baab. The rollswere labeled with two different radioiron isotopes,55Fe and 59Fe.A blood sample was drawn 2 wk afterserving the last roll to determine the content of 55Feand 59Fe.The total retention of 59Fewas measured bywhole-body counting at the same time. The totalretention of 55Fewas calculated from the ratio of 55Feto 59Fein red cells. An oral reference dose (see below)was then given to the fasting subject and a seconddose was given on the following morning. The absorption of the reference doses were then measured bywhole-body counting 2 wk later (see the expression ofresults below). For a review of the extrinsic tagmethod, see reference (1).
Subjects. Forty-nine subjects, 20 men and 29women, participated in the five experiments. All subjects were healthy volunteers, aged 19-47 y, and eachgroup of 9-10 subjects included both men andwomen. Some of the subjects in each group were
by guest on August 26, 2015
jn.nutrition.orgD
ownloaded from

444 BRUNE ET AL.
TABLE 1
¡ronabsorption front different breads1
AbsorptionmeanvaluesExperimentalMeals2Control
rollsWholerye -fWControl
rollsWholewheat +WControl
rollsWheat85%extr.Control
rollsWholerye +WheatControl
rollsWheatbran + WNonheme
ironReferenceSubjects310[1M;9F(2)]10[7M(2);3F]9[1M;8F(3)]10[8M(2);2F(1)]85%
extraction10[3M(2);7F(2)]content4mg4.0(3.7)3.7(2.0)4.0(3.7)3.7(2.3)4.0(3.7)3.4(2.0)4.0(3.7)3.4(1.0)4.0(3.7)3.0Meal%18.818.219.815.622.28.916.26.128.03.8dose%33.233.227.827.837.437.425.025.042.042.0Individualabsorption0.61
±0.130.59±0.140.68±0.060.58±0.060.57±0.070.23±0.050.64±0.100.23±0.070.55±0.060.08±0.02ratios5%24.4
±5.223.6±5.627.2±2.423.2±2.422.8±2.89.2±2.025.6±4.09.2±2.822.0±2.43.2±0.8Mean
ofindividual
absorptiontestrolls:controlrollsn
OA + nnsÕ.Õ.7H iU.Uv)n
70 + nnuW.17 i\J.\JOnÃa
-u n(itU.07 IU.UAn
29 + nfisU.OZiXU.UOOÃo
-L nmi m \i.\>~
Values are means ±SEM,n - 9-10.2W - white wheat flour.^M - male and F - female subjects. Number in parentheses designates blood donors.*The amount of fortification iron in parentheses."The mean value of the individual absorption ratios (meal:reference dose) were multiplied by 40 to obtain the percentage absorption of iron
corresponding to a 40% reference dose absorption.
regular blood donors (Table 1), which provided areasonable range of intersubject variation in iron absorption. The volunteers were given oral and writteninformation about the aims and procedures of thestudy. The project was approved by the Ethical Committee of the Medical Faculty of the University ofGöteborg.
Meals, bread-making and labeling of meals. Eachcontrol or test meal consisted of two rolls made from80 g of unfortified flour or flour mixture. In all experiments the rolls were served with 20 g of butter and150 mL of water. The calculated energy content of themeals was 1.8 MJ. Iron as ferrous sulfate was added tothe dough of all rolls except the bran rolls, to obtain asimilar iron content in all rolls (Table 1).
Control rolls were made from 40 g of unfortifiedwhite wheat flour (55% extraction), yeast, sugar, tablesalt and water. The amounts of yeast, sugar and saltper kg of flour were 65 g, 35 g and 10 g, respectively.The dough was fermented for l h at 23'C. It was then
kneaded again and weighed amounts transferred tosmall aluminum forms, which were left standing for20 min for further fermentation. The bread was thenbaked at 250'C for 15 min.
In Experiment 1, test rolls were made from wholerye flour and low extraction (55%) wheat flour.Whole-meal rye (500 g), yeast (25 g) and water (750mL; 40"C) were mixed and left at 23'C for 48 h to
ferment. The sourdough formed was then mixed withyeast (40 g; dissolved in a small amount of water),white wheat flour (500 g), sugar (35 g) and table salt
(10 g). The dough was kneaded and fermented for 1 h.The rolls were then made in exactly the same way asthe control rolls.
In Experiment 2 test rolls were made from wholewheat flour and low extraction (55%) wheat flour.Whole wheat flour (500 g), yeast (25 g) and water (750mL; 40°C)were mixed and fermented for 48 h at23°C.The dough was then treated exactly as the rye
rolls in Experiment 1.In Experiment 3 test rolls were made from wheat
flour (85% extraction). The amounts and proportionsof flour, yeast, sugar, table salt and water were thesame as in the control rolls. The dough was fermented for l h at 23'C. The rolls were then made
exactly as the control rolls.In Experiment 4 test rolls were made from whole
rye flour and 85% extraction wheat flour. Whole ryeflour (500 g), yeast (25 g) and water (750 mL: 40°C)were mixed and fermented at 23 °Cfor 48 h. The
sourdough formed was then mixed with yeast (40 g;dissolved in a small amount of water), and 85% extraction wheat flour (500 g), sugar (35 g) and table salt(10 g). The dough was kneaded and then fermented foran additional 3 h at 23°C.The rolls were then made
exactly as the control rolls.In Experiment 5 test rolls were made from wheat
bran and low extraction (55%) wheat flour. Wheatflour (675 g) was mixed with wheat bran (325 g).Water, yeast, salt and sugar were added in the sameproportions as in the other experiments. The doughwas fermented for 1 h at 23°C.The rolls were then
by guest on August 26, 2015
jn.nutrition.orgD
ownloaded from

BREAD AND IRON ABSORPTION 445
made exactly as the control rolls. The bran used was aSwedish commercial wheat-bran product containing20% whole grain and a dietary fiber content of 50%.
In all studies, each meal was labeled with 46.2 kBqof 59Fe or 55Fe. High specific activity radioiron(Amersham International, Amersham, Buckinghamshire, U.K.) was added to the dough fluid as ferricchloride in 0.01 mol/L hydrochloric acid. In Experiments 1-4 the test rolls were labeled with 55Fe andthe control rolls with 59Fe, whereas in Experiment 5the control rolls were labeled with 55Fe and the testrolls with 59Fe.
Oral reference doses. A solution of 10 mL of 0.01mol/L hydrochloric acid containing 3 mg of Fe asFeS04 and 30 mg of ascorbic acid labeled with 59Fewas used as a reference in all studies. The 10-mL vialscontaining the Fe solution were rinsed twice withwater and this was also consumed. Each subjectreceived two reference doses on two consecutivemornings after an overnight fast. No food or drinkwas allowed for 3 h after the reference dose. Eachsubject received a total of 55.5 kBq of 59Fe.
Chemical measurements. Aliquots of rolls werefreeze-dried and ground to a powder in a porcelainmortar. Weighed amounts of this powder were analyzed for total iron (20) and phytic acid phosphorus.The latter analyses were made in duplicate using theAOAC method (19). In rolls with a low content ofphytate, 6 mL of the original HC1 extract was usedinstead of 1 mL (original method), and the amount ofNaOH-EDTA was increased proportionally. Thismodification markedly increased the lower limit ofdetection of phytate in the extract. The precision ofthe method and the recovery of added sodium phytatewere unchanged. Samples of flour and freeze-driedrolls were also analyzed by an HPLC method toidentify and quantify inositol tri-, tetra-, penta- andhexaphosphates (16, 17). Several complete analyseswere made from most samples (Table 2).
The AOAC and the HPLC methods were carefullycompared and proved to give the same results for puresodium phytate standards.
Total fiber content in the rolls was analyzed induplicate (21, 22).
iron absorption measurements. Relative absorption of 55Fe and 59Fe was calculated fromanalyses of blood samples. Absolute absorption of thetwo tracers was calculated from whole-body countingof 59Fe and the relative absorption of the two tracers.Analyses of 55Fe and 59Fe in blood were made by amodification of the method described by Eakins andBrown (23), using a liquid scintillation spectrometer(Tri-Carb, Packard Instruments, San Antonio, TX). Allprocedures and methods of calculation have beendescribed previously (24).
Expressing results of iron absorption measurements. The mean of the individual absorption ratios,test meal:control meal, is an expression of the dif
ference in iron bioavailability between the two meals.In the present experiments, a standardized controlmeal was served on alternate days with the test meal.In the presentation of the results, the mean of theindividual absorption ratios is considered to be themost accurate basis for comparisons between the different experiments.
The ratio of the absorption of nonheme iron from ameal and from a reference dose is an expression of thebioavailability of nonheme iron in the meal. In eachexperiment the mean value and the SEMof the individual absorption ratios (meal:reference dose) weremultiplied by 40 to obtain the percentage absorptionof iron that corresponds to a 40% reference doseabsorption. Absorption values adjusted to a 40% absorption from reference doses were chosen becausethey roughly correspond to the absorption expected insubjects who are borderline iron-deficient (25). Thisadjusted absorption value is the basis for comparisonsbetween the amounts of iron absorbed from differentmeals, served to different groups.
Statistical methods. All statistical analyses weremade using a Statview n computer program (AbacusConcepts, Berkeley, CA). For statistical comparisons,the mean and SEMof the individual absorption ratios(test meal:control meal) in each experiment wereused. The possible statistical significance of the difference between the mean absorption and 1 was ineach experiment examined by a t test.
RESULTS
Iron absorption experünents.In Experiment 1, ironabsorption from the rolls baked from whole rye flourand low extraction wheat flour was not statisticallydifferent from the absorption from the control rolls.The mean of the individual iron absorption ratios(test rolls:control rolls) was 0.94, (not significant)(Table 1). In Experiment 2, iron absorption from thewhole wheat rolls was lower than from the controlrolls. The difference was statistically significant (absorption ratio 0.79; P < 0.05). In Experiments 3-5 thedifferences between iron absorption from the testrolls and the control rolls were all statistically significant. The mean individual iron absorption ratios (testrollsrcontrol rolls) were 0.39 (P < 0.01), 0.32 (P < 0.01)and 0.13 (P < 0.01), respectively.
Analysis of phytate and inositol-phosphates.Values for the content of phytate (AOAC method) andinositol phosphates (sum of the tri-, tetra-, penta- andhexaphosphate groups; HPLC method) in the differentflours and rolls are given in Table 2. Using the HPLCmethod only inositol hexaphosphate and smallamounts of inositol pentaphosphate could be detectedin the flours and bran. In the rolls, after fermentationand baking, there were different amounts of variousinositol phosphates (the tri-, tetra-, penta- and hexaphosphate groups). The greatest reduction of inositol
by guest on August 26, 2015
jn.nutrition.orgD
ownloaded from
446 BRUNE ET AL.
TABLE 2
Amount of phytate-P (AOAC method) or inositol phosphates (HPLC method) in rolls prepared from different flours andfermented in different wavs1-'
SeriesType
offlourFermentationtimeAOAC-methodFlour,
mg P/80 gflowRolls,mgP/iollDifference,
ragHPLC-methodFlour,
samplesIP6,mg/80gIPS,mg/80gZ
IP, mg/80gRolls,samplesIP6,mgIPS,mgn>4,mgIP3,
mgSIP,mgDifference
(flour-rolls)EIP,mgFiber
content,g/rollAbsorption31Whole
rye+lowextractionwheatflour2
d + 1 h+20min955.789.3483.4
(2.77)6.0(0.24)89.430.21
(0.06)0.04(0.01)0.23(0.08)0.82
(0.19)1.3088.16.20.94
±0.052Whole
wheat+lowextractionwheatflour2
d + 1 h+20min1018.292.8492.9
(2.4)4.6(0.11)97.540.17
(0.04)0.14(0.01)0.26(0.04)1.64
(0.21)2.2195.35.20.79
±0.033Wheat85%
extraction1
h + 20min871572266.3
(2.2)3.4(0.12)69.733.95
(0.22)0.65(0.05)0.87(0.02)3.17
(0.40)8.6461.03.80.39
±0.024Whole
rye+85%extractionwheatflour2
d + 3 h+20min15734.1122.94137.1
(2.9)5.5(0.15)142.662.3
(0.36)2.6(0.19)14.9(0.83)10.9
(0.55)30.7111.99.90.32
±0.035Wheat
bran+lowextractionwheat
flour1
h + 20min3792271524334.4
(7.29)20.8(0.56)355.22156.6
(1.55)8.5(0.19)14.0(0.32)24.4
(1.2)203.5151.517.80.13
±0.02Control
rollsLow
extractionwheat(range)1
h + 20min14.2-12.35.5-6.55.8-8.087.0-S.50.4-0.57.6-9.3100.28-1.010.07-0.430.05-0.150-O.050.4-1.67.7-7.21.11.00
'Values are means (so).•Abbreviations used: IP, inositol phosphate; IP3, inositol triphosphate; IP4, inositol tetraphosphate; IPS, inositol pentaphosphate; IP6,
inositol hexaphosphate.3Values are means ±SEM,n - 9-10.
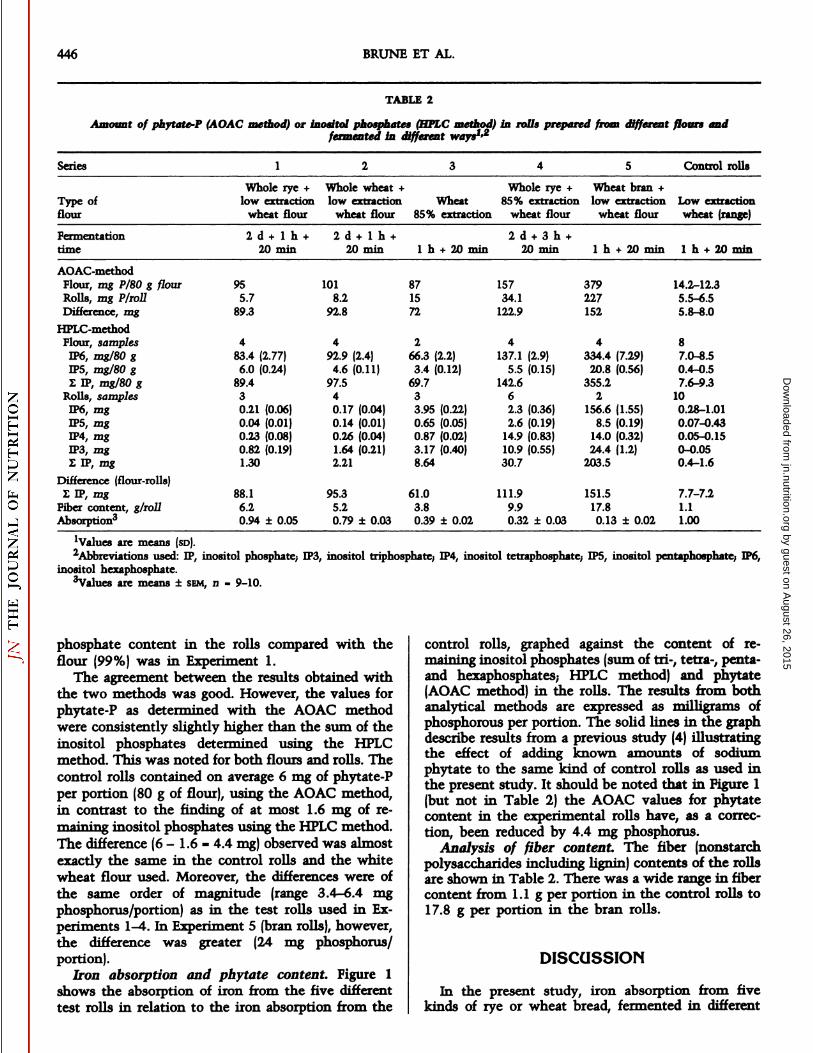
phosphate content in the rolls compared with theflour (99%) was in Experiment 1.
The agreement between the results obtained withthe two methods was good. However, the values forphytate-P as determined with the AOAC methodwere consistently slightly higher than the sum of theinositol phosphates determined using the HPLCmethod. This was noted for both flours and rolls. Thecontrol rolls contained on average 6 mg of phytate-Pper portion (80 g of flour), using the AOAC method,in contrast to the finding of at most 1.6 mg of remaining inositol phosphates using the HPLC method.The difference (6 - 1.6 = 4.4 mg) observed was almostexactly the same in the control rolls and the whitewheat flour used. Moreover, the differences were ofthe same order of magnitude (range 3.4-6.4 mgphosphorus/portion) as in the test rolls used in Experiments 1-4. In Experiment 5 (bran rolls), however,the difference was greater (24 mg phosphorus/portion).
Iron absorption and phytate content. Figure 1shows the absorption of iron from the five differenttest rolls in relation to the iron absorption from the
control rolls, graphed against the content of remaining inositol phosphates (sum of tri-, tetra-, penta-and hexaphosphates; HPLC method) and phytate(AOAC method) in the rolls. The results from bothanalytical methods are expressed as milligrams ofphosphorous per portion. The solid Unes in the graphdescribe results from a previous study (4) illustratingthe effect of adding known amounts of sodiumphytate to the same kind of control rolls as used inthe present study. It should be noted that in Figure 1(but not in Table 2) the AOAC values for phytatecontent in the experimental rolls have, as a correction, been reduced by 4.4 mg phosphorus.
Analysis of fiber content. The fiber (nonstarchpolysaccharides including lignin) contents of the rollsare shown in Table 2. There was a wide range in fibercontent from 1.1 g per portion in the control rolls to17.8 g per portion in the bran rolls.
DISCUSSION
In the present study, iron absorption from fivekinds of rye or wheat bread, fermented in different
by guest on August 26, 2015
jn.nutrition.orgD
ownloaded from

BREAD AND IRON ABSORPTION 447
1001
äS 80 H
co
o.o 60wa
I 40
« 20
•While wheat bread wilh added sodium phyialeo Remaining phytale in difieren) bread (AOAC method)A Remaining IP6-IP3 in dilferenl bread (HPLC method)
1 10 100 1000
Total amount of Inositol Phosphates ( mg P )
FIGURE 1 Iron absorption in relation to content of in-ositol phosphate in different types of bread. The relativeiron absorption is the ratio between test rolls and controlrolls x 100. The solid Unes represent the relationship observed in another study (4) in which sodium phytate wasadded to the same kind of control rolls. The AOAC valuesplotted have been reduced by 4.4 mg.
ways, was compared with iron absorption from whitewheat bread made from flour of very low extraction(55%). The aim of the different baking procedures andchoice of flours was to obtain a wide variation in thecontent of inositol-phosphates and fiber in the rolls(Table 2). Several unexpected observations were madein the experiments.
The first observation was the relationship betweenthe content of inositol phosphates in the different testrolls and the mean absorption ratio in the five experiments. In spite of the different fiber content and thedifferent kinds of flours used, there was a close relationship between the total content of those inositolphosphates that could be determined using the HPLCmethod (inositol tri-, tetra-, penta- and hex-aphosphates) and the inhibition of iron absorption asgraphed in Figure 1. The form of this graph with itsclear breakpoint has been discussed in a previouspaper (4). It is evident from the figure that there wasalso a close relationship between the content ofphytate-P as determined using the AOAC method andthe inhibition of iron absorption.
It is especially notable that iron absorption fromthe whole rye rolls (Experiment 1) was the same asfrom the white wheat control rolls (absorption ratio0.94 ±0.05). Evidently, it was possible, by sourdoughfermentation, to degrade the phytate almost completely in a bread baked from whole rye flour. Theinitial phytate content was great, but after fermentation the amounts of remaining inositol phosphates, and the effect on iron absorption, were notdifferent from those of the control rolls.
The iron absorption from the whole wheat bread(Experiment 2), fermented in the same way as thewhole rye bread, was also high (absorption ratio 0.79),but slightly lower than from the whole rye bread. Asshown in Table 2, the content of inositol phosphate,as analyzed with both analytical methods used,differed between the two kind of breads,- this fact mayexplain the observed difference in iron absorption.The cause of the difference in phytate content between the rye and the wheat bread may be the usuallyhigher phytase activity in rye flour (26).
The inhibition of iron absorption by adding sodiumphytate to wheat rolls observed in a previous study isgraphed in Figure 1 (4).As seen in the same graph, theextent of inhibition was about the same per milligramof phosphorus from the mixtures of various inositolphosphates in the presently used rolls. It should beemphasized that inositol triphosphate and inositoltetraphosphate constituted a considerable fraction ofthe total inositol phosphates in all breads (19-84%).The relationship between the inhibition of iron absorption and the content of inositol phosphate wouldhave been weak, if for example, only inositol hex-aphosphate and possibly inositol pentaphosphate actas inhibitors. An illustration of this is the bread bakedfrom whole rye flour and 85% extraction wheat flour(Experiment 4). The iron absorption from this breadwas reduced by -70%, in spite of the fact that therewas only 4.5 mg of inositol hexaphosphate and inositol pentaphosphate remaining after fermentationand baking. Our findings thus strongly suggest that allinositol phosphates, at least the inositol hex-aphosphates to inositol triphosphates analyzed, in relation to their phosphorus content, inhibit iron absorption to about the same extent.
The fiber content was quite high (6.2 g) in thewhole rye rolls. The control rolls, however, had a verylow fiber content (1.1 g). In spite of this difference, thefractional, as well as the absolute iron absorption, wasalmost identical. This finding indicates that the ryefibers per se had no inhibitory effect on iron absorption. In fact, in the present study there seems to be norelationship between the fiber content in rye or wheatrolls and the degree of inhibition of iron absorption(Table 2). This result is in accordance with earlierstudies in which completely dephytinized bran (11) orcellulose (27) have been found to have no effect oniron absorption.
Complex chemical processes take place duringsourdough fermentation and some of those may affectiron absorption. Still, the most likely explanation forthe increased bioavailability of iron observed is thedegradation of phytate, because there is a close inverse relationship between iron absorption and remaining inositol phosphates. It has previously beenshown that sourdough fermentation influencedneither the content of dietary fiber nor the distribution of soluble and insoluble fiber components (28).
by guest on August 26, 2015
jn.nutrition.orgD
ownloaded from

448 BRUNE ET AL.
Lactic acid is the main organic acid formed duringsourdough fermentation. No effect on iron absorptionwas seen when very large amounts of this acid wereadded to different meals (29, 30). Thus, the reductionof the inhibition of iron absorption observed in Experiments 1, 2 and 4 is not likely due to changes inthe fiber content or the formation of lactic acid duringprolonged fermentation.
From Table 2 it can be calculated that during thedegradation of phytate in the test rolls, rather largeamounts of inorganic phosphates were formed (about60-150 mg phosphorus/portion). These inorganicphosphates had no detectable inhibitory effect on theabsorption of iron, even in this sensitive experimentalmodel.
Taken together, the findings clearly indicate thatthe inhibition of iron absorption by wheat and ryebran could be ascribed to its content of phytate, orafter baking to its degradation products (inositol phosphates), and not to fiber components or other constituents of bran.
The AOAC method for phytate determination isbased on the separation of inorganic phosphates andphytate by means of an ion-exchange resin column.As can be seen in Table 2, the agreement between thevalues for phytate-P (AOAC method) and the sum ofthe tri-, tetra-, penta- and hexaphosphates (HPLCmethod) were good. This indicates that the AOACmethod determines not only phytate but also, at least,inositol tri-, tetra- and pentaphosphates.
However, slightly higher values for phytate-P wereconsistently found using the AOAC method compared with the sum of the tri-, tetra-, penta- andhexaphosphates obtained by the HPLC method (Table2). This difference is probably due to several factors.In bread, it is possible that some of the phosphorusdetermined using the AOAC method might actuallybe inositol mono- and diphosphates, which cannot bedetermined by the HPLC method. This contributionto the AOAC values is probably negligible in flourbecause inositol phosphates in flour occur almostexclusively as inositol pentaphosphates and inositolhexaphosphates (13, 14, 31).
A source of overestimation of the true content ofinositol phosphates using the AOAC method is that,besides inositol phosphates, certain other phosphateswill also be measured. This is the case withnucleotide-phosphorous compounds (31) andadenosine-triphosphate (unpublished observations).The consistent finding of small amounts of phytate-P(AOAC method) in the control rolls (Table 2) isprobably mainly due to such a systematic error. Thisconclusion is supported by the finding of negligibleamounts of inositol phosphate in the control rolls (upto 1.6 mg) using the HPLC method, and by the factthat even after prolonged and repeated fermentationthe content of phytate-P in the control rolls remainedunchanged (values not shown). Thus a phosphate-
containing fraction exists in the control rolls that isdetermined as phytate-P but is actually not inositolphosphate. As was pointed out in Results, thisfraction seems to be of the same order of magnitudein all test rolls except the bran rolls, hi Figure 1, theAOAC values for phytate-P content of all rolls havebeen arbitrarily reduced by 4.4 mg to correct for thissource of error.
One conclusion of the present comparisons between the two methods is that it is only at very lowinositol phosphate levels that the overestimation ofthe phytate values, using the AOAC method, is of anypractical significance. Knowledge of this source oferror, however, is important considering the significant inhibitory effect on iron absorption even of verysmall amounts of phytate (4). Moreover, it should beemphasized that very low phytate-P contents cannotbe detected using the original AOAC method, butonly by the presently used modification of themethod (see Materials and Methods).
The present findings have important nutritionalimplications. One is the demonstration that not onlyphytate inositol hexaphosphate, but also its inositolphosphate-degradation products, seem to be potentinhibitors of iron absorption. An even more practicalimplication is the finding that effective fermentationof whole-meal bread to very low inositol phosphatelevels will markedly improve the bioavailability ofiron and that the effect of fiber per se on iron absorption can be disregarded. Consequently, theamounts of iron absorbed from bread baked fromwhole wheat flour, with its high content of iron,would be greater than from white bread, provided thefermentation procedures are optimized.
It is well known that phytate interferes with theabsorption of other minerals, e.g., zinc and calcium. Itis possible that many of the findings and implicationsof the present study may also be valid for these elements.
LITERATURE CITED
1. Hallberg, L. (1981) Bioavailability of dietary iron in man.Annu. Rev. Nutr. 1: 123-147.
2. Brune, M., Rossander, L. &. Hallberg, L. (1989) Iron absorptionand phenolic compounds. Importance of different phenolicstructures. Eur. J. Clin. Nutr. 43: 547-558.
3. Hallberg, L., Brune, M., Erlandsson, M., Sandberg, A-S. &.Rossander, L. (1991) Calcium: effect of different amounts onnon-heme iron and heme-iron absorption in humans. Am. J.Clin. Nutr. 53: 112-119.
4. Hallberg, L., Brune, M. &. Rossander, L. (1989) Iron absorptionin man: ascorbic acid and dose-dependent inhibition by phytate. Am. J. Clin. Nutr. 49: 140-144.
5. Widdowson, E. M. &. McCance, R. A. (1942) Iron exchanges ofadults on white and brown bread. Lancet 1: 588-591.
6. Björn-Rasmussen, E. (1974) Iron absorption from wheat bread.Influence of various amounts of bran. Nutr. Metab. 16:101-110.
by guest on August 26, 2015
jn.nutrition.orgD
ownloaded from

BREAD AND IRON ABSORPTION 449
7. Reddy, M. B. & Cook, J. D. (1991) Assessment of dietarydeterminants of non-heme iron absorption in humans and rats.Am. J. Clin. Ñute. 54: 723-728.
8. Morris, E. R. &. Ellis, R. (1980) Bioavailability to rats of ironand zinc in wheat bran: response to low-phytate bran andeffect of the phytate:zinc molar ratio. J. Nutr. 110: 2000-2010.
9. Morris, E. R. & Ellis, R. (1976) Isolation of monoferric phytatefrom wheat bran and its biological value as an iron source tothe rat. J. Nutr. 106: 753-760.
10. Simpson, K. M., Morris, E. R. &. Cook, J. D. (1981) Theinhibitory effect of bran on iron absorption in man. Am. J.Clin. Nutr. 34: 1469-1478.
11. Hallberg, L., Rossander, L. & Skânberg,A-B. (1987) Phytatesand the inhibitory effect of bran on iron absorption in man.Am. J. Clin. Ñute. 45: 988-996.
12. Harland, B. F. & Oberleas, D. (1987) Phytate in foods. In: WorldReview of Nutrition and Dietetics, vol. 52, pp. 235-259.Karger, Basel, Switzerland.
13. Sandberg, A-S. &. Svanberg, U. (1991) Phytate hydrolysis byphytase in cereals, effects on in vitro estimation of iron availability. J. Food Sci. 56: 1330-1333.
14. Larsson, M. & Sandberg, A-S. (1991) Phytate reduction in breadcontaining oat flour, oat bran or rye bran. J. Cereal Sci. 14:141-149.
15. Nayini, N. R. & Markakis, P. (1983) Effect of fermentationtime on the inositol phosphates of bread. J. Food Sci. 48:262-263.
16. Sandberg, A-S., Carlsson, N-G. &. Svanberg, U. (1989) Effects ofinositol tri-, tetra-, penta-, and hexaphosphates on in vitroestimation of iron availability. J. Food Sci. 54: 159-162.
17. Sandberg, A-S. & Adherirme, R. (1986) HPLC method for determination of inositol tri-, tetra-, penta-, and hexaphosphates infoods and intestinal contents. J. Food Sci. 51: 547-550.
18. Svanberg, U. &. Sandberg, A-S. (1988) Improved iron availability in weaning foods using germination and fermentation.In: International Workshop on Household Level Technologiesfor Improving Young Child Feeding in Eastern and SouthernAfrica. (Alnwick, D., Moses, S. & Schmidt, O. G., eds.), pp.366-373. EDRC, Ottawa, Canada.
19. Harland, B. F. & Oberleas, D. (1986) Anion-exchange methodfor determination of phytate in foods: collaborative study. J.Assoc. Off. Anal. Chem. 69: 667-670.
20. Hallberg, L. (1980) Food iron absorption. In: Methods in Hema-
tology. (Cook, J. D., éd.),pp. 116-133. Churchill, London, U.K.21. Asp, N-G., Johansson, C-G., Siljestrom, M. &. Hallmer, H.
(1983). Rapid enzymatic assay of insoluble and soluble dietaryfibre. J. Agrie. Food Chem. 31: 476-482.
22. Prosky, L., Asp, N-G., Schweizer, T. F., deVries, J. W. &. Furda,I. (1988) Determination of total dietary fiber in foods and foodproducts: collaborative study. J. Assoc. Off. Anal. Chem. 68:677-679.
23. Eakins, J. D. &. Brown, D. A. (1966) An improved method forthe simultaneous determination of iron-55 and iron-59 inblood by liquid scintillâtion counting. Int. J. Appi. Radiât.Isot.17: 391-397.
24. Bjöm-Rasmussen, E., Hallberg, L., Magnusson, B., Rossander,L., Svanberg, B. & Arvidsson, B. (1976) Measurements of ironabsorption from composite meals. Am. J. Clin. Ñute. 29:772-778.
25. Magnusson, B., Björn-Rasmussen, E., Hallberg, L. & Rossander,L. (1981) Iron absorption in relation to iron status. Modelproposed to express results of food iron absorption measurements. Scand. J. Haematol. 27: 201-208.
26. Bartnik, M. & Szafranska, I. (1987) Changes in phytate contentand phytase activity during the germination of some cereals. J.Cereal Sci. 5: 23-28.
27. Gillooly, M., Bothwell, T. H., Challón, R. W., Torrance, J. D.,Bezwoda, W. R., MacPhail, A. P., Derman, D. P., Novelli, L.,Morral, P. & Mayet, F. (1984) Factors affecting the absorptionof iron from cereals. Br. J. Nute. 51: 37-46.
28. Siljestrom, M., Björck,I., Lonner, A. C., Nyman, M. & Asp, N-G. (1988) Effects on polysaccharides during baking and storingof bread—in vitto and in vivo studies. Cereal Chem. 65: 1-8.
29. Hallberg, L. &. Rossander, L. (1984) Improvement of ironnutrition in developing countries. Comparison of adding meat,soy protein, ascorbic acid, citric acid and ferrous sulphate oniron absorption from a simple Latin-American type of meal.Am. J. Clin. Nutr. 39: 577-583.
30. Baynes, R. D., Macfarlane, B. J., Bothwell, T. H., Siegenberg,D., Bezwoda, W. R., Schmidt, U., Lamparelli, R. D., Mayet, F.& MacPhail, A. P. (1990) The promotive effect of soy sauce oniron absorption in human subjects. Eur. J. Clin. Ñute. 44:419-424.
31. Phillippy, B. Q., Johnston, M. R., Tao, S-H. &. Fox, M.R.S.(1988) Inositol phosphates in processed foods. J. Food Sci. 53:496^499.
by guest on August 26, 2015
jn.nutrition.orgD
ownloaded from