J. Meijer1, C. Dominik , and L.B.F.M. Waters arXiv:0811 ... · 2 J. Meijer et al.: A parameter...
12
arXiv:0811.0915v1 [astro-ph] 6 Nov 2008 Astronomy & Astrophysics manuscript no. (will be inserted by hand later) A parameter study of self-consistent disk models around Herbig AeBe stars J. Meijer 1 , C. Dominik 1,2 , A. de Koter 1 , C.P. Dullemond 3 , R. van Boekel 3 , and L.B.F.M. Waters 1,4 1 Sterrenkundig Instituut “Anton Pannekoek”, Kruislaan 403, 1098 SJ Amsterdam, The Netherlands 2 Department of Astrophysics, Radboud University Nijmegen, PO Box 9010, 6500 GL Nijmegen, The Netherlands 3 Leader of Junior Research Group ”Formation of planetary building blocks” at the Max-Planck-Institut f¨ ur Astronomie, K¨ onigstuhl 17, 69117 Heidelberg, Germany 4 Instituut voor Sterrenkunde, Katholieke Universiteit Leuven, Celestijnenlaan 200D, 3001 Heverlee, Belgium DRAFT, May 30, 2018 Abstract. We present a parameter study of self-consistent models of protoplanetary disks around Herbig AeBe stars. We use the code developed by Dullemond and Dominik, which solves the 2D radiative transfer problem including an iteration for the vertical hydrostatic structure of the disk. This grid of models will be used for several studies on disk emission and mineralogy in followup papers. In this paper we take a first look on the new models, compare them with previous modeling attempts and focus on the effects of various parameters on the overall structure of the SED that leads to the classification of Herbig AeBe stars into two groups , with a flaring (group I) or self-shadowed (group II) SED. We find that the parameter of overriding importance to the SED is the total mass in grains smaller than 25µm, confirming the earlier results by Dullemond and Dominik. All other parameters studied have only minor influences, and will alter the SED type only in borderline cases. We find that there is no natural dichotomy between group I and II. From a modeling point of view, the transition is a continuous function of the small dust mass. We also show that moderate grain growth produces spectra with weak or no 10µm feature, both for flaring (Group I) and non-flaring (Group II) sources. The fact that sources with weak features have been found mostly in Group I sources is therefore surprising and must be due to observational biases or evolutionary effects. Key words. Dust – Circumstellar Disks – circumstellar matter – infrared: stars 1. Introduction Herbig Ae/Be stars are young, intermediate-mass stars sur- rounded by circumstellar disks (see e.g. Waters & Waelkens (1998) or Natta et al. (2000) for a review). Solid-state mate- rial makes up about a percent of the disk mass, and can be studied in the thermal infrared. These studies indicate that the grains must have experienced both growth and thermal pro- cessing, since their spectra differ substantially from that of in- terstellar dust (Bouwman et al. 2001; van Boekel et al. 2003, 2005). It is expected that this growth may lead ultimately to the formation of planets. The infrared spectra of Herbig stars can be divided into two groups (Meeus et al. 2001). Though approximately similar in the near-IR, the far-IR flux of some is relatively strong (those of Group I) compared with that of others (Group II). This spectral difference is believed to reflect the overall shape of the disk. Group I sources have a geometri- cally flaring outer disk, which absorbs direct stellar light that is thenre-radiated at far-IR wavelengths. Group II sources have a flat geometry, which reprocesses far less stellar radiation in the outer disk. Many sources exhibit 10 micron silicate emission (these are labeled a, so either Ia or IIa). Some sources lack this emission (these are denoted Ib or IIb), possibly reflecting that Send offprint requests to: J. Meijer, e-mail: [email protected] the bulk of the observable warm silicate grains in these sources have sizes larger than several microns. The general shape of the SED of Herbig stars has been a subject of study for a considerable time and is now believed to be quite well understood. The latest addition to this under- standing was the realization that the prominent emission close to 3µm, interpreted in earlier models interpreted as originating in accretion luminosity (e.g. Hillenbrand et al. 1992), is due to a puffed-up inner rim of the disk. This rim is formed at a lo- cation given by the dust-evaporation temperature. Inside the rim, the disk does not contain any dust and is mostly trans- parent (optically thin) to the incident stellar light. The rim it- self can absorb up to 25% of the stellar radiation (Natta et al. 2001). This idea was incorporated into a more detailed phys- ical model by Dullemond et al. (2001), who showed that this inner rim can indeed resolve the discrepancy between obser- vations and previous models in the wavelength region around 3µm, with a self-consistent disk model. An important question is if this conclusion still holds in more complex models. Dullemond (2002) and Dullemond & Dominik (2004, here- after DD04) developed far more sophisticated models includ- ing full 2D radiative transfer, coupled with self-consistent ver- tical structure calculations. These models confirmed that a self- consistent approach can explain many of the observed fea- tures of Herbig Ae SEDs. They demonstrated that the disk structure is closely linked to the properties and spatial dis- tribution of the dust grains. Although the vertical extent of the disk is supported by gas pressure, the energy that heats
Transcript of J. Meijer1, C. Dominik , and L.B.F.M. Waters arXiv:0811 ... · 2 J. Meijer et al.: A parameter...
arX
iv:0
811.
0915
v1 [
astr
o-ph
] 6
Nov
200
8Astronomy & Astrophysicsmanuscript no.(will be inserted by hand later)
A parameter study of self-consistent disk models aroundHerbig AeBe stars
J. Meijer1, C. Dominik1,2, A. de Koter1, C.P. Dullemond3, R. van Boekel3, and L.B.F.M. Waters1,4
1 Sterrenkundig Instituut “Anton Pannekoek”, Kruislaan 403, 1098 SJ Amsterdam, The Netherlands2 Department of Astrophysics, Radboud University Nijmegen,PO Box 9010, 6500 GL Nijmegen, The Netherlands3 Leader of Junior Research Group ”Formation of planetary building blocks” at the Max-Planck-Institut fur Astronomie,
Konigstuhl 17, 69117 Heidelberg, Germany4 Instituut voor Sterrenkunde, Katholieke Universiteit Leuven, Celestijnenlaan 200D, 3001 Heverlee, Belgium
DRAFT, May 30, 2018
Abstract. We present a parameter study of self-consistent models of protoplanetary disks around Herbig AeBe stars. We usethe code developed by Dullemond and Dominik, which solves the 2D radiative transfer problem including an iteration for thevertical hydrostatic structure of the disk. This grid of models will be used for several studies on disk emission and mineralogy infollowup papers. In this paper we take a first look on the new models, compare them with previous modeling attempts and focuson the effects of various parameters on the overall structure of the SED that leads to the classification of Herbig AeBe starsinto two groups , with a flaring (group I) or self-shadowed (group II) SED. We find that the parameter of overriding importanceto the SED is the total mass in grains smaller than 25µm, confirming the earlier results by Dullemond and Dominik. All otherparameters studied have only minor influences, and will alter the SED type only in borderline cases. We find that there is nonatural dichotomy between group I and II. From a modeling point of view, the transition is a continuous function of the smalldust mass. We also show that moderate grain growth produces spectra with weak or no 10µm feature, both for flaring (GroupI) and non-flaring (Group II) sources. The fact that sources with weak features have been found mostly in Group I sources istherefore surprising and must be due to observational biases or evolutionary effects.
Key words. Dust – Circumstellar Disks – circumstellar matter– infrared: stars
1. Introduction
Herbig Ae/Be stars are young, intermediate-mass stars sur-rounded by circumstellar disks (see e.g. Waters & Waelkens(1998) or Natta et al. (2000) for a review). Solid-state mate-rial makes up about a percent of the disk mass, and can bestudied in the thermal infrared. These studies indicate that thegrains must have experienced both growth and thermal pro-cessing, since their spectra differ substantially from that of in-terstellar dust (Bouwman et al. 2001; van Boekel et al. 2003,2005). It is expected that this growth may lead ultimately tothe formation of planets. The infrared spectra of Herbig starscan be divided into two groups (Meeus et al. 2001). Thoughapproximately similar in the near-IR, the far-IR flux of someis relatively strong (those of Group I) compared with that ofothers (Group II). This spectral difference is believed to reflectthe overall shape of the disk. Group I sources have a geometri-cally flaring outer disk, which absorbs direct stellar lightthat isthenre-radiated at far-IR wavelengths. Group II sources have aflat geometry, which reprocesses far less stellar radiationin theouter disk. Many sources exhibit 10 micron silicate emission(these are labeleda, so either Ia or IIa). Some sources lack thisemission (these are denoted Ib or IIb), possibly reflecting that
Send offprint requests to: J. Meijer,e-mail:[email protected]
the bulk of the observable warm silicate grains in these sourceshave sizes larger than several microns.
The general shape of the SED of Herbig stars has been asubject of study for a considerable time and is now believedto be quite well understood. The latest addition to this under-standing was the realization that the prominent emission closeto 3µm, interpreted in earlier models interpreted as originatingin accretion luminosity (e.g. Hillenbrand et al. 1992), is due toa puffed-up inner rim of the disk. This rim is formed at a lo-cation given by the dust-evaporation temperature. Inside therim, the disk does not contain any dust and is mostly trans-parent (optically thin) to the incident stellar light. The rim it-self can absorb up to 25% of the stellar radiation (Natta et al.2001). This idea was incorporated into a more detailed phys-ical model by Dullemond et al. (2001), who showed that thisinner rim can indeed resolve the discrepancy between obser-vations and previous models in the wavelength region around3µm, with a self-consistent disk model. An important questionis if this conclusion still holds in more complex models.
Dullemond (2002) and Dullemond & Dominik (2004, here-after DD04) developed far more sophisticated models includ-ing full 2D radiative transfer, coupled with self-consistent ver-tical structure calculations. These models confirmed that aself-consistent approach can explain many of the observed fea-tures of Herbig Ae SEDs. They demonstrated that the diskstructure is closely linked to the properties and spatial dis-tribution of the dust grains. Although the vertical extent ofthe disk is supported by gas pressure, the energy that heats

2 J. Meijer et al.: A parameter study of self-consistent diskmodels around Herbig AeBe stars
the gas is obtained from the grains by dust-gas interactions(see Kamp & Dullemond (2004) for details). The spatial dis-tribution of dust opacity that absorbs stellar light must there-fore control, to a large extent, the geometrical shape of proto-planetary disks. Since this opacity is provided mostly bygrainssmaller than about 25µm – that have large mass-extinctioncoefficients – this grain population is the mainly relevant one.Using this principle, DD04 performed a pilot study in whichthey showed that by increasing the total mass of the smallgrain component, one can alter the overall appearance of thespectral energy distribution from one qualitatively characteris-tic of Group II into Group I, and that this corresponds to eithera non-flaring vs. a flaring geometry. A change in the geometrycould also be achieved by a very steep power law in the surfacedensity, which in effect concentrates most of the disk mass inthe inner rim, leaving the outer disk with very low mass and,consequently, opacity.
This paper is the first in a series where we explore these newmodels in greater detail, building on the work of DD04. In thisfirst paper, we focus on the general appearance of the diskspectra, and how it depends upon the various parameters en-tering the calculation. We present an extended parameter studyof dust and disk properties of HAeBe star with the aim of bet-ter quantifying and understanding the cause of the Group I/IIdichotomy more robustly as well as the presence or absenceof the 10µm feature. We do not consider the detailed shape ofthe 10µm feature - mineralogical studies will be presented infurther papers in this series.
The model parameters that we address are – in addition tototal disk mass and radial surface density gradient – disk sizeand inclination, some basic aspects of grain composition, andthe grain-size distribution. To allow for aquantitative compar-ison between observations and models, we present the resultsin terms of a color-flux ratio comparison, first introduced byvan Boekel et al. (2003, hereafter BWD03) to distinguish be-tween Group I and Group II sources. We then first study theSED of selected models directly, and later turn to a specialcolor-color diagram in which we are able to display the resultsof the full parameter study.
In Sect. 2, we describe the model assumptions, take a firstlook at the resulting SEDs, and present the basic model grid.In Sect. 3, we show the SEDs for a selected subset of our pa-rameter study. In Sect. 4, we describe the system to quantifytheSED structure using a color-color diagram, and discuss in de-tail the parameter dependences of the model. We discuss someof the results in Sect. 5 and present our conclusions in Sect.6.
2. Model setup
2.1. The DD04 code
To model the proto-planetary disks of Herbig systems,we used the code developed by Dullemond (2002) andDullemond & Dominik (2004) in which 2-D radiative transferis solved subject to the constraint of radiative equilibrium andvertical hydrostatic equilibrium for a passive disk (i.e. one inwhich the only source of energy is irradiation by the centralstar) for which the surface density structure is described by apower law.
The code uses a spherical coordinate system (r, θ, φ) with theassumption of cylindrical symmetry (i.e. all derivatives with
respect to the azimuthal angelφ vanish). The model consists oftwo parts: a 2D radiative transfer code (RADICAL/RADMC)and a 1D vertical hydrostatic equilibrium code. The radiativetransfer code calculates the dust temperature from the spatialdistribution of the dust, and the dust opacity. The verticalhy-drostatic equilibrium code calculates the dust density from thedust temperature and vertical hydrostatic equilibrium. Thesetwo codes are applied alternately to an initial guess for thedustdensity distribution until convergence is reached. For details ofthe method we refer to the references given above.
No scattering is currently considered by the models. Since atoptical wavelengths the scattering opacity for silicate grains(thought to be a dominant dust species in proto-planetarydisks) is approximately a factor of a few larger than the ab-sorption opacity (and is about equal to it at near-IR wave-lengths) one may expect that this may affect the disk geometryand emerging spectral energy distribution. Dullemond & Natta(2003) investigated this effect and concluded that because scat-tering reflects part of the stellar light away from the disk beforeit becomes thermalized, the disk becomes cooler at all verticalheights. However, the vertical surface height – defined to bethesurface at which the stellar light is intercepted – will increase,simply because of the added (scattering) opacity component.The effect on the SED is that in the near- and mid-IR the fluxmay reduce by tens of percents, while at millimeter wavelengththe reduction is a few percent at most. We conclude that ne-glecting the effects of scattering may cause a modest (system-atic) effect on the disk structure and spectral appearance in-ferred, and therefore on the exact location of the Group I/IIboundary. However, it does not affect selectively either GroupI or II, and will therefore not affect any conclusions regardingthe cause of the Group I/II dichotomy itself.
2.2. Modifications for the present study
The following modifications to the original code have been im-plemented for the computations presented in this paper:
2.2.1. Grain properties
In the pilot study by DD04, the grain population was assumedto consist only of silicate particles with a radiusa = 0.1 µm.Here, we account for both silicate (Laor & Draine 1993) andcarbon (Preibisch et al. 1993) grains that may range in sizefrom a minimum valueamin to a maximum valueamax accord-ing to
n(a) ∝
(
aamin
)
−m
(1)
We adoptm = 3.5, which is representative of interstellargrains (Mathis et al. 1977). This power-law shape size dis-tribution is expected on theoretical grounds whenever grain-grain collisions may lead to shattering (Dohnanyi 1969), butdiffers from that expected on the basis of grain growth (e.g.Dullemond & Dominik 2005; Tanaka et al. 2005) in whichcase the dust size distribution has one or two peaks thatshift with time. If the distribution results from an equilib-rium between growth and fragmentation, it may also be flat(Dullemond & Dominik 2005). It is therefore not at all obvi-ous that a power law size distribution is indeed the appropriate
J. Meijer et al.: A parameter study of self-consistent disk models around Herbig AeBe stars 3
choice. We used it nevertheless, because it is the standard as-sumption in most disk models. The relative abundance of car-bon and silicate grains is explored as a model parameter.
Grains of different sizes are all assumed to have the sametemperature. Technically this is achieved by averaging themass absorption coefficients of the different grain sizes andmaterials, weighted by the relative mass contained in eachgrain size and material. This averaged mass absorption coef-ficient is then used to solve the radiative transfer problem.
2.2.2. Small and large grains, and the small grain diskmass
Many studies of dust evolution in disks discuss the presenceof“large” grains. Depending on the type of study, this term maymean grains of a fewµm, as they may be detected by studyingthe 10µm emission feature, or mm-sized grains as submm andmm studies report. It is therefore important to define clearlywhat is meant by “large” and “small” in the context of a study.
In the present paper, we are interested mainly in the overallstructure of the disk model, and this structure will be domi-nated by the grains that carry the opacity in the disk, i.e. therelatively small grains. Instead of using the total disk mass asan input parameter, we therefore use the termsmall grain massof the disk as the one main parameter of our disk models. Thiscovers all grains smaller than 25µm. In most models we onlyconsider these grains and vary the small grain mass of the diskover a large range. This does not necessarily imply that the truedust mass in the disk equals to this value. In fact, one way tojustify a large range in the small grain mass is by assumingthat much of the original dust mass in the disk has been con-verted to larger grains, that no longer influence the structureof the disk. In Sect. 3.2, we demonstrate a computation of afew models in which we add significant amounts of dust massin the form of a midplane layer of large grains, and prove thatthe general shape of the SED at near and mid-IR wavelength islargely unaffected by this mass.
However, we study in detail the effects of changing the rel-ative abundance of grains below 25µm: these changes are ex-pected to affect both the strength of emission features close to10µm, and the overall disk structure.
2.3. First look: an example model and comparison tothe DDN model
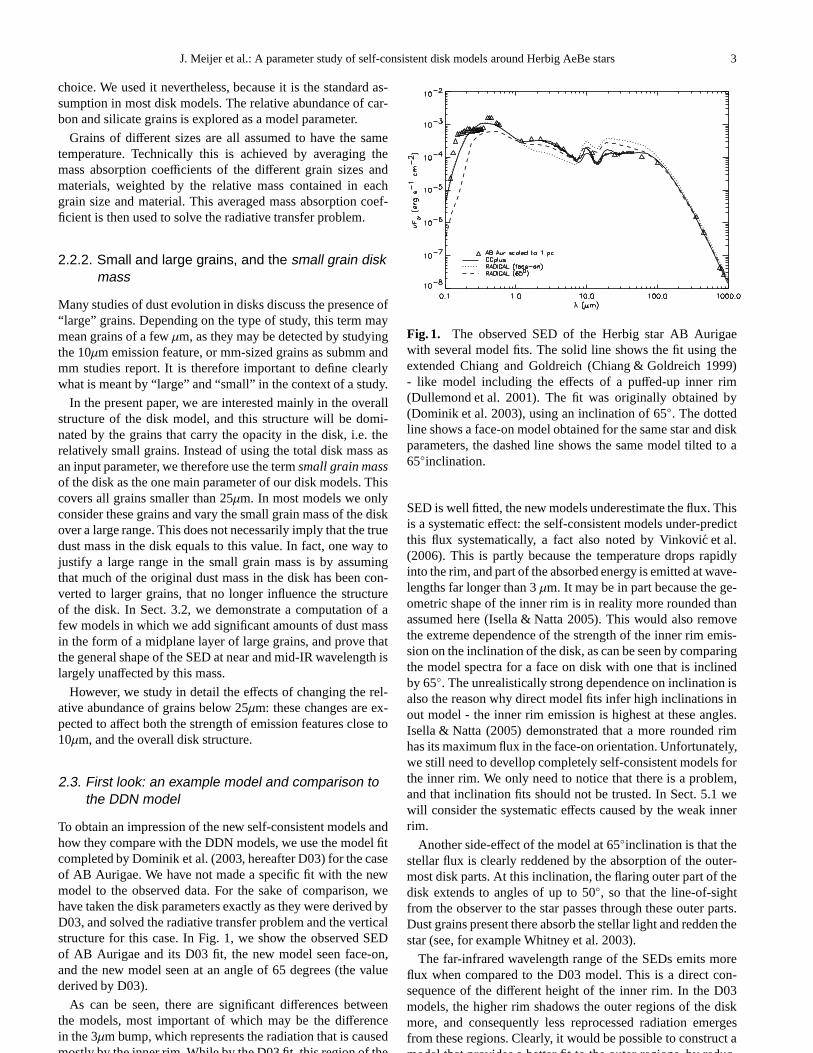
To obtain an impression of the new self-consistent models andhow they compare with the DDN models, we use the model fitcompleted by Dominik et al. (2003, hereafter D03) for the caseof AB Aurigae. We have not made a specific fit with the newmodel to the observed data. For the sake of comparison, wehave taken the disk parameters exactly as they were derived byD03, and solved the radiative transfer problem and the verticalstructure for this case. In Fig. 1, we show the observed SEDof AB Aurigae and its D03 fit, the new model seen face-on,and the new model seen at an angle of 65 degrees (the valuederived by D03).
As can be seen, there are significant differences betweenthe models, most important of which may be the differencein the 3µm bump, which represents the radiation that is causedmostly by the inner rim. While by the D03 fit, this region of the
Fig. 1. The observed SED of the Herbig star AB Aurigaewith several model fits. The solid line shows the fit using theextended Chiang and Goldreich (Chiang & Goldreich 1999)- like model including the effects of a puffed-up inner rim(Dullemond et al. 2001). The fit was originally obtained by(Dominik et al. 2003), using an inclination of 65◦. The dottedline shows a face-on model obtained for the same star and diskparameters, the dashed line shows the same model tilted to a65◦inclination.
SED is well fitted, the new models underestimate the flux. Thisis a systematic effect: the self-consistent models under-predictthis flux systematically, a fact also noted by Vinkovic et al.(2006). This is partly because the temperature drops rapidlyinto the rim, and part of the absorbed energy is emitted at wave-lengths far longer than 3µm. It may be in part because the ge-ometric shape of the inner rim is in reality more rounded thanassumed here (Isella & Natta 2005). This would also removethe extreme dependence of the strength of the inner rim emis-sion on the inclination of the disk, as can be seen by comparingthe model spectra for a face on disk with one that is inclinedby 65◦. The unrealistically strong dependence on inclination isalso the reason why direct model fits infer high inclinationsinout model - the inner rim emission is highest at these angles.Isella & Natta (2005) demonstrated that a more rounded rimhas its maximum flux in the face-on orientation. Unfortunately,we still need to devellop completely self-consistent models forthe inner rim. We only need to notice that there is a problem,and that inclination fits should not be trusted. In Sect. 5.1 wewill consider the systematic effects caused by the weak innerrim.
Another side-effect of the model at 65◦inclination is that thestellar flux is clearly reddened by the absorption of the outer-most disk parts. At this inclination, the flaring outer part of thedisk extends to angles of up to 50◦, so that the line-of-sightfrom the observer to the star passes through these outer parts.Dust grains present there absorb the stellar light and redden thestar (see, for example Whitney et al. 2003).
The far-infrared wavelength range of the SEDs emits moreflux when compared to the D03 model. This is a direct con-sequence of the different height of the inner rim. In the D03models, the higher rim shadows the outer regions of the diskmore, and consequently less reprocessed radiation emergesfrom these regions. Clearly, it would be possible to construct amodel that provides a better fit to the outer regions, by reduc-

4 J. Meijer et al.: A parameter study of self-consistent diskmodels around Herbig AeBe stars
Table 1. The parameters describing the disk structure and grainproperties. The power law describing the grain size distributionhas a fixed indexm = 3.5, representative of interstellar grains.The values of the parameters that are not varied are marked bya⋆.
disk parameter adopted valueslog dust mass [M⊙] Mdust -6.0 -5.5 -5.0 -4.5 -4.0outer radius [AU] Rdisk
∗200 400 600mass distribution p -1.0 ∗-1.5 -2.0
dust parameter adopted valuessize range [µm] amin
∗0.01 0.1 1amax
∗1 5 10 25mass fraction fSil
∗1 0.95 0.91 0.83fCar
∗0 0.05 0.09 0.17
ing the small grain mass in the outer disk regions. We have notattempted this here.
2.4. The model grid
Our model grid was computed for a central star of massM⋆ = 2.5M⊙, radiusR⋆ = 2.1R⊙ and effective temperatureTeff = 10 000K, and therefore a luminosityL⋆ = 39.5L⊙. Itsspectral energy distribution was represented by a Planck func-tion. An overview of the disk parameters is given in Table 1.The free parameters describing the global disk structure were:the total mass in small dust grainsMdust, the mass distribu-tion, and the outer disk radiusRdisk. A fixed gas-to-dust ra-tio f = 100 relatesMdust to the total disk mass, although theamount of gas in the disk enters the calculation in no way.The radial distribution of the surface density was given byΣ(r) ∝ r−p, i.e. it is described by the power-law indexp andthe total disk mass. We note that although the outer disk ra-dius is a free parameter, the inner disk radius is computed self-consistently using the dust sublimation temperatureTsub. Thedust is assumed to consist of silicate and carbon grains. In thecurrent study, we were not interested in the effects of differentsublimation temperatures of different species. We therefore as-sume that both species sublimate together atTsub = 1 500 K,typical of silicates. We also investigated the effects of grain sizeand computed a set of models with different grain size ranges(see Table 1). The full model grid therefore comprises 50 mod-els. The relative abundance of the two dust species consideredwas also varied, but the effect was negligible.
In Figs. 2 and 6, we show the main results of our parameterstudy. Both figures contain 8 panels each, and in each panel westudy the dependence of the model spectra on one parameter.
3. Spectral energy distributions
Figure 2 shows the SEDs of the different models relative to ourstandard model,which is given by the solid curve in each panel.This model uses a total mass in small dust grains of 10−5M⊙,a surface density power law withp = −1.5, a dust size distri-bution between 0.01 and 1.0µm, a carbon/silicate mass ratio of0 and a luminosity of 40L⊙. The SED of the standard model iscomputed at an inclination of 50◦. In each panel, we then varyone parameter, as specified by the labels in the diagram.
3.1. Overview over SED parameter dependence
Figure 2 shows the spectral energy distributions for a subsetof our parameter study. In each panel, we start from our stan-dard base model and then vary a single parameter. The result-ing SEDs are shown, and the different values of the varied pa-rameter is shown in the panel legend. We present a far moredetailed discussion of the parameter dependencies in Sect.4.3;here, we only highlight the obvious properties of these calcu-lations. It is clear that the dependence of the SED on the massof small dust grains (panel a), the inclination (panel b) andthemaximum grain size (panel f) is far stronger than the influ-ence of all other parameters. In panels d, e, and h, hardly anyvariations are seen, whereas the data in panels c and g showmoderate changes.
One result is particularly significant: The shape and strengthof the 3µm bump is extremely robust and similar in all mod-els, with only two exceptions. One exception is high inclina-tion models (i > 75◦). In these models, the inner rim is seenthrough the outer disk, and the 3µm flux is strongly absorbed.The other exception is the model with a luminosity of only10L⊙ for which the inner rim emission is less significant. Thereason for this latter case is that at low luminosities, the dustevaporation radius is far closer to the star, and therefore deeperinside the gravitational potential of the star. The gravityof thestar reduces the ratio of surface height to distance, so thatasmaller fraction of the total luminosity is absorbed by the in-ner rim. Apart from those exceptions, this part of the spectrumshows an amazing lack of variation. This is a reflection of twoimportant facts: (i) the distance of the rim is set by evaporationphysics and therefore independent of the disk properties. (ii)its height is only weakly dependent on disk properties becausethe rim isstrongly optically thick and remains so regardless ofparameter changes.
The SED variations in panel b (inclination) only occur be-cause of the location of the observer relative to the object.Ifwe focus on the remaining parameters that alter the intrinsicproperties of the star-disk system, the strongest influenceis ex-erted by the mass in small grains, which can switch the outerdisk from optically thick to optically thin.
Some of the variations in panel f are due to a significant re-duction in the optical depth of the outer disk, which is causedby an increase in the upper limit of the dust grain size distribu-tion to 25µm. In addition, the 10µm feature is also weakenedbecause this feature is mostly due to grains with sizes below3µm.
3.2. Large grains in the mid plane
We considered a wide range of total small dust grain mass inthe disk in order to produce models of significantly differentproperties. In reality, the amount of solids in a disk might spana far smaller range ov values (Acke & van den Ancker 2004),and the small dust mass required to reproduce group II modelsmay be compensated for by larger grains or even pebbles andboulders in the disk midplane. DD04 already demonstrated thatconverting a large fraction of small grains into large midplaneparticles produces models that are similar to those of smalldust mass, apart from the fact that the submm luminosity isincreased. Therefore, throughout this paper, low dust masscan

J. Meijer et al.: A parameter study of self-consistent disk models around Herbig AeBe stars 5
Fig. 2. Panel representing an overview of the spectral energy distributions resulting from our parameter study. In each panel,we start from our standard base model (L⋆ = 40L⊙, Mdust = 10−5M⊙, i = 50◦, p = −1.5, Rdisk = 200AU, amin = 0.01µm,amax = 1µm) and vary a single parameter, as specified in the panels: (a)dust mass, (b) inclination, (c) index of power law of massdistribution, (d) disk size, (e) minimum grain size, (f) maximum grain size, (g) stellar luminosity, and (h) carbon/silicate ratio.
be assumed to correspond to models with an efficient conver-sion of micron-sized dust to far larger particles.
To assess the effect of sedimentation on the spectral en-ergy distribution, we calculated an additional five models,inwhich we introduced a mid-plane layer of large grains. Thiswas achieved by taking a model from the standard grid witha dust mass less than 5× 10⁻⁴ M⊙ and adding a mid-planelayer of 2 mm grains of a mass such that the total disk mass
equaled 5× 10⁻⁴ M⊙. The resulting values of the mass in themidplane layer can be seen in Table 2. The large grain massfraction varies between 0.998 for model ML0 and 0.000 formodel ML5, which is equivalent to its parent model M5 (seeTable 4).
The SEDs are shown in Fig. 3. In the upper panel, we com-pare all models that include a mid-plane layer. While there arestrong differences in the near, mid, and far infrared, the models
6 J. Meijer et al.: A parameter study of self-consistent diskmodels around Herbig AeBe stars
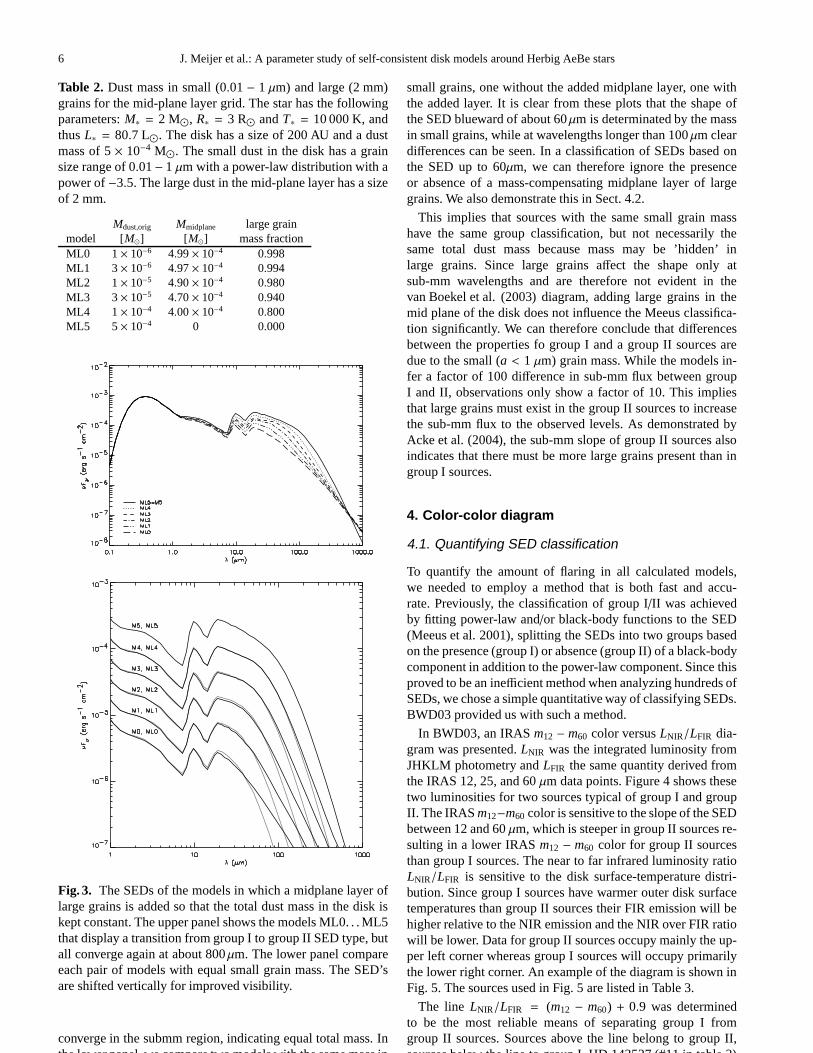
Table 2. Dust mass in small (0.01− 1 µm) and large (2 mm)grains for the mid-plane layer grid. The star has the followingparameters:M∗ = 2 M⊙, R∗ = 3 R⊙ andT∗ = 10 000 K, andthusL∗ = 80.7 L⊙. The disk has a size of 200 AU and a dustmass of 5× 10⁻⁴ M⊙. The small dust in the disk has a grainsize range of 0.01− 1 µm with a power-law distribution with apower of−3.5. The large dust in the mid-plane layer has a sizeof 2 mm.
Mdust,orig Mmidplane large grainmodel [M⊙] [ M⊙] mass fractionML0 1 × 10⁻⁶ 4.99× 10⁻⁴ 0.998ML1 3 × 10⁻⁶ 4.97× 10⁻⁴ 0.994ML2 1 × 10⁻⁵ 4.90× 10⁻⁴ 0.980ML3 3 × 10⁻⁵ 4.70× 10⁻⁴ 0.940ML4 1 × 10⁻⁴ 4.00× 10⁻⁴ 0.800ML5 5 × 10⁻⁴ 0 0.000
Fig. 3. The SEDs of the models in which a midplane layer oflarge grains is added so that the total dust mass in the disk iskept constant. The upper panel shows the models ML0. . . ML5that display a transition from group I to group II SED type, butall converge again at about 800µm. The lower panel compareeach pair of models with equal small grain mass. The SED’sare shifted vertically for improved visibility.
converge in the submm region, indicating equal total mass. Inthe lower panel, we compare two models with the same mass in
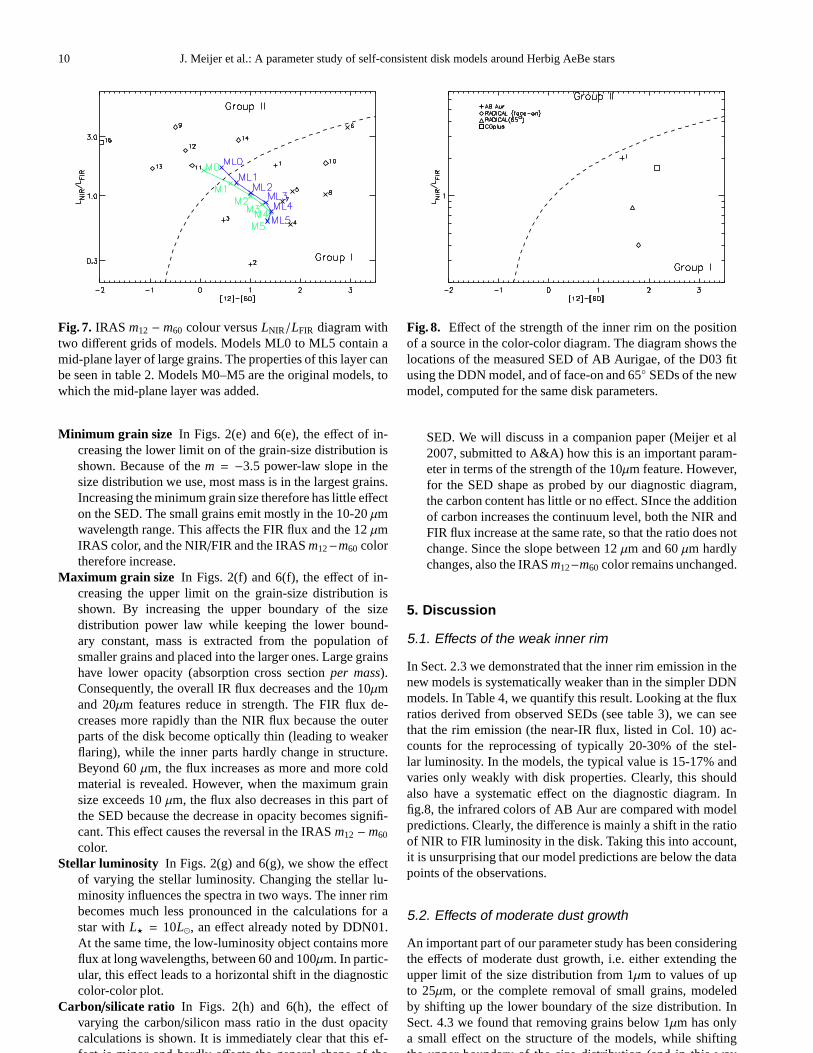
small grains, one without the added midplane layer, one withthe added layer. It is clear from these plots that the shape ofthe SED blueward of about 60µm is determinated by the massin small grains, while at wavelengths longer than 100µm cleardifferences can be seen. In a classification of SEDs based onthe SED up to 60µm, we can therefore ignore the presenceor absence of a mass-compensating midplane layer of largegrains. We also demonstrate this in Sect. 4.2.
This implies that sources with the same small grain masshave the same group classification, but not necessarily thesame total dust mass because mass may be ’hidden’ inlarge grains. Since large grains affect the shape only atsub-mm wavelengths and are therefore not evident in thevan Boekel et al. (2003) diagram, adding large grains in themid plane of the disk does not influence the Meeus classifica-tion significantly. We can therefore conclude that differencesbetween the properties fo group I and a group II sources aredue to the small (a < 1 µm) grain mass. While the models in-fer a factor of 100 difference in sub-mm flux between groupI and II, observations only show a factor of 10. This impliesthat large grains must exist in the group II sources to increasethe sub-mm flux to the observed levels. As demonstrated byAcke et al. (2004), the sub-mm slope of group II sources alsoindicates that there must be more large grains present than ingroup I sources.
4. Color-color diagram
4.1. Quantifying SED classification
To quantify the amount of flaring in all calculated models,we needed to employ a method that is both fast and accu-rate. Previously, the classification of group I/II was achievedby fitting power-law and/or black-body functions to the SED(Meeus et al. 2001), splitting the SEDs into two groups basedon the presence (group I) or absence (group II) of a black-bodycomponent in addition to the power-law component. Since thisproved to be an inefficient method when analyzing hundreds ofSEDs, we chose a simple quantitative way of classifying SEDs.BWD03 provided us with such a method.
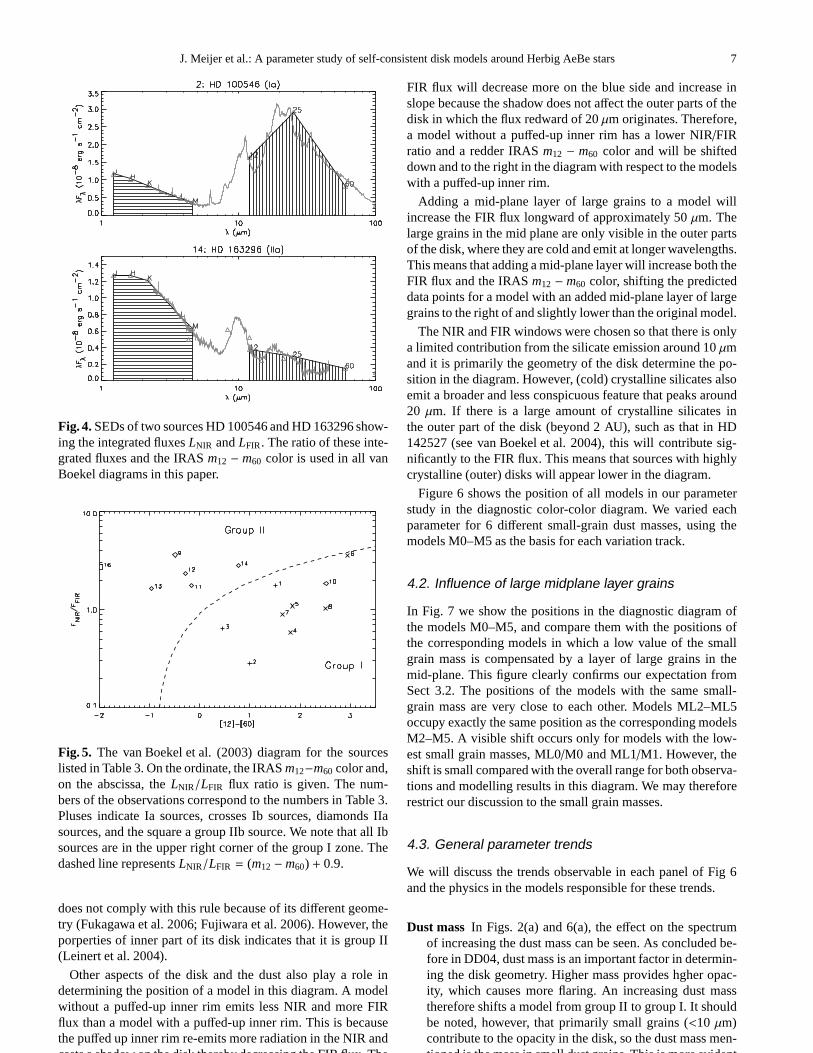
In BWD03, an IRASm12 − m60 color versusLNIR/LFIR dia-gram was presented.LNIR was the integrated luminosity fromJHKLM photometry andLFIR the same quantity derived fromthe IRAS 12, 25, and 60µm data points. Figure 4 shows thesetwo luminosities for two sources typical of group I and groupII. The IRASm12−m60 color is sensitive to the slope of the SEDbetween 12 and 60µm, which is steeper in group II sources re-sulting in a lower IRASm12 − m60 color for group II sourcesthan group I sources. The near to far infrared luminosity ratioLNIR/LFIR is sensitive to the disk surface-temperature distri-bution. Since group I sources have warmer outer disk surfacetemperatures than group II sources their FIR emission will behigher relative to the NIR emission and the NIR over FIR ratiowill be lower. Data for group II sources occupy mainly the up-per left corner whereas group I sources will occupy primarilythe lower right corner. An example of the diagram is shown inFig. 5. The sources used in Fig. 5 are listed in Table 3.
The line LNIR/LFIR = (m12 − m60) + 0.9 was determinedto be the most reliable means of separating group I fromgroup II sources. Sources above the line belong to group II,sources below the line to group I. HD 142527 (#11 in table 3)
J. Meijer et al.: A parameter study of self-consistent disk models around Herbig AeBe stars 7
Fig. 4. SEDs of two sources HD 100546 and HD 163296 show-ing the integrated fluxesLNIR andLFIR. The ratio of these inte-grated fluxes and the IRASm12 − m60 color is used in all vanBoekel diagrams in this paper.
Fig. 5. The van Boekel et al. (2003) diagram for the sourceslisted in Table 3. On the ordinate, the IRASm12−m60 color and,on the abscissa, theLNIR/LFIR flux ratio is given. The num-bers of the observations correspond to the numbers in Table 3.Pluses indicate Ia sources, crosses Ib sources, diamonds IIasources, and the square a group IIb source. We note that all Ibsources are in the upper right corner of the group I zone. Thedashed line representsLNIR/LFIR = (m12− m60) + 0.9.
does not comply with this rule because of its different geome-try (Fukagawa et al. 2006; Fujiwara et al. 2006). However, theporperties of inner part of its disk indicates that it is group II(Leinert et al. 2004).
Other aspects of the disk and the dust also play a role indetermining the position of a model in this diagram. A modelwithout a puffed-up inner rim emits less NIR and more FIRflux than a model with a puffed-up inner rim. This is becausethe puffed up inner rim re-emits more radiation in the NIR andcasts a shadow on the disk thereby decreasing the FIR flux. The
FIR flux will decrease more on the blue side and increase inslope because the shadow does not affect the outer parts of thedisk in which the flux redward of 20µm originates. Therefore,a model without a puffed-up inner rim has a lower NIR/FIRratio and a redder IRASm12 − m60 color and will be shifteddown and to the right in the diagram with respect to the modelswith a puffed-up inner rim.
Adding a mid-plane layer of large grains to a model willincrease the FIR flux longward of approximately 50µm. Thelarge grains in the mid plane are only visible in the outer partsof the disk, where they are cold and emit at longer wavelengths.This means that adding a mid-plane layer will increase both theFIR flux and the IRASm12 − m60 color, shifting the predicteddata points for a model with an added mid-plane layer of largegrains to the right of and slightly lower than the original model.
The NIR and FIR windows were chosen so that there is onlya limited contribution from the silicate emission around 10µmand it is primarily the geometry of the disk determine the po-sition in the diagram. However, (cold) crystalline silicates alsoemit a broader and less conspicuous feature that peaks around20 µm. If there is a large amount of crystalline silicates inthe outer part of the disk (beyond 2 AU), such as that in HD142527 (see van Boekel et al. 2004), this will contribute sig-nificantly to the FIR flux. This means that sources with highlycrystalline (outer) disks will appear lower in the diagram.
Figure 6 shows the position of all models in our parameterstudy in the diagnostic color-color diagram. We varied eachparameter for 6 different small-grain dust masses, using themodels M0–M5 as the basis for each variation track.
4.2. Influence of large midplane layer grains
In Fig. 7 we show the positions in the diagnostic diagram ofthe models M0–M5, and compare them with the positions ofthe corresponding models in which a low value of the smallgrain mass is compensated by a layer of large grains in themid-plane. This figure clearly confirms our expectation fromSect 3.2. The positions of the models with the same small-grain mass are very close to each other. Models ML2–ML5occupy exactly the same position as the corresponding modelsM2–M5. A visible shift occurs only for models with the low-est small grain masses, ML0/M0 and ML1/M1. However, theshift is small compared with the overall range for both observa-tions and modelling results in this diagram. We may thereforerestrict our discussion to the small grain masses.
4.3. General parameter trends
We will discuss the trends observable in each panel of Fig 6and the physics in the models responsible for these trends.
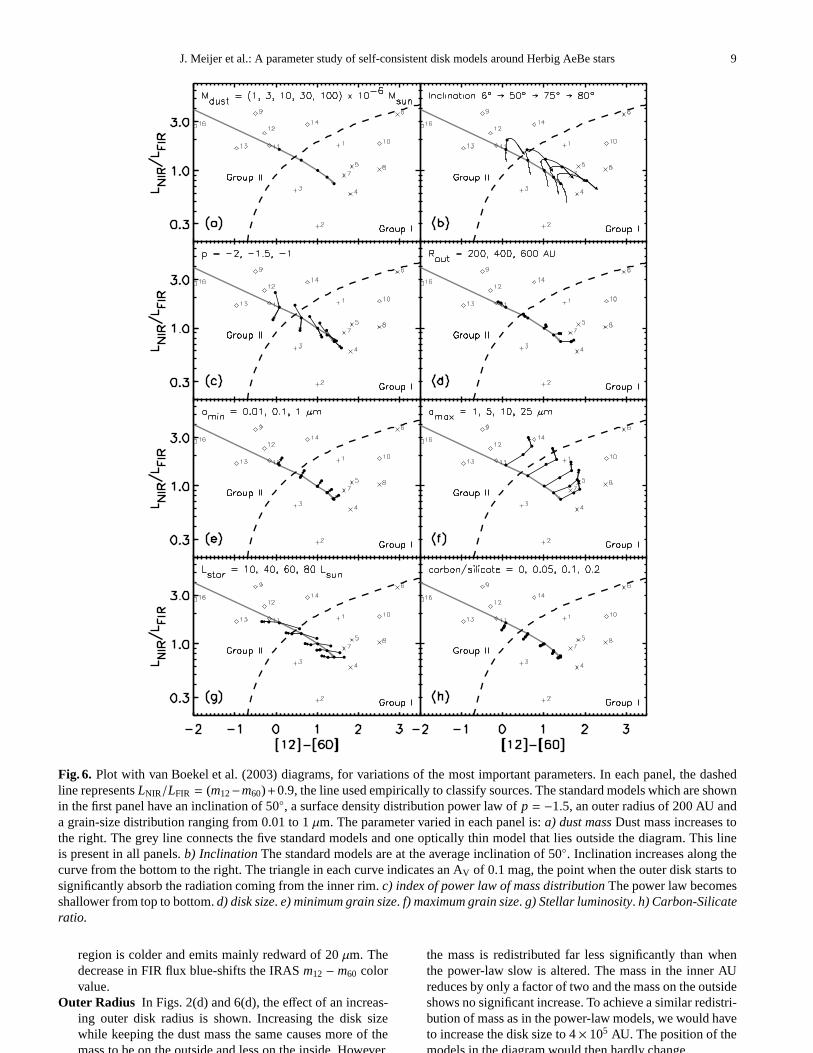
Dust mass In Figs. 2(a) and 6(a), the effect on the spectrumof increasing the dust mass can be seen. As concluded be-fore in DD04, dust mass is an important factor in determin-ing the disk geometry. Higher mass provides hgher opac-ity, which causes more flaring. An increasing dust masstherefore shifts a model from group II to group I. It shouldbe noted, however, that primarily small grains (<10 µm)contribute to the opacity in the disk, so the dust mass men-tioned is the mass in small dust grains. This is more evident
8 J. Meijer et al.: A parameter study of self-consistent diskmodels around Herbig AeBe stars
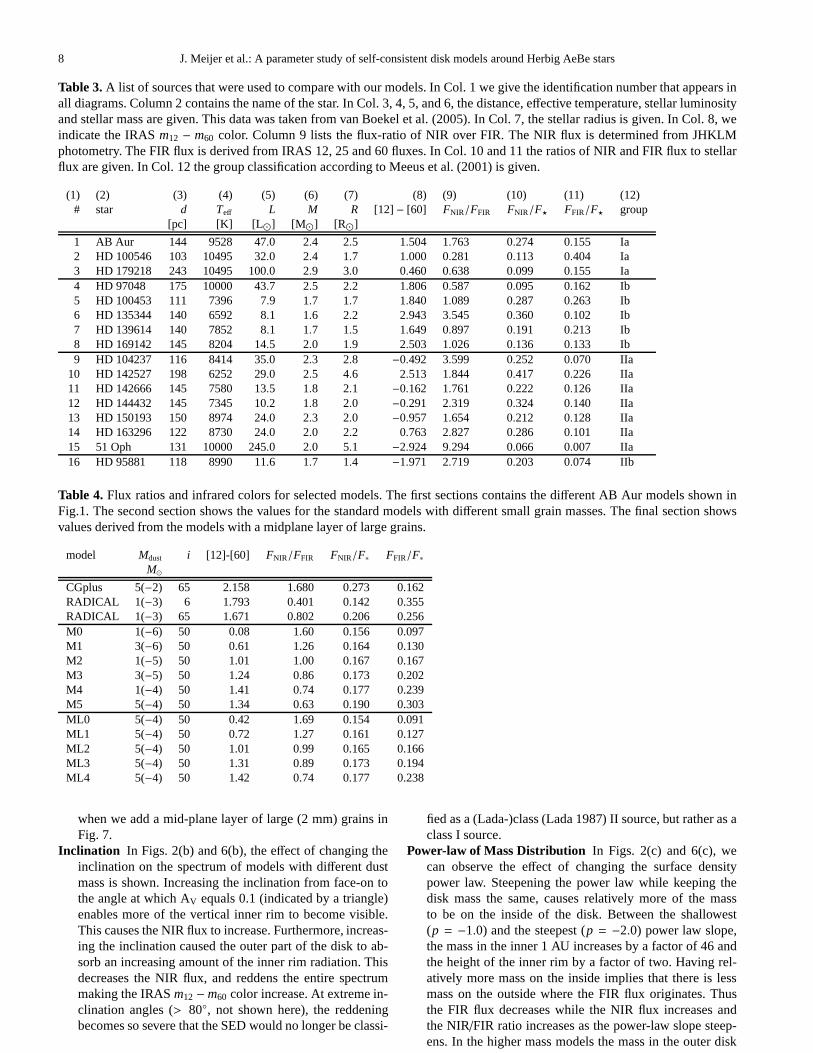
Table 3. A list of sources that were used to compare with our models. InCol. 1 we give the identification number that appears inall diagrams. Column 2 contains the name of the star. In Col. 3, 4, 5, and 6, the distance, effective temperature, stellar luminosityand stellar mass are given. This data was taken from van Boekel et al. (2005). In Col. 7, the stellar radius is given. In Col.8, weindicate the IRASm12 − m60 color. Column 9 lists the flux-ratio of NIR over FIR. The NIR flux is determined from JHKLMphotometry. The FIR flux is derived from IRAS 12, 25 and 60 fluxes. In Col. 10 and 11 the ratios of NIR and FIR flux to stellarflux are given. In Col. 12 the group classification according to Meeus et al. (2001) is given.
(1) (2) (3) (4) (5) (6) (7) (8) (9) (10) (11) (12)# star d Teff L M R [12] − [60] FNIR/FFIR FNIR/F⋆ FFIR/F⋆ group
[pc] [K] [L ⊙] [M⊙] [R⊙]
1 AB Aur 144 9528 47.0 2.4 2.5 1.504 1.763 0.274 0.155 Ia2 HD 100546 103 10495 32.0 2.4 1.7 1.000 0.281 0.113 0.404 Ia3 HD 179218 243 10495 100.0 2.9 3.0 0.460 0.638 0.099 0.155 Ia4 HD 97048 175 10000 43.7 2.5 2.2 1.806 0.587 0.095 0.162 Ib5 HD 100453 111 7396 7.9 1.7 1.7 1.840 1.089 0.287 0.263 Ib6 HD 135344 140 6592 8.1 1.6 2.2 2.943 3.545 0.360 0.102 Ib7 HD 139614 140 7852 8.1 1.7 1.5 1.649 0.897 0.191 0.213 Ib8 HD 169142 145 8204 14.5 2.0 1.9 2.503 1.026 0.136 0.133 Ib9 HD 104237 116 8414 35.0 2.3 2.8 −0.492 3.599 0.252 0.070 IIa
10 HD 142527 198 6252 29.0 2.5 4.6 2.513 1.844 0.417 0.226 IIa11 HD 142666 145 7580 13.5 1.8 2.1 −0.162 1.761 0.222 0.126 IIa12 HD 144432 145 7345 10.2 1.8 2.0 −0.291 2.319 0.324 0.140 IIa13 HD 150193 150 8974 24.0 2.3 2.0 −0.957 1.654 0.212 0.128 IIa14 HD 163296 122 8730 24.0 2.0 2.2 0.763 2.827 0.286 0.101 IIa15 51 Oph 131 10000 245.0 2.0 5.1 −2.924 9.294 0.066 0.007 IIa16 HD 95881 118 8990 11.6 1.7 1.4 −1.971 2.719 0.203 0.074 IIb
Table 4. Flux ratios and infrared colors for selected models. The first sections contains the different AB Aur models shown inFig.1. The second section shows the values for the standard models with different small grain masses. The final section showsvalues derived from the models with a midplane layer of largegrains.
model Mdust i [12]-[60] FNIR/FFIR FNIR/F∗ FFIR/F∗M⊙
CGplus 5(−2) 65 2.158 1.680 0.273 0.162RADICAL 1(−3) 6 1.793 0.401 0.142 0.355RADICAL 1(−3) 65 1.671 0.802 0.206 0.256M0 1(−6) 50 0.08 1.60 0.156 0.097M1 3(−6) 50 0.61 1.26 0.164 0.130M2 1(−5) 50 1.01 1.00 0.167 0.167M3 3(−5) 50 1.24 0.86 0.173 0.202M4 1(−4) 50 1.41 0.74 0.177 0.239M5 5(−4) 50 1.34 0.63 0.190 0.303ML0 5(−4) 50 0.42 1.69 0.154 0.091ML1 5(−4) 50 0.72 1.27 0.161 0.127ML2 5(−4) 50 1.01 0.99 0.165 0.166ML3 5(−4) 50 1.31 0.89 0.173 0.194ML4 5(−4) 50 1.42 0.74 0.177 0.238
when we add a mid-plane layer of large (2 mm) grains inFig. 7.
Inclination In Figs. 2(b) and 6(b), the effect of changing theinclination on the spectrum of models with different dustmass is shown. Increasing the inclination from face-on tothe angle at which AV equals 0.1 (indicated by a triangle)enables more of the vertical inner rim to become visible.This causes the NIR flux to increase. Furthermore, increas-ing the inclination caused the outer part of the disk to ab-sorb an increasing amount of the inner rim radiation. Thisdecreases the NIR flux, and reddens the entire spectrummaking the IRASm12− m60 color increase. At extreme in-clination angles (> 80◦, not shown here), the reddeningbecomes so severe that the SED would no longer be classi-
fied as a (Lada-)class (Lada 1987) II source, but rather as aclass I source.
Power-law of Mass Distribution In Figs. 2(c) and 6(c), wecan observe the effect of changing the surface densitypower law. Steepening the power law while keeping thedisk mass the same, causes relatively more of the massto be on the inside of the disk. Between the shallowest(p = −1.0) and the steepest (p = −2.0) power law slope,the mass in the inner 1 AU increases by a factor of 46 andthe height of the inner rim by a factor of two. Having rel-atively more mass on the inside implies that there is lessmass on the outside where the FIR flux originates. Thusthe FIR flux decreases while the NIR flux increases andthe NIR/FIR ratio increases as the power-law slope steep-ens. In the higher mass models the mass in the outer disk
J. Meijer et al.: A parameter study of self-consistent disk models around Herbig AeBe stars 9
Fig. 6. Plot with van Boekel et al. (2003) diagrams, for variations of the most important parameters. In each panel, the dashedline representsLNIR/LFIR = (m12−m60)+0.9, the line used empirically to classify sources. The standard models which are shownin the first panel have an inclination of 50◦, a surface density distribution power law ofp = −1.5, an outer radius of 200 AU anda grain-size distribution ranging from 0.01 to 1µm. The parameter varied in each panel is:a) dust mass Dust mass increases tothe right. The grey line connects the five standard models andone optically thin model that lies outside the diagram. Thislineis present in all panels.b) Inclination The standard models are at the average inclination of 50◦. Inclination increases along thecurve from the bottom to the right. The triangle in each curveindicates an AV of 0.1 mag, the point when the outer disk starts tosignificantly absorb the radiation coming from the inner rim. c) index of power law of mass distribution The power law becomesshallower from top to bottom.d) disk size. e) minimum grain size. f) maximum grain size. g) Stellar luminosity. h) Carbon-Silicateratio.
region is colder and emits mainly redward of 20µm. Thedecrease in FIR flux blue-shifts the IRASm12 − m60 colorvalue.
Outer Radius In Figs. 2(d) and 6(d), the effect of an increas-ing outer disk radius is shown. Increasing the disk sizewhile keeping the dust mass the same causes more of themass to be on the outside and less on the inside. However,
the mass is redistributed far less significantly than whenthe power-law slow is altered. The mass in the inner AUreduces by only a factor of two and the mass on the outsideshows no significant increase. To achieve a similar redistri-bution of mass as in the power-law models, we would haveto increase the disk size to 4× 10⁵ AU. The position of themodels in the diagram would then hardly change.
10 J. Meijer et al.: A parameter study of self-consistent disk models around Herbig AeBe stars
Fig. 7. IRAS m12 − m60 colour versusLNIR/LFIR diagram withtwo different grids of models. Models ML0 to ML5 contain amid-plane layer of large grains. The properties of this layer canbe seen in table 2. Models M0–M5 are the original models, towhich the mid-plane layer was added.
Minimum grain size In Figs. 2(e) and 6(e), the effect of in-creasing the lower limit on of the grain-size distribution isshown. Because of them = −3.5 power-law slope in thesize distribution we use, most mass is in the largest grains.Increasing the minimum grain size therefore has little effecton the SED. The small grains emit mostly in the 10-20µmwavelength range. This affects the FIR flux and the 12µmIRAS color, and the NIR/FIR and the IRASm12−m60 colortherefore increase.
Maximum grain size In Figs. 2(f) and 6(f), the effect of in-creasing the upper limit on the grain-size distribution isshown. By increasing the upper boundary of the sizedistribution power law while keeping the lower bound-ary constant, mass is extracted from the population ofsmaller grains and placed into the larger ones. Large grainshave lower opacity (absorption cross sectionper mass).Consequently, the overall IR flux decreases and the 10µmand 20µm features reduce in strength. The FIR flux de-creases more rapidly than the NIR flux because the outerparts of the disk become optically thin (leading to weakerflaring), while the inner parts hardly change in structure.Beyond 60µm, the flux increases as more and more coldmaterial is revealed. However, when the maximum grainsize exceeds 10µm, the flux also decreases in this part ofthe SED because the decrease in opacity becomes signifi-cant. This effect causes the reversal in the IRASm12 − m60
color.Stellar luminosity In Figs. 2(g) and 6(g), we show the effect
of varying the stellar luminosity. Changing the stellar lu-minosity influences the spectra in two ways. The inner rimbecomes much less pronounced in the calculations for astar withL⋆ = 10L⊙, an effect already noted by DDN01.At the same time, the low-luminosity object contains moreflux at long wavelengths, between 60 and 100µm. In partic-ular, this effect leads to a horizontal shift in the diagnosticcolor-color plot.
Carbon/silicate ratio In Figs. 2(h) and 6(h), the effect ofvarying the carbon/silicon mass ratio in the dust opacitycalculations is shown. It is immediately clear that this ef-fect is minor and hardly affects the general shape of the
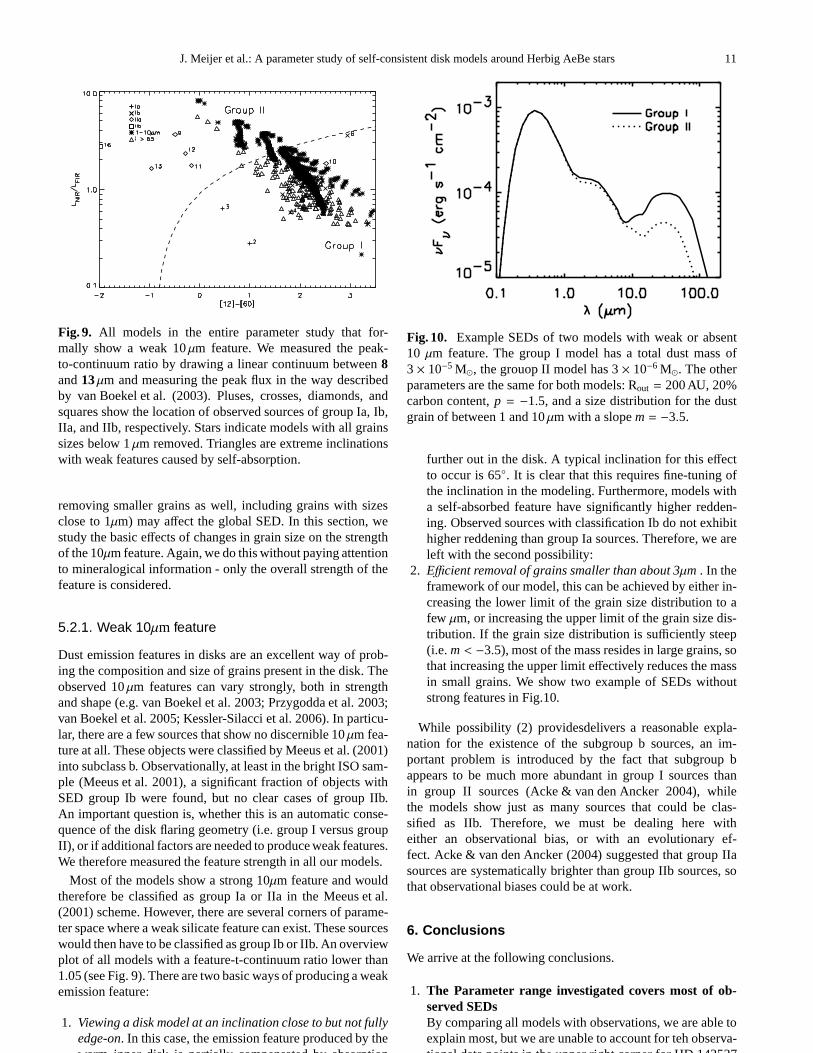
Fig. 8. Effect of the strength of the inner rim on the positionof a source in the color-color diagram. The diagram shows thelocations of the measured SED of AB Aurigae, of the D03 fitusing the DDN model, and of face-on and 65◦ SEDs of the newmodel, computed for the same disk parameters.
SED. We will discuss in a companion paper (Meijer et al2007, submitted to A&A) how this is an important param-eter in terms of the strength of the 10µm feature. However,for the SED shape as probed by our diagnostic diagram,the carbon content has little or no effect. SInce the additionof carbon increases the continuum level, both the NIR andFIR flux increase at the same rate, so that the ratio does notchange. Since the slope between 12µm and 60µm hardlychanges, also the IRASm12−m60 color remains unchanged.
5. Discussion
5.1. Effects of the weak inner rim
In Sect. 2.3 we demonstrated that the inner rim emission in thenew models is systematically weaker than in the simpler DDNmodels. In Table 4, we quantify this result. Looking at the fluxratios derived from observed SEDs (see table 3), we can seethat the rim emission (the near-IR flux, listed in Col. 10) ac-counts for the reprocessing of typically 20-30% of the stel-lar luminosity. In the models, the typical value is 15-17% andvaries only weakly with disk properties. Clearly, this shouldalso have a systematic effect on the diagnostic diagram. Infig.8, the infrared colors of AB Aur are compared with modelpredictions. Clearly, the difference is mainly a shift in the ratioof NIR to FIR luminosity in the disk. Taking this into account,it is unsurprising that our model predictions are below the datapoints of the observations.
5.2. Effects of moderate dust growth
An important part of our parameter study has been consideringthe effects of moderate dust growth, i.e. either extending theupper limit of the size distribution from 1µm to values of upto 25µm, or the complete removal of small grains, modeledby shifting up the lower boundary of the size distribution. InSect. 4.3 we found that removing grains below 1µm has onlya small effect on the structure of the models, while shiftingthe upper boundary of the size distribution (and in this way
J. Meijer et al.: A parameter study of self-consistent disk models around Herbig AeBe stars 11
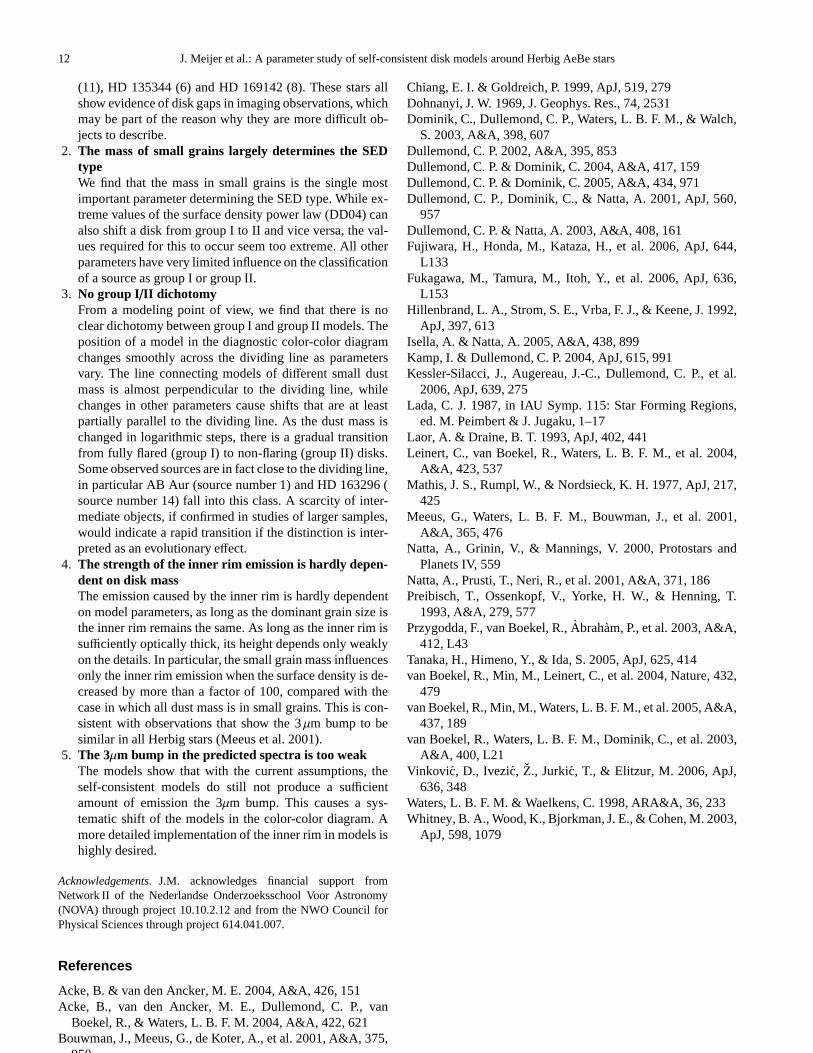
Fig. 9. All models in the entire parameter study that for-mally show a weak 10µm feature. We measured the peak-to-continuum ratio by drawing a linear continuum between8and13 µm and measuring the peak flux in the way describedby van Boekel et al. (2003). Pluses, crosses, diamonds, andsquares show the location of observed sources of group Ia, Ib,IIa, and IIb, respectively. Stars indicate models with all grainssizes below 1µm removed. Triangles are extreme inclinationswith weak features caused by self-absorption.
removing smaller grains as well, including grains with sizesclose to 1µm) may affect the global SED. In this section, westudy the basic effects of changes in grain size on the strengthof the 10µm feature. Again, we do this without paying attentionto mineralogical information - only the overall strength ofthefeature is considered.
5.2.1. Weak 10µm feature
Dust emission features in disks are an excellent way of prob-ing the composition and size of grains present in the disk. Theobserved 10µm features can vary strongly, both in strengthand shape (e.g. van Boekel et al. 2003; Przygodda et al. 2003;van Boekel et al. 2005; Kessler-Silacci et al. 2006). In particu-lar, there are a few sources that show no discernible 10µm fea-ture at all. These objects were classified by Meeus et al. (2001)into subclass b. Observationally, at least in the bright ISOsam-ple (Meeus et al. 2001), a significant fraction of objects withSED group Ib were found, but no clear cases of group IIb.An important question is, whether this is an automatic conse-quence of the disk flaring geometry (i.e. group I versus groupII), or if additional factors are needed to produce weak features.We therefore measured the feature strength in all our models.
Most of the models show a strong 10µm feature and wouldtherefore be classified as group Ia or IIa in the Meeus et al.(2001) scheme. However, there are several corners of parame-ter space where a weak silicate feature can exist. These sourceswould then have to be classified as group Ib or IIb. An overviewplot of all models with a feature-t-continuum ratio lower than1.05 (see Fig. 9). There are two basic ways of producing a weakemission feature:
1. Viewing a disk model at an inclination close to but not fullyedge-on. In this case, the emission feature produced by thewarm inner disk is partially compensated by absorption
Fig. 10. Example SEDs of two models with weak or absent10 µm feature. The group I model has a total dust mass of3× 10−5 M⊙, the grouop II model has 3× 10⁻⁶ M⊙. The otherparameters are the same for both models: Rout = 200 AU, 20%carbon content,p = −1.5, and a size distribution for the dustgrain of between 1 and 10µm with a slopem = −3.5.
further out in the disk. A typical inclination for this effectto occur is 65◦. It is clear that this requires fine-tuning ofthe inclination in the modeling. Furthermore, models witha self-absorbed feature have significantly higher redden-ing. Observed sources with classification Ib do not exhibithigher reddening than group Ia sources. Therefore, we areleft with the second possibility:
2. Efficient removal of grains smaller than about 3µm . In theframework of our model, this can be achieved by either in-creasing the lower limit of the grain size distribution to afew µm, or increasing the upper limit of the grain size dis-tribution. If the grain size distribution is sufficiently steep(i.e.m < −3.5), most of the mass resides in large grains, sothat increasing the upper limit effectively reduces the massin small grains. We show two example of SEDs withoutstrong features in Fig.10.
While possibility (2) providesdelivers a reasonable expla-nation for the existence of the subgroup b sources, an im-portant problem is introduced by the fact that subgroup bappears to be much more abundant in group I sources thanin group II sources (Acke & van den Ancker 2004), whilethe models show just as many sources that could be clas-sified as IIb. Therefore, we must be dealing here witheither an observational bias, or with an evolutionary ef-fect. Acke & van den Ancker (2004) suggested that group IIasources are systematically brighter than group IIb sources, sothat observational biases could be at work.
6. Conclusions
We arrive at the following conclusions.
1. The Parameter range investigated covers most of ob-served SEDsBy comparing all models with observations, we are able toexplain most, but we are unable to account for teh observa-tional data points in the upper right corner for HD 142527
12 J. Meijer et al.: A parameter study of self-consistent disk models around Herbig AeBe stars
(11), HD 135344 (6) and HD 169142 (8). These stars allshow evidence of disk gaps in imaging observations, whichmay be part of the reason why they are more difficult ob-jects to describe.
2. The mass of small grains largely determines the SEDtypeWe find that the mass in small grains is the single mostimportant parameter determining the SED type. While ex-treme values of the surface density power law (DD04) canalso shift a disk from group I to II and vice versa, the val-ues required for this to occur seem too extreme. All otherparameters have very limited influence on the classificationof a source as group I or group II.
3. No group I/II dichotomyFrom a modeling point of view, we find that there is noclear dichotomy between group I and group II models. Theposition of a model in the diagnostic color-color diagramchanges smoothly across the dividing line as parametersvary. The line connecting models of different small dustmass is almost perpendicular to the dividing line, whilechanges in other parameters cause shifts that are at leastpartially parallel to the dividing line. As the dust mass ischanged in logarithmic steps, there is a gradual transitionfrom fully flared (group I) to non-flaring (group II) disks.Some observed sources are in fact close to the dividing line,in particular AB Aur (source number 1) and HD 163296 (source number 14) fall into this class. A scarcity of inter-mediate objects, if confirmed in studies of larger samples,would indicate a rapid transition if the distinction is inter-preted as an evolutionary effect.
4. The strength of the inner rim emission is hardly depen-dent on disk massThe emission caused by the inner rim is hardly dependenton model parameters, as long as the dominant grain size isthe inner rim remains the same. As long as the inner rim issufficiently optically thick, its height depends only weaklyon the details. In particular, the small grain mass influencesonly the inner rim emission when the surface density is de-creased by more than a factor of 100, compared with thecase in which all dust mass is in small grains. This is con-sistent with observations that show the 3µm bump to besimilar in all Herbig stars (Meeus et al. 2001).
5. The 3µm bump in the predicted spectra is too weakThe models show that with the current assumptions, theself-consistent models do still not produce a sufficientamount of emission the 3µm bump. This causes a sys-tematic shift of the models in the color-color diagram. Amore detailed implementation of the inner rim in models ishighly desired.
Acknowledgements. J.M. acknowledges financial support fromNetwork II of the Nederlandse Onderzoeksschool Voor Astronomy(NOVA) through project 10.10.2.12 and from the NWO Council forPhysical Sciences through project 614.041.007.
References
Acke, B. & van den Ancker, M. E. 2004, A&A, 426, 151Acke, B., van den Ancker, M. E., Dullemond, C. P., van
Boekel, R., & Waters, L. B. F. M. 2004, A&A, 422, 621Bouwman, J., Meeus, G., de Koter, A., et al. 2001, A&A, 375,
950
Chiang, E. I. & Goldreich, P. 1999, ApJ, 519, 279Dohnanyi, J. W. 1969, J. Geophys. Res., 74, 2531Dominik, C., Dullemond, C. P., Waters, L. B. F. M., & Walch,
S. 2003, A&A, 398, 607Dullemond, C. P. 2002, A&A, 395, 853Dullemond, C. P. & Dominik, C. 2004, A&A, 417, 159Dullemond, C. P. & Dominik, C. 2005, A&A, 434, 971Dullemond, C. P., Dominik, C., & Natta, A. 2001, ApJ, 560,
957Dullemond, C. P. & Natta, A. 2003, A&A, 408, 161Fujiwara, H., Honda, M., Kataza, H., et al. 2006, ApJ, 644,
L133Fukagawa, M., Tamura, M., Itoh, Y., et al. 2006, ApJ, 636,
L153Hillenbrand, L. A., Strom, S. E., Vrba, F. J., & Keene, J. 1992,
ApJ, 397, 613Isella, A. & Natta, A. 2005, A&A, 438, 899Kamp, I. & Dullemond, C. P. 2004, ApJ, 615, 991Kessler-Silacci, J., Augereau, J.-C., Dullemond, C. P., etal.
2006, ApJ, 639, 275Lada, C. J. 1987, in IAU Symp. 115: Star Forming Regions,
ed. M. Peimbert & J. Jugaku, 1–17Laor, A. & Draine, B. T. 1993, ApJ, 402, 441Leinert, C., van Boekel, R., Waters, L. B. F. M., et al. 2004,
A&A, 423, 537Mathis, J. S., Rumpl, W., & Nordsieck, K. H. 1977, ApJ, 217,
425Meeus, G., Waters, L. B. F. M., Bouwman, J., et al. 2001,
A&A, 365, 476Natta, A., Grinin, V., & Mannings, V. 2000, Protostars and
Planets IV, 559Natta, A., Prusti, T., Neri, R., et al. 2001, A&A, 371, 186Preibisch, T., Ossenkopf, V., Yorke, H. W., & Henning, T.
1993, A&A, 279, 577Przygodda, F., van Boekel, R.,Abraham, P., et al. 2003, A&A,
412, L43Tanaka, H., Himeno, Y., & Ida, S. 2005, ApJ, 625, 414van Boekel, R., Min, M., Leinert, C., et al. 2004, Nature, 432,
479van Boekel, R., Min, M., Waters, L. B. F. M., et al. 2005, A&A,
437, 189van Boekel, R., Waters, L. B. F. M., Dominik, C., et al. 2003,
A&A, 400, L21Vinkovic, D., Ivezic, Z., Jurkic, T., & Elitzur, M. 2006, ApJ,
636, 348Waters, L. B. F. M. & Waelkens, C. 1998, ARA&A, 36, 233Whitney, B. A., Wood, K., Bjorkman, J. E., & Cohen, M. 2003,
ApJ, 598, 1079