J. - Lehigh University
44
PRESTRESSING THE NEGATIVE MOMENT REGION OF COMPOSITE BEAMS by F. W. Sarnes J. Hartley Daniels This research was conducted by Fritz Engineering Laboratory Lehigh University for Pennsylvania Department of Transportation in co-operation with the Federal Highway Administration The op1n1ons, findings and conclusions expressed in this publication are those of the authors and not necessarily those of the Pennsylvania Depart- ment of Transportation or the Federal Highway Administration. Fritz Engineering Laboratory Department of Civil Engineering Lehigh University Bethlehem, Pennsylvania August 1971 Fritz Engineering Laboratory Report No. 359.7
Transcript of J. - Lehigh University

PRESTRESSING THE NEGATIVE MOMENT REGION
OF COMPOSITE BEAMS
by
F. W. Sarnes
J. Hartley Daniels
This research was conducted by
Fritz Engineering Laboratory
Lehigh University
for
Pennsylvania Department of Transportation
in co-operation with the
Federal Highway Administration
The op1n1ons, findings and conclusions expressed in this publication are those of the authors and not necessarily those of the Pennsylvania Department of Transportation or the Federal Highway Administration.
Fritz Engineering Laboratory Department of Civil Engineering
Lehigh University Bethlehem, Pennsylvania
August 1971
Fritz Engineering Laboratory Report No. 359.7

ABSTRACT
Two simply supported steel-concrete beams with pre
stressed slabs designated PSC-18 and PSC-28 were tested under
negative moment (slab in tension). ·These beams were designed to
simulate the prestressed negative moment region of a two-span
continuous composite beam. Each of the simple span beams had
a span length of 15r-on. The cross section of each beam con-
sis ted of a 6-in. x 60-in. reinforced concrete slab connected
to a W2lx62 rolled steel beam by 4-in. high .bY 3/4 in. diameter
head steel studs. The stud connectors were attached to the
steel beams in two patterns; concentrated groups and equall~
spaced.
A prestress force was applied to the slab of each beam
by means of four 7/8-in. diameter STRESSTEEL bars placed in
four thin steel tubes which were cast into the slab. In one
beam the prestress force was applied prior to making the shear
connection while in the other the prestress force was applied
after the shear connection was made.
The purpose of this investigation was two fold:
(1) To study the effect of prestressing on the behavior
of composite beams under negative moment.
(2) To compare the effectiveness of concentrated
groups to stud connectors with equally spaced
connectors. ii.
I~
359.7 iii.
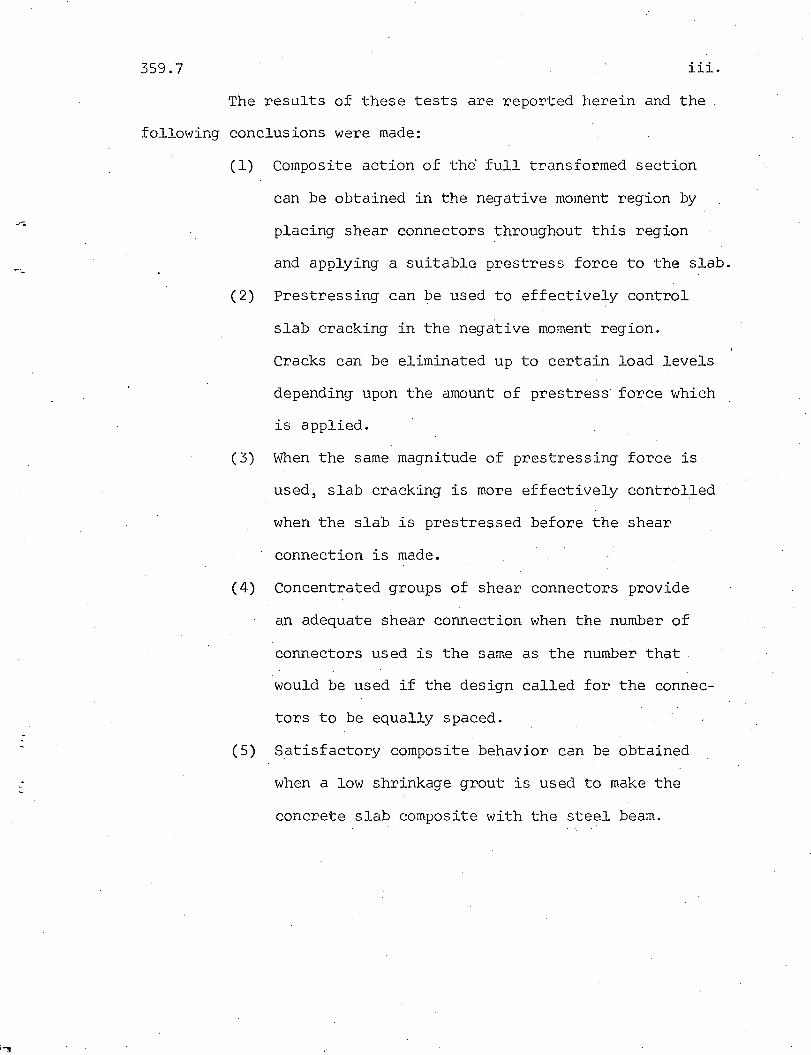
The results of these tests are reported herein and the
following conclusions were made:
( l) Composite action of the· full transformed section
( 2)
can be obtained in the negative moment region by
placing shear connectors throughout this region
and applying a suitable prestress force to the slab.
Prestressing can be used to effectively control
slab cracking in the negative moment region.
Cracks can be eliminated up to certain load levels
depending upon the amount of prestress force which
is applied.
(3) When the same magnitude of prestressing force is
used, slab cracking is more effectively controlled
when the slab is prestressed before the shear
connection is made.
(4) Concentrated groups of shear connectors provide
an adequate shear connection when the number of
connectors used is the same as the number that .
would be used if the design called for the connec
tors to be equally spaced.
(5) Satisfactory composite behavior can be obtained ·
when a low shrinkage grout is used to make the
concrete slab composite with the steel beam.
359.7 iv.
TABLE OF CONTENTS
Page
.... ABSTRACT ii
........ l. INTRODUCTION 1
2. TEST BEAMS, INSTRUMENTATION AND TESTING PROCEDURE 7
2.1 Description of Test Beams 7
2.2 Design Criteria 8
2.3 Design Details and Fabrication 9
2.4 Construction 10
2.5 Properties of the Test Beams 12
2.6 Instrumentation 13
2.7 Prestressing, Test Procedure and Loading 15
3. TEST RESULTS 17
3.1 Load-Deflection Behavior 17
3.2 Slip 19
3.3 Cracking Behavior 21
3.4 Failure Mode 23 . -
4. SUMMARY AND CONCLUSIONS 24 . --
5. ACKNOWLEDGEMENTS 26
6. TABLES AND FIGURES 27
7. REFERENCES 39
1. INTRODUCTION
Two developments which have recently appeared in the
design of bridge superstructures are the frequent use of continu
ity and the increasing use of composite action between the con
crete deck and the steel beams. Both of these developments have
resulted from the necessity for a more efficient and economical
use of materials.
Until now, attempts to combine both continuity and
composite construction have been frustrated by the lack of suit-·
able methods of analysis and specific design recommendations and
specifications. Previous designs could lead to premature fatigue
failure of shear connectors near the dead load points of inflec
tion and undesirable cracking of the deck in the negative moment
(slab in tension) regions of continuous composite bridge beams.
Recent research at Fritz Engineering Laboratory has
concentrated on providing suitable analytical and design recommen
dations which would result in satisfactory designs based on static
and fatigue criteria and minimize slab cracking.C 1 ' 2' 3 ' 4 ' 5)
Although full-scale tests indicate that these recommendations
will result in improved structural behavior of the superstructure,
several problems still remain. Some transverse cracking of the
concrete deck in the negative moment regions will always occur
whether or not connectors are placed continuously throughout
1.

~·
359.7 2.
those regions. Fatigue criteria will likely reduce the allowable
stress in the tension flange of the s~eel beam if connectors are
placed continuously throughout the negative moment regions. In
addition, the full slab in the negative moment regions is not
effective in resisting live loads as it is in the positive moment
regions.
At an early stage in the research it was realized that
all three of these problems might be overcome by longitudinal
prestressing of the negative moment regions. Transverse cracking
of the slab would be eliminated over a certain range of live
loads depending upon the level of prestress. With prestressing,
the full slab would become effective in resisting live loads.
This has two beneficial effects. First, real continuity is
achieved when connectors are placed continuously throughout the
beam, resulting in more efficient use of materials. Secondly,
the position of the neutral axis in the negative moment regions
can be controlled by the designer thus making it possible to
eliminate the reduction of the allowable stress in the tension
flange of the steel beam due to fatigue considerations.
With prestressing of the negative moment regions,
however, additional questions are encountered which require
further consideration before this procedure can be recommended
for design. For instance, there are several ways to prestress
the concrete slab depending upon the method and stage of
construction. One construction method might be to cast the
359.7
slab compositely with the steel beams in the usual way and to
prestress after the slab has reached its desired strength. A
3.
second construction method might be to cast the slab non-compositely
with the steel beams, prestress the slab, and then make the slab
composite with the steel beams.
There are several ways the shear connection could be
made after the slab is prestressed. For instance, holes could
be left in the slab through which connectors could be welded to
the steel beam and then grouted into the slab. The holes could
either be made small enough to receive individual connectors or
large enough to receive a concentrated group of connectors. The
connector groups could then be spaced a certain distance ap~rt.
Still a third construction method may be to use trans
verse precast slab elements in the negative moment regions which
are prestressed in the longitudinal bridge direction either
before or after these elements are made composite with the steel
beams.
With this method, it is likely that the connectors
would be grouped or concentrated into spaced out connector
groups. Full width precast elements could be placed transversely
across the beams between the connector groups. Shorter elements
spanning across only two beams could be used adjacent to connector
groups. The precast elements would be prestressed in the longi
tudinal direction of the bridge either before or after grouting
of the connector groups.

--
359.7 4.
The particular construction method used would probably
depend on such factors as relative economies, structural advantages
and ease of construction.
A pilot investigation was undertaken at Fritz Engineer
ing Laboratory to determine the feasibility of prestressing the.
slab in the negative moment region of continuous composite bridge
beams and to evaluate two methods of providing the required shear
connection; ie: equally spaced connector pairs and concentrated
connector groups spaced apart. The investigation was primarily
designed to provide analytical and experimental evaluation of the
. first two methods of construction mentioned above which do not
involve precast slab elements. However, the experiments were
designed to provide useful information applicable to prestressed
precast slab elements.
Two composite test beams designated PSC-lS and PSC-2S
were designed and constructed to simulate the negative moment
region of a prismatic two-span continuous composite Tee-beam
having the same span lengths and load positions as the beams
previously described in Refs. 1, 2, 4 and 6. Except for the
length of each test beam and the slab prestressing and reinforc
ing details, each beam was constructed identical to the beams
previously described in Refs. 7 and 8. They were also tested in
the same manned (slab in tension) so that comparative studies
could be made. The shear connection for each test beam was
identical and consisted of equally spaced pairs of stud

359.7
connectors to one side of the central load position and an
equal number of studs placed in three·concentrated stud groups
on the other side of the load position.
s.
Preliminary studies using computer programs previously
developed and reported in Ref. 4 were used to predict the behavior
of the beam with the different stud arrangements on either side
of the central load position. The design of the studs was partly
based on an attempt to ensure zero slip at the load position so
that each shear span would behave independently. This same
condition would be expected for test beams with symmetrically
placed connectors.
The major difference between the two test beams was in
the procedure for making the prestressed slab composite with the
steel beam. For beam P8C-18, the concrete slab was cast and
made composite with the steel beam in the usual way. After the
concrete had reached the desired strength the slab was prestressed.
Therefore, the transformed section resisted the prestress force
and the applied test loads. For beam P8C-28 the connectors were
isolated during casting and prestressing of the slab. The
connectors were then grouted so that the transformed section
would resist only the applied test loads.
The design and construction of the two test beams
therefore enabled an evaluation of the test results to be made
within one of four categories as follows:

359.7 6.
1. Prestressing after obtaining composite action;
equally spaced shear connectors,
2. Prestressing before obtaining composite action;
equally spaced shear connectors,
3. Prestressing after obtaining composite action;
grouped shear connectors, and
4. Prestressing before obtaining composite action;
grouped shear connectors.
The results obtained with grouped shear connectors are
particularly useful in evaluating construction methods employing
prestressed-precast slab elements since some grouping of shear
connectors is envisioned with such a scheme.
This report documents the results of tests of beams
P8C-18 and P8C-28 and presents a discussion of some of the more
significant results.

•
. ·
359.7 7.
2. TEST BEA~B, INSTRUMENTATION AND
TESTING PROCEDURE
2.1 Description of Test Beams
Figure 1 describes the ~wo test beams, PSC-lS and
PSC-2S. Each test beam was constructed as shown in Fig. lc to
simulate the negative moment region of a two-span prismatic
continuous composite beam shown in Fig. la. The bending moment
diagram for the two-span beam corresponding to the slab prestress
force F and the applied loads P is shown in Fig. lb. The maximum
positive and negative bending moments are shown as M1 and M2
respectively. For the two test beams shown in Fig. lc the slab
prestress force is F and the test loads are shown as V and are
applied at the theoretical dead load inflection points of the two
span beam. A typical cross-section of the test beams is shown
in Fig. ld (also the same for the two-span beam).
Each test beam consisted of a 60-in. wide by 6-in.
thick reinforced concrete slab connected to a W2lx62 (A36) rolled
steel beam by 3/4 in. x 4 in. headed steel stud shear connectors .
The location of the stud connectors is shown in Fig. 2 and described
in detail later in this chapter (Art. 2.3). A prestress force
· was applied to the concrete slab of each beam by tensioning four
7/8 in. diameter regular grade STRESSTEEL bars centered in 1-3/8 in.
diameter thin steel tubes as shown in Fig. ld. The transverse
slab reinforcement consisted of No. 5 reinforcing bars at 6-in.
359.7 8.
. (1 6 7) spacing top and bottom as described in previous reports. ' '
Each beam had an overall length of 17 1 -0". This length
included the 15'-0" negative moment region between dead load
inflection points of the two span continuous beam and a 12-in.
projection on each end as shown in Fig. lc.
2.2 Design Criteria
The design of the two test beams PSC-18 and PSC-28 was
based on the design of the two-span continuous composite beam
shown in Fig. la. Both the static and the fatigue design criteria
were considered.C 9) The resulting design, except for the slab
prestress and the shear connection continuous through the negative
moment region, was essentially the same as for those beams
reported earlier.Cl, 6 , 7 )
Previously, with no slab prestress in the negative
moment region of the two-span composite beam, the design of the
shear connectors was controlled by fatigue requirements based
on a working load P of 60 kips and a life of 2,000,000 cycles.Cl)
The working load level was determined by the allowable·stress in
the steel beam.(l)
On the assumption that slab prestress would be used
primarily to eliminate transverse slab cracking under at least
the working live loads, the prestress force F (Fig. la) was
determined on the basis that the previously obtained working

•
..
359.7 9.
.load level P of 60 kips would remain constant and that at the
working load level, the total stress in the slab over the interior
support would be equal to zero. The resulting design was checked
to ensure that the stress in the steel beam and the remaining
concrete slab under P and F was equal to or less than the allow-
able stress. Assuming that for the steel beam F = 36 ksi and y
for the concrete slab f' = 5 ksi, the prestress force F was c
found to be 250 kips. It was also assumed that this prestress
force would be applied to the continuous composite beam at the
dead load inflection points as shown in Fig. la.
Therefore, for test beam P8C-18, which was made com-
posite before prestressing, the prestress force of 250 kips was
applied, as shown in Fig. lc, prior to testing. For test beam
P8C-28 which was made composite after pre.stressing it was decided
to maintain the same value of prestress force in the slab; ie:
F = 250 kips.
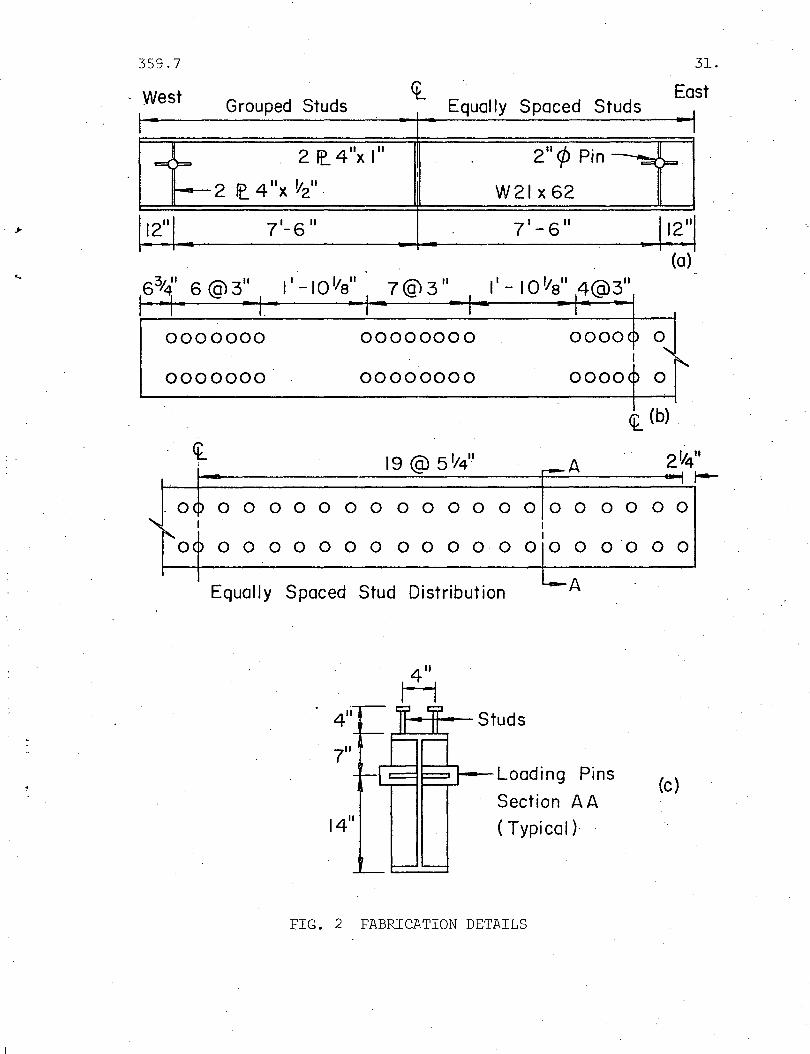
2.3 Design Details and Fabrication
Fabrication details for test beams PSC-18 and P8C-28
are shown in Fig. 2. The rolled steel beams were cut from a
43-ft. length by a local fabricator. The bearing stiffeners and \
headed stud shear connectors shown in Fig. 2a and 2b were also
welded to the beams by the fabricator. The excess length of the
rolled shape was used for control test purposes and to test the
stud welds. The welding procedure is described in Ref. ·7 and
the inspection procedure is outlined in Ref. 10.

359.7 10.
Figure 2b shows the distribution of stud shear connectors
for the two test beams. On one half of each beam the connectors
were equally spaced in pairs along the top flange of the steel
section. On the other half the connectors were arranged in
concentrated groups. Each half of the beam contained the same
number of stud connectors since the shear transfer requirements
were the same for each half. This arrangement made it possible
to study the effects of the two connector patterns and observe
any differences. A typical cross section of the fabricated
steel beam with connectors, stiffeners and loading pins is shown
in Fig. 2c. The details for the stiffeners and loading pins
were the same as in previous tests.< 7 )
2.4 Construction
Figure 3 shows the slab formwork with the transverse
reinforcement and steel tubes for the 8TRE88TEEL bars in place
for beam P8C-28. · Beam P8C-18 was identical with the exception
that there was no formwork around the connectors. The connectors
in beam P8C-28 were formed out so that the beam would remain non-
composite while the slab was cast and prestressed for the reasons
previously mentioned (see end of Chapter 1). As shown in Fig. 3
extra top and bottom transverse reinforcement was placed at each
end of the test beams to provide additional anchorage for the
prestressing.
Two concrete mixes were used in the construction of
359.7 11.
these beams. The first mix was proportioned and transit mixed
for a 28 day compressive strength of ~000 psi with a slump of
3~1/2 in. This concrete was used in lieu of the 5000 psi con
crete used in design so that a better comparison could be made
with the results of previous tests for which 3000 psi concrete
was also used for the slab of the test beams.C 6 , 7) A second
mix used as a grout for beam P8C-28 was proportioned for a 28
day compressive strength of 6000.psi with a slump of 1 in. and
was mixed in a mechanical mixer in the laboratory.
Test beam P8C-l8 was poured in one operation using the
transit mixed 3000 1psi concrete. Beam P8C-28 was also poured
using the same concrete mix with the exception of the areas
surrounding the stud connectors which were boxed out as shown
in Fig. 3. After the slab of beam P8C-28 was prestressed, con
crete made from the 6000 psi mix was placed in the voids around
the connectors. This high strength, low slump mix was used to
obtain a minimal amount of shrinkage.
Consolidation of the concrete on all of the pours was
accomplished by internal vibration and the final finish was
obtained by hand trowelling. The various pours took place on
different days and control cylinders were made for each pour.
Twelve cylinders were prepared from each batch of the transit
mix concrete while eight cylinders were made from the high
strength mix. In all cases half of the cylinders were made at
the beginning of the pour and half at the end.

359.7 12.
The concrete in the slabs was moist cured for seven
days by covering the exposed surface with wet burlap and a poly
ethylene sheet. The forms were stripped at the end of the moist
curing period and the slabs were allowed to cure under dry condi
tions until the beams were tested. Testing of each beam occurred
approximately two months after the initial pouring of the slab.
A number of control cylinders from each pour were cured in the
same manner as the slab while the remainder were cured as pre
scribed by ASTM(ll) (see Table 2).
2.5 Properties of the Test Beams
A test program was conducted to determine the mechani
cal properties of the materials used in the test beams. Proper
ties of the structural steel were determined using tensile
coupons cut from the excess lengths of the rolled beam (Art. 2.3).
These coupons were tested according to the procedures outlined
in Ref. 12. The mechanical properties of the rolled steel beam
are shown in Table 1.
The concrete used for the slabs of the test beams was
made of type 1 Portland cement, gravel crushed to a maximum size
of 3/4 in. as coarse aggregate and natural bank sand as fine
aggregate. Control cylinders were made for each batch of
concrete (Art. 2.4). The results of the compression tests on
these cylinders are shown in Table 2.
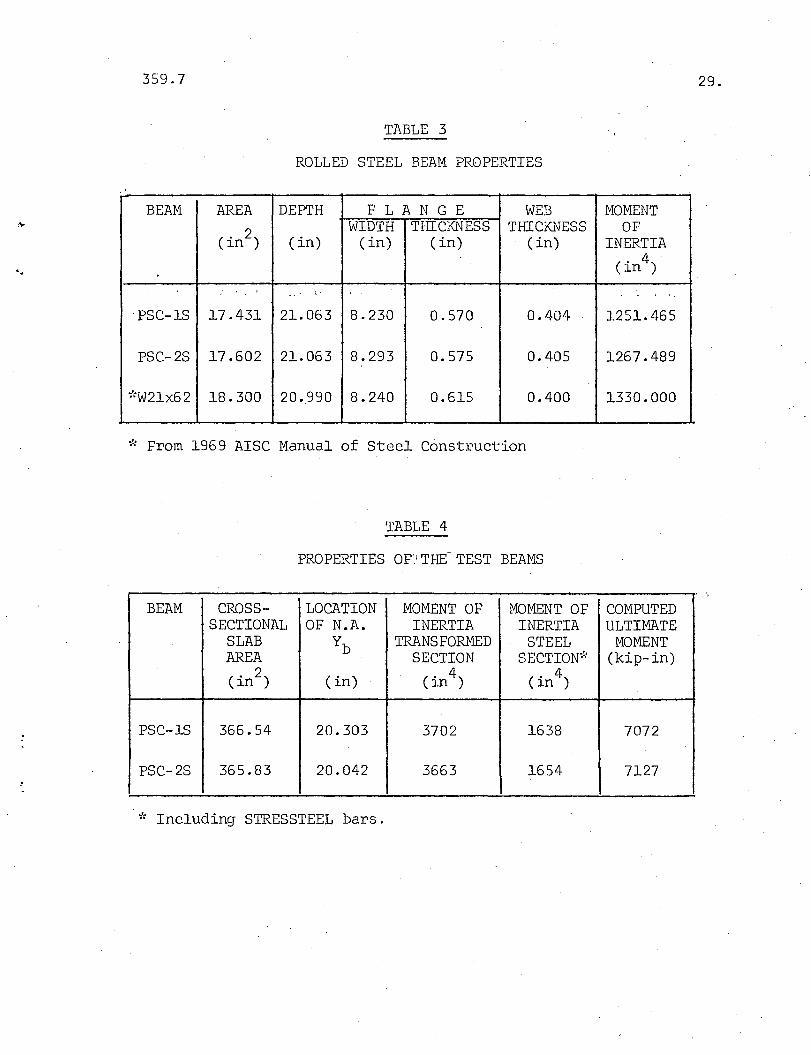
The physical. dimensions of the test beams were obtained

....
359.7 13.
and the cross-sectional properties determined. The calculated
properties are shown in Tables 3 and 4. In Table 3 the calculated
properties for the rolled shapes are compared with the standard
properties tabulated in the 1969 AISC Manual of Steel Construction •
. '.',
2.6 Instrumentation
The instrumentation for test beams PSC-lS and PSC-2S
was identical except that beam PSC-lS had strain gages mounted
on the concrete slab while beam PSC-2S did not. Instrumentation
details are shown in Figs. 4 and 5. A combination of electrical
resistance strain gages, calibrated electrical slip gages and
mechanical dial gages was used.
Figure 4 shows a detail view of one of the calibrated
electrical slip gages. A 2-'in. x 2-in. angle bolted to the
underside of the concrete slab provides support for a small screw
which bears against a metal strip which is secured to the top
flange of the steel beam. Slip between the slab and the steel
beam causes bending of the metal strip. Electrical resistance
strain gages mounted on the metal strip convert the bending
strain in the extreme fibres of the strip to deflection at the
screw tip by means of calibration curves.
A mechanical dial gage used to measure slip at the
ends of the beam, and to provide a check on the nearest electrical
slip gage, is also shown in Fig. 4.
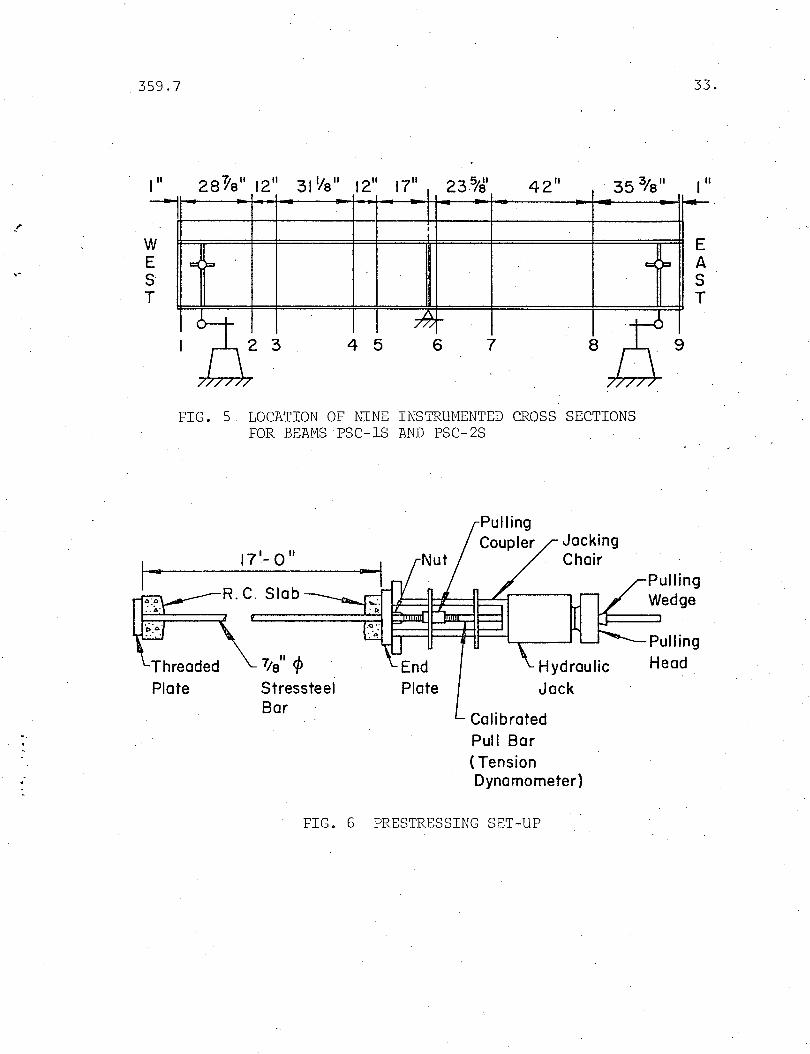
359.7 M.
Figure 5 shows the locations of the nine instrumented
cross sections used for both test beam$. For both beams electri
cal slip gages were located at all nine locations. Ten strain
gages were also mounted around the steel beam cross-section at
each of the locations except 1, 6 and 9. The position of each of
the ten gages on the cross-section of the beams is the same as
in previous tests. They are shown in Fig. 4 of Ref. 7.
Test beam PSC-lS also had additional strain gages
mounted on the concrete slab at locations 2, 3, 4, 5, 7, and 8.
Locations 5 and 8 had a total of eight strain gages mounted on
the concrete. At these locations, strain gages were mounted on
the surface of the slab directly above and below each of the
STRESSTEEL bars. At the remaining locations gages were mounted
above and below only the' two interior STRESSTEEL bars.
One of the interior STRESSTEEL bars was strain gaged
for each beam in order that the prestressing force could be
monitored throughout the test. The vertical deflection at each
end of the test beams was measured by means of Ames 0.001 in.
mechanical dial gages.
The recording equipment consisted of a B and F 100
channel automatic strain recorder and a Budd Datran unit to read
the electrical resistance strain gages. A fifty power microscope
was also used to measure the width of the cracks which developed
in the concrete slab near the end of the test.
359.7 15.
2.7 Prestressing, Test Procedure and Loading
The four 7/8- in. diamet·er STRESSTEEL bars were pre
stressed to the desired level by means of the jacking system
shown in Fig. 6. The system consisted of a fifty ton Simplex
hydraulic jack with a jacking chair and a calibrated pull bar
with a coupler, pulling head and wedge. The pull bar was instru
mented and calibrated to measure the applied tensioning force.
The prestressing operation was carried out in the
following manner:
The pull bar was connected to the STRESSTEEL bar and
the 50 ton jack with chair was placed over the pull bar and
against the end plate. The pulling head and wedge were set in
place and the jacking was started. .When the load reached the
required level in the pull bar, the nut on the STRESSTEEL bar
was tightened until it was snug and bearing on the end plate.
The jack was then released and the jack force was completely
transferred to the prestressing bar. The prestress force was
applied in seve~al stages to each bar in turn rather than all
at once to any one bar to minimize the prestress losses due to
the jacking sequence.
The loading procedure for the test beams was similar
to that_used in previous tests.C 7) The center of the test beam
was supported on a roller (this simulates the center reaction
of the two-span beam) while vertical forces were applied to the

359.7 16.
web of the rolled steel beam as shown in Fig. lc (this simulates
the shear forces at the inflection points of the two-span beam).
The test set-up is essentially the same as that used in previous
test and is shown in Figs. 9 and 10 of Ref. 7.
Each test was performed approximately two months after
the slab was cast. Approximately 15 hours were required for
testing which was carried out on 3 consecutive days. Load incre
ments of ten kips were applied throughout each test except after
the yielding of the steel beam was apparent·: At this point small
increments of deflection were used until the end of the test.
The tests were carried out until the unloading behavior of each
beam was obtained.
359~7 17.
3. TEST RESULTS
3.1 Load-Deflection Behavior
Figure 7 shows the load-deflection behavior of test
beams PSC-lS and PSC-2S. The curves show the relationship between
the center reaction R and the deflection ~ of the center support
relative to a line joining the load points as shown in the figure.
The deflection ~ of the test beam at the center support
was computed as shown in the figure from the measured deflections
~l and ~ 2 at the ends of the beam. This deflection is also
assumed to represent the relative deflection of the inflection
points and the center support of the two-span beam as shown in
Fig. 7.
The predicted behavior of the test beams is shown by
the dashed line. Since the properties of the two test beams were
quite close (see Table 4), average values were used to determine
the prediction 9urve for both test beams.
For this prediction curve the full concrete slab was
assumed to act compositely with the steel section until the first
crack appeared. After initial cracking, it was assumed that only
the prestressing steel would contribute to the composite behavior
of the beam. For this reason, bilinear behavior was predicted
for the elastic range and the transition occurs at the average
cracking load of the two test beams.

359.7 18.
Equations from the 1969 AISC Manual of Steel Construc
tion were used to determine the deflections of the two span beam
shown in Fig. 7 for the elastic portion of the theoretical curve.
The predicted ultimate load was based on the plastic moment
capacity of the composite steel section.
It can be observed from Fig. 7 that both test beams
exhibited approximately the same behavior. This was expected
since the section properties of both beams were almost the same.
The slightly greater stiffness of beam PSC-lS can be seen at the
higher load levels. The load-deflection curves for the two test
beams are in good agreement with predictions and indicate that
the full transformed section acts compositely up to approximately
the cracking load when the slab is prestressed.
First yielding occurred in beam PSC-lS at a slightly
higher load level than in beam PSC-28. This behavior was
expected and is explained as follows. Beam PSC-lS was prestressed
after the shear connection was made and, therefore, the entire
transformed section was subjected to the prestressing force.
This caused the extreme bottom fibers of the steel section to be
in tension when testing began and thus these fibers reached their
compressive yield stress at a higher load level than the extreme
bottom fibers in beam PSC-28 which were not initially in tension.
First cracking also occurred at different load levels in the two
test beams and this will be discussed in detail in Art. 3.3.

359.7 19.
In Fig. 7 it can be seen that both test beams exceeded
the theoretical maximum load by about ·five percent which is
probably due to strain-hardening. Due to local buckling, unload
ing took place immediately after the maximum load was reached;
however, both beams were able to carry a large percentage of the
maximum load for deformations considerably in excess of those at
which local buckling occurred. The buckling was more severe in
beam PSC-2S and probably explains why the unloading rate for
beam PSC-2S was greater than that for PSC-lS. The local buckling
of the two test beams will be discussed in Art. 3.4.
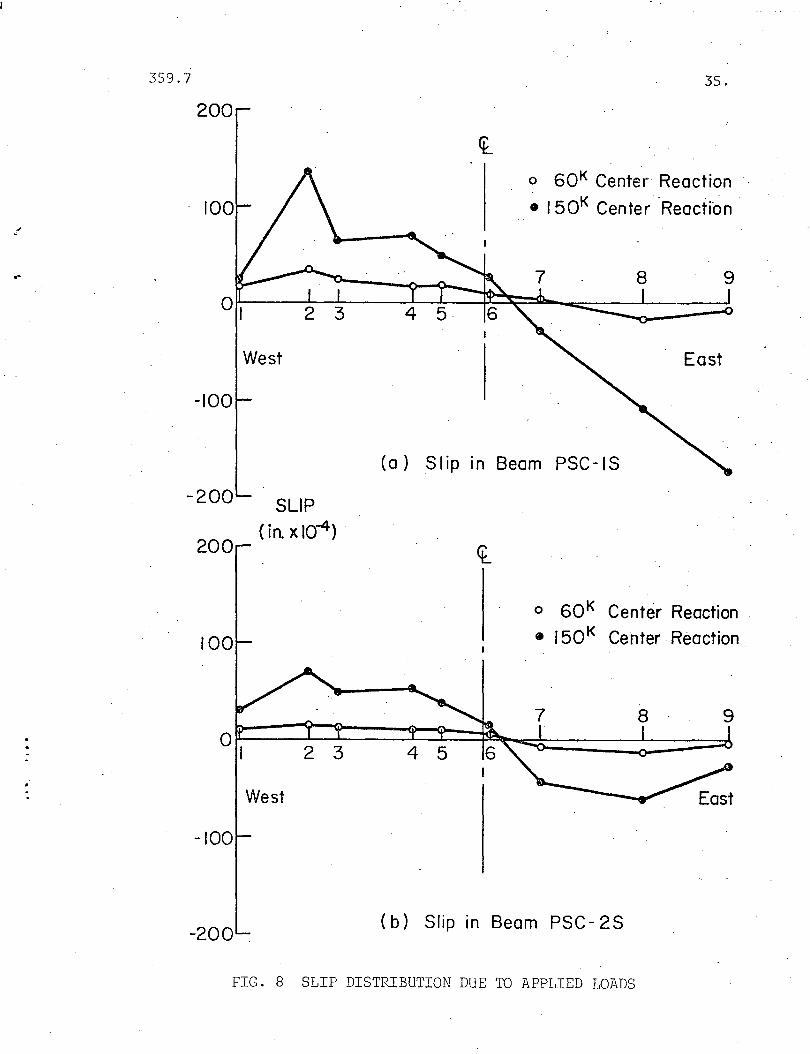
3.2 Slip
Figures 8 and 9 show the slip distribution for the two
test beams. The slip measurements were made using electrical
slip gages as described in Art. 2.6. The least accurate of the
slip gages was capable of recording a change in slip of 32 micro
inches. In both figures, slip to the east is shown as positive.
Figure 8 shows the slip distribution obtained in both
beams, due to the applied test loads only (effect of prestress
not included). The slip curves shown in the figure correspond to
center reactions of 60 and 150 kips so that comparisons with
previous test results are possible.C 6 , 7)
The magnitude of the slip in beam PSC-lS was generally ·
greater than that in beam PSC-2S. This can probably be explained

·.
-·
359.7 20.
by the fact that in beam PSC-2S the concrete surrounding the
connectors had a much higher compressive strength than the concrete
surrounding the connectors in beam PSC-lS (see Table 2).
Unlike previous tests, no attempt was made to eliminate
the bond between the steel beam and the concrete slab for either
test beam prior to testing. The effect of this bond may be
observed in Figs. 8 and 9 in the areas between locations 2 and 3
and between locations 4 and 5. Since there were no shear
connectors in these two areas, the change in slip was probably
due to this bond between the steel and the concrete.
The slip distribution in both beams followed similar
patterns with the exception of the east half of beam PSC-lS at
the 150 kip load level. However, at the prior load level of
140 kips the slip distribution in the last half of beam PSC-lS
was similar to that in the east half of beam PSC-2S. While the
test load was increased from 140 kips to 150 kips a significant
failure in the bond between the slab. and the steel beam was
observed and may account for the above noted variation in slip
distribution.
It should also be noted in Figures Sa and 8b that·
although the magnitude of the slip in the west half of each
beam was slightly greater than that at corresponding sections
of the east half, the magnitudes were approximately the same.
This seems to indicate that the grouping of connectors in the

_ ..
359.7
west half of each beam did not greatly affect the slip behavior
of that half of the test beam as compared to the half with
equally spaced connectors~
Figure 9 shows the slip dist:cibution in beam P8C-18
including the slip prior to testing caused by the prestress
21.
force and the losses which occurred during the time which elapsed
between the prestressing operation and the application of the
test loads. This figure indicates that initially the prestress
force was carried by the connectors at the ends of the beam.
With increasing time this force was redistributed across the
length of the beam.
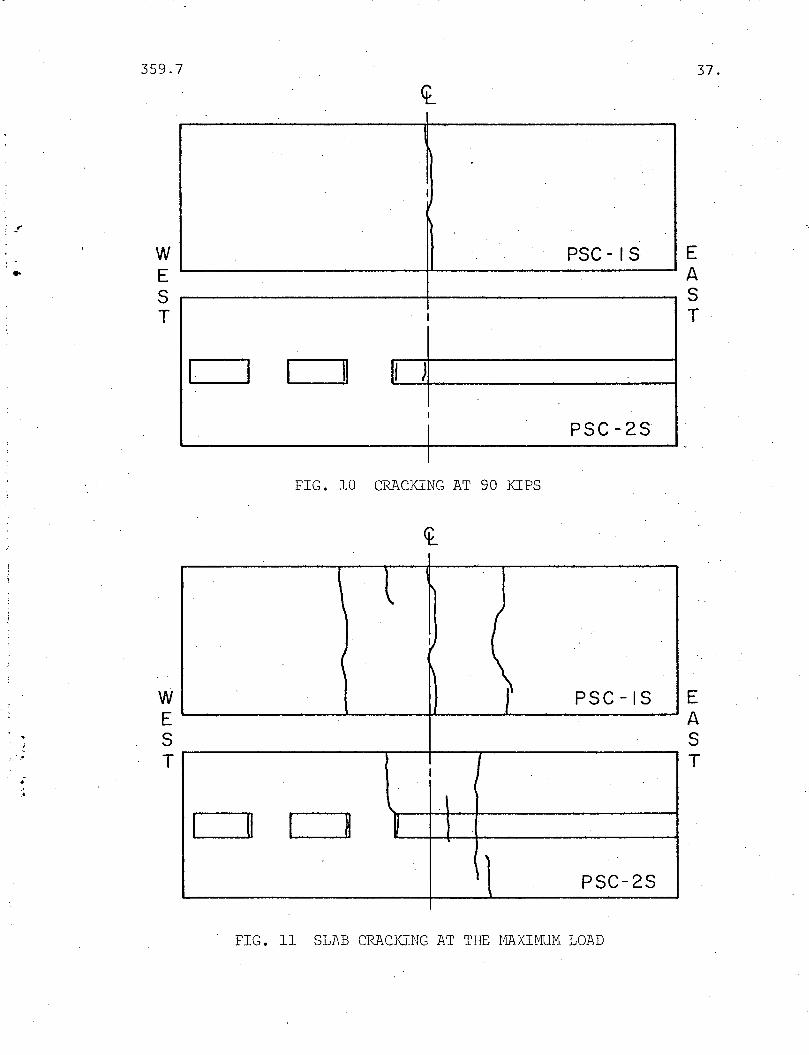
3.3 Cracking Behavior
Figures 10 and 11 show the crack patterns in the con
crete slabs· '·'of test beams P8C-18 and P8C-28. Fig1.1.re 10 shows
the crack patterns at a load level of 90 kips center reaction
which is about 1-1/2 times working load level. Figure 11 shows
the crack patterns at the maximum load level. In both figures,
the ractangles shown within the slab of beam P8C-28 are the areas
where the stud shear connectors were isolated from the main slab
pour, and then grouted later using the high strength grout.
At the 90 kip load level, beam P8C-18 had one crack
approx. 0.005 in. wide across the entire width of the slab
directly over the center support while beam P8C-28 had 3 hair
line cracks (approx. 0.01 wide) in the area where the grout

359.7 22.
was placed. The reason that hairline cracks occurred in the
grouted areas of beam P8C-28 is due to the fact that the grout
was placed after the slab was prestressed and consequently these
sections of the slab were not actually prestressed.
It was expected that the slab of beam PSC-18 would
crack before that of beam P8C-28 since the slab of beam P8C-28
carried the entire prestress force while the full transformed
section carried this force in beam P8C-18. For this reason, the
slab of P8C-28 had a greater compressive stress at the start of
the applied test loading.
It can be seen from Fig. 11 that even at the maximum
load level there were very few cracks in the slab of either test
beam. Beam P8C-18 contained three cracks across the width of
the slab while beam P8C-28 had the equivalent of two cracks.
The crack near the center support of beam P8C-28 was the first
to form as was expected.
The cracks near the center support of each beam attained
the greatest width. The average width of these cracks at the
maximum load level was about 0.1-in. Most of the other cracks
were hairline cracks with average widths generally less than
0.01 in. Both beams had short longitudinal hairline cracks at
the east and west ends due to the high anchorage stresses induced
by the prestressing bars.
The slab cracking in both beams is quite symmetrical
359.7 23.
about the center support. This is significant since each half
of the two test beams had a different·distribution of stud shear
connectors. The symmetrical crack patterns indicate that the
beam behavior was symmetrical about the center support.
3.4 Failure Mode
Test beams P8C-18 and P8C-28 both failed in essentially
the same manner as the non-prestressed beams which were previously
tested.C 6 , 7) For both test beams, failure occurred after local
buckling of the compression (lower) flange of the steel beam
adjacent to the center support. Local buckling of the flange
was accompanied by web buckling in both beams. Web buckling in
P8C-28 was quite pronounced as can be seen in Fig. 12. In both
tests local buckling occurred shortly after maximum load was
reached as shown in Fig. 7.
Figure 13 shows beam P8C-28 shortly after failure.
This was typical of both test specimens. Local buckling of the
lower flange and web of this beam can be seen near .the center
support.
359.7 24.
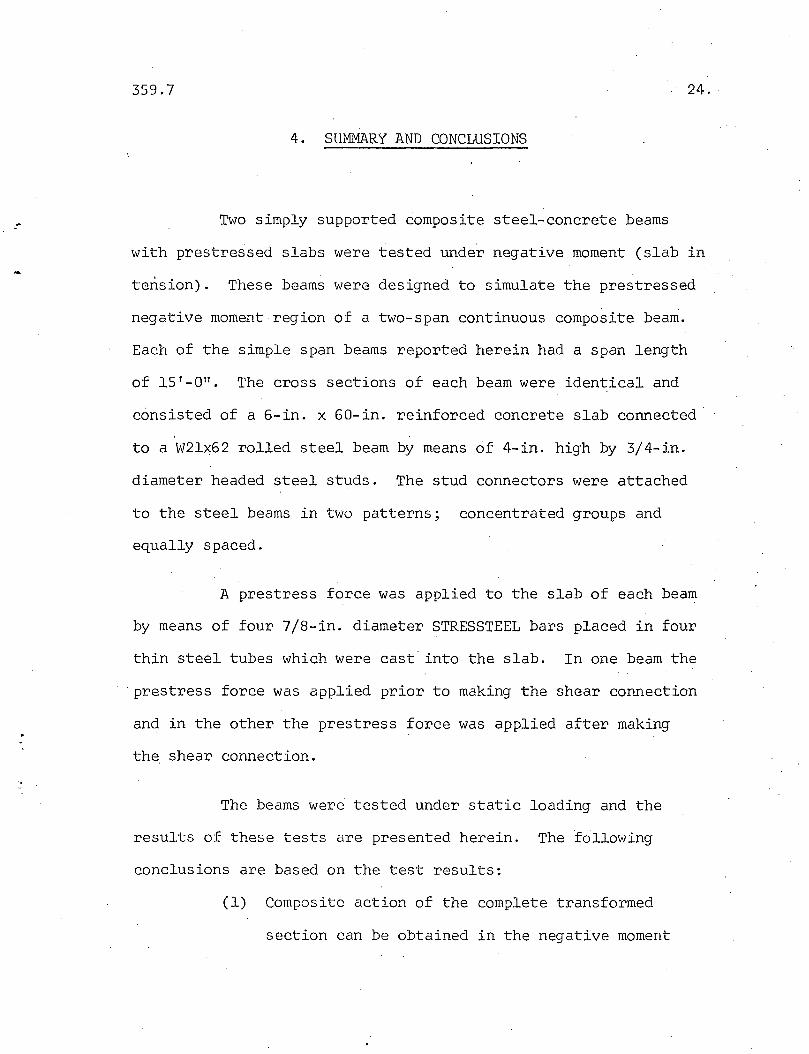
4. SUMMARY AND CONCLUSIONS
Two simply supported composite steel-concrete beams
with prestressed slabs were tested under negative moment (slab in
tension). These beams were designed to simulate the prestressed
negative moment region of a two-span continuous composite beam.
Each of the simple span beams reported herein had a span length
of 15 1 -0 11 • The cross sections of each beam were identical and
consisted of a 6-in. x 60-in. reinforced concrete slab connected
to a W2lx62 rolled steel beam by means of 4-in. high by 3/4-in.
diameter headed steel studs. The stud connectors were attached
to the steel beams in two patterns; concentrated groups and
equally spaced.
A prestress force was applied to the slab of each beam
by means of four 7/8-in. diameter STRESSTEEL bars placed in four
thin steel tubes which were cast into the slab. In one beam the
· prestress force was applied prior to making the shear connection
and in the other the prestress force was applied after making
the shear connection.
The beams were tested under static loading and the
results of these tests are presented herein. The following
conclusions are based on the test results:
(1) Composite action of the complete transformed
section can be obtained in the negative moment

359.7
region of a continuous composite beam by placing
shear connectors throug.hout the negative moment
region and applying a suitable prestress force
to the slab.
25.
(2) When the slab in the negative moment region is
prestressed, slab cracking can be eliminated up
to loads which depend upon the level of prestress.
After the prestress has been overcome, the slab ·
will crack, but the crack widths prior to the
ultimate load level can probably be reduced by
increasing the prestress force.
(3) Prestressing of the slab before making the shear
connection is desirable in delaying the formation
of slab cracks since the initial compressive stress
in the slab will be higher.
(4) The test results indicated that when same number
of connectors is used, grouped connectors provide
a satisfactory shear connection provided the con
crete can properly be placed around the connectors.
This concept may have a significant application in
the use of precast slabs in composite construction.
(5) The test results also indicated satisfactory com
posite behavior using a low shrinkage grout around
the connectors providing that adequate shear
transfer is obtained between the grouted sections
and the remainder of the slab.
359.7 26.
5 . ACKNOWLEDGEMENTS
The study described in this report was part of an
investigation on composite beams that was conducted at Fritz
Engineering Laboratory, Department of Civil Engineering, Lehigh
University. L. s. Beedle is Director of Fritz Engineering Labora
tory and D. A. VanHorn is Chairman of the Department of Civil
Engineering. The project was sponsored by the Pennsylvania
Department of Transportation and the Federal Highway Adminis
tration.
The writers wish to thank: Drs. R. G. Slutter and
J. w. Fisher for their advice and help in the planning and
conduct of these tests; Messrs. K. R. Harpel and H. Sutherland
and their staff at Fritz Laboratory for their work in preparing
the test set-up and instrumentation; Mr. R. N. Sopko for the
photographic coverage; Mr. J. Gera and Mrs. s. Balogh for pre
paring the drawings; and Mrs. Charlotte Yost for typing the
manuscript.
359.7 27.
..
6. TABLES AND FIGURES
:

359.7 28.
TABLE l
MECHANICAL PROPERTIES OF STEEL
Type No. Yield Point Static Tensile r
of of Yield Stress Strength (ksi) (ksi) (ksi)
Specimen Test Mean Mean Mean
Web
W2lx62 3 37.5 34.4 60.8
Flange
W2lx62 4 34.4 32.0 58.8
TABLE 2
RESULTS OF CONCRETE CYLINDER TESTS
A S T M Cylinders Cured With Slab
Test No. fT No. E fT E Beam "c)f. c of c c c
'. '' Tests (psi) Tests Cksi) (psi) (ksi)
PSC-lS 8 4760 2 3665 4810 3235
PSC-2S 10 4330 4 3380 4370 (Slab)'
PSC-2S 7070 (Grout)
359.7 29.
TABLE 3
ROLLED STEEL BEAM PROPERTIES
BEAM AREA DEPTH F L A N G E WEB MOHENT ·"'
( in2) WIDTH THICKNESS THICKNESS OF
(in) (in) (in) (in) INERTIA
·. c in4) ·
' \· -·PSC-lS 17.431 21.063 8.230 0.570 0.404 1251.465
PSC-2S 17.602 21.063 8.293 0.575 0.405 1267.489
~·:w2lx62 18.300 20.990 8.240 0.615 0.400 1330.000
* From 1969 AISC Hanual of Steel Construction
TABLE 4
PROPERTIES OF'.' THE- TEST BEAHS
BEAM CROSS- LOCATION MOHENT OF MOMENT OF COMPUTED SECTIONAL OF N.A. INERTIA INERTIA ULTIHATE
SLAB yb TRANSFORMED STEEL HOME NT AREA SECTION SECTION* (kip-in)
(in2) (in) ( in4) (in 4)
PSC-lS 366.54 20.303 3702 1638 7072
PSC-2S 365.83 20.042 3663 1654 7127
* Including STRESSTEEL bars.

I.
I
359.7
101-0 11
._----~P A 10'-o"·
P..-----.....
F- -F
1.- . 251-0 11 251-0 11
A
F F ... .. PSC-:- IS
~V PSC-2S V~
I~ j]'-5': I }5:, ~"
15 11 7 Y211
7Y211
15 11
., .• , .. ·j·
Steel Tube #5 Rebar II
for 1/a ~ Stressteel Bar
W21 x62-.....__.
Section A -A
Bearing
Stiffener
FIG. l TEST BEAHS PSC-lS AND PSC-28
30 •.
( 6)
(b)
(c)
( d}
. ,.
359.7 31.
West Grouped Studs Equally Spaced Studs East
I J I
e) )::=:o 2 fe_4 11x 111
I 211 ¢ Pin - ='( r=-
I
2 re. 4"x lf211 · W21 x 62
11211_1 7 1-6 II 7'-6 11 112111 I I I I
(a)
63/.11 6 @311 I ~ a I
I' -IQifall l
7@3 11
I 11
- I 0 lfa 11
14@3 11
I I. I_ I _I
0000000 00000000 0000(~ 0 ........
~ 0000000 00000000 OOOO<P 0
~(b)
. O<~ ...... I
r-. 0 (~
- A
0 0 0 0 0 0 0 0 0 0 0 0 0 0 0 0 I I
0 0 0 0 0 0 0 0 0 0 0 0 010 0 0
Equally Spaced Stud D1strtbut1on L A
411
H
1411
Loading Pins
Section AA
(Typical)
FIG. 2 FABRICATION DETAILS
0 0 0
0 0 0
(c)

359.7 32.
FIG. 3 FORMWORK FOR BEAM PSC-28
FIG. 4 ELECTRICAL SLIP GAGE
.'
..
. 359.7 33 .
I II
I 23 5/s' 42 11 I II
I f---I I
w E E c:( >= ~ p A s· s T T
~2 7// -
8 (\) 9 I 3 4 5 6 7
////// /////
FIG. 5 LOCATION OF NINE INSTRUHENTED CROSS SECTIONS FOR BEAHS PSC-lS AND PSC-28
Threaded
Plate
17'.- 0 II
7 II ,f, Ia 't'
Stressteel Bar
Plate Hydraulic
Jack
Calibrated Pull Bar (Tension
Pulling Wedge
Pulling Head
. Dynamometer)
FIG. 6 PRESTRESSING SET-UP

~
,..
359.7
R (kips}
150
100
50
0
34.
r- -----I I PSC- IS PSC-2S
I Load - Def I ection 0 e I Average :
Cracking First Yielding a b
Load First Cracking A B
Local Buckling a {3
p Negative Moment p
l ~ Region t--f ~ ·
~Gt;p ~ A · Two Span
R u · Beam
90 11 9011
1- ,. -lj~l ~<:? '
~. [ )(-'f'" 1 ~ R Test Beams
1.0
~ (in.}
~2- ~I ~ = _...;::,_ _ __.;_.
2
2.0
FIG. 7 LOAD-DEFLECTION BEHAVIOR OF BEAHS PSC-lS AND PSC-2S
.J
..
359.7
200
-100
-200
200
-100
-200
West
SLIP (in. x 10-4)
West
35.
o 60K Center Reaction
• 150K Center ·Reactibn
9
East
(a} Slip 1n Beam PSC-IS
o 60K Center Reaction
• 150K Center Reaction
8 9
( b} Slip m Beam PSC- 2S
FIG. 8 SLIP DISTRIBUTION DUE TO APPLIED LOADS

·'
. • .
359.7
200
-100
-200
-300
West
o After Prestressing • Prestress + Losses o 60k Center Reaction
. 11 150k Center Reaction
FIG. 9 TOTAL SLIP IN PSC-lS
. 36.
East
..
. . I
. .. .
359.7
w E s T
w E s T
I
I
I
PSC- IS
I
I I \1 II )
I
J PSC-2S I
FIG. 10 CRACKING AT 90 KIPS
I l I
I I ( ) PSC -IS
I I
' ll I ~ ~
' PSC-2S
FIG. ll SLAB CRACKING AT THE l1AXIHUM LOAD
37.
E A s T
E A s T

359 .7 38.
/
FIG. 12 LOCAL BUCKLING FAILURE MODE
. I
FIG. 13 TEST BEAM AFTER FAILURE
•
. I . . ' .
359.7 39.
· 7 . REFERENCES
1. Daniels; J. H., and Fisher, J. W. FATIGUE BEHAVIOR OF CONTINUOUS COMPOSITE BEAMS, Fritz Engineering Laboratory Report No. 324.1, Lehigh University, December 1966
2. Daniels, J. H., and Fisher, J. w. STATIC BEHAVIOR OF CONTINUOUS COMPOSITE BEAMS, Fritz Engineering Laboratory Report No. 324.2, Lehigh University, March 1967
3. Garcia, I., and Daniels, J. H. NEGATIVE MOMENT BEHAVIOR OF COMPOSITE BEAMS, Fritz. Engineering Laboratory Report No. 359.4, Lehigh University, April 1971
4 .. Wu, Y. C.,.:Slutter, R .. G.~, and .Fisher, J. W. ANALYSIS OF CONTINUOUS COMPOSITE BEAMS, Fritz Engineering Laboratory Report No. 359.5, Lehigh University, May 1971
5. Fisher, J. w., Daniels, J. H., and Slutter, R. G. CONTINUOUS COMPOSITE BEAMS FOR BRIDGES, Fritz Engineering Laboratory Report No. 359.6, Lehigh University, June 1971
6. Wu, Y. c., and Slutter, R. G. CONTINUOUS COMPOSITE BEAMS UNDER FATIGUE LOADING, Fritz Engineering Laboratory Report No. 359.2, Lehigh University, September 1970
7. Garcia, I., and Daniels, J. H. TESTS OF COMPOSITE BEAMS UNDER NEGATIVE MOMENT, Fritz Engineering Laboratory Report No. 359.1, Lehigh University, February 1971
8. Garcia I., and Daniels, J. H . VARIABLES AFFECTING THE NEGATIVE MOMENT BEHAVIOR OF COMPOSITE BEAMS, Fritz Engineering Laboratory Report No. 359.3, Lehigh University, June 1971
9. Slutter, R. G., and Fisher, J. W. FATIGUE STRENGTH OF SHEAR CONNECTORS, Highway Research Record No. 147, Highway Research Board, 1966, pp. 65-88
,/
.-
359.7 40.
10. American Association of State Highway Officials STANDARD SPECIFICATIONS FOR HIGHWAY BRIDGES, Tenth Edition, 1969
11. American Society for Testing and Materials STANDARDS, Part 10: Concrete and Mineral Aggregates, 1969
12. Desai, S. T-ENSION TESTING PROCEDURE, Fritz Engineering Laboratory Report No. 237.44, Lehigh University, February 1969