J. Am. Ceram. Soc., Journal - WordPress.com · Indeed, alumina is somewhat brittle, and recent...
8
Microstructural Investigation of the Aging Behavior of (3Y-TZP)–Al 2 O 3 Composites Sylvain Deville, w Je´ roˆ me Chevalier, Christelle Dauvergne, and Gilbert Fantozzi National Institute of Applied Science, Materials Department (GEMPPM-INSA), Associate Research Unit 5510, 69621 Villeurbanne, France Jose´ F. Bartolome´ and Jose´ S. Moya Instituto de Ciencia de Materiales de Madrid (ICMM), CSIC, Cantoblanco 28049, Madrid, Spain Ramo´ n Torrecillas Instituto Nacional del Carbo´ n CSIC, C/Francisco Pintado Fe, 26, 33011 Oviedo, Spain The low-temperature autoclave aging behavior of zirconia- toughened alumina composites processed by a classical powder mixing processing route was analyzed using atomic force mi- croscopy (AFM), scanning electron microscopy, and X-ray dif- fraction (XRD). The transformation was evaluated in terms of nucleation and growth, assessed by XRD. The time–temperature equivalency of the transformation was used to measure an apparent activation energy of the nucleation stage of the trans- formation of 78 kJ/mol. The microstructural features influenc- ing the transformation were identified, and the influence of the alumina matrix on the transformation was investigated. Trans- formation progression grain by grain was observed by AFM. Transformation does not only occur in zirconia agglomerates but also in isolated zirconia grains. The matrix could partially inhibit the transformation. This behavior could be rationalized considering the constraining effect of the alumina matrix, shape strain accommodation arguments, and microstructural homoge- neity effects. I. Introduction Z IRCONIA-TOUGHENED alumina (ZTA) composites are of in- creasing interest as far as biomedical applications are con- cerned, as an alternative to biomedical-grade alumina and zirconia. Indeed, alumina is somewhat brittle, and recent seri- ous problems have been reported 1,2 with yttria-stabilized zir- conia aging degradation used in total hip replacement (THR). Aging is related to the tetragonal to monoclinic (t–m) phase transformation of zirconia, 3,4 transformation promoted by me- chanical and hydrothermal stresses. 3,5,6 This transformation is accompanied by a 4 vol% increase and 16% shear, leading to microcracking, surface degradation, and eventually grain pop- out. This phenomenon, if not controlled, might become very detrimental for biomedical applications such as THR, where very low surface roughness and long-term stability are required. 7 Using ZTA, improved mechanical properties such as strength and crack propagation resistance might extend the lifetime of orthopedic implants 8 while improving the safety operating range. However, since those ceramics contain zirconia, they are likely to undergo aging. Little attention has been paid so far to this phenomenon in ZTA, and the underlying mechanisms are not yet clear. Some microstructural features influencing the ag- ing behavior have been underlined, although the conclusions remain a bit speculative. Most of the experiments carried out so far were indirect observations of the transformation, i.e., X- ray diffraction (XRD) experiments, 9–12 neutron powder diffrac- tion, 13 infrared (IR) spectroscopy, 14 mechanical testing, 15 or differential thermal analysis (DTA). 6 Direct observations of the transformation were obtained only by scanning electron microscopy (SEM), 16 where the relief changes could hardly be quantified, and transmission electron microscopy (TEM). 17 However, although TEM studies have been able to show the selective nature of the transformation and stabilizer reduction, the microstructural and chemical environ- ment in TEM experiments might be questioned. In particular, for particles observed in thin foils, the influence of the matrix is greatly reduced, since the specimen’s thickness is limited to a few nanometers. In addition, grinding of specimens brings important microstructural modifications. Kriven 18 used a 1 MeV HVTEM to simulate bulk conditions and was able to observe stress-induced transformation and analyze the crystallography of the transformation. He observed twinning on (100) m planes, and concluded that either the martensitic theory needed to be modified to take into account bulk effects, or that twins formed subsequently as deformation twins to minimize the shape change of the particle due to transformation. It has since been demon- strated that twins in zirconia were self-accommodated martensi- tic variants. 19 This study increased the interest for taking into account bulk conditions, as opposed to the behavior of thin foils. Transformation was nonetheless stress-induced, and not autoclave induced. Among the identified factors influencing the transformation behavior, the zirconia grain size is of prime importance. By lim- iting zirconia grain growth, it seems possible to restrict the transformation. However, this was identified only for transfor- mation occurring during heat treatment at high temperatures (41200 K) or during cooling after sintering, 16 which is different to autoclave aging conditions. Some of the microstructural features that could influence the autoclave aging behavior of zirconia remain ambiguous. Fur- ther understandings of these phenomena require local observa- tion of the transformation at the surface of bulk specimens. Recent developments of atomic force microscopy allow observ- ing the transformation-induced surface relief modification at a nanometer scale. 20 The purpose of this paper is to provide fur- ther insights into the aging sensitivity of ZTA and the nucleation and growth nature of the transformation. The inherent limited 1273 J ournal J. Am. Ceram. Soc., 88 [5] 1273–1280 (2005) DOI: 10.1111/j.1551-2916.2005.00221.x R. Hannink—contributing editor Supported by the European Union under the GROWTH2000, project BIOKER, ref- erence GRD2-2000-25039. w Author to whom correspondence should be addressed. e-mail: [email protected] Manuscript No. 10690. Received November 17, 2003; approved October 15, 2004.
Transcript of J. Am. Ceram. Soc., Journal - WordPress.com · Indeed, alumina is somewhat brittle, and recent...
Microstructural Investigation of the Aging Behavior of (3Y-TZP)–Al2O3
Composites
Sylvain Deville,w Jerome Chevalier, Christelle Dauvergne, and Gilbert Fantozzi
National Institute of Applied Science, Materials Department (GEMPPM-INSA), Associate Research Unit 5510, 69621Villeurbanne, France
Jose F. Bartolome and Jose S. Moya
Instituto de Ciencia de Materiales de Madrid (ICMM), CSIC, Cantoblanco 28049, Madrid, Spain
Ramon Torrecillas
Instituto Nacional del Carbon CSIC, C/Francisco Pintado Fe, 26, 33011 Oviedo, Spain
The low-temperature autoclave aging behavior of zirconia-toughened alumina composites processed by a classical powdermixing processing route was analyzed using atomic force mi-croscopy (AFM), scanning electron microscopy, and X-ray dif-fraction (XRD). The transformation was evaluated in terms ofnucleation and growth, assessed by XRD. The time–temperatureequivalency of the transformation was used to measure anapparent activation energy of the nucleation stage of the trans-formation of 78 kJ/mol. The microstructural features influenc-ing the transformation were identified, and the influence of thealumina matrix on the transformation was investigated. Trans-formation progression grain by grain was observed by AFM.Transformation does not only occur in zirconia agglomeratesbut also in isolated zirconia grains. The matrix could partiallyinhibit the transformation. This behavior could be rationalizedconsidering the constraining effect of the alumina matrix, shapestrain accommodation arguments, and microstructural homoge-neity effects.
I. Introduction
ZIRCONIA-TOUGHENED alumina (ZTA) composites are of in-creasing interest as far as biomedical applications are con-
cerned, as an alternative to biomedical-grade alumina andzirconia. Indeed, alumina is somewhat brittle, and recent seri-ous problems have been reported1,2 with yttria-stabilized zir-conia aging degradation used in total hip replacement (THR).Aging is related to the tetragonal to monoclinic (t–m) phasetransformation of zirconia,3,4 transformation promoted by me-chanical and hydrothermal stresses.3,5,6 This transformation isaccompanied by a 4 vol% increase and 16% shear, leading tomicrocracking, surface degradation, and eventually grain pop-out. This phenomenon, if not controlled, might become verydetrimental for biomedical applications such as THR, wherevery low surface roughness and long-term stability are required.7
Using ZTA, improved mechanical properties such as strengthand crack propagation resistance might extend the lifetimeof orthopedic implants8 while improving the safety operatingrange. However, since those ceramics contain zirconia, they are
likely to undergo aging. Little attention has been paid so far tothis phenomenon in ZTA, and the underlying mechanisms arenot yet clear. Some microstructural features influencing the ag-ing behavior have been underlined, although the conclusionsremain a bit speculative. Most of the experiments carried outso far were indirect observations of the transformation, i.e., X-ray diffraction (XRD) experiments,9–12 neutron powder diffrac-tion,13 infrared (IR) spectroscopy,14 mechanical testing,15 ordifferential thermal analysis (DTA).6
Direct observations of the transformation were obtained onlyby scanning electron microscopy (SEM),16 where the reliefchanges could hardly be quantified, and transmission electronmicroscopy (TEM).17 However, although TEM studies havebeen able to show the selective nature of the transformation andstabilizer reduction, the microstructural and chemical environ-ment in TEM experiments might be questioned. In particular,for particles observed in thin foils, the influence of the matrix isgreatly reduced, since the specimen’s thickness is limited toa few nanometers. In addition, grinding of specimens bringsimportant microstructural modifications. Kriven18 used a 1MeVHVTEM to simulate bulk conditions and was able to observestress-induced transformation and analyze the crystallographyof the transformation. He observed twinning on (100)m planes,and concluded that either the martensitic theory needed to bemodified to take into account bulk effects, or that twins formedsubsequently as deformation twins to minimize the shape changeof the particle due to transformation. It has since been demon-strated that twins in zirconia were self-accommodated martensi-tic variants.19 This study increased the interest for taking intoaccount bulk conditions, as opposed to the behavior of thinfoils. Transformation was nonetheless stress-induced, and notautoclave induced.
Among the identified factors influencing the transformationbehavior, the zirconia grain size is of prime importance. By lim-iting zirconia grain growth, it seems possible to restrict thetransformation. However, this was identified only for transfor-mation occurring during heat treatment at high temperatures(41200 K) or during cooling after sintering,16 which is differentto autoclave aging conditions.
Some of the microstructural features that could influence theautoclave aging behavior of zirconia remain ambiguous. Fur-ther understandings of these phenomena require local observa-tion of the transformation at the surface of bulk specimens.Recent developments of atomic force microscopy allow observ-ing the transformation-induced surface relief modification at ananometer scale.20 The purpose of this paper is to provide fur-ther insights into the aging sensitivity of ZTA and the nucleationand growth nature of the transformation. The inherent limited
1273
JournalJ. Am. Ceram. Soc., 88 [5] 1273–1280 (2005)
DOI: 10.1111/j.1551-2916.2005.00221.x
R. Hannink—contributing editor
Supported by the European Union under the GROWTH2000, project BIOKER, ref-erence GRD2-2000-25039.
wAuthor to whom correspondence should be addressed. e-mail: [email protected]
Manuscript No. 10690. Received November 17, 2003; approved October 15, 2004.

reliability of XRD raised the interest of local observations.Hence, it is demonstrated how the zirconia particle’s transfor-mation can be locally observed by comparing atomic force mi-croscopy (AFM) and SEM images, providing new informationabout the more influent microstructural features, not accessibleby other techniques.
II. Experimental Procedure
(1) Processing
Samples were processed by a classical powder mixing processingroute. A high-purity alumina powder a-Al2O3499.9 wt% (Con-dea HPA 0.5, Ceralox Division, Tucson, AZ) was mixed withvarious amounts of yttria-stabilized zirconia powder (3Y-TZP,Tosoh TZ-3YS, Tosoh Corporation, Tokyo, Japan). Sampleswere sintered in air at 1873 K for two hours. The obtained plateswere machined to small bars. These bars were mirror-polishedby standard procedures on one side by using diamond slurriesand pastes down to 1 mm, reaching mean roughness (Ra) valuesas low as 2 nm (measured by AFM, after polishing). The resid-ual relief does not interfere with the transformation-induced re-lief observations.
Samples were thermally etched at a selected temperature, inorder to form slight thermal grooves at grain boundaries. Etchexperiments for determining the optimal conditions were carriedout for 12 min, from 1523 to 1723 K, at a heating and coolingrate of 400 K/min. This thermal treatment creates local reliefbetween the grains and allows separating each grain on AFMand SEM images. The choice of the etching temperature and itsinfluence on the aging behavior are discussed in the resultssection.
(2) Measurements
XRD data were obtained with a diffractometer using CuKa ra-diation. The tetragonal/monoclinic zirconia ratio was deter-mined using the integrated intensity (measuring the area underthe diffractometer peaks) of the tetragonal (101) and two mono-clinic (111) and (-111) peaks as described by Garvie and Ni-cholson21 and then revised by Toroya et al.22 The measuredmonoclinic phase fraction is therefore related to the zirconiaphase only, i.e., when a measure of 20 vol% of monoclinic phaseis obtained in a 30 vol% 3Y-TZP–Al2O3, and this means that 20vol% of the 3Y-TZP phase is transformed, i.e., 6 vol% of thesurface interaction volume of the sample (the X-ray penetrationdepth is estimated to be around 5 mm). Diffractograms wereobtained from 271 to 331, at a scan speed of 0.21/min and a stepsize of 0.021. Autoclave treatments up to 80 h were performed inthe temperature range 383–413 K.
SEM images were obtained on polished, thermally etched,and gold-coated samples by using a high-resolution SEM (FEI,Hillsboro, OR, XL30 ESEM FEG), used in backscattered elec-trons imaging mode (BEI).
Sample surface was observed by an AFM (D3100, DigitalInstruments Inc., Santa Barbara, CA) in contact mode with anaverage scanning speed of 10 mm/s. The used oxide-sharpenedsilicon nitride probes had a nominal spring constant of 0.57 N/m, a tip half-angle of 351, and a nominal tip radius of curvatureof 20 nm. Experiments were performed in air. Polished andthermally etched samples were just cleaned with ethanol, in or-der to obtain a very clean surface, free of any residual dirt. Thesame zones were observed by AFM and SEM.
III. Results
(1) Surface Preparation
Several temperatures were tested in order to determine the bestthermal etching conditions. Considering the expected size of re-lief due to surface transformation during aging (up to 50 nm), agrain boundaries height (GBH) of around 10 nm is necessary. IfGBH is close to the magnitude of transformation-induced relief,
local analysis of the transformation becomes more difficult.Grain boundary width must also be kept small, although it isnonetheless much smaller than the average grain size and there-fore does not affect the AFM observations analysis.
Measurement of GBH is shown in Fig. 1. For each etch tem-perature, more than 50 GBH were measured to obtain a statis-tically significant average value. Thermal grooves developbecause the system reaches an equilibrium configuration deter-mined by the grain boundary and surface energies. The thermalgroove is dependent, of course, on the temperature23 but also onthe grains’ crystallographic orientation relationships with thesurface, as well as on the crystallographic relationships of thetwo adjacent grains of each grain boundary. The selected tem-perature must reveal the grain boundaries while grains surfaceremains undisturbed. The variation of GBH with temperature(for a 12-min treatment) is shown in Fig. 2. Twelve minutes at1623 K (heating and cooling rate of 400 K/min) is deemed op-timal. This allows to obtain clear grain boundaries on AFMscans and SEM images, while relief changes due to surfacetransformation remain clear.
(2) Origin of AFM–SEM Contrast
To make a direct comparison, the same zones were observed bySEM and AFM. If the two corresponding images are obviouslysimilar, the origin of the contrast on the two types of images isworth further explanations. As far as SEM is concerned, theimage is processed from the backscattered electrons signal and avery large contrast is expected when imaging elements with agreat difference in atomic number, such as alumina and zirconia.It is, however, not possible to see the relief change induced bythe transformation. This has already been well documented.
Fig. 1. AFM height image explaining the measurement of the grainboundary height, for a sample etched at 1723 K. The surface profilealong the dashed line is plotted below.
1274 Journal of the American Ceramic Society—Deville et al. Vol. 88, No. 5

As far as AFM is concerned, the contrast origin is very dif-ferent. In contact mode, the probe is scanning the surface with aconstant applied force and the deflection variation is measured.If the surface is chemically inert, the deflection variation is onlyrelated to changes in surface relief; it is possible measuring var-iations in the nanometer range. In some cases, some interactionbetween the probe and the surface might occur, interfering withthe variation of the relief, so that the interpretation of the ob-tained informations becomes more difficult. Fortunately, thereis no such interaction between the probes used here and thesurface of ZTA, so that the AFM scans might be interpretedstraightforwardly. Two types of images might then be obtainedfrom the scans: either the height image or the derivate image(also often called the error image). The first one is a topologicalimage; the higher the local surface relief, the brighter the image.These images might be seen in 3D for more clarity; relief can bequantified. The derivate image is related to the rate of surfacerelief evolution. When the relief is changing abruptly, the signalis more important. However, when there is no such change, thederivate signal is very low. This allows seeing similar features onan image, e.g., a self-accommodating variant with a constantangle will appear with a constant contrast all along its plane, ascan be seen in Figs. 3 and 4 of Deville and Chevalier.20 However,it does not allow to measure height variations. Depending on thetype of information being investigated, either one of these twomodes has been used.
(3) Comparison of the Aging Behavior with and withoutThermal Etching
To ensure that the thermal etching procedure (used to reveal themicrostructure in SEM and AFM observations) did not have adetrimental effect on the aging behavior, experiments were car-ried out on both unetched and etched samples. The monoclinicphase fraction evolution of two samples processed and polishedin the same conditions was measured as a function of the agingtreatment time. One of the samples was thermally etched for12 min at 1623 K. Results are plotted in Fig. 3. Although theerror range cannot be measured directly, it is usually estimatedto lie around 4–5% for monoclinic fraction up to 0.15 (e.g.,572%) and less than 5% for larger fractions where the noise/signal ratio becomes smaller. As it can be seen on the graph, thetwo curves lie within the measurement error range of XRDanalysis.
Considering how short the etching procedure is (12 min atdwell temperature), this result is not surprising. A longer treat-ment may modify the surface relief more drastically. Longer
thermal treatments are also known to relax residual stresses.24 Itcan therefore be concluded that the samples are not affected bythe thermal etching procedure in these conditions, validating theprocedure chosen here for AFM and SEM observations.
(4) XRD Analysis
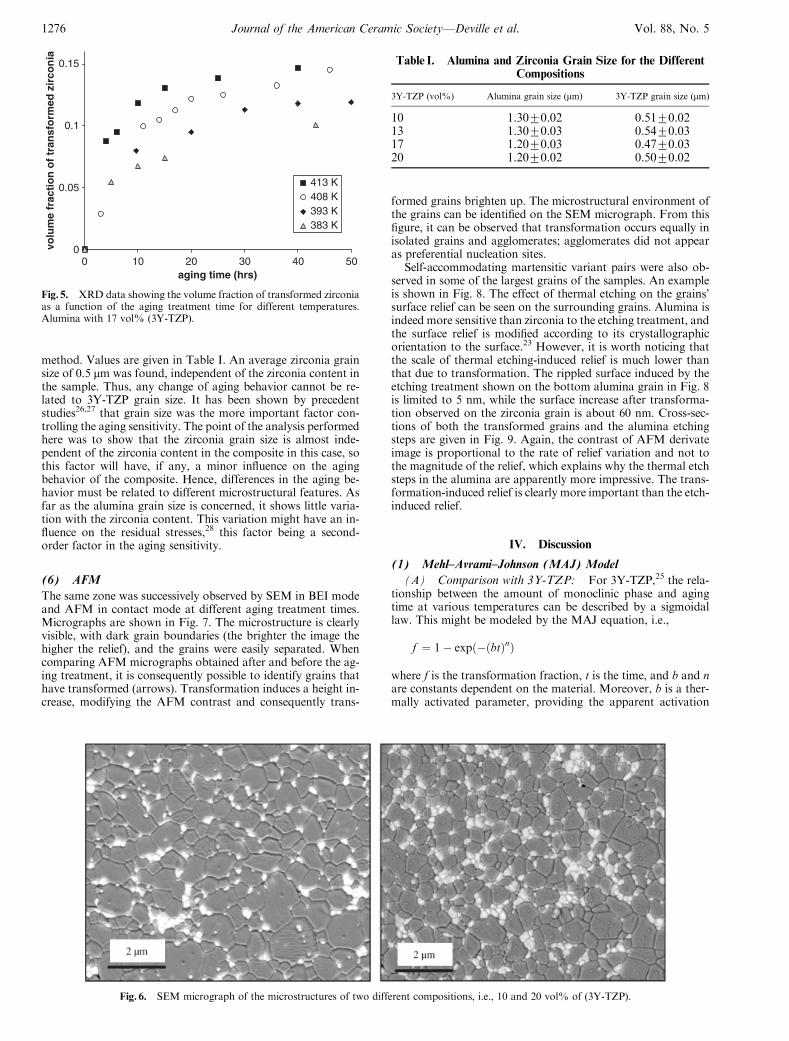
The evolution of the monoclinic phase fraction as a function ofautoclaving time at 413 K for different zirconia content is plot-ted in Fig. 4. Transformation occurs more rapidly when the zir-conia content in the composite increases. A fast increase isobserved during the first few hours, and the transformationthen slows down to reach a steady rate. The variation in mono-clinic phase fraction was also measured for several aging tem-peratures (Fig. 5), in order to measure the apparent activationenergy of the transformation, to make a direct comparison with3Y-TZP. The same behavior is observed for all the tempera-tures, and the transformation rate is found to be temperaturedependent, as expected from 3Y-TZP previous results.25
(5) Microstructure
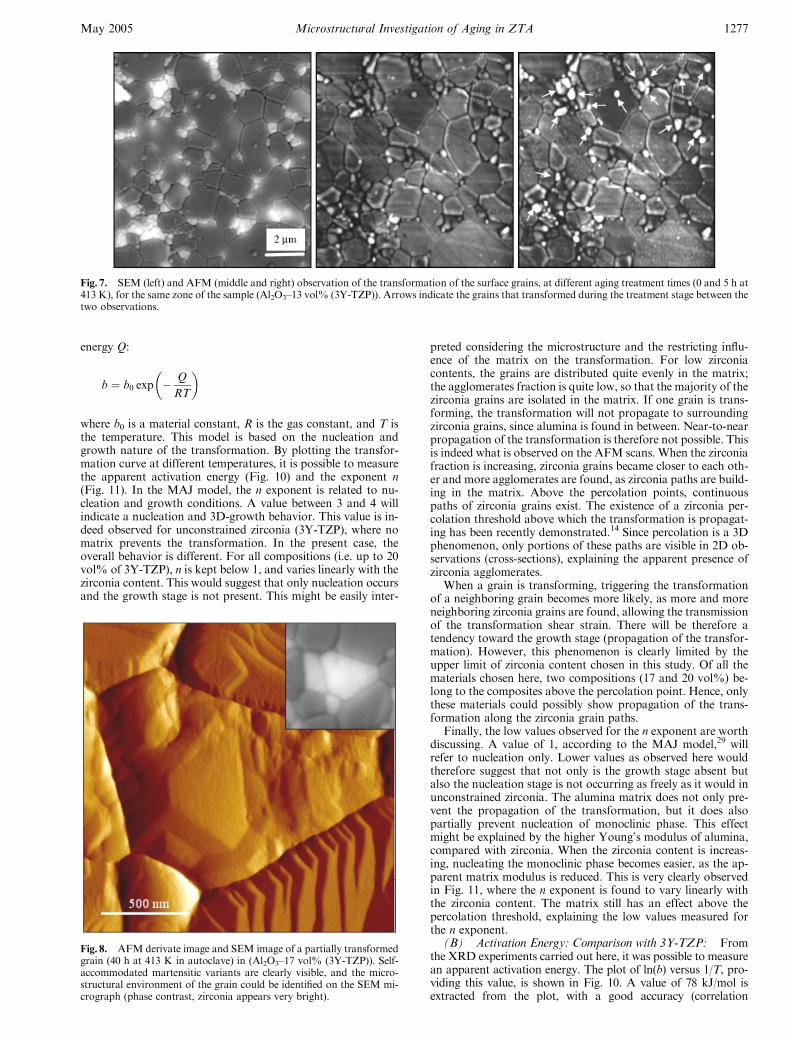
High-definition ESEM images (e.g., Fig. 6) were used to deter-mine the alumina and zirconia grain size by the linear intercept
0
5
10
15
20
25
30
35
1500 1550 1600 1650 1700 1750etching temperature (K)
Gra
in b
ou
nd
ary
hei
gh
t (n
m)
Fig. 2. Evolution of the average grain boundary height as a function ofthe etching temperature, for a 12-min treatment. Alumina with 17 vol%(3Y-TZP).
0.00
0.05
0.10
0.15
0.20
0 5 10 15 20aging treatment time (hrs) at 413 K
ph
ase
frac
tio
n o
f tr
ansf
orm
ed z
irco
nia
thermally etched
unetched
Fig. 3. XRD data showing the evolution of the monoclinic phase frac-tion as a function of aging treatment time, for unetched and thermallyetched samples. No significant differences are observed. Alumina with17 vol% (3Y-TZP).
0.00
0.05
0.10
0.15
0.20
0.25
0.30
0 10 20 30 40 50 60 70 80aging treatment time (hours) at 413K
volu
me
frac
tion
of tr
ansf
orm
ed z
ircon
ia
20 vol.% 3Y-TZP17 vol.% 3Y-TZP10 vol.% 3Y-TZP
Fig. 4. XRD data showing the evolution of volume fraction of trans-formed zirconia as a function of the aging treatment time, for severalcomposites (different 3Y-TZP content).
May 2005 Microstructural Investigation of Aging in ZTA 1275
method. Values are given in Table I. An average zirconia grainsize of 0.5 mm was found, independent of the zirconia content inthe sample. Thus, any change of aging behavior cannot be re-lated to 3Y-TZP grain size. It has been shown by precedentstudies26,27 that grain size was the more important factor con-trolling the aging sensitivity. The point of the analysis performedhere was to show that the zirconia grain size is almost inde-pendent of the zirconia content in the composite in this case, sothis factor will have, if any, a minor influence on the agingbehavior of the composite. Hence, differences in the aging be-havior must be related to different microstructural features. Asfar as the alumina grain size is concerned, it shows little varia-tion with the zirconia content. This variation might have an in-fluence on the residual stresses,28 this factor being a second-order factor in the aging sensitivity.
(6) AFM
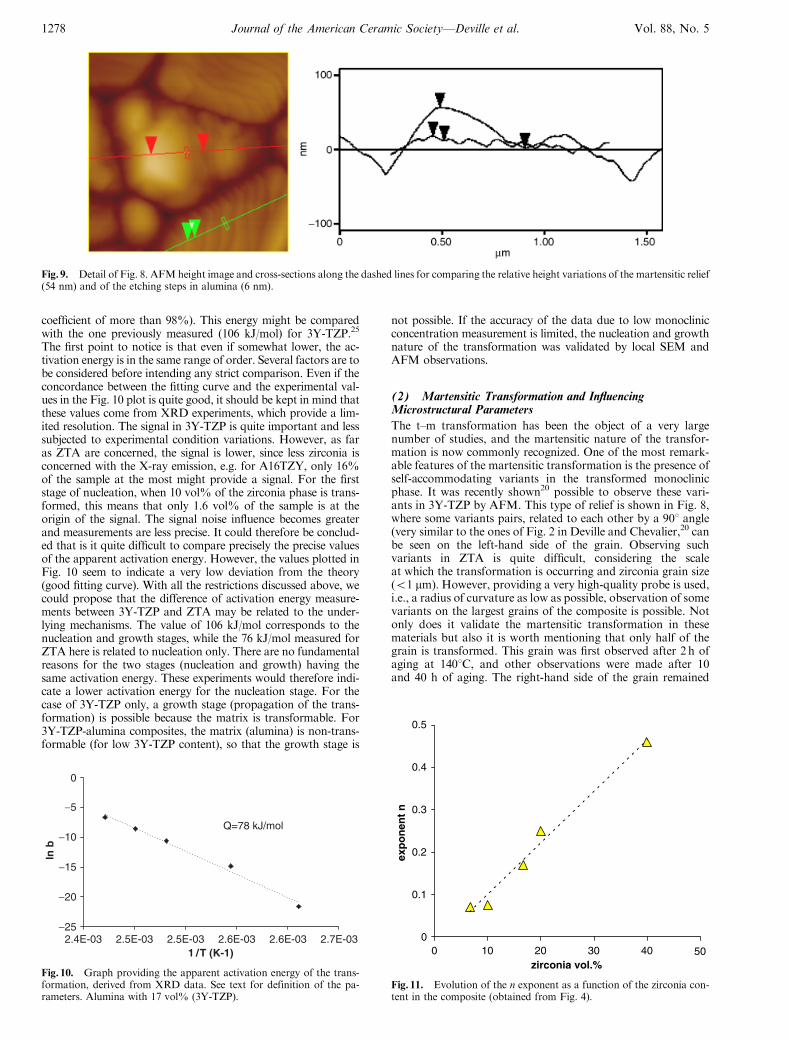
The same zone was successively observed by SEM in BEI modeand AFM in contact mode at different aging treatment times.Micrographs are shown in Fig. 7. The microstructure is clearlyvisible, with dark grain boundaries (the brighter the image thehigher the relief), and the grains were easily separated. Whencomparing AFM micrographs obtained after and before the ag-ing treatment, it is consequently possible to identify grains thathave transformed (arrows). Transformation induces a height in-crease, modifying the AFM contrast and consequently trans-
formed grains brighten up. The microstructural environment ofthe grains can be identified on the SEM micrograph. From thisfigure, it can be observed that transformation occurs equally inisolated grains and agglomerates; agglomerates did not appearas preferential nucleation sites.
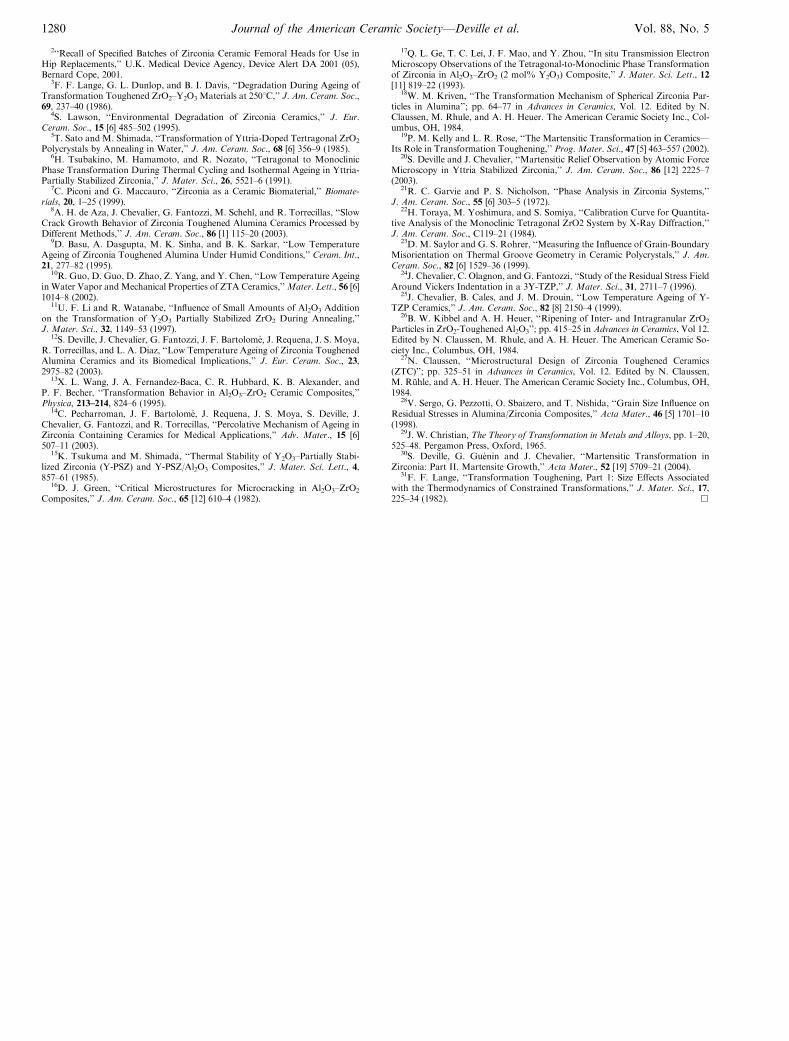
Self-accommodating martensitic variant pairs were also ob-served in some of the largest grains of the samples. An exampleis shown in Fig. 8. The effect of thermal etching on the grains’surface relief can be seen on the surrounding grains. Alumina isindeed more sensitive than zirconia to the etching treatment, andthe surface relief is modified according to its crystallographicorientation to the surface.23 However, it is worth noticing thatthe scale of thermal etching-induced relief is much lower thanthat due to transformation. The rippled surface induced by theetching treatment shown on the bottom alumina grain in Fig. 8is limited to 5 nm, while the surface increase after transforma-tion observed on the zirconia grain is about 60 nm. Cross-sec-tions of both the transformed grains and the alumina etchingsteps are given in Fig. 9. Again, the contrast of AFM derivateimage is proportional to the rate of relief variation and not tothe magnitude of the relief, which explains why the thermal etchsteps in the alumina are apparently more impressive. The trans-formation-induced relief is clearly more important than the etch-induced relief.
IV. Discussion
(1) Mehl–Avrami–Johnson (MAJ) Model
(A) Comparison with 3Y-TZP: For 3Y-TZP,25 the rela-tionship between the amount of monoclinic phase and agingtime at various temperatures can be described by a sigmoidallaw. This might be modeled by the MAJ equation, i.e.,
f ¼ 1� exp � btð Þnð Þ
where f is the transformation fraction, t is the time, and b and nare constants dependent on the material. Moreover, b is a ther-mally activated parameter, providing the apparent activation
0
0.05
0.1
0.15
0 10 20 30 40 50aging time (hrs)
volu
me
frac
tio
n o
f tr
ansf
orm
ed z
irco
nia
413 K408 K393 K383 K
Fig. 5. XRD data showing the volume fraction of transformed zirconiaas a function of the aging treatment time for different temperatures.Alumina with 17 vol% (3Y-TZP).
Table I. Alumina and Zirconia Grain Size for the DifferentCompositions
3Y-TZP (vol%) Alumina grain size (mm) 3Y-TZP grain size (mm)
10 1.3070.02 0.5170.0213 1.3070.03 0.5470.0317 1.2070.03 0.4770.0320 1.2070.02 0.5070.02
Fig. 6. SEM micrograph of the microstructures of two different compositions, i.e., 10 and 20 vol% of (3Y-TZP).
1276 Journal of the American Ceramic Society—Deville et al. Vol. 88, No. 5
energy Q:
b ¼ b0 exp �Q
RT
� �
where b0 is a material constant, R is the gas constant, and T isthe temperature. This model is based on the nucleation andgrowth nature of the transformation. By plotting the transfor-mation curve at different temperatures, it is possible to measurethe apparent activation energy (Fig. 10) and the exponent n(Fig. 11). In the MAJ model, the n exponent is related to nu-cleation and growth conditions. A value between 3 and 4 willindicate a nucleation and 3D-growth behavior. This value is in-deed observed for unconstrained zirconia (3Y-TZP), where nomatrix prevents the transformation. In the present case, theoverall behavior is different. For all compositions (i.e. up to 20vol% of 3Y-TZP), n is kept below 1, and varies linearly with thezirconia content. This would suggest that only nucleation occursand the growth stage is not present. This might be easily inter-
preted considering the microstructure and the restricting influ-ence of the matrix on the transformation. For low zirconiacontents, the grains are distributed quite evenly in the matrix;the agglomerates fraction is quite low, so that the majority of thezirconia grains are isolated in the matrix. If one grain is trans-forming, the transformation will not propagate to surroundingzirconia grains, since alumina is found in between. Near-to-nearpropagation of the transformation is therefore not possible. Thisis indeed what is observed on the AFM scans. When the zirconiafraction is increasing, zirconia grains became closer to each oth-er and more agglomerates are found, as zirconia paths are build-ing in the matrix. Above the percolation points, continuouspaths of zirconia grains exist. The existence of a zirconia per-colation threshold above which the transformation is propagat-ing has been recently demonstrated.14 Since percolation is a 3Dphenomenon, only portions of these paths are visible in 2D ob-servations (cross-sections), explaining the apparent presence ofzirconia agglomerates.
When a grain is transforming, triggering the transformationof a neighboring grain becomes more likely, as more and moreneighboring zirconia grains are found, allowing the transmissionof the transformation shear strain. There will be therefore atendency toward the growth stage (propagation of the transfor-mation). However, this phenomenon is clearly limited by theupper limit of zirconia content chosen in this study. Of all thematerials chosen here, two compositions (17 and 20 vol%) be-long to the composites above the percolation point. Hence, onlythese materials could possibly show propagation of the trans-formation along the zirconia grain paths.
Finally, the low values observed for the n exponent are worthdiscussing. A value of 1, according to the MAJ model,29 willrefer to nucleation only. Lower values as observed here wouldtherefore suggest that not only is the growth stage absent butalso the nucleation stage is not occurring as freely as it would inunconstrained zirconia. The alumina matrix does not only pre-vent the propagation of the transformation, but it does alsopartially prevent nucleation of monoclinic phase. This effectmight be explained by the higher Young’s modulus of alumina,compared with zirconia. When the zirconia content is increas-ing, nucleating the monoclinic phase becomes easier, as the ap-parent matrix modulus is reduced. This is very clearly observedin Fig. 11, where the n exponent is found to vary linearly withthe zirconia content. The matrix still has an effect above thepercolation threshold, explaining the low values measured forthe n exponent.
(B) Activation Energy: Comparison with 3Y-TZP: Fromthe XRD experiments carried out here, it was possible to measurean apparent activation energy. The plot of ln(b) versus 1/T, pro-viding this value, is shown in Fig. 10. A value of 78 kJ/mol isextracted from the plot, with a good accuracy (correlation
Fig. 7. SEM (left) and AFM (middle and right) observation of the transformation of the surface grains, at different aging treatment times (0 and 5 h at413 K), for the same zone of the sample (Al2O3–13 vol% (3Y-TZP)). Arrows indicate the grains that transformed during the treatment stage between thetwo observations.
Fig. 8. AFM derivate image and SEM image of a partially transformedgrain (40 h at 413 K in autoclave) in (Al2O3–17 vol% (3Y-TZP)). Self-accommodated martensitic variants are clearly visible, and the micro-structural environment of the grain could be identified on the SEM mi-crograph (phase contrast, zirconia appears very bright).
May 2005 Microstructural Investigation of Aging in ZTA 1277
coefficient of more than 98%). This energy might be comparedwith the one previously measured (106 kJ/mol) for 3Y-TZP.25
The first point to notice is that even if somewhat lower, the ac-tivation energy is in the same range of order. Several factors are tobe considered before intending any strict comparison. Even if theconcordance between the fitting curve and the experimental val-ues in the Fig. 10 plot is quite good, it should be kept in mind thatthese values come from XRD experiments, which provide a lim-ited resolution. The signal in 3Y-TZP is quite important and lesssubjected to experimental condition variations. However, as faras ZTA are concerned, the signal is lower, since less zirconia isconcerned with the X-ray emission, e.g. for A16TZY, only 16%of the sample at the most might provide a signal. For the firststage of nucleation, when 10 vol% of the zirconia phase is trans-formed, this means that only 1.6 vol% of the sample is at theorigin of the signal. The signal noise influence becomes greaterand measurements are less precise. It could therefore be conclud-ed that is it quite difficult to compare precisely the precise valuesof the apparent activation energy. However, the values plotted inFig. 10 seem to indicate a very low deviation from the theory(good fitting curve). With all the restrictions discussed above, wecould propose that the difference of activation energy measure-ments between 3Y-TZP and ZTA may be related to the under-lying mechanisms. The value of 106 kJ/mol corresponds to thenucleation and growth stages, while the 76 kJ/mol measured forZTA here is related to nucleation only. There are no fundamentalreasons for the two stages (nucleation and growth) having thesame activation energy. These experiments would therefore indi-cate a lower activation energy for the nucleation stage. For thecase of 3Y-TZP only, a growth stage (propagation of the trans-formation) is possible because the matrix is transformable. For3Y-TZP-alumina composites, the matrix (alumina) is non-trans-formable (for low 3Y-TZP content), so that the growth stage is
not possible. If the accuracy of the data due to low monoclinicconcentration measurement is limited, the nucleation and growthnature of the transformation was validated by local SEM andAFM observations.
(2) Martensitic Transformation and InfluencingMicrostructural Parameters
The t–m transformation has been the object of a very largenumber of studies, and the martensitic nature of the transfor-mation is now commonly recognized. One of the most remark-able features of the martensitic transformation is the presence ofself-accommodating variants in the transformed monoclinicphase. It was recently shown20 possible to observe these vari-ants in 3Y-TZP by AFM. This type of relief is shown in Fig. 8,where some variants pairs, related to each other by a 901 angle(very similar to the ones of Fig. 2 in Deville and Chevalier,20 canbe seen on the left-hand side of the grain. Observing suchvariants in ZTA is quite difficult, considering the scaleat which the transformation is occurring and zirconia grain size(o1 mm). However, providing a very high-quality probe is used,i.e., a radius of curvature as low as possible, observation of somevariants on the largest grains of the composite is possible. Notonly does it validate the martensitic transformation in thesematerials but also it is worth mentioning that only half of thegrain is transformed. This grain was first observed after 2 h ofaging at 1401C, and other observations were made after 10and 40 h of aging. The right-hand side of the grain remained
Fig. 9. Detail of Fig. 8. AFMheight image and cross-sections along the dashed lines for comparing the relative height variations of the martensitic relief(54 nm) and of the etching steps in alumina (6 nm).
0
0.1
0.2
0.3
0.4
0.5
0 10 20 30 40 50zirconia vol.%
exp
on
ent
n
Fig. 11. Evolution of the n exponent as a function of the zirconia con-tent in the composite (obtained from Fig. 4).
−25
−20
−15
−10
−5
0
2.4E-03 2.5E-03 2.5E-03 2.6E-03 2.6E-03 2.7E-031 / T (K-1)
Q=78 kJ/mol
ln b
Fig. 10. Graph providing the apparent activation energy of the trans-formation, derived from XRD data. See text for definition of the pa-rameters. Alumina with 17 vol% (3Y-TZP).
1278 Journal of the American Ceramic Society—Deville et al. Vol. 88, No. 5

untransformed even after 40 h of aging. An extensive study hasbeen dedicated to the observation of martensitic relief in zir-conia-based ceramics.30 Such behavior was never observed. Thegrains are either completely transformed after a long time or notat all. The hypothesis of a different orientation of variant pairson the right-hand side, leaving the surface undisturbed aftertransformation, is crystallographically forbidden. The partialtransformation of the grain must therefore be considered. Thisbehavior might be accounted for by the influence of the aluminamatrix. As it can be seen on the SEM picture, one zirconia grainis lying on the left of the grain and another one just below. Theconstraining effect of the matrix is therefore reduced on the left-hand side, which was therefore able to transform. However, dueto the difference in Young’s modulus, as described before, thematrix restricts the transformation severely.31 On all the othersides of the grain, only alumina is found, so that the formationof variants of large size is more difficult.
The case of transformation of a zirconia grain in a similarsituation but of smaller size is given in Fig. 12. As it can be seenfrom the SEM–BEI micrograph in the inset, two small zirconiagrains are lying side to side. The left-hand side grain clearlytransformed during the autoclave treatment performed betweenthe two AFM micrographs, as the relief height increase is ob-vious. The situation is similar to that of Fig. 8, in that the grainof interest is surrounded by a non-transformable alumina ma-trix, except on one side. However, the transformation strainaccommodation is easier, due to the smaller grain size, so thatthe whole grain was able to transform. The relief increase ofthe other grain is probably a ‘‘pop-out’’ effect related to thetransformation of the first grain. The constraining effect ofthe alumina matrix was not important enough to prevent thetransformation as previously. The GBH is also too importantto allow observation of martensite variants.
V. Conclusions
The autoclave aging behavior of zirconia-toughened aluminacomposites was studied by XRD, SEM, and AFM.
It was shown that the transformation was occurring by a nu-cleation mechanism only, for low zirconia fractions, as com-pared with nucleation and growth classically observed in 3Y-TZP. The growth stage of the transformation is limited by thenon-transformable matrix and occurs only when zirconia grains’clustering is found. The time–temperature equivalency of thetransformation was verified and an apparent activation energyof 78 kJ/mol was measured, value related for the nucleationstage only. The influence of the alumina matrix was assessed bylocal SEM and AFM observations. Not only does alumina limitthe transformation rate but also in certain cases, the constrainingeffect of the matrix might be greater than the driving force fortransformation once the transformation is initiated in a grain,leading to partially transformed grains. Transformation was ob-served to occur in both agglomerates and isolated zirconiagrains. The microstructural environment therefore appearsmore important for the aging sensitivity than the grain size.
Acknowledgments
The authors are indebted to the CLYME (Consortium Lyonnais de Micro-scopie Electronique) for use of the XL30 ESEM-FEG and to the CLAMS (Con-sortium de Laboratoires d’Analyse par Microscopie a Sonde locale) for use of thenanoscope.
References
1‘‘Zirconia Ceramic Heads for Modular Total Hip Femoral Components: Ad-vice to Users on Resterilization,’’ U.K. Medical Device Agency, MDA SafetyNotice, D. Bruce Burlington, SN9617, 1996.
Fig. 12. AFM height image and cross-sections along the dashed line, showing the transformation of a grain occurring during the autoclave treatmentbetween the two micrographs (Al2O3–17 vol% (3Y-TZP)). The nature of the various grains (3Y-TZP or Al2O3) can be identified by the SEM–BEImicrograph in the inset.
May 2005 Microstructural Investigation of Aging in ZTA 1279
2‘‘Recall of Specified Batches of Zirconia Ceramic Femoral Heads for Use inHip Replacements,’’ U.K. Medical Device Agency, Device Alert DA 2001 (05),Bernard Cope, 2001.
3F. F. Lange, G. L. Dunlop, and B. I. Davis, ‘‘Degradation During Ageing ofTransformation Toughened ZrO2–Y2O3 Materials at 2501C,’’ J. Am. Ceram. Soc.,69, 237–40 (1986).
4S. Lawson, ‘‘Environmental Degradation of Zirconia Ceramics,’’ J. Eur.Ceram. Soc., 15 [6] 485–502 (1995).
5T. Sato and M. Shimada, ‘‘Transformation of Yttria-Doped Tertragonal ZrO2
Polycrystals by Annealing in Water,’’ J. Am. Ceram. Soc., 68 [6] 356–9 (1985).6H. Tsubakino, M. Hamamoto, and R. Nozato, ‘‘Tetragonal to Monoclinic
Phase Transformation During Thermal Cycling and Isothermal Ageing in Yttria-Partially Stabilized Zirconia,’’ J. Mater. Sci., 26, 5521–6 (1991).
7C. Piconi and G. Maccauro, ‘‘Zirconia as a Ceramic Biomaterial,’’ Biomate-rials, 20, 1–25 (1999).
8A. H. de Aza, J. Chevalier, G. Fantozzi, M. Schehl, and R. Torrecillas, ‘‘SlowCrack Growth Behavior of Zirconia Toughened Alumina Ceramics Processed byDifferent Methods,’’ J. Am. Ceram. Soc., 86 [1] 115–20 (2003).
9D. Basu, A. Dasgupta, M. K. Sinha, and B. K. Sarkar, ‘‘Low TemperatureAgeing of Zirconia Toughened Alumina Under Humid Conditions,’’ Ceram. Int.,21, 277–82 (1995).
10R. Guo, D. Guo, D. Zhao, Z. Yang, and Y. Chen, ‘‘Low Temperature Ageingin Water Vapor andMechanical Properties of ZTA Ceramics,’’Mater. Lett., 56 [6]1014–8 (2002).
11U. F. Li and R. Watanabe, ‘‘Influence of Small Amounts of Al2O3 Additionon the Transformation of Y2O3 Partially Stabilized ZrO2 During Annealing,’’J. Mater. Sci., 32, 1149–53 (1997).
12S. Deville, J. Chevalier, G. Fantozzi, J. F. Bartolome, J. Requena, J. S. Moya,R. Torrecillas, and L. A. Diaz, ‘‘Low Temperature Ageing of Zirconia ToughenedAlumina Ceramics and its Biomedical Implications,’’ J. Eur. Ceram. Soc., 23,2975–82 (2003).
13X. L. Wang, J. A. Fernandez-Baca, C. R. Hubbard, K. B. Alexander, andP. F. Becher, ‘‘Transformation Behavior in Al2O3–ZrO2 Ceramic Composites,’’Physica, 213–214, 824–6 (1995).
14C. Pecharroman, J. F. Bartolome, J. Requena, J. S. Moya, S. Deville, J.Chevalier, G. Fantozzi, and R. Torrecillas, ‘‘Percolative Mechanism of Ageing inZirconia Containing Ceramics for Medical Applications,’’ Adv. Mater., 15 [6]507–11 (2003).
15K. Tsukuma and M. Shimada, ‘‘Thermal Stability of Y2O3–Partially Stabi-lized Zirconia (Y-PSZ) and Y-PSZ/Al2O3 Composites,’’ J. Mater. Sci. Lett., 4,857–61 (1985).
16D. J. Green, ‘‘Critical Microstructures for Microcracking in Al2O3–ZrO2
Composites,’’ J. Am. Ceram. Soc., 65 [12] 610–4 (1982).
17Q. L. Ge, T. C. Lei, J. F. Mao, and Y. Zhou, ‘‘In situ Transmission ElectronMicroscopy Observations of the Tetragonal-to-Monoclinic Phase Transformationof Zirconia in Al2O3–ZrO2 (2 mol% Y2O3) Composite,’’ J. Mater. Sci. Lett., 12[11] 819–22 (1993).
18W. M. Kriven, ‘‘The Transformation Mechanism of Spherical Zirconia Par-ticles in Alumina’’; pp. 64–77 in Advances in Ceramics, Vol. 12. Edited by N.Claussen, M. Rhule, and A. H. Heuer. The American Ceramic Society Inc., Col-umbus, OH, 1984.
19P. M. Kelly and L. R. Rose, ‘‘The Martensitic Transformation in Ceramics—Its Role in Transformation Toughening,’’ Prog. Mater. Sci., 47 [5] 463–557 (2002).
20S. Deville and J. Chevalier, ‘‘Martensitic Relief Observation by Atomic ForceMicroscopy in Yttria Stabilized Zirconia,’’ J. Am. Ceram. Soc., 86 [12] 2225–7(2003).
21R. C. Garvie and P. S. Nicholson, ‘‘Phase Analysis in Zirconia Systems,’’J. Am. Ceram. Soc., 55 [6] 303–5 (1972).
22H. Toraya, M. Yoshimura, and S. Somiya, ‘‘Calibration Curve for Quantita-tive Analysis of the Monoclinic Tetragonal ZrO2 System by X-Ray Diffraction,’’J. Am. Ceram. Soc., C119–21 (1984).
23D. M. Saylor and G. S. Rohrer, ‘‘Measuring the Influence of Grain-BoundaryMisorientation on Thermal Groove Geometry in Ceramic Polycrystals,’’ J. Am.Ceram. Soc., 82 [6] 1529–36 (1999).
24J. Chevalier, C. Olagnon, and G. Fantozzi, ‘‘Study of the Residual Stress FieldAround Vickers Indentation in a 3Y-TZP,’’ J. Mater. Sci., 31, 2711–7 (1996).
25J. Chevalier, B. Cales, and J. M. Drouin, ‘‘Low Temperature Ageing of Y-TZP Ceramics,’’ J. Am. Ceram. Soc., 82 [8] 2150–4 (1999).
26B. W. Kibbel and A. H. Heuer, ‘‘Ripening of Inter- and Intragranular ZrO2
Particles in ZrO2-Toughened Al2O3’’; pp. 415–25 in Advances in Ceramics, Vol 12.Edited by N. Claussen, M. Rhule, and A. H. Heuer. The American Ceramic So-ciety Inc., Columbus, OH, 1984.
27N. Claussen, ‘‘Microstructural Design of Zirconia Toughened Ceramics(ZTC)’’; pp. 325–51 in Advances in Ceramics, Vol. 12. Edited by N. Claussen,M. Ruhle, and A. H. Heuer. The American Ceramic Society Inc., Columbus, OH,1984.
28V. Sergo, G. Pezzotti, O. Sbaizero, and T. Nishida, ‘‘Grain Size Influence onResidual Stresses in Alumina/Zirconia Composites,’’ Acta Mater., 46 [5] 1701–10(1998).
29J. W. Christian, The Theory of Transformation in Metals and Alloys, pp. 1–20,525–48. Pergamon Press, Oxford, 1965.
30S. Deville, G. Guenin and J. Chevalier, ‘‘Martensitic Transformation inZirconia: Part II. Martensite Growth,’’ Acta Mater., 52 [19] 5709–21 (2004).
31F. F. Lange, ‘‘Transformation Toughening, Part 1: Size Effects Associatedwith the Thermodynamics of Constrained Transformations,’’ J. Mater. Sci., 17,225–34 (1982). &
1280 Journal of the American Ceramic Society—Deville et al. Vol. 88, No. 5