
IVIVC – Methods and Applications in MR Product Development 30-color.pdf · Purpose of IVIVC and...
36
IVIVC – Methods and Applications in MR Product Development H. Rettig BioVista LLC www.ivivc.com BioVista
Transcript of IVIVC – Methods and Applications in MR Product Development 30-color.pdf · Purpose of IVIVC and...

IVIVC – Methods and Applications in
MR Product Development
H. Rettig
BioVista LLCwww.ivivc.com
BioVista

Purpose of IVIVC and BCS
BioVista
• Reduction of regulatory burden: IVIVC in lieu of additional in vivo experiments, leading to
• Time/Cost savings during product development• Scale-up, post approval changes• Biowaiver
• Enhanced significance of in vitro testing• Justification for “therapeutic” product quality
• therapeutically meaningful release specifications
• (Less testing in humans)

Outline
BioVista
• Definitions (IVIVC, BCS)
• Mathematical Procedure
• Applications

In Vitro-In Vivo Correlation (IVIVC)
Working Definition:
A predictive mathematical treatment describing the relationship between an in vitro property of a dosage form (usually the rate or extent of drug release) and a relevant in vivo response (e.g. plasma drug concentrations or amount of drug absorbed).
BioVista

Categories of In Vitro-In VivoCorrelations
• Level A functional relationship between in vitrodissolution and the in vivo input rate, correlation of profiles, linear or non-linear relationship
• Level B correlation based on statistical moment analysis (in vitrodissolution time is correlated with mean residence time)
• Level C single point relationship between one dissolutionparameter, (e.g. T50%, % dissolved in 4h) and one pharmacokinetic parameter (e.g. AUC, Cmax)(Level D: multiple point relationship)
BioVista
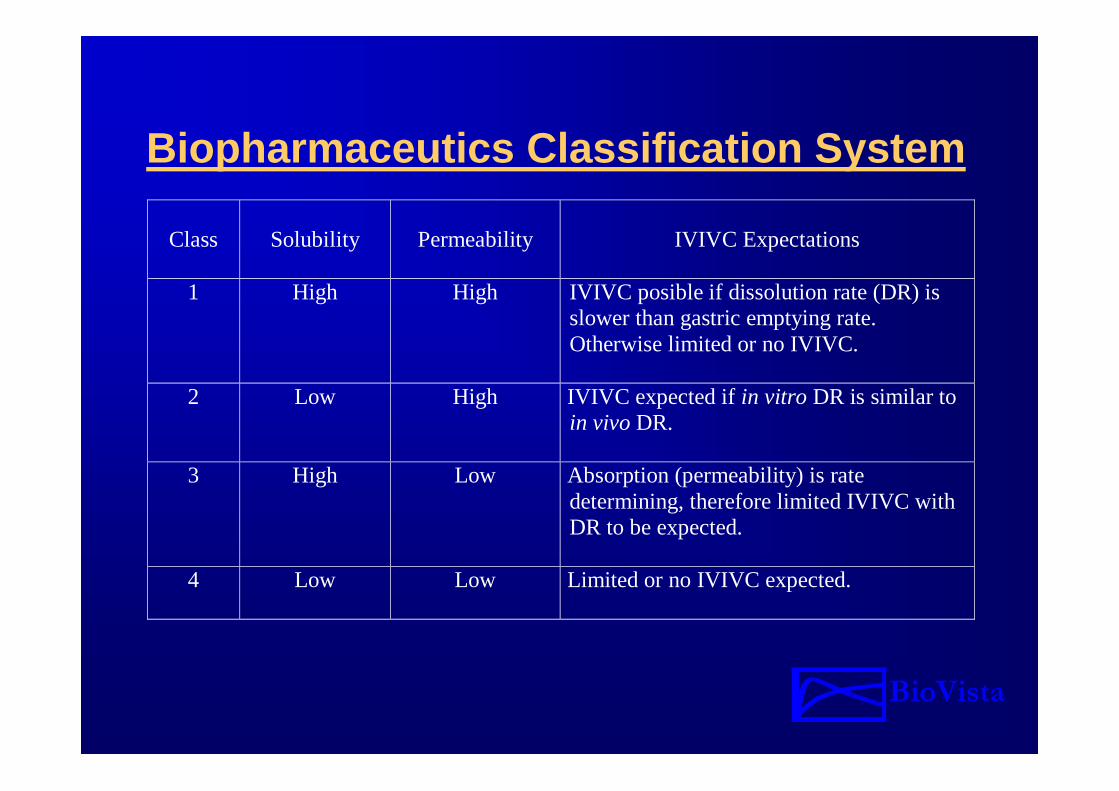
Biopharmaceutics Classification System
BioVista
Class Solubility Permeability IVIVC Expectations
1 High High IVIVC posible if dissolution rate (DR) isslower than gastric emptying rate.Otherwise limited or no IVIVC.
2 Low High IVIVC expected if in vitro DR is similar toin vivo DR.
3 High Low Absorption (permeability) is ratedetermining, therefore limited IVIVC withDR to be expected.
4 Low Low Limited or no IVIVC expected.
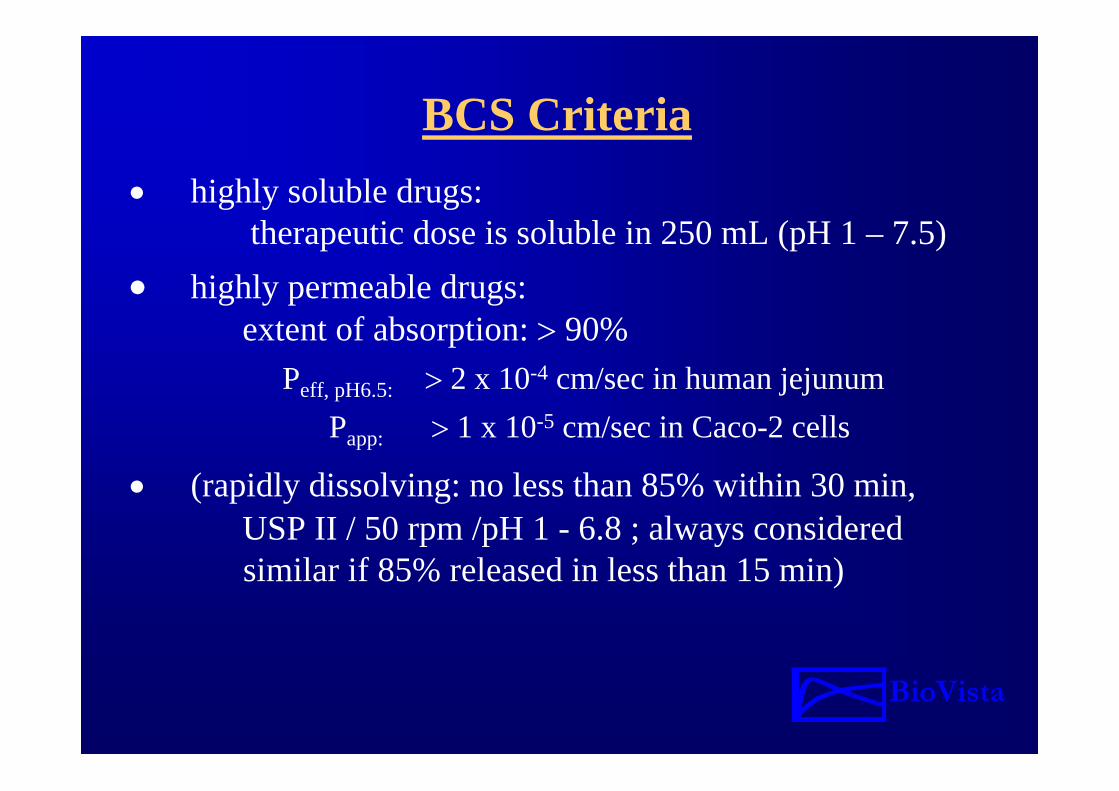
BCS Criteria• highly soluble drugs:
therapeutic dose is soluble in 250 mL (pH 1 – 7.5)
BioVista
• highly permeable drugs:extent of absorption: > 90%
Peff, pH6.5: > 2 x 10⁻⁴ cm/sec in human jejunumPapp: > 1 x 10⁻⁵ cm/sec in Caco-2 cells
• (rapidly dissolving: no less than 85% within 30 min,USP II / 50 rpm /pH 1 - 6.8 ; always consideredsimilar if 85% released in less than 15 min)
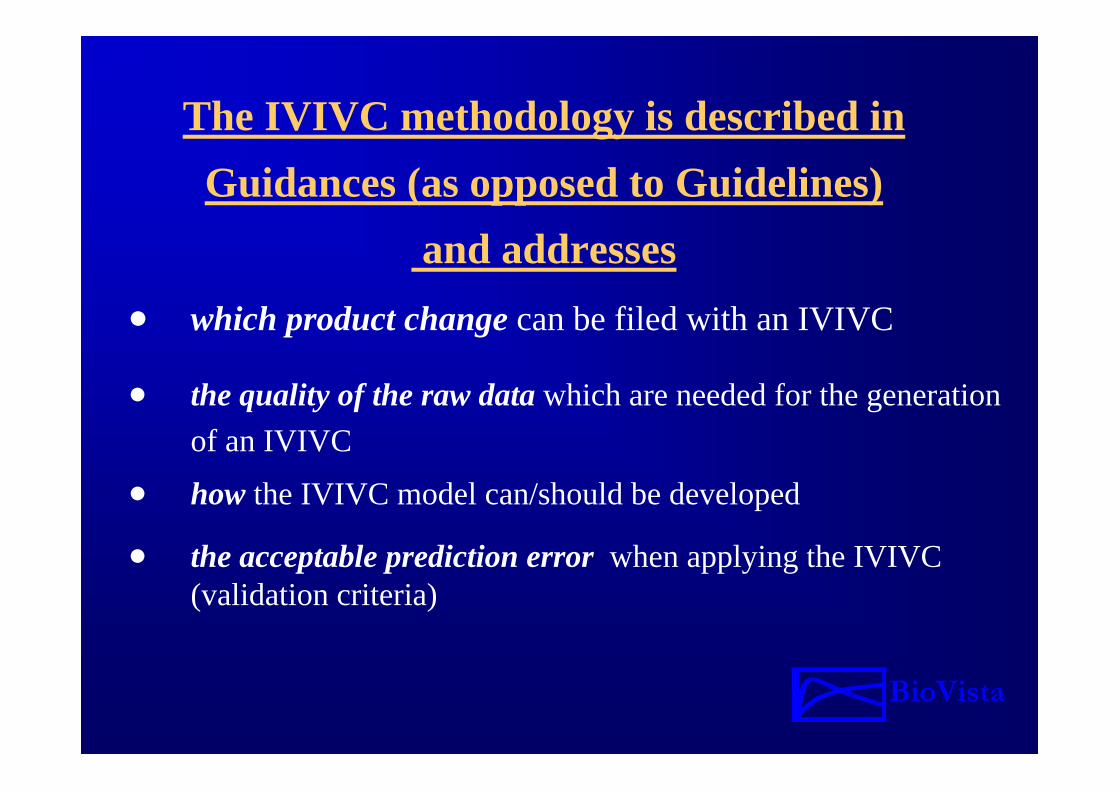
The IVIVC methodology is described inGuidances (as opposed to Guidelines)
and addresses
BioVista
• which product change can be filed with an IVIVC
• the quality of the raw data which are needed for the generation of an IVIVC
• how the IVIVC model can/should be developed
• the acceptable prediction error when applying the IVIVC (validation criteria)

Drug or Product Requirements for an IVIVC
BioVista
Does a correlation make medical or scientific sense?
• Caution, if narrow therapeutic range
• Linear pharmacokinetics
• Preferably BCS I or II

Data Requirements
BioVista
• data from batches tested in vivo• compendial method (justify other method)
• aqueous medium, n ≥ 12 (!), CV < 10%
• profiles of test products of the same type curve
• (difference factor f1, similarity factor f2)
In vitro data

Data Requirements
BioVista
• data from study in humans, n ≥ 6, fasted• cross-over design• formulations with different release rates• reference formulation (solution, i.v. bolus)• same moiety as measured in vitro
• (biobatch)
In vivo data
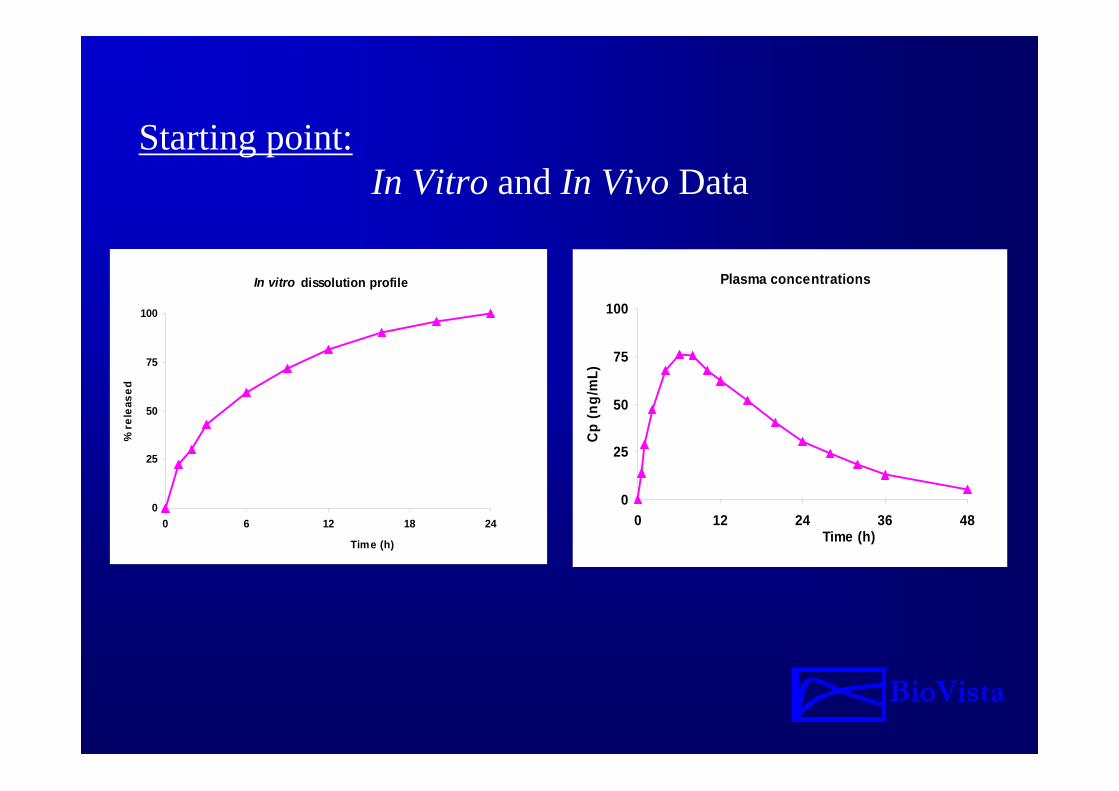
Starting point:In Vitro and In Vivo Data
BioVista
Plasma concentrations
0
25
50
75
100
0 12 24 36 48Time (h)
Cp
(ng/
mL)
In vitro dissolution profile
0
25
50
75
100
0 6 12 18 24
Time (h)
% r
elea
sed
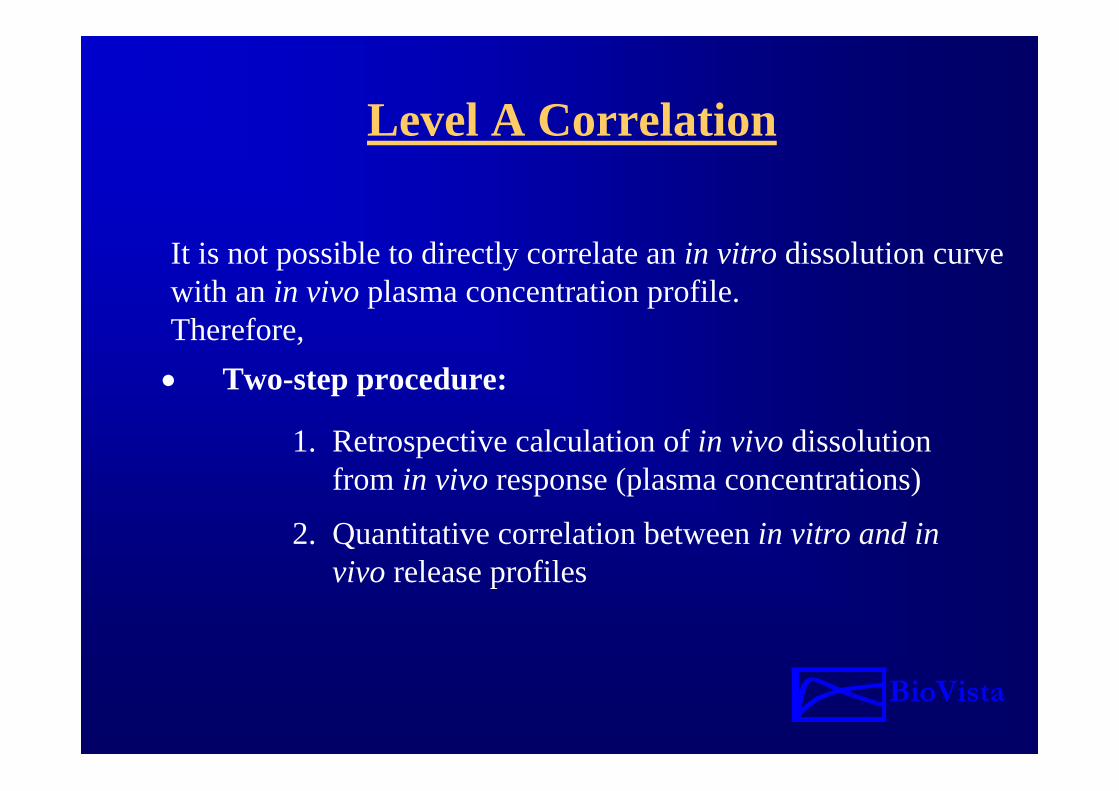
Level A Correlation
• Two-step procedure:
1. Retrospective calculation of in vivo dissolution from in vivo response (plasma concentrations)
2. Quantitative correlation between in vitro and in vivo release profiles
BioVista
It is not possible to directly correlate an in vitro dissolution curve with an in vivo plasma concentration profile.Therefore,

Mathematical Techniques
• Model-dependantbased on the mass balance among the pharmacokinetic compartments
(e.g. Wagner-Nelson, Loo-Riegelman)
Assessment of in vivo drug release or absorption from plasma profiles:
BioVista
• Model-independantbased on Theory of Linear System Analysis(Convolution / Deconvolution)

First step:Calculation of in vivo release profiles from plasma concentrations of an oral solution and different formulations
BioVista
Plasma concentrations:Oral solution and three formulations
0
25
50
75
100
0 12 24 36 48Time (h)
Cp (n
g/m
L)
In vivo release profiles
0
25
50
75
100
0 6 12 18 24Time (h)
% re
leas
ed

Second step:
Comparison of calculated in vivo release with in vitro release data for the same formulations and establishment of a quantitative correlation model using a linear or non-linear regression
BioVista
IVIVC Model:Regression line: Y = 0.97X + 1.62
0
20
40
60
80
100
0 20 40 60 80 100Vitro (%)
Vivo
(%)
In vitro vs. in vivo release
0
25
50
75
100
0 6 12 18 24
Time (h)
% re
leas
ed

Evaluation of Predictability of IVIVC
Different approaches are acceptable:
Estimation of the magnitude of the error in predicting the bioavailability from in vitro dissolution data
BioVista
• Internal predictability (with the formulations used for the development of IVIVC)
• External predictability (with the formulations not used for the development of IVIVC)

Metrics to Evaluate Predictability of IVIVC
Percent prediction error (%PE):
Acceptance Criteria:
• ≤ 15% for absolute prediction error (%PE) of each formulation
• ≤ 10% for mean absolute prediction error (%PE)
BioVista
For Cmax: {[Cmax(obs) – Cmax(pred)]/ Cmax(obs)}*100
For AUC: {[AUC(obs) – AUC(pred)]/AUC(obs) }*100

Limitation of the Predictability Metrics
BioVista
• Metrics used to evaluate the predictability is described simply as the prediction error (%PE) for Cmax and AUC, i.e. predicted plasma profiles are reduced to only two PK parameters
• Cmax predicted with the IVIVC model represents the maximum of the mean plasma profile - but is compared with the mean Cmax observed calculated as the average of individual profiles (at different Tmax!)
• Tmax is not included in predictability metrics

Weakness of the Predictability Metrics
BioVista
Cmax predicted ~ Cmax observed, but Tmax different
Mean plasma profiles
0
200
400
600
0 6 12 18 24Time (h)
Cp
(ng/
mL)
Predicted with IVIVC
Observed in vivo

Main Applications of the IVIVC in Product Development
BioVista
• Evidence for biorelevant and/or discriminating dissolution method
• Basis for biorelevant in vitro release specifications
• Justification for a biowaiver- Wider than standard (±10%) in vitro release specifications- Level 3 or Type II modification of the registered product- Line extensions (intermediate or lower strength)
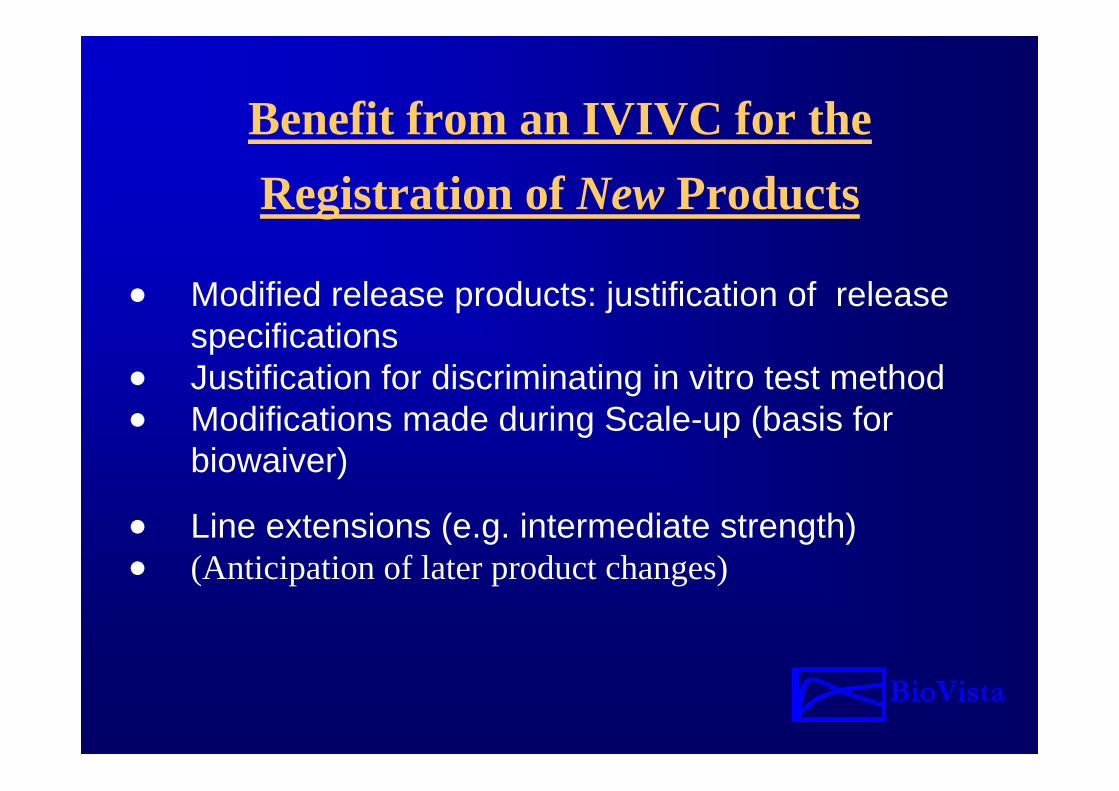
Benefit from an IVIVC for the Registration of New Products
• Modified release products: justification of release specifications
• Justification for discriminating in vitro test method• Modifications made during Scale-up (basis for
biowaiver)
• Line extensions (e.g. intermediate strength)• (Anticipation of later product changes)
BioVista

Registration of Changes for Existing Productswhere a Robust IVIVC can Substitute a
Bioequivalence Study
• Level 3 Changes (U.S.) [SUPAC]
• Type II Variations (European Union)
• (Line extensions (bracketing principle))
• Exceptions exist, e.g. narrow therapeutic range drugs, nonlinear pharmacokinetics, etc.
BioVista
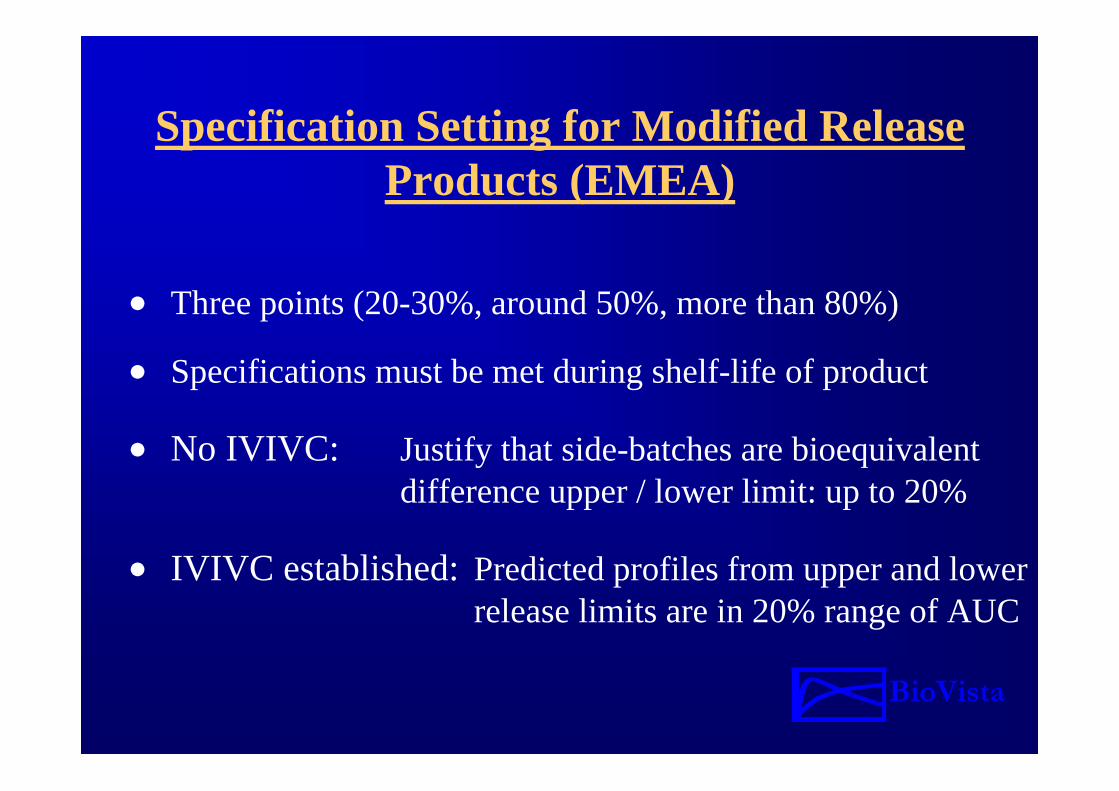
Specification Setting for Modified Release Products (EMEA)
• Three points (20-30%, around 50%, more than 80%)
• No IVIVC: Justify that side-batches are bioequivalent difference upper / lower limit: up to 20%
BioVista
• Specifications must be met during shelf-life of product
• IVIVC established: Predicted profiles from upper and lower release limits are in 20% range of AUC

Application / Request for a Biowaiver
BioVista
• IVIVC as justification for a biowaiver1. of additional strengths or line extensions 2. of Type II modifications
• IVIVC as justification for a biowaiver1. of additional strengths or line extensions 2. of Type II modifications
IV(marketed)
• IVIVC as base for biorelevant release specification setting • IVIVC as justification for biowaiver if formulation has to
undergo Type II modification
• IVIVC as base for biorelevant release specification setting
• IVIVC as justification for biowaiver if formulation has to undergo Type II modification
III
• Justification for discriminating dissolution method• IVIVC study with „final“ formulation• Justification for discriminating dissolution method
II
• Development of IVIVC from in vivo data from at least two ER formulations (as well as IR formulation or solution)
• If imitator product (generic): IVIVC study with 2 formulations as well as reference product and solution (weighting function)
If dissolution rate determining for absorption: • Initial development of IVIVC from first in vivo data
(Inclusion of rapid formulation in study for use as weighting function)
I
If additional extended release form from registered normal product (or IVIVC exists already for normal formulation)
• Dissolution profiles in pH range 1.2 – 6.8
Classification according to BCS:• Solubility in the pH range 1.2 – 6.8• Assessment of permeability
Preclin.
Already Registered CompoundNew Active CompoundPhase
• IVIVC as justification for a biowaiver1. of additional strengths or line extensions 2. of Type II modifications
• IVIVC as justification for a biowaiver1. of additional strengths or line extensions 2. of Type II modifications
IV(marketed)
• IVIVC as base for biorelevant release specification setting • IVIVC as justification for biowaiver if formulation has to
undergo Type II modification
• IVIVC as base for biorelevant release specification setting
• IVIVC as justification for biowaiver if formulation has to undergo Type II modification
III
• Justification for discriminating dissolution method• IVIVC study with „final“ formulation• Justification for discriminating dissolution method
II
• Development of IVIVC from in vivo data from at least two ER formulations (as well as IR formulation or solution)
• If imitator product (generic): IVIVC study with 2 formulations as well as reference product and solution (weighting function)
If dissolution rate determining for absorption: • Initial development of IVIVC from first in vivo data
(Inclusion of rapid formulation in study for use as weighting function)
I
If additional extended release form from registered normal product (or IVIVC exists already for normal formulation)
• Dissolution profiles in pH range 1.2 – 6.8
Classification according to BCS:• Solubility in the pH range 1.2 – 6.8• Assessment of permeability
Preclin.
Already Registered CompoundNew Active CompoundPhase

Example: In vitro Release of ER Tablets
BioVista
Product A ER Tablets 500mgMean in vitro release profiles (n=12)
0
20
40
60
80
100
0 8 16 24Time (h)
% R
elea
sed
"fast"
standard
"slow "

Example: In Vivo Data ER and IR
BioVista
Product A ER Tablets 500mgMean plasma concentration profiles (n=15)
0
200
400
600
800
1000
0 8 16 24Time (h)
Cp
(ng/
mL)
immediate release
"fast"
"standard"
"slow "
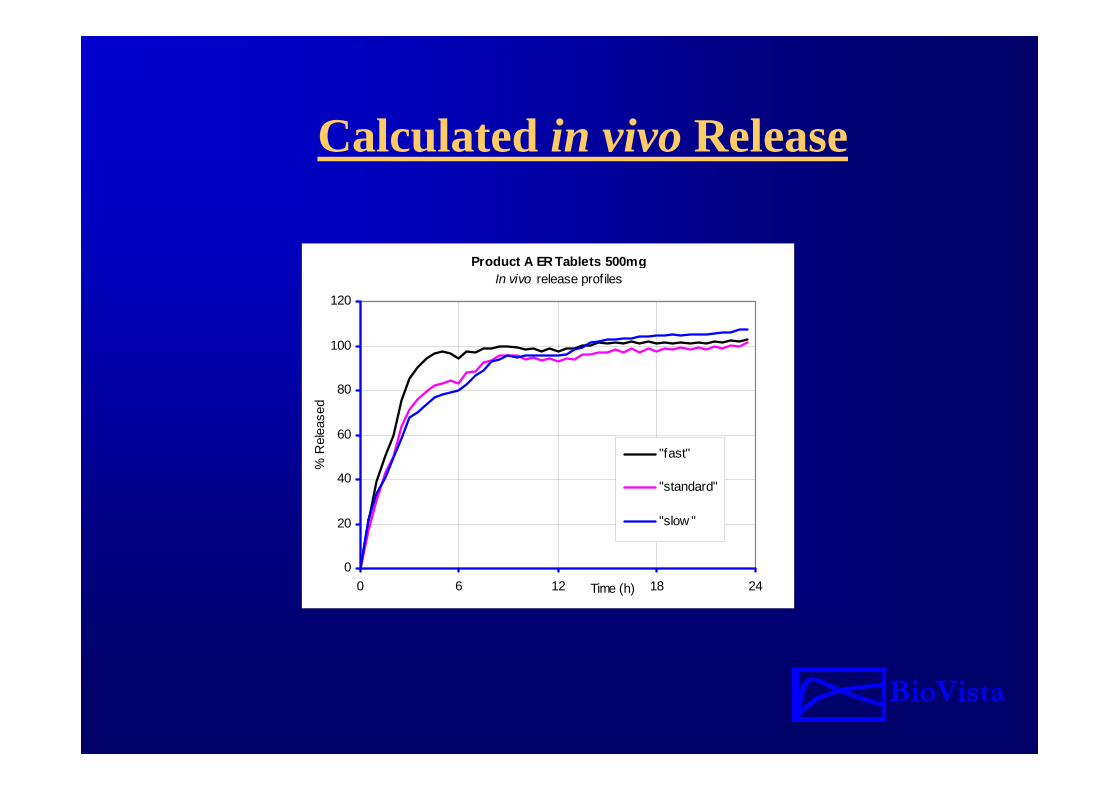
Calculated in vivo Release
BioVista
Product A ER Tablets 500mg In vivo release profiles
0
20
40
60
80
100
120
0 6 12 18 24Time (h)
% R
elea
sed
"fast"
"standard"
"slow "

IVIVC / Nonlinear Regression
BioVista
Product A ER Tablets 500mg IVIVC Model
0
20
40
60
80
100
0 20 40 60 80 100% Released in vitro (X)
% R
elea
sed
in v
ivo
(Y)
"fast"
"standard"
"slow "
curvelinear regression
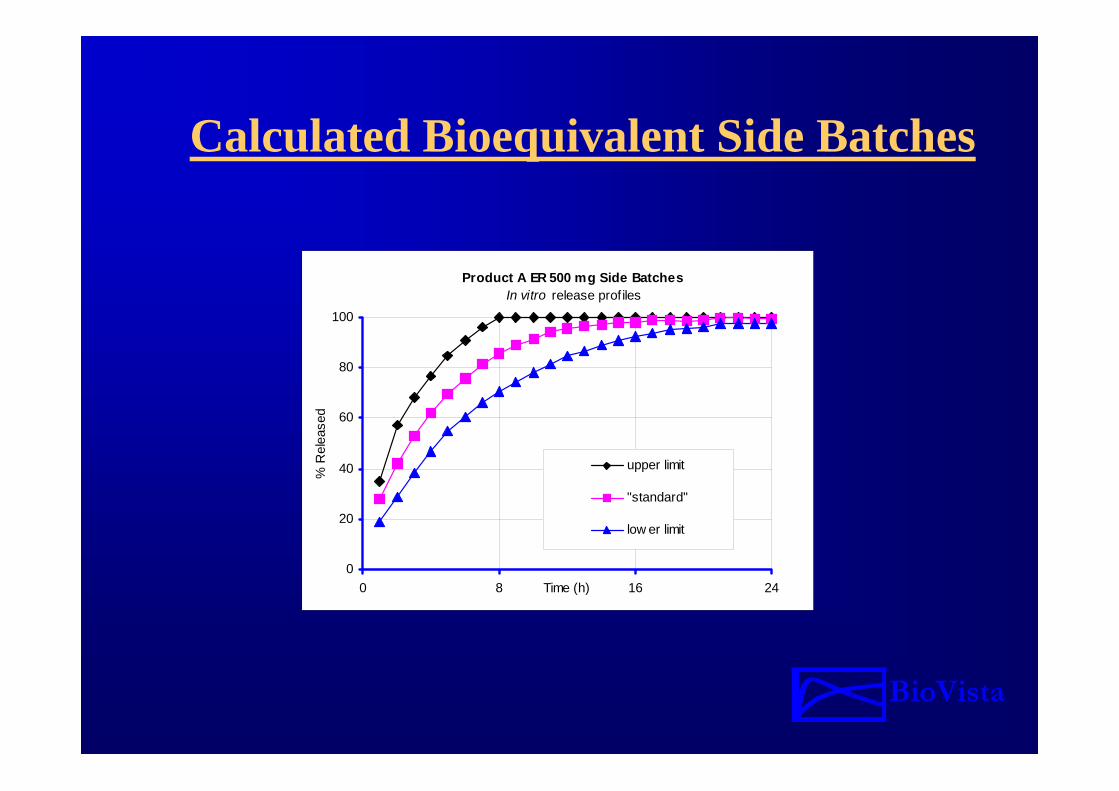
Calculated Bioequivalent Side Batches
BioVista
Product A ER 500 mg Side BatchesIn vitro release profiles
0
20
40
60
80
100
0 8 16 24Time (h)
% R
elea
sed
upper limit
"standard"
low er limit

Predicted in vivo Profiles
BioVista
Product A ER 500 mg Side BatchesMean plasma concentration profiles
0
200
400
600
800
1000
0 8 16 24Time (h)
Cp
(ng/
mL)
upper limit predicted
"standard" observed
low er limit predicted

Validation Ratios for Side Batches
BioVista
99.0101.2102.25906.585849.115976.25AUC(0-24h)
88.6114.3129.0570.80505.83652.68Cmax
LL/StandardUL/StandardUL/LLObserved Standard
Predicted LL
Predicted ULPK-parameters
Relative Bioavailability
99.0101.2102.25906.585849.115976.25AUC(0-24h)
88.6114.3129.0570.80505.83652.68Cmax
LL/StandardUL/StandardUL/LLObserved Standard
Predicted LL
Predicted ULPK-parameters
Relative Bioavailability

The Regulatory Framework for the IVIVC (FDA)
• Scale up and Post Approval Changes-Immediate Release (SUPAC-IR), November, 1995
• Scale up and Post Approval Changes-Modified Release (SUPAC-MR), June, 1996
• FDA Guidance for Industry: Dissolution Testing of Immediate Release Solid Dosage Forms, August, 1997
• FDA Guidance for Industry: Development, Evaluation and Application of In vitro-In vivo Correlations for Extended Release Solid Oral Dosage Forms, September, 1997
• FDA Guidance for Industry: Biowaiver for IR Oral Forms Based on BCS, August, 2000
• FDA Guidance for Industry: BA and BE Studies for Orally Administered Drug Products, October 2000 BioVista

Regulatory Framework for the IVIVC(EMEA)
• Variations to Marketing Authorizations… (EC 1084/2003 - June 3 2003)
BioVista
• Note for Guidance on Modified Release Dosage Forms: A. Oral Dosage Forms, B: Transdermal Dosage Forms, Section I (Quality) (CPMP/QWP/604/96), July 1999
• Note for Guidance on the Investigation of Bioavailability and Bioequivalence (CPMP/EWP/ QWP/ 1401/98), July, 2001

Summary
BioVista
• IVIVCs cannot be generated for all drugs or formulations.But if the criteria are met, they are accepted by the authoritiesin USA and EU, Japan will probably also accept them as partof the ICH
• IVIVC is a credible tool to select the discriminating in vitro test conditions and to set therapeutically meaningful in vitro release specifications
• Applied correctly, the IVIVC can save substantial costs andtime when registering product changes (biowaiver!)
Summary (cont’d)
BioVista
• Essential data (needed for a later IVIVC) ought to be generated in the regular development path of a compound.Following the BCS is helpful in this regard
• Deconvolution/Convolution mathematics are more widely applicable for an IVIVC than methods based on PK models
• It is advantageous to discuss the plan for filing an IVIVC -supported product change with the health authorities