Ivan Towlson Mindscape Session Code: WUX305 Agenda Data visualisation and Silverlight/WPF...
41
-
date post
21-Dec-2015 -
Category
Documents
-
view
223 -
download
0
Transcript of Ivan Towlson Mindscape Session Code: WUX305 Agenda Data visualisation and Silverlight/WPF...


Visualising Data in Silverlight and WPF
Ivan TowlsonMindscapeSession Code: WUX305

Agenda
Data visualisation and Silverlight/WPFVisualising objectsVisualising data setsToolkits and controls
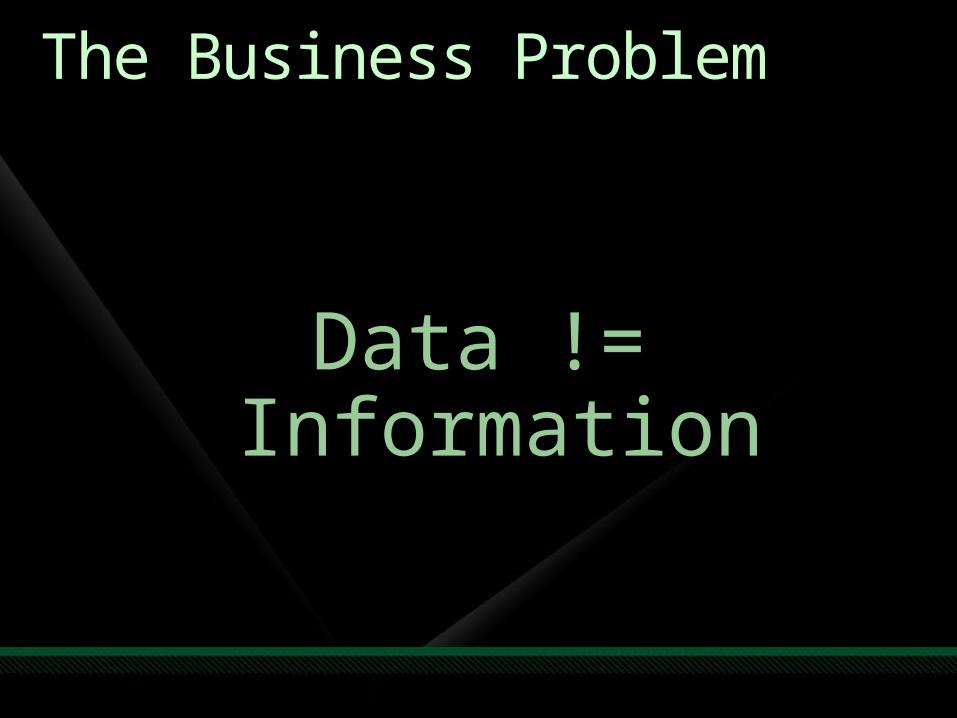
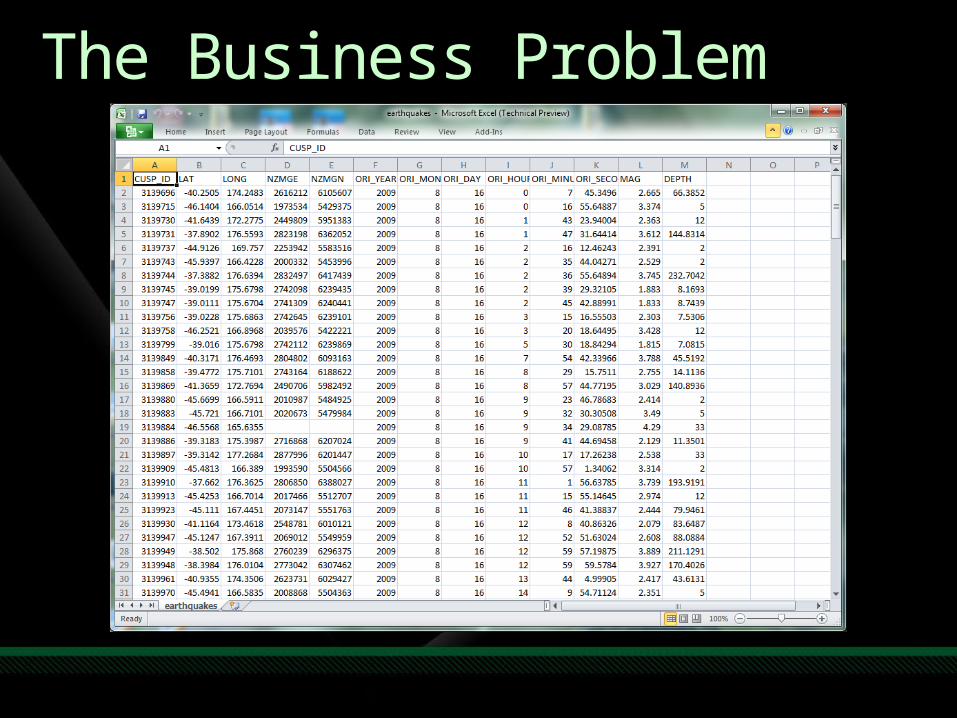
The Business Problem
Data != Information

The Business Problem
It’s easy to miss important information in a sea of purely textual data
Trends and correlationsSpecial or different casesTrouble spots
It’s often quicker to take in information with a graphical assist
Quick way to get a “big picture” overview
The Business Problem

The Business Problem

The Technical Problem
GUI programming stalled in 1991Low level graphics primitivesProcedural drawing codePresenting data in a new UI required a whole new control

The Technical Problem
Technical consequencesCustom visualisations required extensive custom codeExpensive to developThird party controls
Expensive to buy because expensive for vendor to developSpecific in purposeCost of learning complex new control APIs
Hard to justify the cost unless visualisation was a core requirement

The Technical Problem
Business consequencesEncouraged anaemic presentation of dataDisplaying data, not information“Battleship grey” and data gridsOnus on users to detect patterns and anomalies

Silverlight and WPF
Replace the appearance of a control without having to rewrite its entire behaviourDeclarative, higher-level graphics APIFlexible data binding mechanisms

Silverlight and WPF
Writing simple visualisations is a matter of hours rather than daysIt is now affordable to be able to visualise your data your wayData visualisation is the killer application for Silverlight and WPF

Single Data Item Visualisation
BindingIValueConverter
IMultiValueConverter (WPF only)DataTemplateINotifyPropertyChanged

Visualising Single Data Itemsdemo

Visualising a Collection of Data
Toolkits and controlsCustom visualisations

Visualisation Toolkits and Controls
Silverlight Toolkithttp://www.codeplex.com/SilverlightCharting controls (beta)
WPF Toolkithttp://wpf.codeplex.comCharting controls (beta)
Third party controls (commercial and free)Charting, diagramming

Silverlight Charting Controlsdemo

Building Custom Visualisations
ItemsControlSelectorListBoxMultiSelector
ItemTemplate / ItemTemplateSelectorItemsPanel / ItemContainerStyleINotifyCollectionChanged
Bindable LINQ

Visualising a Collection of Datademo

Summary
Silverlight and WPF data binding is completely different to VB or Windows FormsBind sizes, colours, positions, transforms, visibilities
IValueConverterDataTemplateContentTemplateSelector / ItemTemplateSelector
Use panels to perform layoutItemsControl > ItemsPanel / ItemContainerStyle

Call to Action
A meaningful visual display is a great way to put information in front of users
Display information, not just dataIt is now affordable to be able to visualise your data your way
Writing simple visualisations is a matter of hours rather than daysBut be realistic – embrace “good enough”
Data visualisation is the killer application for Silverlight and WPF

question & [email protected]@mindscape.co.nz
http://hestia.typepad.com/flatlander/ http://www.mindscape.co.nz/

www.microsoft.com/teched
Sessions On-Demand & Community
http://microsoft.com/technet
Resources for IT Professionals
http://microsoft.com/msdn
Resources for Developers
www.microsoft.com/learning
Microsoft Certification & Training Resources
Resources

© 2009 Microsoft Corporation. All rights reserved. Microsoft, Windows, Windows Vista and other product names are or may be registered trademarks and/or trademarks in the U.S. and/or other countries.The information herein is for informational purposes only and represents the current view of Microsoft Corporation as of the date of this presentation. Because Microsoft must respond to changing market conditions, it should not be interpreted to be a commitment on the part of Microsoft, and Microsoft cannot guarantee the accuracy of any information provided after the date of this presentation. MICROSOFT MAKES NO WARRANTIES, EXPRESS,
IMPLIED OR STATUTORY, AS TO THE INFORMATION IN THIS PRESENTATION.

Video Titlevideo

Customer TitleNameTitleCompany
customer

Demo TitleNameTitleCompany
demo

Partner TitleNameTitleCompany
partner

Announcement Titleannouncing

PowerPoint TemplateSubtitle color
Set the slide title in “title case” and subheads in “sentence case”The subhead color is defined for this template as the fourth font color from the leftFont Size Requirements
Main bullet points must not be smaller than 24ptDo NOT use any font size lower than 20ptSet subhead to 36pt or smaller so it will fit on a single lineTurn off Auto Resizing on all text boxes

PowerPoint Guidelines
Font, size, and color for text have been formatted for you in the Slide MasterUse the color palette shown belowSee next slide for additional guidelinesHyperlink color: www.microsoft.com
Sample Fill
Sample Fill
Sample Fill
Sample Fill
Sample Fill
Sample Fill
Sample Fill
Sample Fill
Sample Fill
Sample Fill

Use white text only on these colors
Instructions on Color Readability
Colors are brighter when projected, so contrast and readability are diminished
Sample SampleSample
Sample
Sample
Sample SampleSample
Sample Sample
Use black or dark gray text only on these colors

Slide for Showing Software Code
Use this layout to show software codeThe font is Consolas, a monospace fontThe slide doesn’t use bullets but levels can be indented using the “Increase List Level” icon on the Home menuTo use straight quotes " instead of smart quotes ”, do this:1.Click on the Office Button in the upper left corner2.At the bottom of the menu, choose PowerPoint Options3.From the left pane, select Proofing4.Click on the AutoCorrect Options button5.Select the AutoFormat As You Type tab, and deselect “Straight quotes” with “smart quotes”. Then Click OK.

Table Format
Table TitleColumn 1 Column 2 Column 3 Column 4 Column 5

Bar Chart Example
Category 1 Category 2 Category 3 Category 4
4.3
2.5
3.5
4.5
2.4
4.4
1.8
2.8
2 2
3
5
Chart Title
Series 1 Series 2 Series 3

Pie Chart Example
59%23%
10%9%
Chart Title
1st Qtr2nd Qtr3rd Qtr4th Qtr

question & answer

www.microsoft.com/teched
Sessions On-Demand & Community
http://microsoft.com/technet
Resources for IT Professionals
http://microsoft.com/msdn
Resources for Developers
www.microsoft.com/learning
Microsoft Certification & Training Resources
Resources

Related Content
Breakout Sessions (session codes and titles)
Interactive Theater Sessions (session codes and titles)
Hands-on Labs (session codes and titles)
Hands-on Labs (session codes and titles)

Track Resources
Resource 1
Resource 2
Resource 3
Resource 4

© 2009 Microsoft Corporation. All rights reserved. Microsoft, Windows, Windows Vista and other product names are or may be registered trademarks and/or trademarks in the U.S. and/or other countries.The information herein is for informational purposes only and represents the current view of Microsoft Corporation as of the date of this presentation. Because Microsoft must respond to changing market conditions, it should not be interpreted to be a commitment on the part of Microsoft, and Microsoft cannot guarantee the accuracy of any information provided after the date of this presentation. MICROSOFT MAKES NO WARRANTIES, EXPRESS,
IMPLIED OR STATUTORY, AS TO THE INFORMATION IN THIS PRESENTATION.