it’s your thing - Turnaround Management Association · · 2007-09-18Marketing Led Strategy ......
78
Company Analysis and Restructuring Plan MGMT 7711‐001 Turnaround Management Professor Laura Resnikoff Columbia Business School Hamid Benbrahim Rich Bozutto Laurent Grossi Geoff Teillon John Ure Originally Submitted: April 30, 2007 Revised: May 30, 2007 it’s your thing
Transcript of it’s your thing - Turnaround Management Association · · 2007-09-18Marketing Led Strategy ......

Company Analysis and Restructuring Plan
MGMT 7711‐001 Turnaround Management Professor Laura Resnikoff Columbia Business School
Hamid Benbrahim Rich Bozutto Laurent Grossi Geoff Teillon John Ure
Originally Submitted: April 30, 2007
Revised: May 30, 2007
it’s your thing

Page 2 of 78
Table of Contents
Executive Summary ............................................................................................................................ 4 Overview....................................................................................................................................... 4 Structure of this paper ................................................................................................................... 4 Recommendations ......................................................................................................................... 5 Summary of financial analysis and valuation .................................................................................... 5
Industry outlook and competitive environment .................................................................................... 7 Industry overview and definition..................................................................................................... 7 Furniture Stores............................................................................................................................. 7 Miscellaneous Home Furnishing Stores............................................................................................ 7 Retail Economics............................................................................................................................ 8
Business ............................................................................................................................................ 9 Company overview ........................................................................................................................ 9 Strategy and operations ............................................................................................................... 11 History ........................................................................................................................................ 13 Pricing......................................................................................................................................... 13 Analysis of Historic Annual Letters from CEO.................................................................................. 13 Primal Code Branding Analysis ...................................................................................................... 20 SWOT Analysis............................................................................................................................. 22 Recent Events.............................................................................................................................. 23
Management and governance........................................................................................................... 25 Executive officers and key employees............................................................................................ 25 Board of directors ........................................................................................................................ 27
Discussion of financial condition........................................................................................................ 31 Historic Stock Performance........................................................................................................... 31 Company Financial Performance ................................................................................................... 35 Liquidity Analysis ......................................................................................................................... 40 Ratings Analysis ........................................................................................................................... 41 Capital Structure.......................................................................................................................... 41 Debt Instruments......................................................................................................................... 42 Operating Lease Obligations ......................................................................................................... 43
Discussion of valuations.................................................................................................................... 45 Liquidation value ......................................................................................................................... 45
Discussion of Alternatives ................................................................................................................. 47 Status quo ................................................................................................................................... 47 Cost Savings Strategy ................................................................................................................... 48 Bankruptcy .................................................................................................................................. 48 Marketing Led Strategy ................................................................................................................ 49
Recommendations ........................................................................................................................... 50 Immediate Action Plan ................................................................................................................. 50 Projected Results ......................................................................................................................... 52
Conclusion ....................................................................................................................................... 55
Page 3 of 78
Exhibits ........................................................................................................................................... 56 Exhibit I: Current Market Expectations ‐ Income Statement............................................................. 56 Exhibit II: Current Market Expectations – Cash Flow & Estimated Valuation...................................... 57 Exhibit II (Continued): Estimated Valuation .................................................................................... 58 Exhibit III: Current Market Expectations – Balance Sheet................................................................. 59 Exhibit III Continued: Non‐GAAP Presentation of Key Financials – Current Market Expectations Scenario................................................................................................................................................... 60 Exhibit IV: Pro Forma Income Statement – Recommendation Case .................................................. 61 Exhibit V: Pro Forma Cash Flow & Valuation – Recommendation Case ............................................. 62 Exhibit VI: Pro Forma Non‐GAAP Financials – Recommendation Case............................................... 63 Exhibit VII: Primal Branding.......................................................................................................... 64 Exhibit VIII: Comparable Company Analysis ................................................................................... 65 Exhibit IX: Executive Compensation.............................................................................................. 67 Exhibit X: Sample Products........................................................................................................... 70 Exhibit XI: Store Images ............................................................................................................... 77 Exhibit XII: Bibliography and End Notes......................................................................................... 78
Page 4 of 78
Executive Summary
Overview
Pier 1 Imports, Inc. (“Pier 1” or the “Company”) is North America’s largest
specialty retailer of home furnishings, decorations, gifts, and related items. Items are
imported from over 50 different countries around the world and displayed in over 1,200
Pier 1 Imports stores. The specialty retail operations of Pier 1 consist of retail stores
operating under the names "Pier 1 Imports'' and "Pier 1 Kids'', selling a wide variety of
furniture, decorative home furnishings, dining and kitchen goods, bath and bedding
accessories and other specialty items for the home. Many items are one of kind and not
found in other retail stores. Pier 1’s common stock is listed on the New York Stock
Exchange under the symbol PIR.
Pier 1 specializes in direct importing and is one of the world's largest importers
of rattan and brass. 65% of Pier 1’s merchandise is different each year to drive
increased customer traffic as well as a sense of urgency to make a purchase.
Structure of this paper
In this paper we will take the perspective of an advisor to the board of directors,
with a focus on increasing shareholders’ equity and returning Pier 1 to profitability. We
will first review the overall economics and challenges of the retail furniture and
miscellaneous home furnishing industries. Based on our discussion of the industry we
will explore the history of Pier 1 and specific challenges to the company in areas such as
operations, branding, and strategic direction. Next, we will turn our focus to the
management, financing decisions made along the way and competitive advantages.
Finally, we will review alternatives available to the company and give our proposed
recommendations for a successful turnaround.

Page 5 of 78
Recommendations
Pier 1 must take immediate action to close a significant portion of its
underperforming stores in an effort to stabilize its finances and right‐size its SG&A
expenses. Specifically, at least 20% of its current stores are operating at significant
losses without reasonable hope of improvement, and the company can ill afford to
continue to finance such money losing endeavors. Additionally, Pier 1 should look to
monetize its investment in its corporate headquarters. Further, the company has
confused its customers with its numerous and ever changing marketing campaigns, and
must refocus on its core segment of fashionable furnishings at value price points and
avoid price as a basis of differentiation. Finally, there is an unrealized opportunity for
material savings in Pier 1's supply chain through consolidation of suppliers and
implementation of a Total Cost of Ownership approach to supply chain management.
By implementing these specific action plans, Pier 1 can return to profitability in its fiscal
year ending 2009 and achieve reasonable stock appreciation for its shareholders.
Summary of financial analysis and valuation
In preparing our analysis and recommendations we first modeled full pro forma
financials for the current status quo business case, consistent with current analyst and
market expectations (Exhibits I – III). Also, to better enable our in‐dept analysis we
restated the key financials on a non‐GAAP basis to isolate earnings before interest, tax,
depreciation, and rent (EBITDAR) and capitalize both the considerable off‐balance sheet
asset and liability values associated with Pier 1’s portfolio of operating leases (Exhibit
III). Based upon these projections, Pier 1 will not return to profitability until 2012 and
will need to raise additional debt (approx $50M) to finance its operations beginning in
2010. From a valuation perspective, these operating projections do not justify the
current market valuation of Pier 1. Accordingly, we believe that the current equity
prices reflect the option value associated with the possibility of a material turnaround in
excess of industry analyst expectations or a possible strategic take‐over or sale of the
company.

Page 6 of 78
Next, we modeled the significant restructuring actions that we believe are
required to close the bottom 20% of underperforming stores (target 250 closures in
2008) consistent with our recommendations. We projected these results and the post‐
restructuring pro forma financials through 2012 and believe Pier 1’s current liquidity will
be sufficient to sustain it through this restructuring program, after which we expect a
return to positive cash flow. Further, we performed some valuation analysis and
assuming our plan can be effectively executed, we believe the fair value of Pier 1 shares
should be $12 – 18 per share, well above its current levels.

Page 7 of 78
Industry outlook and competitive environment
Industry overview and definition
Pier 1 Imports is considered part of the “Furniture” and “Miscellaneous Home
Furnishings Stores” industries.i
Furniture Storesii
In 2006, over 28,300 establishments engaged in the retail sale of household
furniture. Several bankruptcies in the early 2000s, such as that of Heilig‐Myers, provided
opportunities for independent stores and larger retailers to gain market share. In the
mid 2000’s companies began to offer a more diverse product set than ever before and
began branching out into related products such as glassware and linens.
As of 2006, the industry employed about 265,000 people and generated an
annual payroll of $7.37 billion. Consumers spent roughly $48.7 billion within this
industry. On the average, consumers spent $1.1 million per retail store. The industry is
made up of large national chains, regional stores and small independent operations. In
recent years, a growing segment of new retailers has emerged who sell household and
office furniture, mattresses and related consumer products. The retailers include large
discount superstores such as Wal‐Mart and Target, warehouse stores like Sam's Club
and Office Depot and one‐stop department stores such as Sears and J.C. Penney. This
competition made the marketplace a much more difficult one for traditional furniture
stores.
Miscellaneous Home Furnishing Storesiii
Miscellaneous Home Furnishing Stores offer everything needed to furnish a
home from kitchenware to linens and lamps and shades to Venetian blinds and window
shades.
Discount stores, as well as department stores, stock a wide variety of items for
the consumer, and their prices vary with the brand name and the type of store that sells

Page 8 of 78
them. Of the several different types of retailers that sell home furnishings, one of the
fastest growing is the specialty retailer that attracts upscale consumers. These stores
may be independent or part of a chain and provide quality merchandise with moderate
price tags. However, price is not all that attracts customers. Specialty retailers tend to
carry unusual and distinctive items that attract consumers who cannot find them
anywhere else.
Retail Economics
The furniture market is closely tied to the performance of the housing industry.
Furniture sales were down in the early 2000’s, but by 2005 many retailers were seeing
upswings, particularly single‐brand vertical retailers such as LA‐Z‐Boy. Office furniture
also was coming out of its prolonged slump, experiencing growth in 2004 and 2005 for
the first time in several years.
However, in 2006, new home construction was down again and this has highly
impacted the furniture and household goods markets. The Business and Institutional
Furniture Manufacturer's Association (BIFMA), in conjunction with Global Insight,
reported an 8.3 percent decrease in retail sales of office furniture. The slow growth was
due to the sluggish economy, and also the lack of office construction.

Page 9 of 78
Business
Company overview
Pier 1 offers a diverse selection of products consisting of approximately 3,000
items imported from over 40 countries around the world. While the broad categories of
Pier 1's merchandise remain constant, individual items within these product groupings
change frequently in order to meet the demands of customers. The principal categories
of merchandise include the following:
2006 Revenues
Furniture, 40%
Decorative Accessories,
26%
Housewares, 13%
Bed & Bath, 15%
Seasonal, 6%
• Furniture – This product group consists of furniture, furniture pads and pillows to
be used on patios and in living, dining, kitchen and bedroom areas, and in sun
rooms. This product group constituted approximately 40% of Pier 1's total North
American retail sales in fiscal year 2006 and 39% in fiscal years 2005 and 2004.
These goods are imported from a variety of countries such as Italy, Malaysia,
Brazil, Mexico, China, the Philippines and Indonesia, and are also obtained from
domestic sources. The furniture is made of metal or handcrafted natural

Page 10 of 78
materials, including rattan, pine, beech, rubberwood and selected hardwoods
with either natural, stained or painted finishes. Pier 1 also sells upholstered
furniture.
• Decorative Accessories – This product group constitutes the broadest category of
merchandise in Pier 1's sales mix and contributed approximately 26% to Pier 1's
total North American retail sales in fiscal year 2006, 25% in fiscal year 2005 and
24% in fiscal year 2004. These items are imported from approximately 35
countries and include brass, marble and wood items, as well as lamps, vases,
dried and silk flowers, baskets, wall decorations and numerous other decorative
items. A majority of these products are handcrafted from natural materials.
• Housewares – This product group is imported mainly from the Far East and
Europe and includes ceramics, dinnerware and other functional and decorative
items. These goods accounted for approximately 13% of Pier 1's total North
American retail sales in fiscal years 2006, 2005 and 2004.
• Bed & Bath – This product group is imported mainly from India, Germany,
Thailand and China and is also obtained from domestic sources. This group
includes bath and fragrance products, candles and bedding. These goods
accounted for approximately 15% of Pier 1's total North American retail sales in
fiscal year 2006, 16% in fiscal year 2005 and 18% in fiscal year 2004.
• Seasonal – This product group consists of merchandise for celebrating holidays
and spring/summer entertaining, imported mainly from Europe, Indonesia,
China, the Philippines and India and also obtained from domestic sources. These
items accounted for approximately 6% of Pier 1's total North American retail
sales in fiscal year 2006, 7% in fiscal year 2005 and 6% in fiscal year 2004.
Since June 2000, Pier 1 has operated an e‐commerce Website, which received an
average of 4.3 million visits per month in fiscal 2006, and can be accessed at
www.pier1.com. This site is a significant marketing vehicle for the Company while
providing customers with access to Pier 1 products and services at their convenience, as

Page 11 of 78
well as access to investor relations information. Customers can shop substantially all of
Pier 1's merchandise assortment, as well as purchase gift cards, create and manage
bridal and gift registries, view interactive catalogs, watch the most recent television
commercials, and sign up for marketing e‐mail and direct mail.
Pier 1 Kids stores offer children's furniture and decorative accessories. The
Company started operating Pier 1 Kids stores in March 2001 when it acquired Cargo, a
21 unit retail chain focused on children’s furniture. Cargo was later rebraded as Pier 1
Kids. Pier 1 Kids utilizes an e‐commerce site, which can be accessed at
www.pier1kids.com to attract customers and provide information regarding placing
orders, sale items and store locations.
In fiscal 2006, Pier 1 Imports, Inc. expanded its specialty retail operations by
opening 65 new Pier 1 stores, four new Pier 1 Kids stores and two new international
stores. The Company closed 32 Pier 1 stores and six Pier 1 Kids stores. Subject to
changes in the retail environment, availability of suitable store sites, lease renewal
negotiations and availability of adequate financing, the Company plans to open
approximately 40 new Pier 1 stores and close approximately 30 Pier 1 and five Pier 1
Kids stores during 2007. Plans for 2007 also include opening approximately seven new
international stores in Mexico and Puerto Rico, primarily in a store within a store
format. On March 20, 2006, Pier 1 Imports, Inc. announced the sale of its subsidiary
based in the United Kingdom, The Pier Retail Group Limited (The Pier). The Pier operates
45 retail stores in the United Kingdom and Ireland, offering decorative home furnishings
and related items in a setting similar to Pier 1 stores. The Pier operates a distribution
facility near London, England.
Strategy and operationsiv
Pier 1 merchandise largely consists of items that require a significant degree of
handcraftsmanship and are mostly imported directly from foreign suppliers. For the
most part, the imported merchandise is handcrafted in cottage industries and small
factories. Pier 1 is not dependent on any particular supplier and has enjoyed long‐
standing relationships with many vendors and agents. The company believes alternative
Page 12 of 78
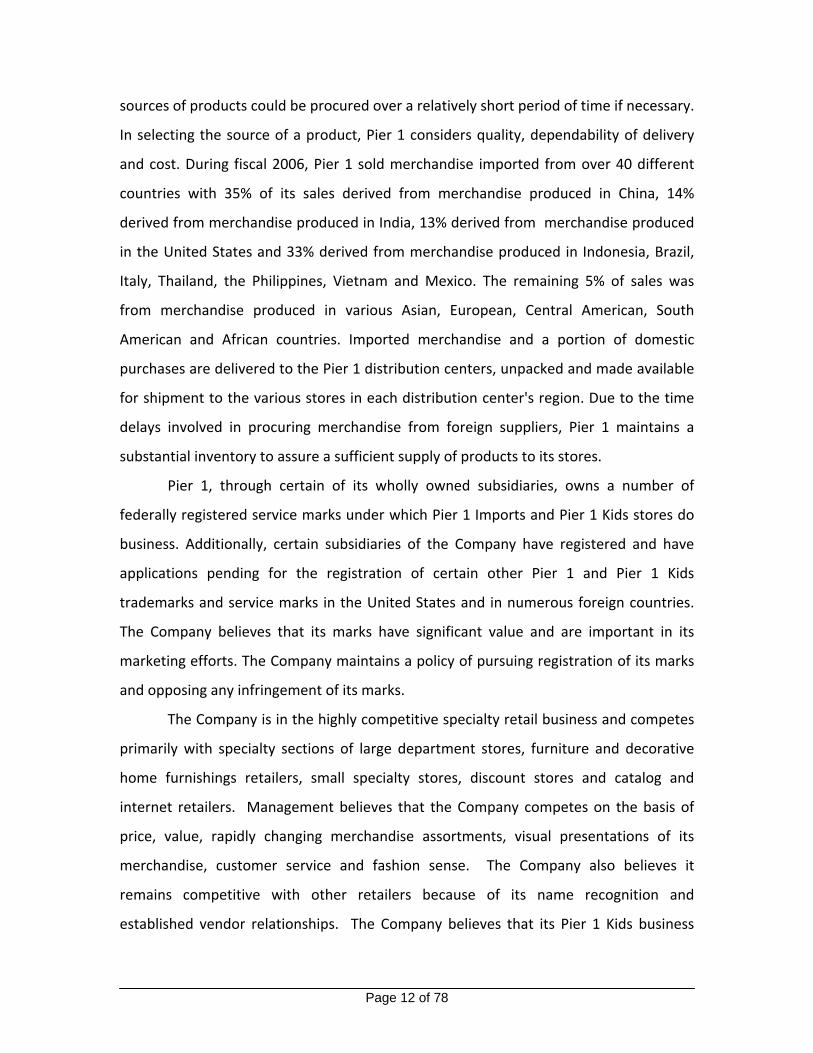
sources of products could be procured over a relatively short period of time if necessary.
In selecting the source of a product, Pier 1 considers quality, dependability of delivery
and cost. During fiscal 2006, Pier 1 sold merchandise imported from over 40 different
countries with 35% of its sales derived from merchandise produced in China, 14%
derived from merchandise produced in India, 13% derived from merchandise produced
in the United States and 33% derived from merchandise produced in Indonesia, Brazil,
Italy, Thailand, the Philippines, Vietnam and Mexico. The remaining 5% of sales was
from merchandise produced in various Asian, European, Central American, South
American and African countries. Imported merchandise and a portion of domestic
purchases are delivered to the Pier 1 distribution centers, unpacked and made available
for shipment to the various stores in each distribution center's region. Due to the time
delays involved in procuring merchandise from foreign suppliers, Pier 1 maintains a
substantial inventory to assure a sufficient supply of products to its stores.
Pier 1, through certain of its wholly owned subsidiaries, owns a number of
federally registered service marks under which Pier 1 Imports and Pier 1 Kids stores do
business. Additionally, certain subsidiaries of the Company have registered and have
applications pending for the registration of certain other Pier 1 and Pier 1 Kids
trademarks and service marks in the United States and in numerous foreign countries.
The Company believes that its marks have significant value and are important in its
marketing efforts. The Company maintains a policy of pursuing registration of its marks
and opposing any infringement of its marks.
The Company is in the highly competitive specialty retail business and competes
primarily with specialty sections of large department stores, furniture and decorative
home furnishings retailers, small specialty stores, discount stores and catalog and
internet retailers. Management believes that the Company competes on the basis of
price, value, rapidly changing merchandise assortments, visual presentations of its
merchandise, customer service and fashion sense. The Company also believes it
remains competitive with other retailers because of its name recognition and
established vendor relationships. The Company believes that its Pier 1 Kids business

Page 13 of 78
offers an opportunity to take advantage of the growing demand for children's furniture
and accessories. The Company allows customers to return merchandise within a
reasonable time after the date of purchase without limitation as to reason, consistent
with industry standard policies. Most returns occur within 30 days of the date of
purchase. The Company monitors the level of and stated reasons for returns and
maintains a reserve for future returns based on historical experience and other known
factors.
On February 25, 2006, the Company employed approximately 18,200 associates
in North America, of which approximately 8,500 were full‐time employees and 9,700
were part‐time employees.
History
Pier 1 began in 1962 with a single store in San Mateo, California. Since then, they
have grown to over 1,200 locations nationwide.
Pricing
Pier1 has traditionally targeted consumers who are looking for one‐of‐a‐kind
products but who may also be more cost conscious. Due to the fact that Pier 1 suppliers
are in many cases overseas, the company has a need to carry high inventories in
anticipation of seasonal sales. This high inventory, combined with a slowing economic
environment, has lead to a higher number of seasonal sales and discounts to move
inventory as quickly as possible.
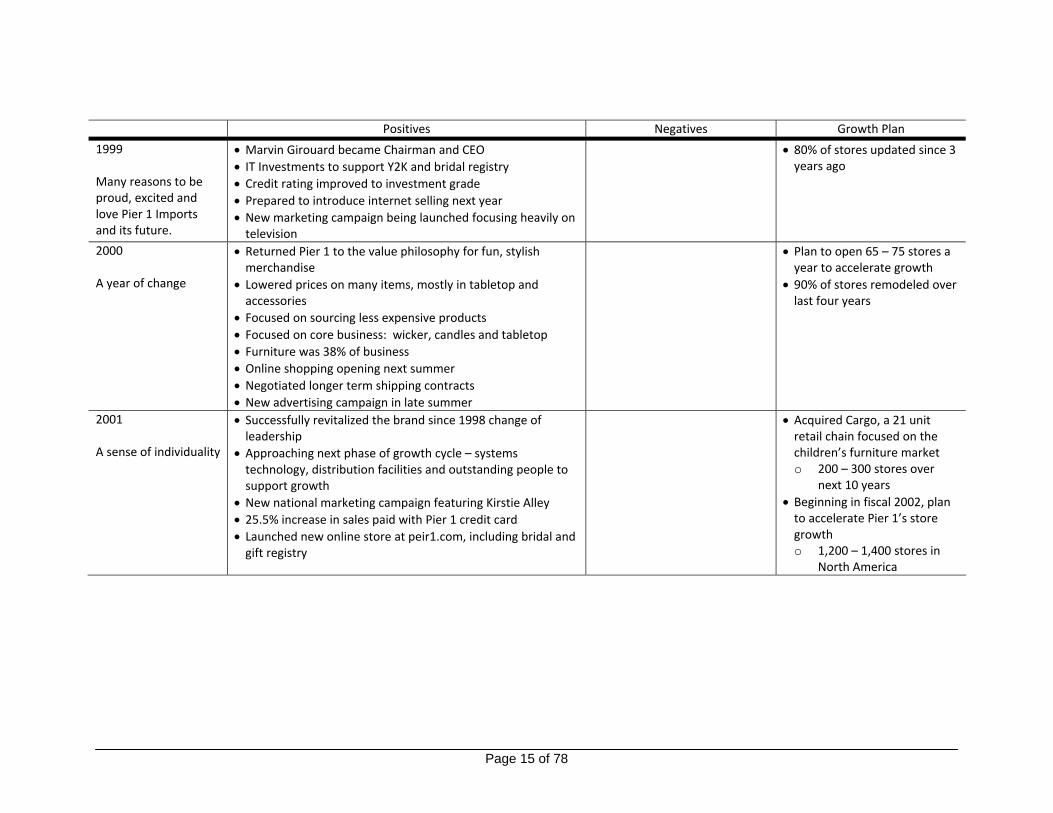
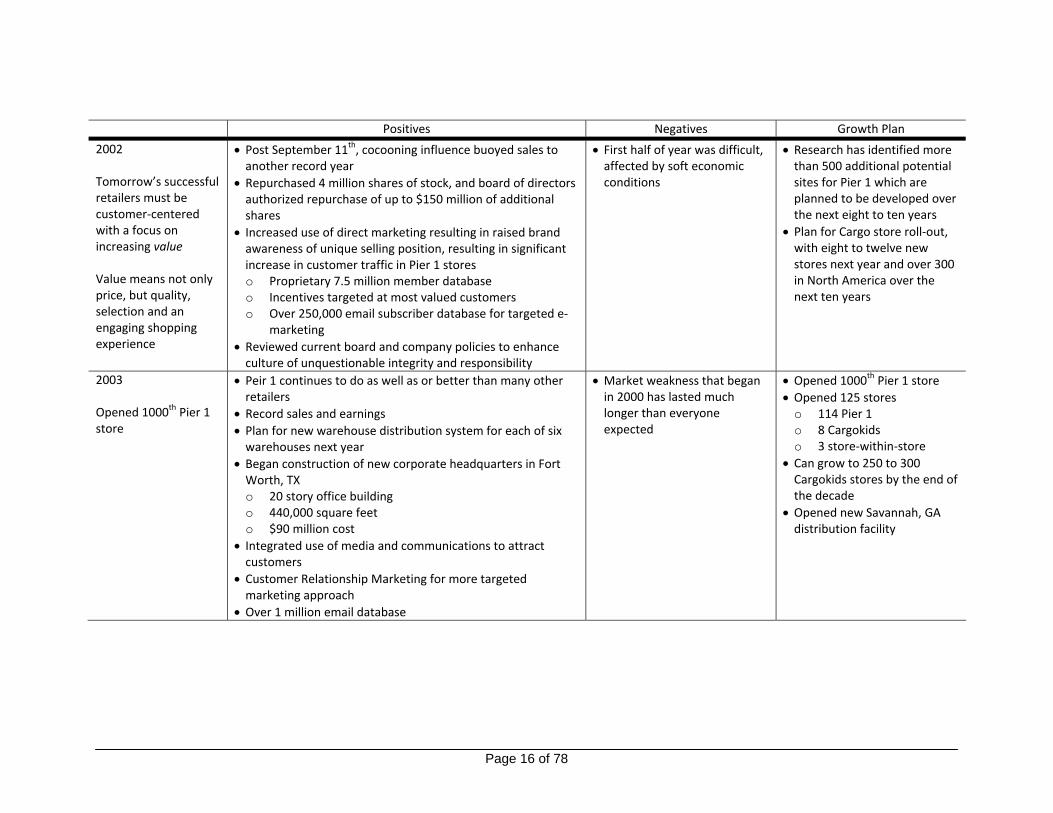
Analysis of Historic Annual Letters from CEO
Analyzing the Annual Letters to Shareholders from the CEO, Pier 1 benefited
from a strong economy but lost its way as it rapidly expanded, especially its SG&A in
anticipation of expanding its store growth. Pier 1 continued to expand at a rapid pace
despite the fact that its comparable store sales were declining. Additionally, the former
CEO Marvin Girouard built a trophy for himself by spending $100 million on a new
building development in Texas for the corporate headquarters, which questions the
level of governance the board of directors was providing management. Despite all of

Page 14 of 78
the troubles that have plagued Pier 1 during the last year, the annual letters from the
CEO remain incredibly upbeat on the future of the Company and its new initiatives. It is
clear that Pier 1 was focused on growth, and could not find its brand image, evidenced
by the continuous repositioning efforts of the company. The following chart outlines
the key points the CEO made in his annual letters.
Page 15 of 78
Positives Negatives Growth Plan
1999 Many reasons to be proud, excited and love Pier 1 Imports and its future.
• Marvin Girouard became Chairman and CEO • IT Investments to support Y2K and bridal registry • Credit rating improved to investment grade • Prepared to introduce internet selling next year • New marketing campaign being launched focusing heavily on television
• 80% of stores updated since 3 years ago
2000 A year of change
• Returned Pier 1 to the value philosophy for fun, stylish merchandise
• Lowered prices on many items, mostly in tabletop and accessories
• Focused on sourcing less expensive products • Focused on core business: wicker, candles and tabletop • Furniture was 38% of business • Online shopping opening next summer • Negotiated longer term shipping contracts • New advertising campaign in late summer
• Plan to open 65 – 75 stores a year to accelerate growth
• 90% of stores remodeled over last four years
2001 A sense of individuality
• Successfully revitalized the brand since 1998 change of leadership
• Approaching next phase of growth cycle – systems technology, distribution facilities and outstanding people to support growth
• New national marketing campaign featuring Kirstie Alley • 25.5% increase in sales paid with Pier 1 credit card • Launched new online store at peir1.com, including bridal and gift registry
• Acquired Cargo, a 21 unit retail chain focused on the children’s furniture market o 200 – 300 stores over
next 10 years • Beginning in fiscal 2002, plan to accelerate Pier 1’s store growth o 1,200 – 1,400 stores in
North America
Page 16 of 78
Positives Negatives Growth Plan
2002 Tomorrow’s successful retailers must be customer‐centered with a focus on increasing value Value means not only price, but quality, selection and an engaging shopping experience
• Post September 11th, cocooning influence buoyed sales to another record year
• Repurchased 4 million shares of stock, and board of directors authorized repurchase of up to $150 million of additional shares
• Increased use of direct marketing resulting in raised brand awareness of unique selling position, resulting in significant increase in customer traffic in Pier 1 stores o Proprietary 7.5 million member database o Incentives targeted at most valued customers o Over 250,000 email subscriber database for targeted e‐
marketing • Reviewed current board and company policies to enhance culture of unquestionable integrity and responsibility
• First half of year was difficult, affected by soft economic conditions
• Research has identified more than 500 additional potential sites for Pier 1 which are planned to be developed over the next eight to ten years
• Plan for Cargo store roll‐out, with eight to twelve new stores next year and over 300 in North America over the next ten years
2003 Opened 1000th Pier 1 store
• Peir 1 continues to do as well as or better than many other retailers
• Record sales and earnings • Plan for new warehouse distribution system for each of six warehouses next year
• Began construction of new corporate headquarters in Fort Worth, TX o 20 story office building o 440,000 square feet o $90 million cost
• Integrated use of media and communications to attract customers
• Customer Relationship Marketing for more targeted marketing approach
• Over 1 million email database
• Market weakness that began in 2000 has lasted much longer than everyone expected
• Opened 1000th Pier 1 store • Opened 125 stores
o 114 Pier 1 o 8 Cargokids o 3 store‐within‐store
• Can grow to 250 to 300 Cargokids stores by the end of the decade
• Opened new Savannah, GA distribution facility
Page 17 of 78
Positives Negatives Growth Plan
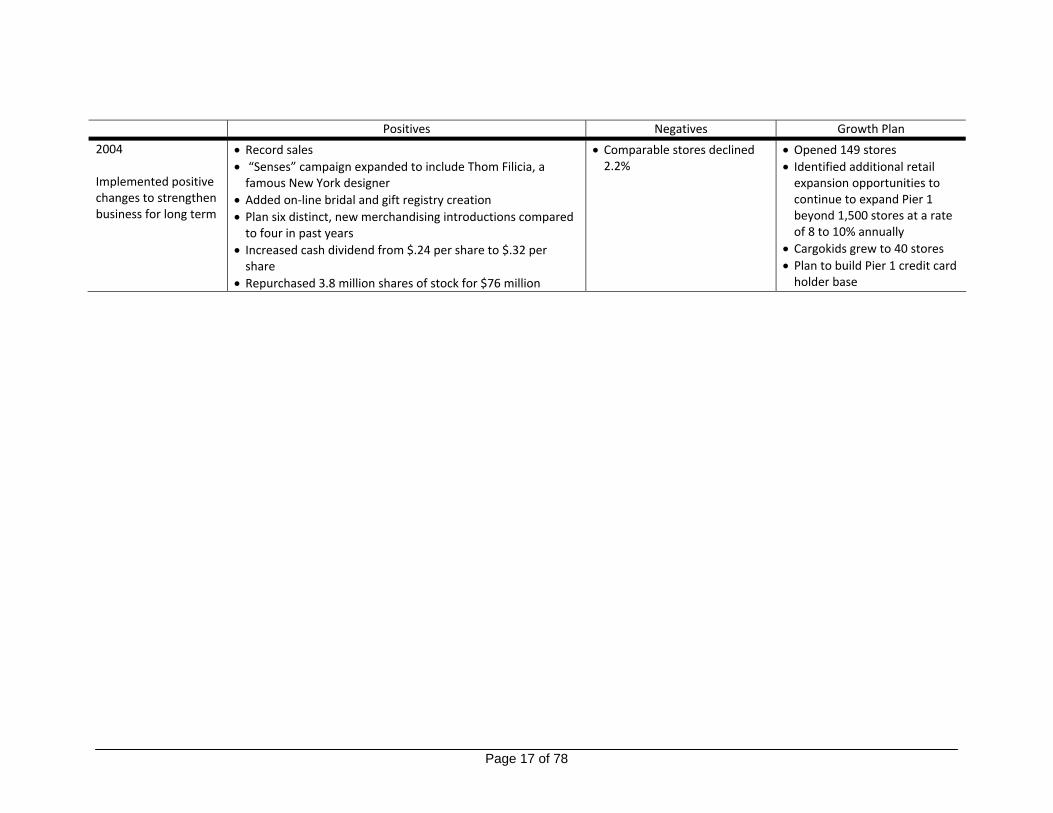
2004 Implemented positive changes to strengthen business for long term
• Record sales • “Senses” campaign expanded to include Thom Filicia, a famous New York designer
• Added on‐line bridal and gift registry creation • Plan six distinct, new merchandising introductions compared to four in past years
• Increased cash dividend from $.24 per share to $.32 per share
• Repurchased 3.8 million shares of stock for $76 million
• Comparable stores declined 2.2%
• Opened 149 stores • Identified additional retail expansion opportunities to continue to expand Pier 1 beyond 1,500 stores at a rate of 8 to 10% annually
• Cargokids grew to 40 stores • Plan to build Pier 1 credit card holder base

Page 18 of 78
Positives Negatives Growth Plan
2005 Disappointment and repositioning
• Hired Deutsch Inc. advertising agency for creative • Hired OMD Midwest for media‐buying • Implementing major marketing, merchandising and store operations initiatives
• Challenged buyers to design, source and buy more distinct, one‐or‐a‐kind merchandise and offer it with competitive retail pricing
• Sped up cycle to develop and bring new products to market • Plan to offer stronger seasonal assortments to increase “sense of urgency” to shoppers
• Plan to differentiate and broaden range of “Good,” “Better,” and “Best” offerings o “Good” – basic items at everyday values o “Better” – products with higher design and quality for
the price o “Best” – merchandise representing unique, design‐
forward collections that broaden a customer’s expectations
• Reduced number of items in Pier 1 stores by 15% to 20% and aggressively discontinued older merchandise collections to allow stores to present a new, stronger visual presentation with less clutter o Gives merchandise more space o Allows showcasing of featured home furnishings
• Goal – lower inventory levels in stores will ensure an easier and more interesting shopping experience for customers with stronger item focus
• Increased payroll hours in stores to allow time to support new merchandising transitions and spend more time with customers
• Converted Cargokids to Pier 1 Kids branding, resulting in increased traffic and dramatically improved sales
• Comparable stores down 5.8%• Lease accounting changes resulted in a one‐time charge of $.04 per share, but did not impact cash flow
• Completely re‐assessed the company mid‐way through the year
• Terminated five year relationship with advertising agency
• Made decision to slow store growth to improve store‐level productivity and grow operating margins

Page 19 of 78
Positives Negatives Growth Plan
2006 Turnaround strategy ‐ reposition for a return to profitability in the core business
• Sold The Pier (UK subsidiary) stores March 20, 2006 and classified as discontinued operations
• New merchandising – Modern Craftsman – with fashion‐forward color palettes and contemporary styles
• More product‐focused national marketing and advertising campaign
• Technology upgrades to allow new direct to consumer channel through catalog distribution
• Restructured and realigned store operations, buying and administrative functions to cut costs and improve efficiencies throughout the organization
• Issued $165 million of convertible debt • Reevaluated real estate portfolio and decided to accelerate closings of underperforming stores during fiscal 2006 and 2007
• Consolidating back offices of Pier 1 and Pier 1 Kids
• Opened distribution center in Washington

Page 20 of 78
Primal Code Branding Analysisv
Strong brands have seven pieces of code that work together to make them
believable and enduring. These areas are highlighted below and there is additional
information on Primal Branding is in the appendix. The table that follows highlights Pier
1’s failure to develop its primal code, which is partially responsible for its current
operating and financial position. Compared to best of breed, Pier 1’s current Primal
Code requires a large investment. The company has changed its advertising message
several times in the last few years, making it difficult for customers, consumers and
employees to know what the brand Pier 1 means and why they want to be a part of it.

Page 21 of 78
Primal Branding Analysis Definition Best of Breed Pier 1 Today Goal
Creation Story The who and why, often involving a mythic quest. The creation story is the first step in providing answers to why people should care about you, your product or service.
GE, Disney, United States of America, Microsoft
Pier 1 started as a single store in San Mateo, California in 1962. The store’s first customers were post‐World War II baby boomers looking for beanbag chairs, love beads and incense.
Who started Pier 1? Why did they start it?
Creed A set of core principles that you believe in and what you want others to believe about you. Defining, understanding and communicating your mission to your customers and employees are the goal of a creed.
“Just do it.” (Nike), “All Men [and women] are created equal” (USA), “The Third Place” (Starbucks)
“it’s your thing” Currently does not speak to Pier 1’s strengths or provide a succinct message. Needs to be reworked.
Icons Quick concentrations of meaning that cause your brand identity and brand values to spontaneously resonate.
Nike swoosh, Coke bottle, smell of Cinnabons
Papasan chair, candles, Kirstie Alley
Icons need to be refreshed and developed with longevity in mind. Papasan chair is dated, candles are a commodity product and Kirstie Alley is out of the spotlight.
Rituals The repeated interactions people have with your enterprise.
Fourth of July parades, stopping at Starbucks, searching on Google
Shop the sale, return gifts received from Pier 1
Shop for all home/novelty gifts at Pier 1. Browse Pier 1 whenever in the neighborhood.
Pagans / Nonbelievers Part of saying who you are and what you stand for is also declaring what you do not stand for.
Apple/Microsoft, Yankees/Red Sox, Democrats/Republicans, New York/LA, Coke/7Up
Pier 1 has plenty of these today! Pottery Barn, Target, Bed, Bath & Beyond
Provide product offerings which will grab a greater percentage of customers’ share of dollar spend.
Sacred Words A set of specialized words that must be learned before people can belong.
Grande, Big Mac, iPod, lol None Need to develop.
Leader The person who is the catalyst, risk taker, visionary, iconoclast who set out against all the odds to re‐create the world according to their own sense of self, community and opportunity.
Richard Branson, Bill Gates, Dr. Martin Luther King, Oprah
Alex Smith New CEO, has an opportunity to be the leader by embracing change and communicating Pier 1 brand message to all constituents.

Page 22 of 78
SWOT Analysis
Strengths
Opportunities Threats
Weaknesses
• Underperforming locations drag profitability
• Gross margin below 30% (40% is a realistic target)
• Significant CAPEX spends to stay afloat
• Strength of management team and corporate governance is questionable given recent performance and lack of accountability (with the exception of the recent CEO change)
• Continued lost market share to old and new competitors
• Trade areas move away from Pier 1 locations as Target and Wal‐Mart stores build new centers
• Lack of product differentiation relative to competition and lower priced competitors such as Target
• Underperforming stores continue to burn cash and drag Company’s energy, distracting from focus on strong stores
• Offer the customer a selection of ever‐changing, unique merchandise priced at a value, innovative marketing, a fun and relaxing shopping experience and outstanding customer service
• Competitive advantage – offering customers new merchandise at a value
• Develop and communicate brand message for customers, suppliers and vendors
• Analysis of distribution facilities and inefficiencies
• Analysis of pricing opportunities
• Analysis of total cost of ownership with a focus on working with suppliers to reduce overall costs and increase gross margin
• Third party real estate market assessment through a combination of Buxton and Geoview geo mapping services
• Close underperforming stores
Top industrydriversSWOTAnalysis
‐
‐
+
+
Page 23 of 78
Recent Events
On April 9, 2007, a Schedule 13D was filed by Elliott Asset Management LLC
(“Elliott”), a hedge fund and beneficial owner of 5.5% of Pier 1’s common stock,
whereby Elliott pressured the Board of Directors to present a turnaround plan for Pier 1.
Elliott also provided their recommendations about store closings, SG&A expenses and
more turnover on the Board of Directors.
On March 30, 2007 Pier 1 announced that it had cut 175 jobs at its headquarters
and field offices, which would eventually save $17 million per year.
On March 22, 2007 Pier 1 announced that James Hoak planned to leave the
board when his term expires in the coming year. The number of directors is being
increased from seven to eight, and Cece Smith and Robert B. Holland, III have been
nominated to stand for election. Given Ms. Smith’s retail background, she appears to be
a strong director candidate; however, we question the addition of Mr. Holland and his
lack of retail experience.
On January 30, 2007, Pier 1 announced that Marvin Girouard, its Chairman and
Chief Executive Officer, would retire on February 19, 2007 and that Alex W. Smith would
become President and Chief Executive Officer.
Over the past year Pier 1 management has begun to divest specific non‐core
assets in what would appear to be both an attempt to limit its focus to its core U.S.
business and raise cash to sustain its negative operating cash flow.
On March 20, 2006, Pier 1 sold its UK & Ireland based subsidiary (The Pier) to
Palli Limited for approximately $15M, and appropriate restated the associated financial
results in all prior years as discontinued operations.
Credit Card Operations
On November 21, 2006, Pier 1 completed the sale of its private‐label credit card
operations and all outstanding receivables to Chase Bank for $155M in cash. At the time
of the sale the credit card portfolio included nearly one million accounts with total
receivables of approximately $140M. In addition, the two companies entered into a
long‐term agreement in which Chase will continue to provide credit cards and

Page 24 of 78
associated support to Pier 1 customers, while providing specific payments to Pier 1
based upon account activity.
This arrangement allowed Pier 1 to monetize the value of the credit card
portfolio and associated business without impacting its customers. This sale represents
an optimal outcome given Pier 1’s current financial position and need for cash. In the
past, prior to this sale, Pier 1 frequently securitized and sold its credit card receivables
to raise cash.

Page 25 of 78
Management and governance
Executive officers and key employees
Alex W. Smith (Chief Executive Officer, President and Director)
Before being named CEO and President of Pier 1 in 2007, Alex Smith was Senior
Executive Vice President, Group President of The Tjx Companies Inc. since March 29,
2004. Mr. Smith served as Executive Vice President and Group Executive, International
of TJX Companies Inc. from 2001 to March 29, 2004. Mr. Smith was responsibilities for
The Marmaxx Group, The Tjx Companies Inc.'s HomeGoods division, and the California
Buying Office and oversight of the European Buying Offices. Mr. Smith was Managing
Director of T.K. Maxx from 1995 to 2001. He was Managing Director of Lane Crawford
from 1994 to 1995, Managing Director of Owen Owen plc from 1990 to 1993 and
Merchandise Director from 1987 to 1990.
Charles H. Turner (CFO, Executive Vice President ‐ Finance and Treasurer)
Charles H. Turner has been Executive Vice President, Finance of Pier 1 since April
2002 and Chief Financial Officer and Treasurer since August 1999. Mr. Turner served as
Senior Vice President of Finance of Pier 1 from August 1999 to April 2002. He served as
Senior Vice President of Stores of Pier 1 from August 1994 to August 1999, and served
as Controller and Principal Accounting Officer of Pier 1 from January 1992 to August
1994. He has served as a Director of Elder Beerman Stores Corp. since 2000.
Susan E. Barle (Principal Accounting Officer)
Susan Barley has been promoted to Senior VP of Finance. Barley started at Pier 1
in 1976, when she was hired as Assistant Controller for the Accounting department. She
was promoted to VP/Controller in 1994 and became VP of Finance in 1999.

Page 26 of 78
Michael A. Carter (Senior Vice President , General Counsel and Corporate Secretary)
Michael A. Carter serves as Senior Vice President, General Counsel and
Corporate Secretary of Pier 1.
Phil E. Schneider (Executive Vice President – Marketing)
Phil E. Schneider has been the Executive Vice President of Marketing of Pier 1
since April 2002. Mr. Schneider served as Senior Vice President of Marketing of Pier 1
from May 1993 to April 2002, and served as Vice President of Advertising of Pier 1 from
January 1988 to May 1993.
Gregory S. Humenesky (Executive Vice President of Human Resources)
Gregory S. Humenesky has been Executive Vice President, Human Resources of
Pier 1 since February 2005. Prior to joining Pier 1, Mr. Humenesky served as Senior Vice
President of Human Resources at Zale Corporation from April 1996 to February 2005.
Jay R. Jacobs (Executive Vice President – Merchandising)
Jay R. Jacobs has been the Executive Vice President of Merchandising of Pier 1
since April 2002. Mr. Jacobs served as Senior Vice President of Merchandising of Pier 1
from May 1995 to April 2002. He served as Vice President of Divisional Merchandising
of Pier 1 from May 1993 to May 1995, and served as Director of Divisional
Merchandising of Pier 1 from July 1991 to May 1993.
J. Rodney Lawrence (Executive Vice President of Legal Affairs)
J. Rodney Lawrence has been the Executive Vice President of Legal Affairs of Pier
1 since April 2002 and has served as Secretary of Pier 1 since November 1985. Mr.
Lawrence served as Senior Vice President of Legal Affairs of Pier 1 from June 1992 to
April 2002, and served as Vice President of Legal Affairs of Pier 1 from November 1985
to June 1992.
Page 27 of 78
David A. Walker (Executive Vice President of Logistics & Allocations)
David A. Walker has been the Executive Vice President of Logistics and
Allocations of Pier 1 since April 2002. Mr. Walker served as Senior Vice President of
Logistics and Allocations of Pier 1 from September 1999 to April 2002. He served as Vice
President of Planning and Allocations of Pier 1 from January 1994 to September 1999,
and served as Director of Merchandise Services of Pier 1 from October 1989 to January
1994.
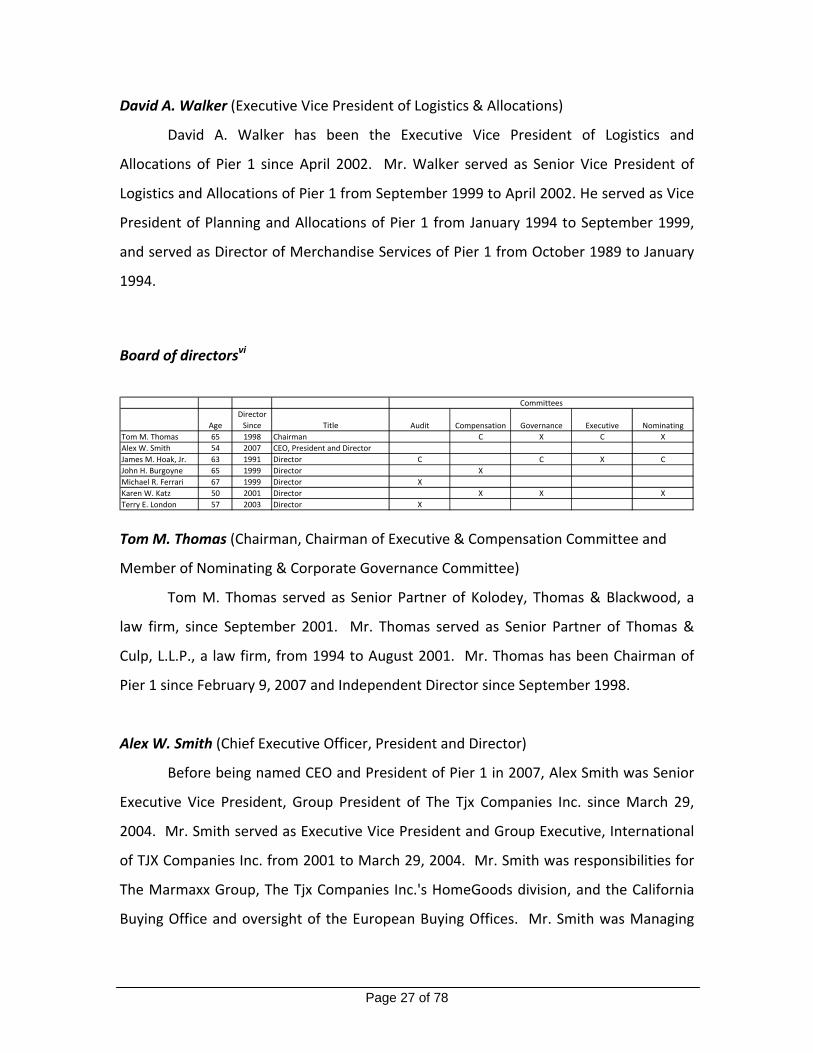
Board of directorsvi
Committees
AgeDirector Since Title Audit Compensation Governance Executive Nominating
Tom M. Thomas 65 1998 Chairman C X C XAlex W. Smith 54 2007 CEO, President and DirectorJames M. Hoak, Jr. 63 1991 Director C C X CJohn H. Burgoyne 65 1999 Director XMichael R. Ferrari 67 1999 Director XKaren W. Katz 50 2001 Director X X XTerry E. London 57 2003 Director X Tom M. Thomas (Chairman, Chairman of Executive & Compensation Committee and
Member of Nominating & Corporate Governance Committee)
Tom M. Thomas served as Senior Partner of Kolodey, Thomas & Blackwood, a
law firm, since September 2001. Mr. Thomas served as Senior Partner of Thomas &
Culp, L.L.P., a law firm, from 1994 to August 2001. Mr. Thomas has been Chairman of
Pier 1 since February 9, 2007 and Independent Director since September 1998.
Alex W. Smith (Chief Executive Officer, President and Director)
Before being named CEO and President of Pier 1 in 2007, Alex Smith was Senior
Executive Vice President, Group President of The Tjx Companies Inc. since March 29,
2004. Mr. Smith served as Executive Vice President and Group Executive, International
of TJX Companies Inc. from 2001 to March 29, 2004. Mr. Smith was responsibilities for
The Marmaxx Group, The Tjx Companies Inc.'s HomeGoods division, and the California
Buying Office and oversight of the European Buying Offices. Mr. Smith was Managing

Page 28 of 78
Director of T.K. Maxx from 1995 to 2001. He was Managing Director of Lane Crawford
from 1994 to 1995, Managing Director of Owen Owen plc from 1990 to 1993 and
Merchandise Director from 1987 to 1990.
James M. Hoak, Jr. (Plans to resign from Board when his term expires; Director,
Chairman of Audit Committee, Chairman of Nominating & Corporate Governance
Committee and Member of Executive Committee)
Mr. James M. Hoak, Jr. is the Chairman and Chief Executive Officer at Hoak
Media Corporation since September 1991 and is one of the premier media
entrepreneurs. He also serves as a Value Added Partner of CIC Partners. In 1971, Mr.
Hoak founded Heritage Communications, Inc. In 1991, he co‐founded Crown Media, Inc.
to acquire and operate cable systems, which they sold in 1995. Mr. Hoak served as the
Chief Executive Officer and Chairman of Crown Media, Inc. from February 1991 to
January 1995. From 1971 to 1987, he served as a Chief Executive Officer and President
of Heritage Communications, Inc. and Chairman and Chief Executive Officer from August
1987 to December 1990. Prior to this, Mr. Hoak founded Heritage Media Corporation in
1987 to purchase radio and television properties of Heritage Communications. He is the
Founder and Chairman of the American Association of Entrepreneurs. Mr. Hoak has
been involved with numerous other communications businesses. He has over 30 years
of experience as an entrepreneur, operator, investor and Chief Executive Officer in
various industries. Mr. Hoak has been the Chairman of Hoak Media since its formation
in August 2003. He is a Chairman of the Board at Chaparral Steel Company and serves
on the Executive Committee. He has been a Director of Texas Industries Inc. since 1995.
Mr. Hoak has been a Director of Pier 1 since September 1991 and is Chairman of the
Nominating and Audit Committees and member of the Executive Committee. He has
been a Director of Grande Communications Holdings Inc. since February 2000 and
member of its Finance Committee. Mr. Hoak is a Director Nominee of Panamsat Holding
Corp. and Director of Midwest Resources, Inc.; Texas Industries; Grande
Communications; and HBW Holdings, Inc. He served as a Chairman of HBW Holdings,

Page 29 of 78
Inc. from July 1996 to November 1999 and Heritage Media Corporation from its
inception in August 1987 until its sale in August 1997. Mr. Hoak served as a Director of
TeleCorp PCS Inc. since the merger in November 13, 2000; PanAmSat Holding Corp.
(formerly Panamsat Corp.) from May 1997 to August 2004; Heritage Media Corporation;
and Dynamex, Inc. He was a Governor of the American Stock Exchange. Mr. Hoak
received a B.A. from Yale University in 1966 and a J.D. from Stanford University School
of Law in 1969.
John H. Burgoyne (Independent Director and Member of Compensation Committee)
John H. Burgoyne has been a independent Director of Pier 1 since February 1999
and is a member of the Compensation Committee. Mr. Burgoyne has served as
President of Burgoyne and Associates (an international consulting firm) since March
1996. From May 1995 to March 1996, Mr. Burgoyne served as the General Manager of
IBM's Travel Industry sector for their Asia Pacific Region. Prior to that time, he served as
the President and General Manager of IBM China Corporation Ltd.
Michael R. Ferrari (Independent Director and Member of Audit Committee)
Michael R. Ferrari has been a Director of Pier 1 since February 1999 and is a
member of the Audit Committee. Dr. Ferrari has served as Senior Vice President and
Managing Director of the higher education practice of EFL Associates, an Executive
search firm, since May 2003. He is also the President of Ferrari and Associates LLC, a
higher education consulting firm he established in May 2003. Dr. Ferrari was granted
the title of Chancellor Emeritus of Texas Christian University by the universitys board of
trustees on June 1, 2003. Dr. Ferrari served as Chancellor of Texas Christian University
and Professor of Management in the M. J. Neeley School of Business at Texas Christian
University from July 1998 through May 2003. From 1985 to 1998, he served as
President of Drake University.

Page 30 of 78
Karen W. Katz (Independent Director, Member of Compensation Committee and
Member of Nominating & Corporate Governance Committee)
Karen W. Katz has been President and Chief Executive Officer of Neiman Marcus
Stores, a subsidiary of Neiman Marcus Group Inc. since December 2002. Mrs. Katz
served as President and Chief Executive Officer of Neiman Marcus Direct (a division of
the Neiman Marcus Group) from May 2000 to December 2002. She served as Executive
Vice President of Neiman Marcus Stores from February 1998 to May 2000 and served as
Senior Vice President from September 1996 to February 1998. She served as Vice
President and General Manager of the Dallas NorthPark Neiman Marcus store prior
thereto. She has been an Independent Director of Pier 1 since June 2001 and serves as a
Member of the Nominating and Audit Committees. She served as a Director of Neiman
Marcus Stores from September 1996 to February 1998.
Terry E. London (Independent Director and Member of Audit Committee)
Terry E. London has been President of London Partners LLC since July 2001. Mr.
London established London Partners LLC, a private equity investment firm in 2000.
From May 1997 to July 2000, he served as President and Chief Executive Officer Gaylord
Entertainment Company (“Gaylord”) (hospitality and attractions, creative content and
interactive media). He served as an Executive Vice President and Chief Operating
Officer of Gaylord from March 1997 to May 1997. He served as Chief Financial and
Administrative Officer of Gaylord Entertainment from 1991 to 1997. Mr. London has
been an Independent Director of Pier 1 Imports Inc., since September 25, 2003. Mr.
London has been a Director of Johnson Outdoors Inc. since 1999. He served as a
Director of Gaylord Entertainment Company from May 1997 to July 2000.
We consider only 5 of the 7 board members to be independent. The
independent board members include Hoak, Burgoyne, Ferrari, Katz and London. As
chairman and CEO, we do not consider Alex W. Smith to be independent. The final
board member, Tom Thomas, is a shareholder in a law firm who currently provides legal

Page 31 of 78
services for Pier 1. However, his firm provided less that 2% of the total legal work last
year and Mr. Thomas is less than a 10% shareholder in his company. Although the
relationship between Mr. Thomas and the law firm was deemed to be immaterial by the
board although he is considered to not be independent.
Discussion of financial condition
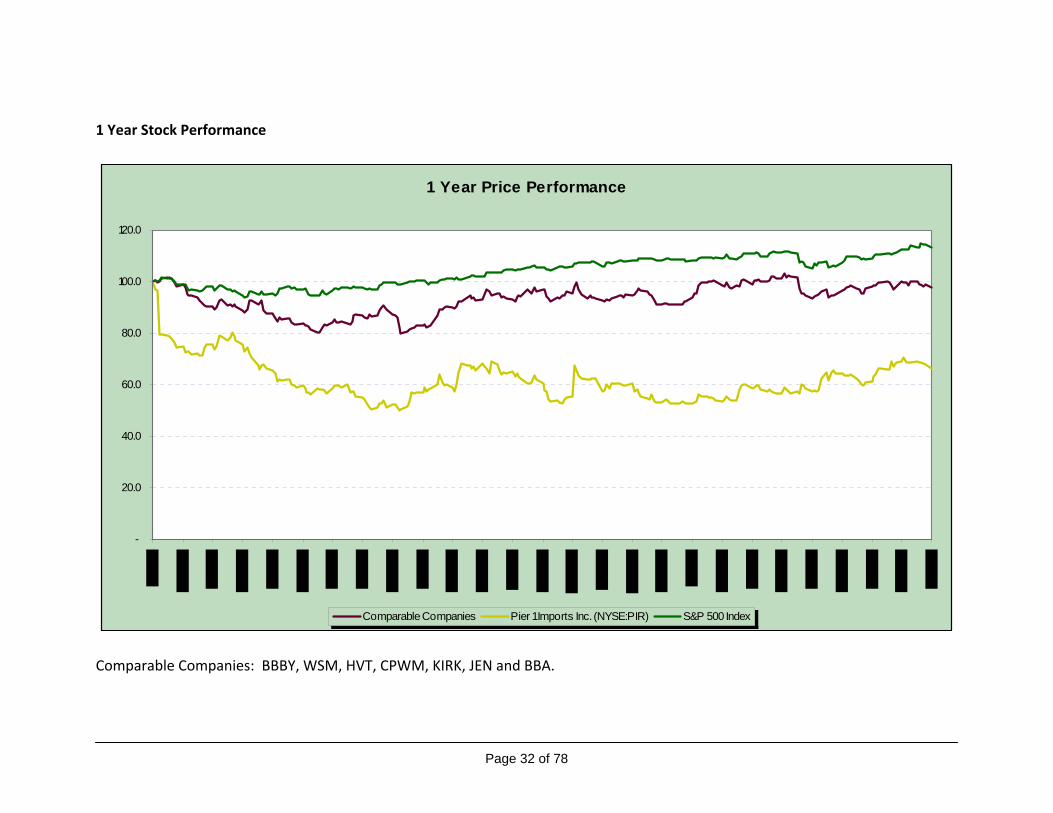
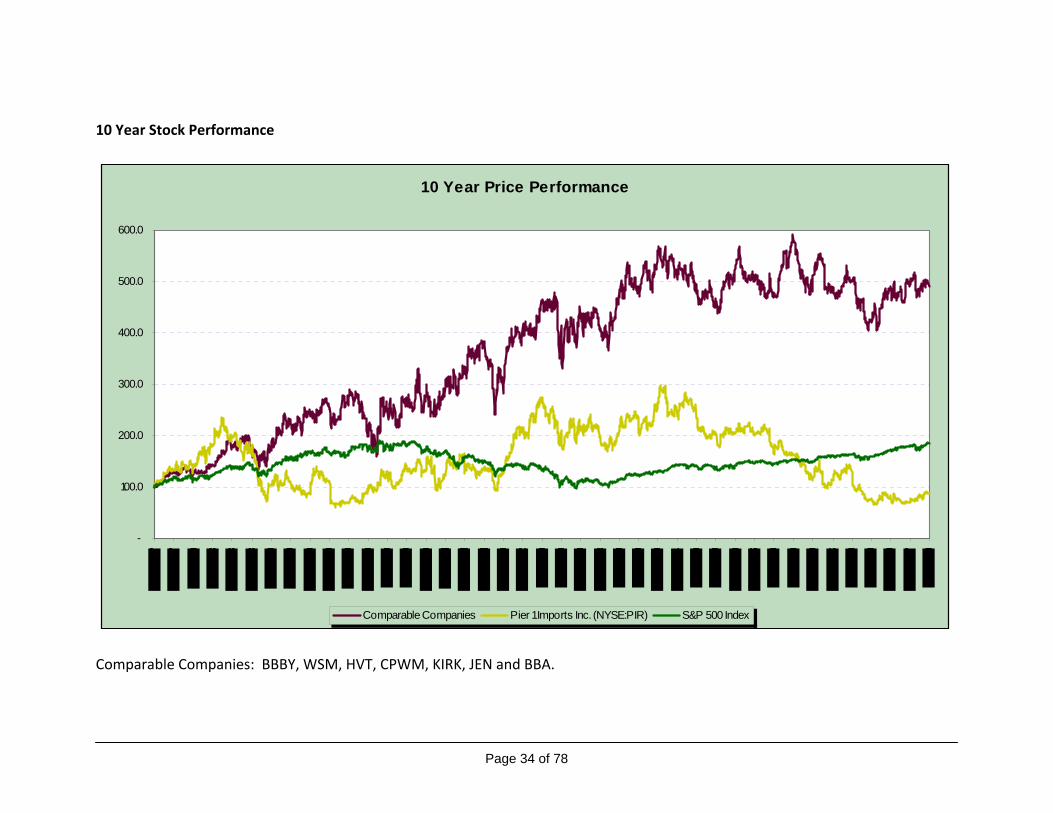
Historic Stock Performancevii
Pier 1’s stock has fallen significantly from the beginning of 2005 through 2007, losing
approximately two‐thirds of its value, following a relatively flat performance the prior
three years. From 1999 to 2002 Pier 1’s stock appreciated significantly as management
pushed its growth initiatives and opened new stores which led to many of the problems
the Company is now facing.
Page 32 of 78
1 Year Stock Performance
1 Year Price Performance
-
20.0
40.0
60.0
80.0
100.0
120.0
Comparable Companies Pier 1 Imports Inc. (NYSE:PIR) S&P 500 Index
Comparable Companies: BBBY, WSM, HVT, CPWM, KIRK, JEN and BBA.

Page 33 of 78
5 Year Stock Performance
5 Year Price Performance
-
20.0
40.0
60.0
80.0
100.0
120.0
140.0
160.0
Comparable Companies Pier 1 Imports Inc. (NYSE:PIR) S&P 500 Index
Comparable Companies: BBBY, WSM, HVT, CPWM, KIRK, JEN and BBA.
Page 34 of 78
10 Year Stock Performance
10 Year Price Performance
-
100.0
200.0
300.0
400.0
500.0
600.0
Comparable Companies Pier 1 Imports Inc. (NYSE:PIR) S&P 500 Index
Comparable Companies: BBBY, WSM, HVT, CPWM, KIRK, JEN and BBA.
Page 35 of 78
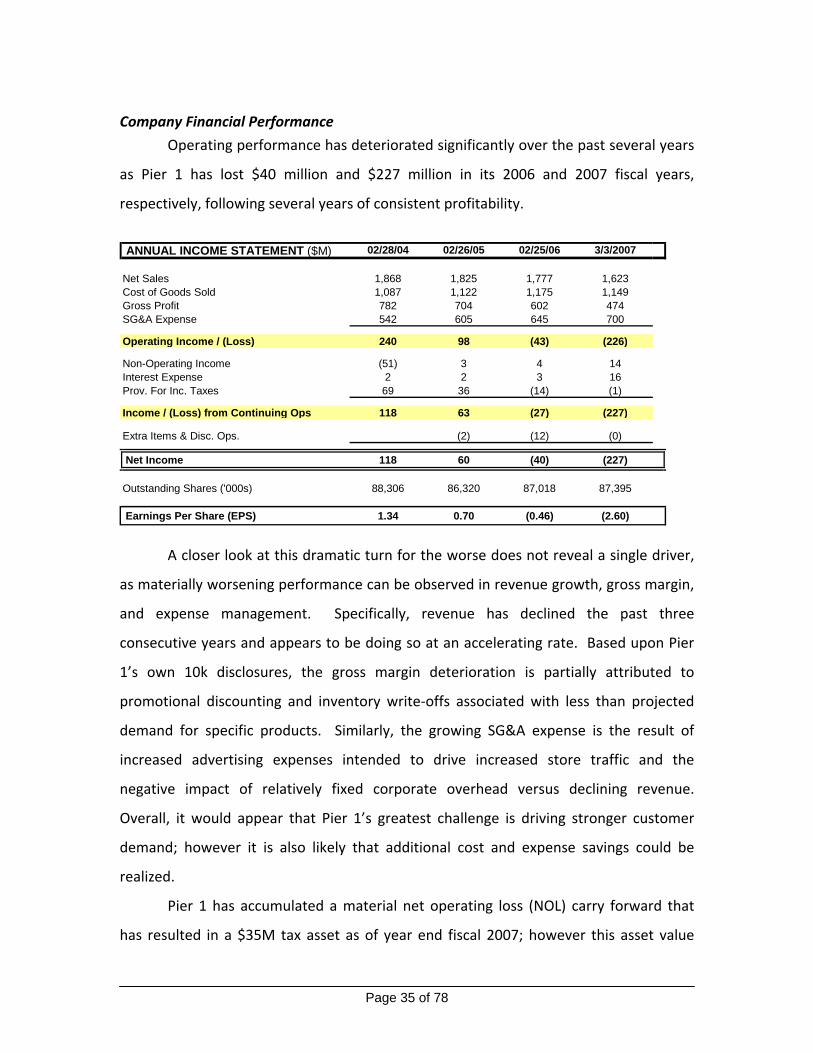
Company Financial Performance
Operating performance has deteriorated significantly over the past several years
as Pier 1 has lost $40 million and $227 million in its 2006 and 2007 fiscal years,
respectively, following several years of consistent profitability.
ANNUAL INCOME STATEMENT ($M) 02/28/04 02/26/05 02/25/06 3/3/2007
Net Sales 1,868 1,825 1,777 1,623 Cost of Goods Sold 1,087 1,122 1,175 1,149 Gross Profit 782 704 602 474 SG&A Expense 542 605 645 700
Operating Income / (Loss) 240 98 (43) (226)
Non-Operating Income (51) 3 4 14 Interest Expense 2 2 3 16 Prov. For Inc. Taxes 69 36 (14) (1)
Income / (Loss) from Continuing Ops 118 63 (27) (227)
Extra Items & Disc. Ops. (2) (12) (0)
Net Income 118 60 (40) (227)
Outstanding Shares ('000s) 88,306 86,320 87,018 87,395
Earnings Per Share (EPS) 1.34 0.70 (0.46) (2.60)
A closer look at this dramatic turn for the worse does not reveal a single driver,
as materially worsening performance can be observed in revenue growth, gross margin,
and expense management. Specifically, revenue has declined the past three
consecutive years and appears to be doing so at an accelerating rate. Based upon Pier
1’s own 10k disclosures, the gross margin deterioration is partially attributed to
promotional discounting and inventory write‐offs associated with less than projected
demand for specific products. Similarly, the growing SG&A expense is the result of
increased advertising expenses intended to drive increased store traffic and the
negative impact of relatively fixed corporate overhead versus declining revenue.
Overall, it would appear that Pier 1’s greatest challenge is driving stronger customer
demand; however it is also likely that additional cost and expense savings could be
realized.
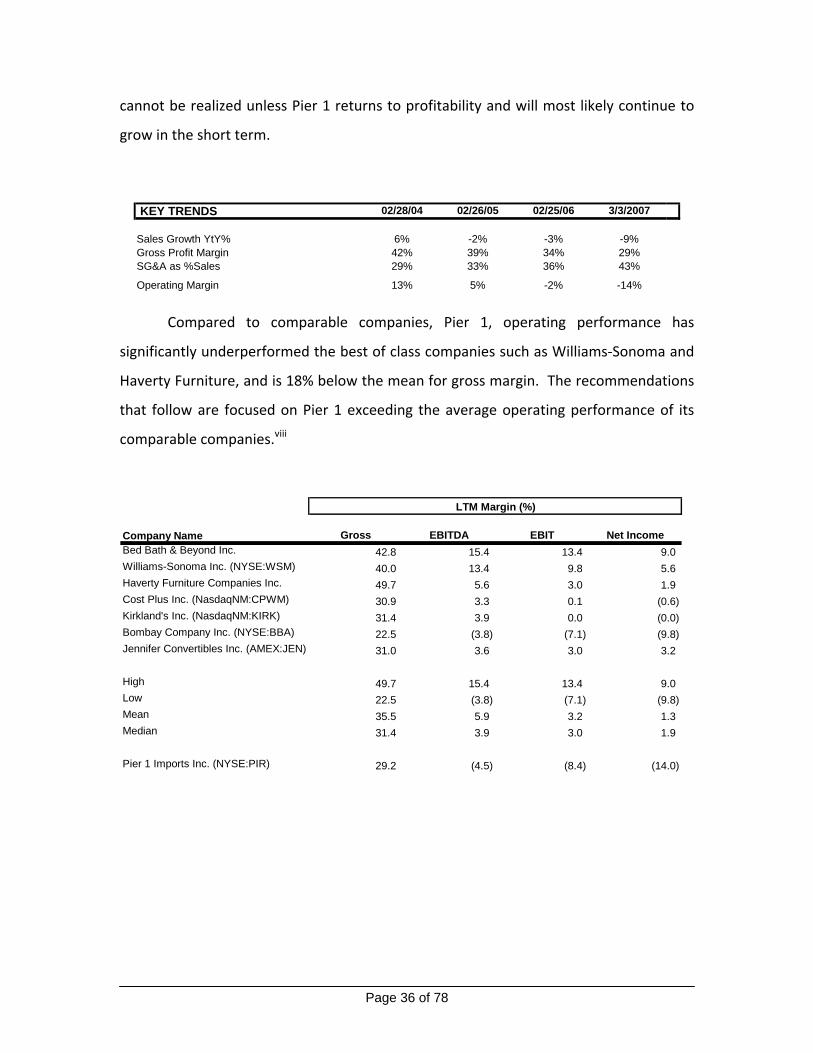
Pier 1 has accumulated a material net operating loss (NOL) carry forward that
has resulted in a $35M tax asset as of year end fiscal 2007; however this asset value
Page 36 of 78
cannot be realized unless Pier 1 returns to profitability and will most likely continue to
grow in the short term.
KEY TRENDS 02/28/04 02/26/05 02/25/06 3/3/2007
Sales Growth YtY% 6% -2% -3% -9%Gross Profit Margin 42% 39% 34% 29%SG&A as %Sales 29% 33% 36% 43%
Operating Margin 13% 5% -2% -14%
Compared to comparable companies, Pier 1, operating performance has
significantly underperformed the best of class companies such as Williams‐Sonoma and
Haverty Furniture, and is 18% below the mean for gross margin. The recommendations
that follow are focused on Pier 1 exceeding the average operating performance of its
comparable companies.viii
Company Name Gross EBITDA EBIT Net IncomeBed Bath & Beyond Inc. 42.8 15.4 13.4 9.0 Williams-Sonoma Inc. (NYSE:WSM) 40.0 13.4 9.8 5.6 Haverty Furniture Companies Inc. 49.7 5.6 3.0 1.9 Cost Plus Inc. (NasdaqNM:CPWM) 30.9 3.3 0.1 (0.6) Kirkland's Inc. (NasdaqNM:KIRK) 31.4 3.9 0.0 (0.0) Bombay Company Inc. (NYSE:BBA) 22.5 (3.8) (7.1) (9.8) Jennifer Convertibles Inc. (AMEX:JEN) 31.0 3.6 3.0 3.2
High 49.7 15.4 13.4 9.0 Low 22.5 (3.8) (7.1) (9.8) Mean 35.5 5.9 3.2 1.3 Median 31.4 3.9 3.0 1.9
Pier 1 Imports Inc. (NYSE:PIR) 29.2 (4.5) (8.4) (14.0)
LTM Margin (%)
Page 37 of 78
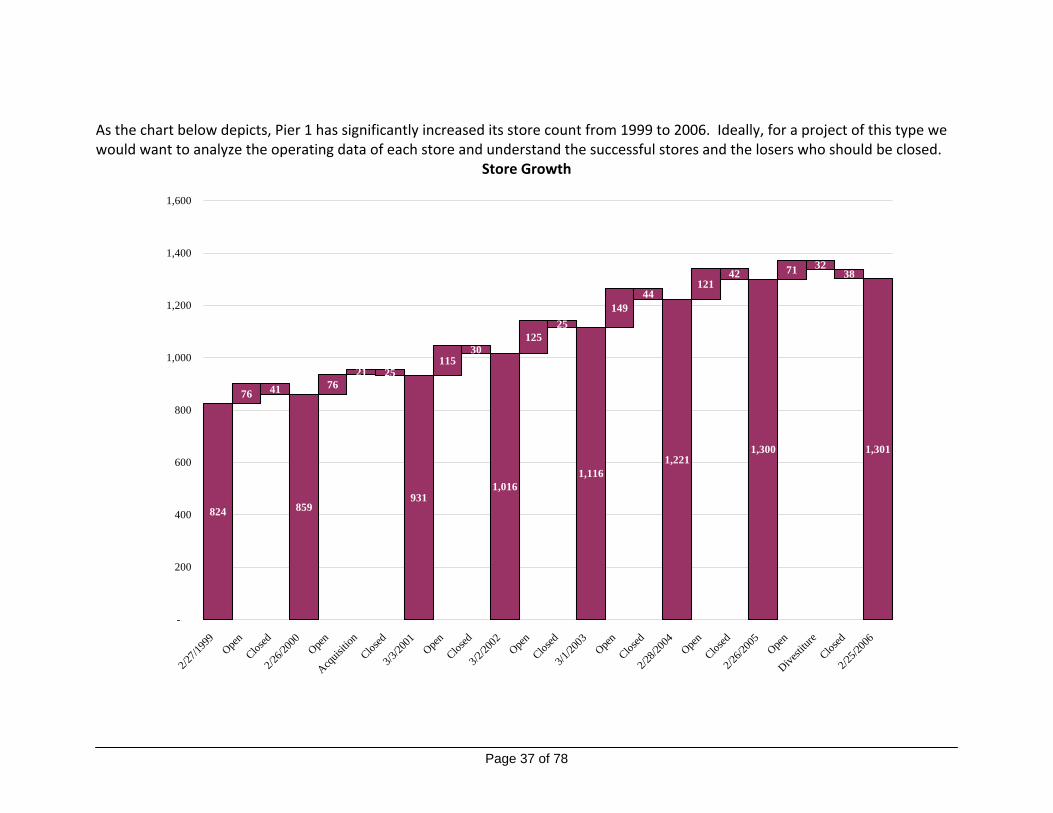
As the chart below depicts, Pier 1 has significantly increased its store count from 1999 to 2006. Ideally, for a project of this type we would want to analyze the operating data of each store and understand the successful stores and the losers who should be closed.
Store Growth
824
76 41
859
7621 25
931
11530
1,016
12525
1,116
14944
1,221
12142
1,300
71 3238
1,301
-
200
400
600
800
1,000
1,200
1,400
1,600
2/27/1
999
Open
Closed
2/26/2
000
Open
Acquis
ition
Closed
3/3/20
01Ope
nClos
ed3/2
/2002
Open
Closed
3/1/20
03Ope
nClos
ed2/2
8/200
4Ope
nClos
ed2/2
6/200
5Ope
nDive
stitur
eClos
ed2/2
5/200
6

Page 38 of 78
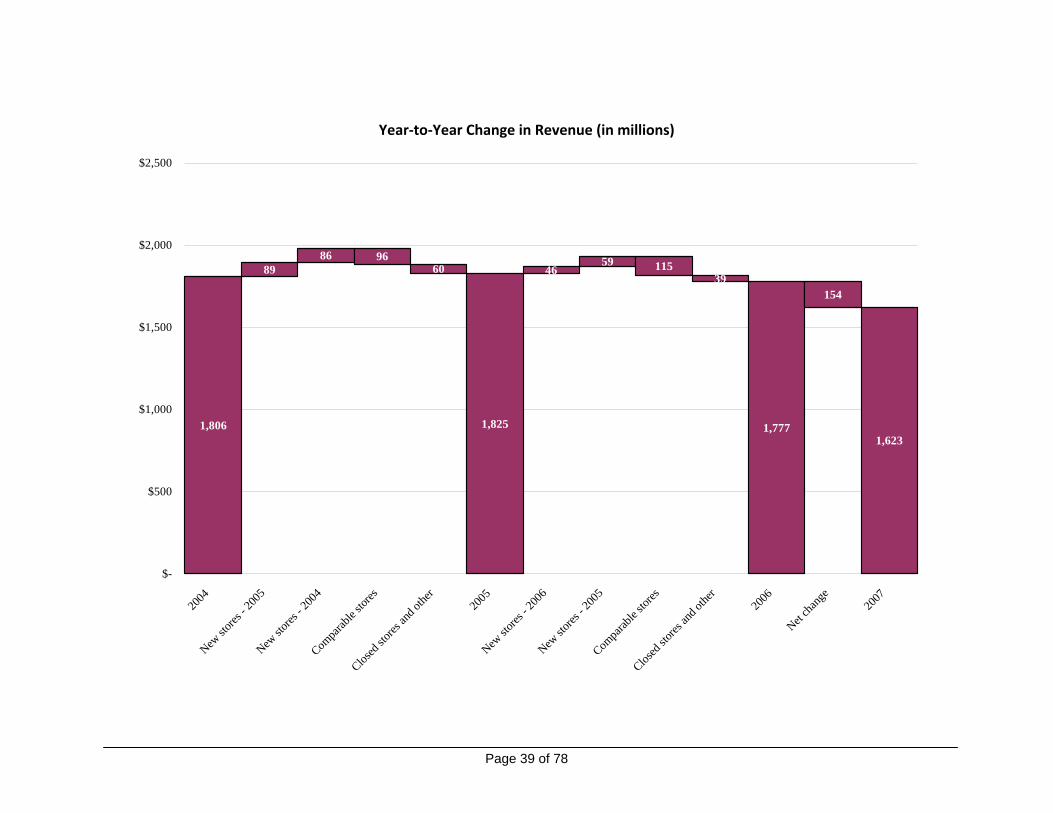
As is the case with most retailers, same store sales represent a key performance
metric given they most accurately reflect the overall health of the brand by excluding
the often material impact of new store openings and/or closings. In the case of Pier 1,
same store sales declined 7.1% for fiscal 2006 and 6.1% for fiscal 2005, representing the
core performance problem driving the overall revenue deterioration. Directly below is a
summary bridge of year‐to‐year revenue dynamics, which highlights the impact of
declining same store sales relative to new store growth and lost revenue from closed
stores. Clearly, the growth from the new stores has been inadequate to offset the
decline in existing stores.
($s millions) 2006
New stores opened during fiscal 2006 46 Sotres opened during fiscal 2005 59 Same Store Sales (115)Closed Stores (39)
Net Decrease in Sales (49)
Change in Revenue YtY
Page 39 of 78
Year‐to‐Year Change in Revenue (in millions)
1,806
8986 96
60 4659 115
39
1,777
154
1,6231,825
$-
$500
$1,000
$1,500
$2,000
$2,500
2004
New sto
res - 2
005
New sto
res - 2
004
Compa
rable
stores
Closed
stores
and o
ther
2005
New sto
res - 2
006
New sto
res - 2
005
Compa
rable
stores
Closed
stores
and o
ther
2006
Net ch
ange
2007

Page 40 of 78
Pier 1 has made significant capital expenditures in the last few years as it has
increased its store base. In 2006, Pier 1 made $51 million of capital expenditures, $31.5
million of which were for fixtures and leasehold improvements, $15.8 million were for
information systems enhancements and $3.5 million were for distribution centers.
Liquidity Analysis
Pier 1 has consistently maintained a significant balance of cash and/or
marketable securities of approximately $200M over the past 5 years, likely in
recognition of the risks inherent to the retail industry given the volatility in consumer
tastes and fixed cost structure. Despite its recent poor performance, Pier 1
management has been able to generate additional cash to sustain this cash reserve
through the sale of its credit card operations in the fall of 2006, and finished its 2007
fiscal year (ended 3/3/07) with $167M of cash on hand. Based upon analyst estimates
and the company’s current cash burn‐rate, we project that this cash on hand should be
sufficient to sustain operations for at least 12 ‐ 18 months (raw projections indicate 2
years, however we believe there may be additional risk and seasonal working capital
requirements).
($M) 2008 2009 2010
Beginning Cash 167 74 13
-Less Net Cash Flow (93) (61) (40)
Ending Cash Balance 74 13 (27)
Projected Cash Burn
Also of note, Pier 1 ceased paying dividends in November 2006 and we do not
expect that management will resume payments until performance improves
significantly, alleviating $35M of prior cash flow obligations until operations can be
stabilized. Further, Pier 1 did execute a modest share buyback (250,000 shares for $4M)
in 2006. Although, $107M of authorized share repurchases remains available, we do
not expect that management will continue this activity given the current financial
condition (these assumptions included in above ‘cash burn’ projection).
Page 41 of 78
Finally, Pier 1’s business does have a moderate seasonal skew, as 25% of full year
revenue is earned in November and December. Accordingly, significant working capital
is required to support the necessary inventory build‐up in September – October. Given
the company’s current strong cash position, we do not believe that the 2007 holiday
season will present a liquidity problem, however if overall performance does not
improve the 2008 holiday season will likely represent a potential tipping point in which
Pier 1 will require additional financing.
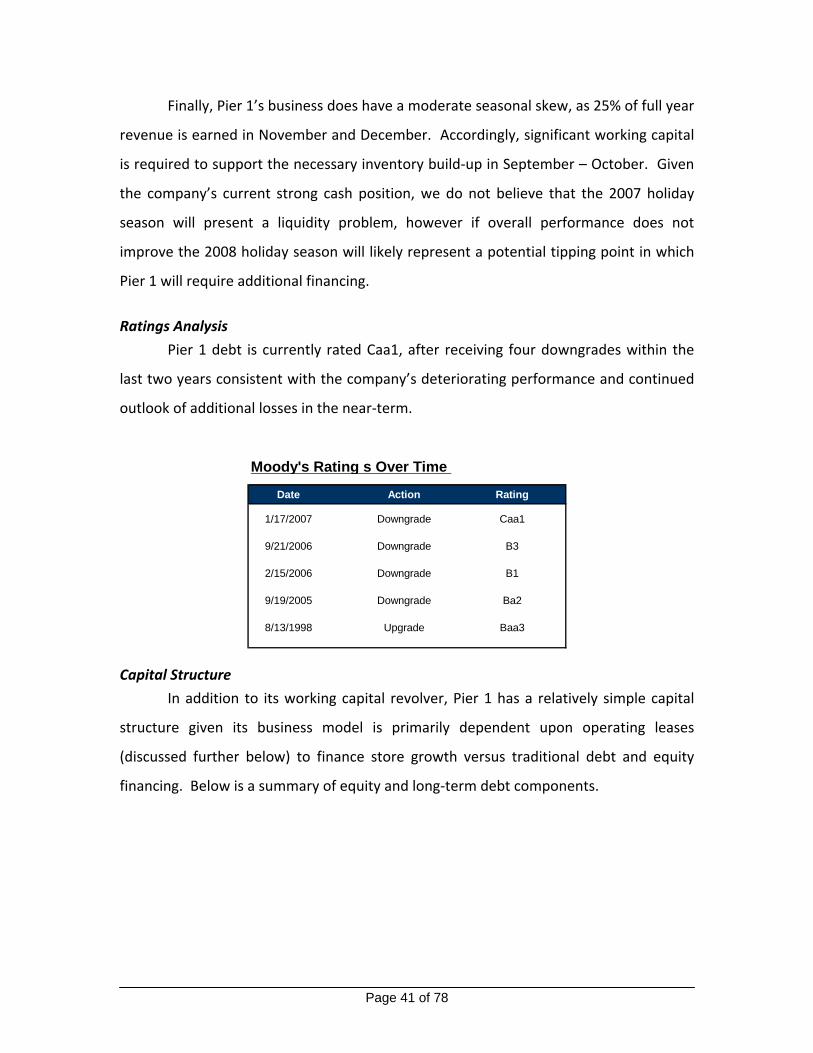
Ratings Analysis
Pier 1 debt is currently rated Caa1, after receiving four downgrades within the
last two years consistent with the company’s deteriorating performance and continued
outlook of additional losses in the near‐term.
Date Action Rating
1/17/2007 Downgrade Caa1
9/21/2006 Downgrade B3
2/15/2006 Downgrade B1
9/19/2005 Downgrade Ba2
8/13/1998 Upgrade Baa3
Moody's Rating s Over Time
Capital Structure
In addition to its working capital revolver, Pier 1 has a relatively simple capital
structure given its business model is primarily dependent upon operating leases
(discussed further below) to finance store growth versus traditional debt and equity
financing. Below is a summary of equity and long‐term debt components.

Page 42 of 78
EQUITYMarket Value
-Current Share Price (4/20) 7.76 -Shares Outstanding ('000s) 87,395 Equity Value / Mkt Cap ($M) 678
DEBTBook Value
-Convertible Senior Notes (6.375%) 165 -Industrial revenue bonds 19 Total LT Debt ($M) 184
Total Enterprise Value 862
Total Sharehold Equity & Debt Obligations
Debt Instruments
Pier 1 has historically not been very active in the capital markets as its debt
needs were minimal and its profitable operations allowed it to begin repurchasing stock.
However, as performance began to deteriorate, management sought debt financing in
early 2006, in the form of a $165M convertible bond offering. This timing was
somewhat fortuitous, as it preceded additional Moody’s downgrades and secured a
significant amount of long term financing on advantageous terms.
• Convertible Bonds – Issued in February 2006, these convertible senior notes (due
2036) carry an interest rate of 6.375% through 2011 and a rate of 6.125%
thereafter. Interest is payable semi‐annually in arrears. The notes are
convertible into shares of common stock, or equivalent cash, at an initial
conversion rate of 65.8 shares per $1,000 principal amount of Notes (implied
share price of $15.20 / share). However, this conversion can only be executed
under specific circumstances which require that the stock price trade above
$19.75 / share for at least 20 trading days in the period of 30 consecutive trading
days. Further, the notes may be redeemed by the company on or after February
2011 at par value.
• Industrial revenue bonds – These bonds were initially issued in 1987 to construct
three warehouse/distribution facilities. These tax‐exempt bonds mature in 2026

Page 43 of 78
and carry floating interest rates pegged to municipal debt interest rates resulting
in extremely low effective interest rates (4.1% in 2006).
• Secured Line of Credit – In addition to the $184M of long‐term debt, Pier 1 also
has an unutilized $325M secured credit facility which matures in November
2010. This facility is secured by the company’s inventory and carries an interest
rate of LIBOR +1.0%. Pier 1 has not utilized the cash borrowing from this line
since late 2005 when $38.5M was used to fund the working capital build‐up prior
to the holiday season (October – December) and the balance was paid in fully by
year end and has not been utilized since, likely due to the fact the proceeds from
the sale of the credit card operations have provided adequate liquidity. Pier 1
pays a fee of 1% for standby letters of credit, .5% for trade letters, and a
commitment fee of .25% for unused amounts
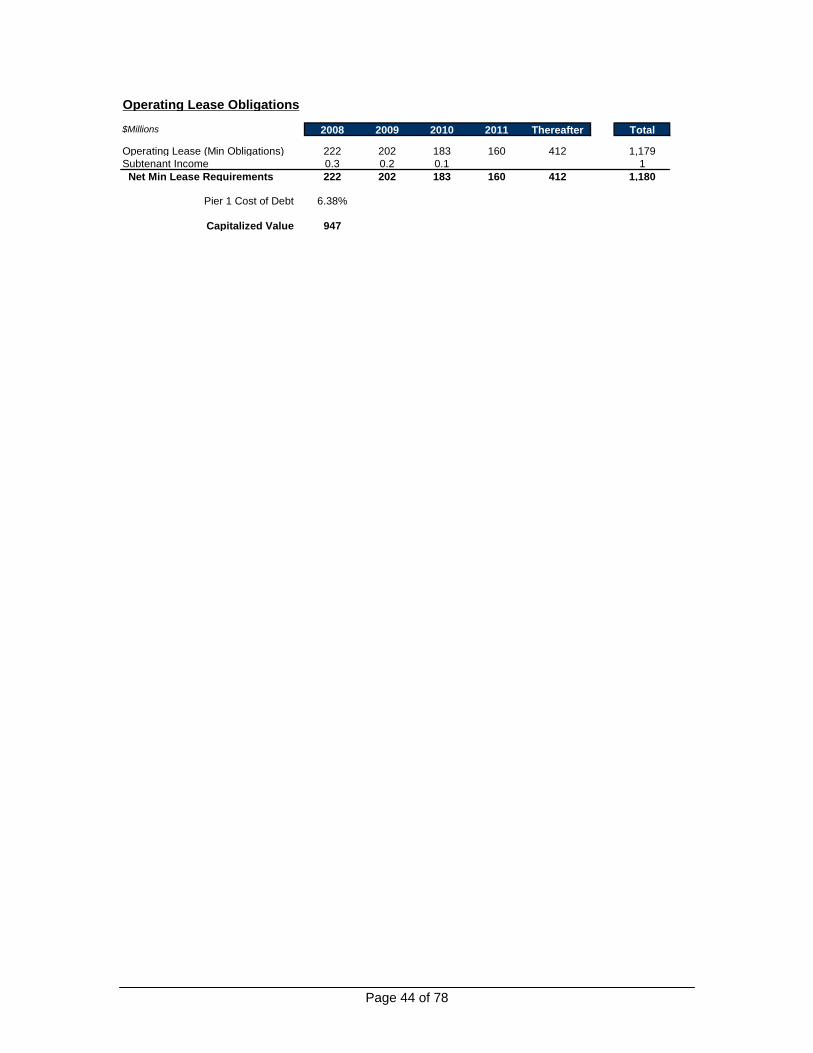
Operating Lease Obligations
Pier 1 has utilized operating lease agreements to finance its stores and
appropriately recognizes the associated rental expenses as costs of goods sold.
However, these leases represent relatively fixed (material fees payable in the event of
early termination) long‐term obligations and represent a significant fixed cost within
Pier 1’s business model. Below is the complete schedule of operating lease obligations
and an estimated current capitalized debt value of $947M.
The company does not disclose adequate information to determine the present
value asset‐value of these same leases; however, given macro real estate trends over
the past 10 years and fact that many under performing stores have already been closed
it is reasonable to assume the fair market value of these leases is greater than the
present value of the current lease obligations. Nevertheless, given these leases are
essential to the continue operation of Pier 1, this potential excess value should only be
considered in the event of company liquidation. Otherwise, this implicit value should be
recognized through the operation of the associated stores.
Page 44 of 78
$Millions 2008 2009 2010 2011 Thereafter Total
Operating Lease (Min Obligations) 222 202 183 160 412 1,179Subtenant Income 0.3 0.2 0.1 1 Net Min Lease Requirements 222 202 183 160 412 1,180
Pier 1 Cost of Debt 6.38%
Capitalized Value 947
Operating Lease Obligations

Page 45 of 78
Discussion of valuations
Liquidation value
Liquidating Pier 1 may prove to be challenging, as the company’s most significant
assets: 1) its brand name and associated marketplace equity and 2) its portfolio of real
estate leases cannot easily be monetized. Further, selling the portfolio of leases to
another retailer or real estate interest may preclude the realization of value from the
Pier 1 brand as the brands strength is moderate at best and it is unlikely that any buyer
would be interested in the rights to the name only. It is also unclear as to what the
quality of the aggregate lease portfolio might be; given macro real estate trends over
the past ten years it is very possible that the value of Pier 1’s lease portfolio is greater
than the outstanding obligations, however given its poor financial performance its
equally possible that Pier 1 has made poor real estate decisions in the past and the lease
obligations may exceed their fair market value.
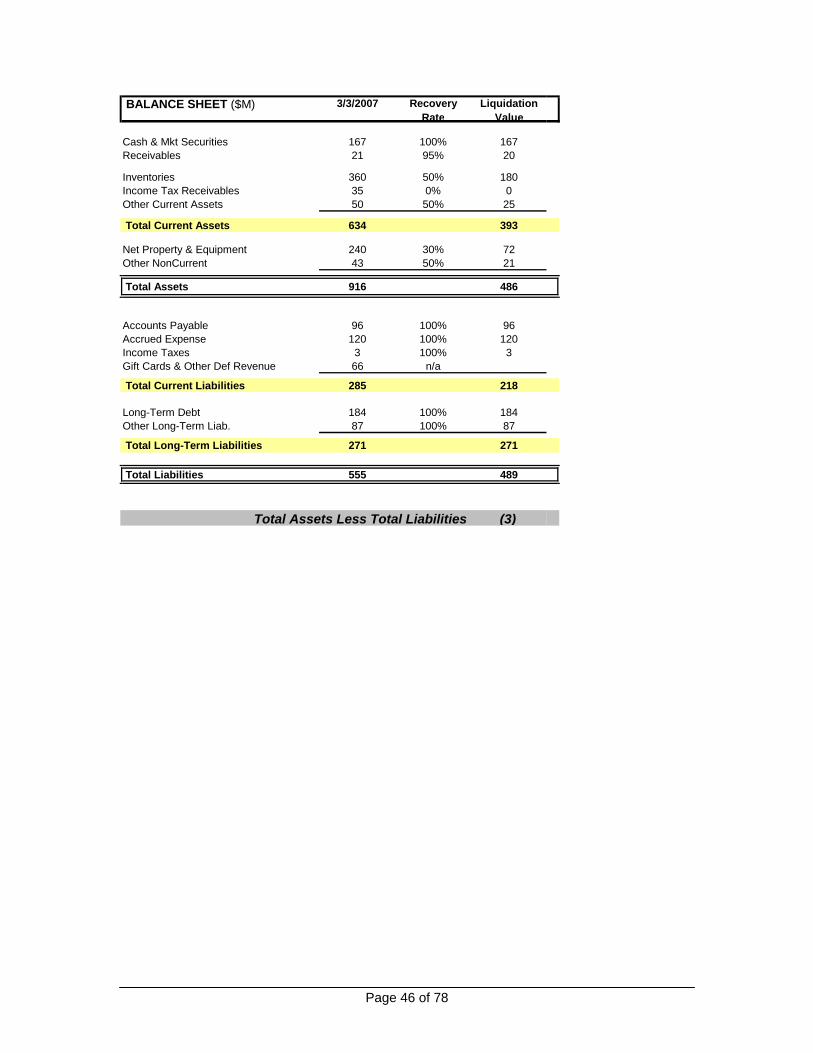
Below is a simple balance sheet liquidation estimate (excluding intangible value
of brand and potential lease value). This analysis would suggest there is little reason to
expect material proceeds in excess of liabilities and debt. Further, the current market
value is implicitly far greater than this liquidation view indicating that the market
continues to recognize the ‘going concern’ value of Pier 1 as being superior to the sum
of its parts from asset proceeds.
Page 46 of 78
BALANCE SHEET ($M) 3/3/2007 Recovery Rate
Liquidation Value
Cash & Mkt Securities 167 100% 167 Receivables 21 95% 20
Inventories 360 50% 180 Income Tax Receivables 35 0% 0 Other Current Assets 50 50% 25
Total Current Assets 634 393
Net Property & Equipment 240 30% 72 Other NonCurrent 43 50% 21
Total Assets 916 486
Accounts Payable 96 100% 96 Accrued Expense 120 100% 120 Income Taxes 3 100% 3 Gift Cards & Other Def Revenue 66 n/a
Total Current Liabilities 285 218
Long-Term Debt 184 100% 184 Other Long-Term Liab. 87 100% 87
Total Long-Term Liabilities 271 271
Total Liabilities 555 489
(3)Total Assets Less Total Liabilities
Page 47 of 78
Discussion of Alternatives
In order to determine the optimal strategy for Pier 1, we have evaluated all of
the potential alternatives available to management.
Status quo
Pier 1’s current strategy has been more dynamic than a simple ‘business as
usual’ strategy; management has clearly recognized the need to drive increased
customer demand and in‐store traffic and has invested accordingly. Further,
management has begun to close several underperforming stores each year, while
simultaneously opening new stores. However, to date, this strategy has not stemmed
the sales decline while management’s various investments in advertising and new stores
have accelerated the losses and negative cash flow.
This strategy would allow management to continue the initiatives already
underway and continue to invest in the Pier 1 brand and updating its product portfolio,
while continuing to pursue new store growth opportunities.
However, we believe that continuing this strategy will provide Pier 1 with a
limited ‘window of opportunity’ to turnaround same store sales before the negative
cash flow would force management to significantly restructure and seek additional
financing, both of which would likely force a cessation of the desired strategy.
Specifically, our estimates indicate that under the current strategy the company would
likely run out of cash by 2010, with potential liquidity risk prior to the 2009 holiday
season. Further, Pier 1’s current secured credit line is set to mature in 2010 prior to the
holiday season, and would likely not be renewed assuming Pier 1 does not outperform
current expectations between now and then, leaving the company with a nearly certain
cash shortfall in 2010 if not sooner. Therefore, we believe this approach to be a risky
proposition given the unpredictable nature of consumer taste and the significant
difficulty management has had to‐date addressing declining sales.

Page 48 of 78
($M) 2008 2009 2010
Beginning Cash 167 74 13
-Less Net Cash Flow (93) (61) (40)
Ending Cash Balance 74 13 (27)
Projected Cash Burn
Cost Savings Strategy
Clearly, there are significant opportunities to reduce costs. First, management
has yet to slash corporate overhead spending; in fact it continues to increase. Also, the
rate of store closure could be accelerated with the goal of closing the 10 – 20% of
bottom performing stores. Next, staffing within stores could be scaled back to more
accurately match anticipated store traffic. Finally marketing expenses could be scaled
back, as the company’s current on‐and‐off approach to television advertising is likely not
optimal. These actions, although somewhat draconian, would likely stem the operating
losses in the near‐term and provide Pier 1 with several years of continued operation.
However, Pier 1 risks further sales reductions as a result of reduced employees and
marketing expenses.
However, this strategy may only succeed in enabling a ‘slow death’ as the cost
savings would clearly slow the drain on cash, but ultimately may prevent success in a
retail business where marketing and product investments are required to drive demand.
Bankruptcy
In the case of Pier 1, bankruptcy is unlikely to offer significant proceeds as there
are few tangible assets outside of the brand identity itself. Although it is possible that
the portfolio of store leases may have value to another retail chain or investor willing to
re‐sell them, it is extremely unlikely that this value would represent an accretive
solution for shareholders relative to Pier 1’s current market capitalization and our prior
liquidity analysis that indicated zero net proceeds would be available to equity holders
based upon tangible asset sales.

Page 49 of 78
Despite Pier 1’s considerable financial challenges, the company remains far from
bankruptcy given its strong cash position. The company’s current stock price (Market
Cap of $678M) would appear to re‐affirm this position and accordingly bankruptcy
would not appear to be an optimal solution at this point.
Marketing Led Strategy
Clearly, driving customer demand is critical in all retail industries. One possible
strategy for Pier 1 would be to dramatically increase direct marketing efforts while
investing in store updates and new product lines. This would clearly be an extremely
aggressive strategy and in the very near term would accelerate the cash burn rate, but
would likely offer the greatest upside if successful.
However, there is little evidence that the current management team (or any
industry analyst) fully understands how to quickly reverse Pier 1’s fortunes with its core
customer base. Accordingly, pursuing this strategy would likely be the equivalent to
placing one large bet with what remains of the company’s resources.

Page 50 of 78
Recommendations
Immediate Action Plan
Pier 1 must take immediate action to close a significant portion of its
underperforming stores in an effort to stabilize its finances and right‐size its SG&A
expenses. Specifically, at least 20% of its current stores are operating at significant
losses without reasonable hope of improvement, and the company can ill afford to
continue to finance such money losing endeavors. Additionally, Pier 1 should look to
monetize its investment in its corporate headquarters. Further, the company has
confused its customers with its numerous and ever changing marketing campaigns, and
must refocus on its core segment of fashionable furnishings at value price points and
avoid price as a basis of differentiation. Finally, there is an unrealized opportunity for
material savings in Pier 1's supply chain through consolidation of suppliers and
implementation of a Total Cost of Ownership approach to supply chain management.
By implementing these specific action plans, Pier 1 can return to profitability in its fiscal
year ending 2009 and achieve reasonable stock appreciation for its shareholders.
• Close 250 stores – By closing 250 underperforming stores, Pier 1 will generate
cash through inventory liquidation as well as stop immediate cash flow burn.
Pier 1 should engage Buxton or Geoviewix to provide market analysis for all of its
domestic markets, project where Pier 1 should be located vs. where Pier 1 is
located, analyze the cash flow contribution and make the store closing decisions
at that time.
• Rationalize new store development – Based on the feedback from Buxton and
Geoview, Pier 1 should take a rational, guarded approach to new store
development.
• Monetize corporate headquarters – Pier 1 should evaluate a sale‐leaseback
transaction on its corporate headquarters, an outright sale of the building or
leasing a significant amount of the space in the building. Our preliminary

Page 51 of 78
recommendation is a sale leaseback (for the portion of the building that Pier 1
needs to operate). We have conservatively assumed that this will generate $100
million of cash which is the Company’s investment in the building.
• Reduce SG&A to 30% of sales – Through labor reductions and cost
rationalizations Pier 1 should be able to return its SG&A to its historic 30% level,
even after taking into account the increased rent expense after selling the
building.
• Define Pier 1 brand – Pier 1 should work with Thinktopia to define its brand and
effectively communicate this message to its customers, employees and suppliers.
• Total Cost of Ownership – Pier 1 should engage an analysis of its supply chain
and internal practices to gain transparency into the Total Cost of Ownership of
its inventory. With this information, Pier 1 can then work with its suppliers to
reduce the cost of goods sold by Pier 1.
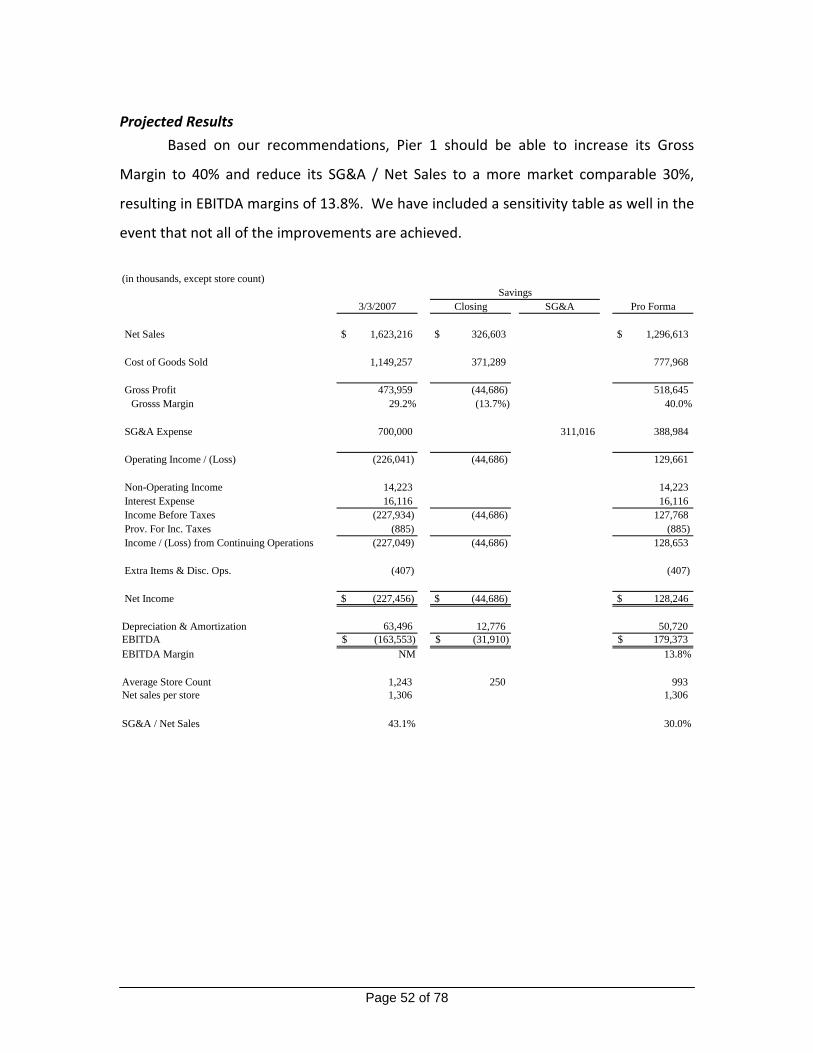
Page 52 of 78
Projected Results
Based on our recommendations, Pier 1 should be able to increase its Gross
Margin to 40% and reduce its SG&A / Net Sales to a more market comparable 30%,
resulting in EBITDA margins of 13.8%. We have included a sensitivity table as well in the
event that not all of the improvements are achieved.
(in thousands, except store count)
Savings3/3/2007 Closing SG&A Pro Forma
Net Sales $ 1,623,216 $ 326,603 $ 1,296,613
Cost of Goods Sold 1,149,257 371,289 777,968
Gross Profit 473,959 (44,686) 518,645 Grosss Margin 29.2% (13.7%) 40.0%
SG&A Expense 700,000 311,016 388,984
Operating Income / (Loss) (226,041) (44,686) 129,661
Non-Operating Income 14,223 14,223 Interest Expense 16,116 16,116 Income Before Taxes (227,934) (44,686) 127,768 Prov. For Inc. Taxes (885) (885) Income / (Loss) from Continuing Operations (227,049) (44,686) 128,653
Extra Items & Disc. Ops. (407) (407)
Net Income $ (227,456) $ (44,686) $ 128,246
Depreciation & Amortization 63,496 12,776 50,720 EBITDA (163,553)$ (31,910)$ 179,373$ EBITDA Margin NM 13.8%
Average Store Count 1,243 250 993 Net sales per store 1,306 1,306
SG&A / Net Sales 43.1% 30.0%

Page 53 of 78
Pro Forma EBITDA
SG&A / Net Sales
179,373 28% 30% 32% 34% 36% 38% 40% 42% 44%30% 75,644 49,712 23,780 (2,152) (28,085) (54,017) (79,949) (105,881) (131,814)
Gross 32% 101,577 75,644 49,712 23,780 (2,152) (28,085) (54,017) (79,949) (105,881) Margin 34% 127,509 101,577 75,644 49,712 23,780 (2,152) (28,085) (54,017) (79,949)
36% 153,441 127,509 101,577 75,644 49,712 23,780 (2,152) (28,085) (54,017) 38% 179,373 153,441 127,509 101,577 75,644 49,712 23,780 (2,152) (28,085) 40% 205,306 179,373 153,441 127,509 101,577 75,644 49,712 23,780 (2,152) 42% 231,238 205,306 179,373 153,441 127,509 101,577 75,644 49,712 23,780 44% 257,170 231,238 205,306 179,373 153,441 127,509 101,577 75,644 49,712
Pro Forma EBITDA Margin
SG&A / Net Sales
13.8% 28% 30% 32% 34% 36% 38% 40% 42% 44%30% 5.8% 3.8% 1.8% NM NM NM NM NM NM
Gross 32% 7.8% 5.8% 3.8% 1.8% NM NM NM NM NMMargin 34% 9.8% 7.8% 5.8% 3.8% 1.8% NM NM NM NM
36% 11.8% 9.8% 7.8% 5.8% 3.8% 1.8% NM NM NM38% 13.8% 11.8% 9.8% 7.8% 5.8% 3.8% 1.8% NM NM40% 15.8% 13.8% 11.8% 9.8% 7.8% 5.8% 3.8% 1.8% NM42% 17.8% 15.8% 13.8% 11.8% 9.8% 7.8% 5.8% 3.8% 1.8%44% 19.8% 17.8% 15.8% 13.8% 11.8% 9.8% 7.8% 5.8% 3.8%

Page 54 of 78
Additionally, we prepared a pro forma balance sheet outlining the additional
cash generated from closing stores and liquidating their inventory and from selling the
office building for $100 million.
(in thousands)
3/3/2007 Adjustments Pro Forma
Cash & Mkt Securities 167,178 172,000 339,178 Receivables 21,437 21,437 Inventories 360,063 (72,000) 288,063 Income Tax Receivables 34,900 34,900 Other Current Assets 50,324 50,324
Total Current Assets 633,902 100,000 733,902
Net Property & Equipment 239,548 (100,000) 139,548 Other NonCurrent 42,954 42,954
Total Assets 916,404 - 916,404
Accounts Payable 95,609 95,609 Accrued Expense 119,541 119,541 Income Taxes 3,305 3,305 Gift Cards & Other Def Revenue 66,130 66,130
Total Current Liabilities 284,585 - 284,585
Long-Term Debt 184,000 184,000 Other Long-Term Liab. 86,768 86,768
Total Long-Term Liabilities 270,768 - 270,768
Common Stock Net 100,779 100,779 Capital Surplus 130,416 130,416 Retained Earnings 339,586 339,586 Treasury Stock (209,664) (209,664)
Total Shareholder Equity 361,117 - 361,117
Total Liabilities & Net Worth 916,470 - 916,470

Page 55 of 78
Conclusion
We commend the Board of Directors for taking the first step to recovery and
hiring Alex Smith as CEO, as well as the additional action to reduce head count, divest
non‐core assets and cease payment of the dividend. We would welcome the
opportunity to assist Mr. Smith in the implementation of our restructuring plan. Pier 1
has the potential to be an exceptional retailer, and our roadmap can lead from negative
cash flow to well in excess of $100 million of cash flow per year.
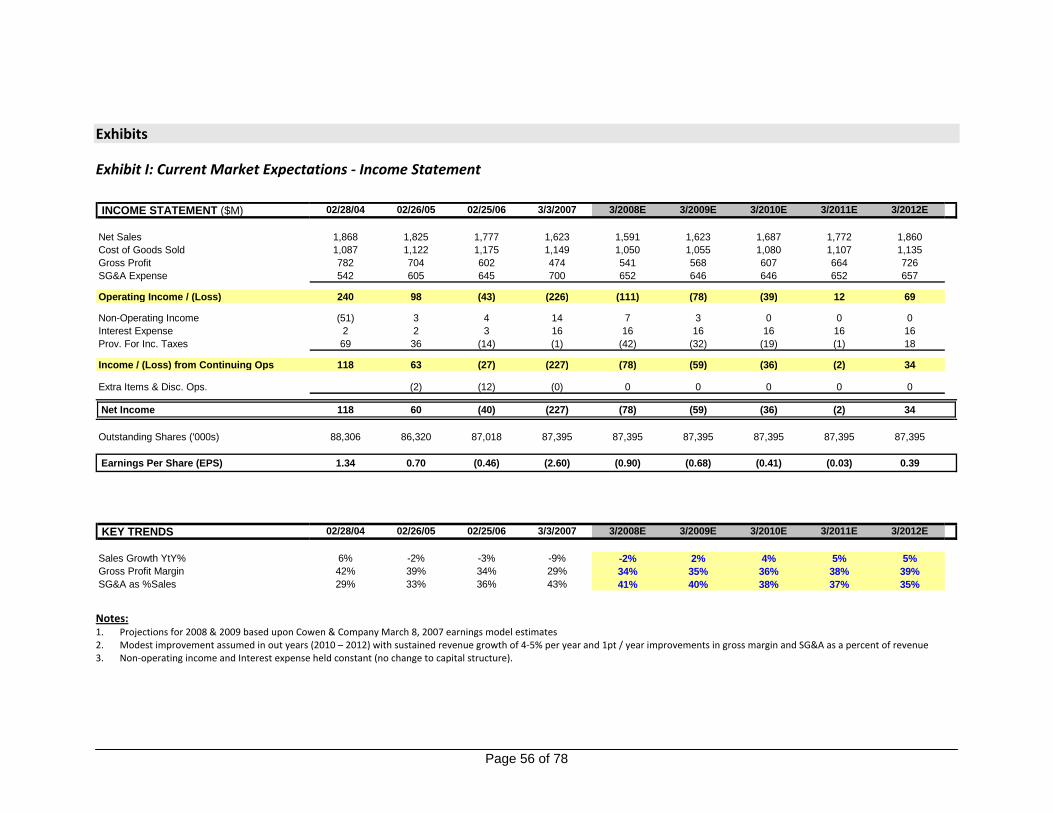
Page 56 of 78
Exhibits
Exhibit I: Current Market Expectations ‐ Income Statement
INCOME STATEMENT ($M) 02/28/04 02/26/05 02/25/06 3/3/2007 3/2008E 3/2009E 3/2010E 3/2011E 3/2012E
Net Sales 1,868 1,825 1,777 1,623 1,591 1,623 1,687 1,772 1,860 Cost of Goods Sold 1,087 1,122 1,175 1,149 1,050 1,055 1,080 1,107 1,135 Gross Profit 782 704 602 474 541 568 607 664 726 SG&A Expense 542 605 645 700 652 646 646 652 657
Operating Income / (Loss) 240 98 (43) (226) (111) (78) (39) 12 69
Non-Operating Income (51) 3 4 14 7 3 0 0 0 Interest Expense 2 2 3 16 16 16 16 16 16 Prov. For Inc. Taxes 69 36 (14) (1) (42) (32) (19) (1) 18
Income / (Loss) from Continuing Ops 118 63 (27) (227) (78) (59) (36) (2) 34
Extra Items & Disc. Ops. (2) (12) (0) 0 0 0 0 0
Net Income 118 60 (40) (227) (78) (59) (36) (2) 34
Outstanding Shares ('000s) 88,306 86,320 87,018 87,395 87,395 87,395 87,395 87,395 87,395
Earnings Per Share (EPS) 1.34 0.70 (0.46) (2.60) (0.90) (0.68) (0.41) (0.03) 0.39
KEY TRENDS 02/28/04 02/26/05 02/25/06 3/3/2007 3/2008E 3/2009E 3/2010E 3/2011E 3/2012E
Sales Growth YtY% 6% -2% -3% -9% -2% 2% 4% 5% 5%Gross Profit Margin 42% 39% 34% 29% 34% 35% 36% 38% 39%SG&A as %Sales 29% 33% 36% 43% 41% 40% 38% 37% 35% Notes: 1. Projections for 2008 & 2009 based upon Cowen & Company March 8, 2007 earnings model estimates 2. Modest improvement assumed in out years (2010 – 2012) with sustained revenue growth of 4‐5% per year and 1pt / year improvements in gross margin and SG&A as a percent of revenue 3. Non‐operating income and Interest expense held constant (no change to capital structure).

Page 57 of 78
Exhibit II: Current Market Expectations – Cash Flow & Estimated Valuation
CASH FLOW STATEMENT ($M) 02/28/04 02/26/05 02/25/06 3/3/2007 3/2008E 3/2009E 3/2010E 3/2011E 3/2012E
Net Income(Loss) 118 60 (40) (227) (78) (59) (36) (2) 34 Depreciation/Amortization 65 76 79 63 63 60 57 54 52 Net Increase/(Decrease) In Assets/Liab. (27) (10) (45) (9) (44) (26) (14) 3 24 Other Adjustments -- Net 22 (75) (58) 68
Net Operating Cash Flow 178 51 (64) (105) (58) (25) 7 55 110
Capex (87) (99) (51) (29) (35) (40) (45) (50) (50)Sale of Properties 4 1 0 Sale of Disc Operations 22 Net Proceeds from Investments (14) 89 60 38
Net Investing Cash Flow (101) (7) 10 32 (35) (40) (45) (50) (50)
Issue (Purchase) Of Equity (61) (46) 4 5 0 0 0 0 0 Net Change in Long-Term Debt (6) 165 0 0 0 0 0 Dividends, Other Distribution (27) (35) (35) (17) 0 0 0 0 0 Other (0) (16) (0)
Net Financing Cash Flow (94) (81) 118 (13) 0 0 0 0 0
Net Change in Cash (17) (36) 64 (86) (93) (65) (38) 5 60
8 9 10 11 12 8 9 10 11 12
8% 197 238 278 319 359 8% 0.15 0.61 1.08 1.54 2.00 9% 183 222 260 299 338 9% (0.01) 0.43 0.87 1.32 1.76 10% 170 207 244 281 318 10% (0.16) 0.26 0.69 1.11 1.53 11% 157 193 228 264 299 11% (0.30) 0.10 0.51 0.91 1.32 12% 146 180 213 247 281 12% (0.44) (0.05) 0.34 0.72 1.11
Terminal EBIT MultipleW
AC
C
Discounted Cash Flow - Enterprise Value Discounted Cash Flow - Value per Share
Terminal EBIT Multiple
WA
CC
Exhibit II Notes: 1. Net Income based upon prior Income Statement (Exhibit I) 2. Gradual decline in depreciation extrapolated into out years based upon 2007 actual results and slowing store expansion 3. Change in current assets / liabilities based upon projected Balance Sheet (Exhibit III) 4. Projected CAPEX was gradually increased to prior 2006 historical levels (only modest new store openings assumed 5. No additional asset sales assumed; No change to capital structure assumed (no early debt redemption assumed)

Page 58 of 78
Exhibit II (Continued): Estimated Valuation
Terminal Value Considerations – We examined several competitors and determined the average Enterprise Value to EBIT multiple to be 11.0. However, given Pier 1’s weaker relative brand we negatively skewed our range of terminal multiples resulting in the 8.0 to 12.0 range reflected in the prior (and later) exhibits.
Bed, Bath, Beyond William Sonoma Cost Plus
Ent Value ($B) 10.7 3.7 0.395EBIT ($B) 0.9 0.3 0.038
EBIT Multiple 11.7 10.9 10.5
Average 11.0 WACC Considerations – We calculated the WACC for Pier 1 to be 8.7% using the traditional CAPM model, but believed this value to be low given the considerable risk and uncertainty going forward (not reflected in historical beta) and judgmentally skewed our range of WACC values higher, resulting in the 8% - 12% range reflected in the prior (and later) exhibits.
Pier 1 ($M)Risk Free Rate 5% Debt (Book Value) 184 21%Risk Premium 7% Equity (Market Value) 678 79%Beta 0.7 Total 862
R equity 9.9% WACC 8.7%
Debt Int Rate 6.4%Tax Rate 35%
R debt 4.1%
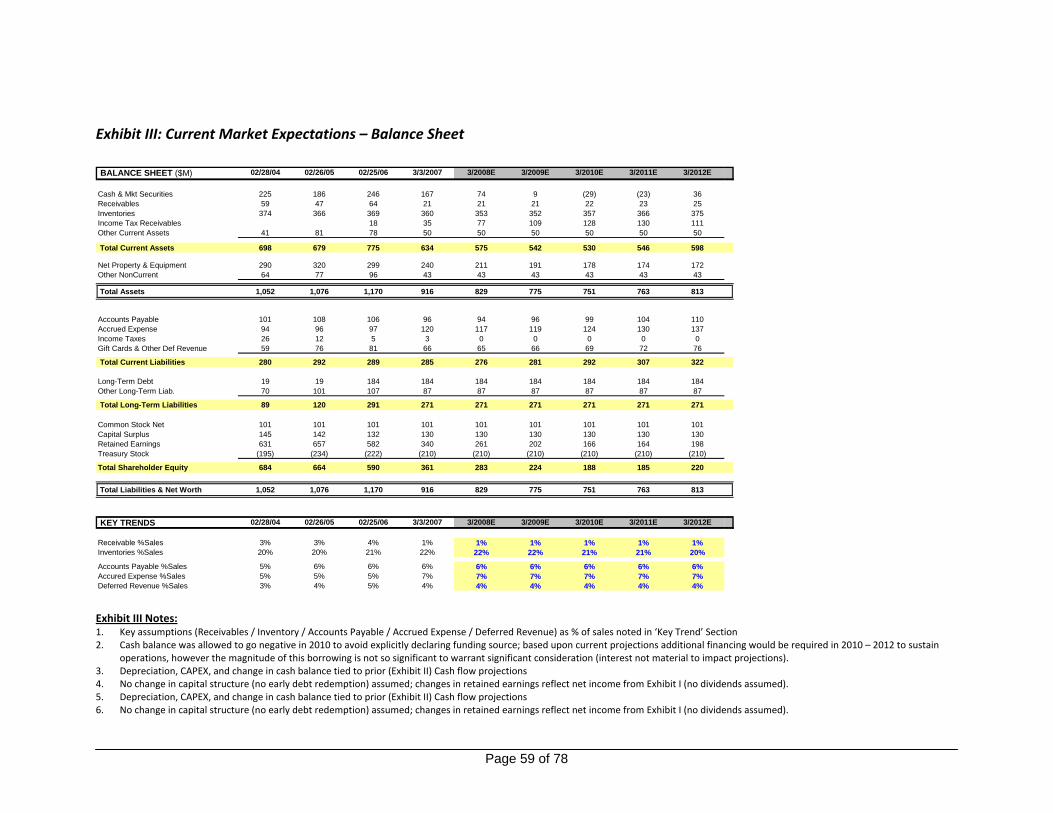
Page 59 of 78
Exhibit III: Current Market Expectations – Balance Sheet
BALANCE SHEET ($M) 02/28/04 02/26/05 02/25/06 3/3/2007 3/2008E 3/2009E 3/2010E 3/2011E 3/2012E
Cash & Mkt Securities 225 186 246 167 74 9 (29) (23) 36 Receivables 59 47 64 21 21 21 22 23 25 Inventories 374 366 369 360 353 352 357 366 375 Income Tax Receivables 18 35 77 109 128 130 111 Other Current Assets 41 81 78 50 50 50 50 50 50
Total Current Assets 698 679 775 634 575 542 530 546 598
Net Property & Equipment 290 320 299 240 211 191 178 174 172 Other NonCurrent 64 77 96 43 43 43 43 43 43
Total Assets 1,052 1,076 1,170 916 829 775 751 763 813
Accounts Payable 101 108 106 96 94 96 99 104 110 Accrued Expense 94 96 97 120 117 119 124 130 137 Income Taxes 26 12 5 3 0 0 0 0 0 Gift Cards & Other Def Revenue 59 76 81 66 65 66 69 72 76
Total Current Liabilities 280 292 289 285 276 281 292 307 322
Long-Term Debt 19 19 184 184 184 184 184 184 184 Other Long-Term Liab. 70 101 107 87 87 87 87 87 87
Total Long-Term Liabilities 89 120 291 271 271 271 271 271 271
Common Stock Net 101 101 101 101 101 101 101 101 101 Capital Surplus 145 142 132 130 130 130 130 130 130 Retained Earnings 631 657 582 340 261 202 166 164 198 Treasury Stock (195) (234) (222) (210) (210) (210) (210) (210) (210)
Total Shareholder Equity 684 664 590 361 283 224 188 185 220
Total Liabilities & Net Worth 1,052 1,076 1,170 916 829 775 751 763 813
KEY TRENDS 02/28/04 02/26/05 02/25/06 3/3/2007 3/2008E 3/2009E 3/2010E 3/2011E 3/2012E
Receivable %Sales 3% 3% 4% 1% 1% 1% 1% 1% 1%Inventories %Sales 20% 20% 21% 22% 22% 22% 21% 21% 20%
Accounts Payable %Sales 5% 6% 6% 6% 6% 6% 6% 6% 6%Accured Expense %Sales 5% 5% 5% 7% 7% 7% 7% 7% 7%Deferred Revenue %Sales 3% 4% 5% 4% 4% 4% 4% 4% 4% Exhibit III Notes: 1. Key assumptions (Receivables / Inventory / Accounts Payable / Accrued Expense / Deferred Revenue) as % of sales noted in ‘Key Trend’ Section 2. Cash balance was allowed to go negative in 2010 to avoid explicitly declaring funding source; based upon current projections additional financing would be required in 2010 – 2012 to sustain
operations, however the magnitude of this borrowing is not so significant to warrant significant consideration (interest not material to impact projections). 3. Depreciation, CAPEX, and change in cash balance tied to prior (Exhibit II) Cash flow projections 4. No change in capital structure (no early debt redemption) assumed; changes in retained earnings reflect net income from Exhibit I (no dividends assumed). 5. Depreciation, CAPEX, and change in cash balance tied to prior (Exhibit II) Cash flow projections 6. No change in capital structure (no early debt redemption) assumed; changes in retained earnings reflect net income from Exhibit I (no dividends assumed).

Page 60 of 78
Exhibit III Continued: Non‐GAAP Presentation of Key Financials – Current Market Expectations Scenario
INCOME STATEMENT ($M) 02/28/04 02/26/05 02/25/06 3/3/2007 3/2008E 3/2009E 3/2010E 3/2011E 3/2012E
Sales 1,868 1,825 1,777 1,623 1,591 1,623 1,687 1,772 1,860 Product Costs 807 818 861 851 764 792 820 851 881 Product GP% 43% 45% 48% 52% 48% 49% 49% 48% 47%SG&A 593 603 641 686 645 643 646 652 657 Other Expense / (Income) 51 (3) (4) (14) (7) (3) 0 0 0
EBITDAR 469 405 274 87 181 188 221 269 323 -EBITDAR margin 25% 22% 15% 5% 11% 12% 13% 15% 17%
Depreciation 65 76 79 63 63 60 57 54 52 Rent 215 228 235 235 222 202 202 202 202 Interest 2 2 3 16 16 16 16 16 16 Taxes 69 36 (14) (1) (42) (32) (19) (1) 18
Net Income 118 63 (27) (227) (78) (59) (36) (2) 34
BALANCE SHEET ($M) 02/28/04 02/26/05 02/25/06 3/3/2007 3/2008E 3/2009E 3/2010E 3/2011E 3/2012E
Cash & Cash Equivalents 225 186 246 167 74 9 (29) (23) 36 Inventory & Receivables 432 413 433 382 374 373 380 390 400 Tax Benefit (NOL Carryforward) 0 0 18 35 77 109 128 130 111 Other Current 41 81 78 50 50 50 50 50 50 PP&E 290 320 299 240 211 191 178 174 172 Store Leases 867 921 947 947 895 815 815 815 815 Other 64 77 96 43 43 43 43 43 43
Total Assets 1,919 1,996 2,117 1,863 1,724 1,591 1,566 1,578 1,628
Payables & Accrued Expenses 195 204 203 215 211 215 224 235 247 Income Tax 26 12 5 3 0 0 0 0 0 Deferred Income 59 76 81 66 65 66 69 72 76 Other Liabilities 70 101 107 87 87 87 87 87 87 Debt 19 19 184 184 184 184 184 184 184 Lease Obligations 867 921 947 947 895 815 815 815 815 Equity 684 664 590 361 283 224 188 185 220
Total Assets 1,919 1,996 2,117 1,863 1,724 1,591 1,566 1,578 1,628
Memo: # Stores (Year-end) 1,083 1,150 1,183 1,200 (Est) 1,150 (Est) 1,100 (Est) 1,100 (Est) 1,100 (Est) 1,100 (Est) Exhibit III Notes: 1. Income statement adjusted to reflect Earnings Before Interest Taxes Depreciation Amortization and Rental (EBITDAR) costs to better reflect actual product margins without the impact of fixed
rental expense which has been treated similar to debt service. 2. Value of lease minimum lease obligations capitalized (10% discount rate) as a debt obligation with an equal and offsetting fixed asset value (conservatism dictates that possible asset value in
excess of lease obligations not be realized).
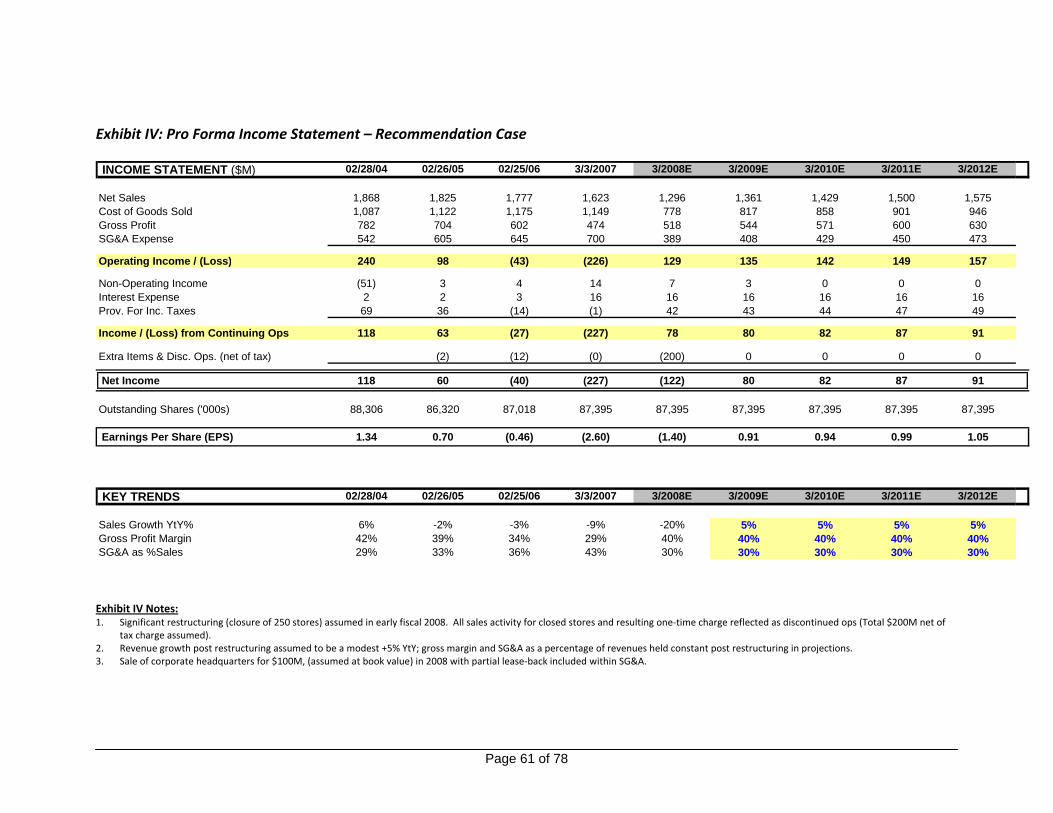
Page 61 of 78
Exhibit IV: Pro Forma Income Statement – Recommendation Case INCOME STATEMENT ($M) 02/28/04 02/26/05 02/25/06 3/3/2007 3/2008E 3/2009E 3/2010E 3/2011E 3/2012E
Net Sales 1,868 1,825 1,777 1,623 1,296 1,361 1,429 1,500 1,575 Cost of Goods Sold 1,087 1,122 1,175 1,149 778 817 858 901 946 Gross Profit 782 704 602 474 518 544 571 600 630 SG&A Expense 542 605 645 700 389 408 429 450 473
Operating Income / (Loss) 240 98 (43) (226) 129 135 142 149 157
Non-Operating Income (51) 3 4 14 7 3 0 0 0 Interest Expense 2 2 3 16 16 16 16 16 16 Prov. For Inc. Taxes 69 36 (14) (1) 42 43 44 47 49
Income / (Loss) from Continuing Ops 118 63 (27) (227) 78 80 82 87 91
Extra Items & Disc. Ops. (net of tax) (2) (12) (0) (200) 0 0 0 0
Net Income 118 60 (40) (227) (122) 80 82 87 91
Outstanding Shares ('000s) 88,306 86,320 87,018 87,395 87,395 87,395 87,395 87,395 87,395
Earnings Per Share (EPS) 1.34 0.70 (0.46) (2.60) (1.40) 0.91 0.94 0.99 1.05
KEY TRENDS 02/28/04 02/26/05 02/25/06 3/3/2007 3/2008E 3/2009E 3/2010E 3/2011E 3/2012E
Sales Growth YtY% 6% -2% -3% -9% -20% 5% 5% 5% 5%Gross Profit Margin 42% 39% 34% 29% 40% 40% 40% 40% 40%SG&A as %Sales 29% 33% 36% 43% 30% 30% 30% 30% 30% Exhibit IV Notes: 1. Significant restructuring (closure of 250 stores) assumed in early fiscal 2008. All sales activity for closed stores and resulting one‐time charge reflected as discontinued ops (Total $200M net of
tax charge assumed). 2. Revenue growth post restructuring assumed to be a modest +5% YtY; gross margin and SG&A as a percentage of revenues held constant post restructuring in projections. 3. Sale of corporate headquarters for $100M, (assumed at book value) in 2008 with partial lease‐back included within SG&A.
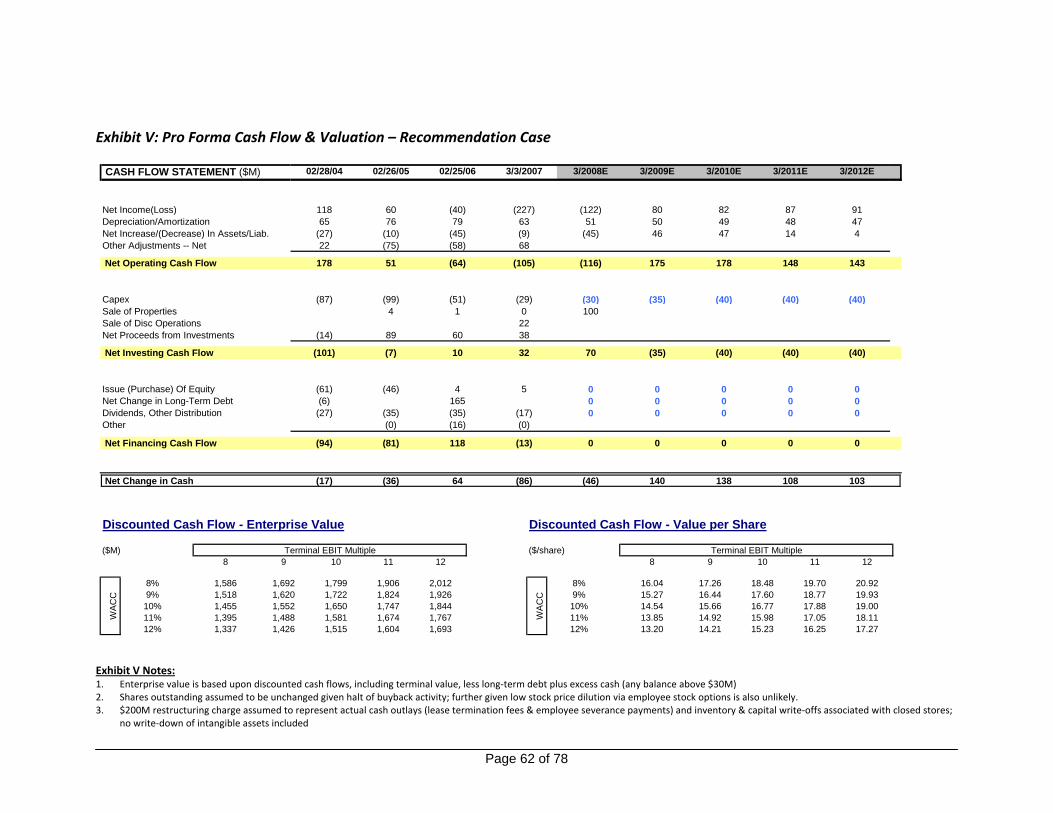
Page 62 of 78
Exhibit V: Pro Forma Cash Flow & Valuation – Recommendation Case
CASH FLOW STATEMENT ($M) 02/28/04 02/26/05 02/25/06 3/3/2007 3/2008E 3/2009E 3/2010E 3/2011E 3/2012E
Net Income(Loss) 118 60 (40) (227) (122) 80 82 87 91 Depreciation/Amortization 65 76 79 63 51 50 49 48 47 Net Increase/(Decrease) In Assets/Liab. (27) (10) (45) (9) (45) 46 47 14 4 Other Adjustments -- Net 22 (75) (58) 68
Net Operating Cash Flow 178 51 (64) (105) (116) 175 178 148 143
Capex (87) (99) (51) (29) (30) (35) (40) (40) (40)Sale of Properties 4 1 0 100 Sale of Disc Operations 22 Net Proceeds from Investments (14) 89 60 38
Net Investing Cash Flow (101) (7) 10 32 70 (35) (40) (40) (40)
Issue (Purchase) Of Equity (61) (46) 4 5 0 0 0 0 0 Net Change in Long-Term Debt (6) 165 0 0 0 0 0 Dividends, Other Distribution (27) (35) (35) (17) 0 0 0 0 0 Other (0) (16) (0)
Net Financing Cash Flow (94) (81) 118 (13) 0 0 0 0 0
Net Change in Cash (17) (36) 64 (86) (46) 140 138 108 103
8 9 10 11 12 8 9 10 11 12
8% 1,586 1,692 1,799 1,906 2,012 8% 16.04 17.26 18.48 19.70 20.92 9% 1,518 1,620 1,722 1,824 1,926 9% 15.27 16.44 17.60 18.77 19.93 10% 1,455 1,552 1,650 1,747 1,844 10% 14.54 15.66 16.77 17.88 19.00 11% 1,395 1,488 1,581 1,674 1,767 11% 13.85 14.92 15.98 17.05 18.11 12% 1,337 1,426 1,515 1,604 1,693 12% 13.20 14.21 15.23 16.25 17.27
WA
CC
($M) ($/share) Terminal EBIT MultipleW
AC
CDiscounted Cash Flow - Enterprise Value Discounted Cash Flow - Value per Share
Terminal EBIT Multiple
Exhibit V Notes: 1. Enterprise value is based upon discounted cash flows, including terminal value, less long‐term debt plus excess cash (any balance above $30M) 2. Shares outstanding assumed to be unchanged given halt of buyback activity; further given low stock price dilution via employee stock options is also unlikely. 3. $200M restructuring charge assumed to represent actual cash outlays (lease termination fees & employee severance payments) and inventory & capital write‐offs associated with closed stores;
no write‐down of intangible assets included

Page 63 of 78
Exhibit VI: Pro Forma Non‐GAAP Financials – Recommendation Case
INCOME STATEMENT ($M) 02/28/04 02/26/05 02/25/06 3/3/2007 3/2008E 3/2009E 3/2010E 3/2011E 3/2012E
Sales 1,868 1,825 1,777 1,623 1,296 1,361 1,429 1,500 1,575 Product Costs 807 818 861 851 539 579 621 665 711 Product GP% 43% 45% 48% 52% 42% 43% 43% 44% 45%SG&A 593 603 641 686 382 405 429 450 473 Other Expense / (Income) 51 (3) (4) (14) (7) (3) 0 0 0
EBITDAR 469 405 274 87 375 376 379 385 392 -EBITDAR margin 25% 22% 15% 5% 29% 28% 27% 26% 25%
Depreciation 65 76 79 63 51 50 49 48 47 Rent 215 228 235 235 188 188 188 188 188 Interest 2 2 3 16 16 16 16 16 16 Taxes 69 36 (14) (1) 42 43 44 47 49
Net Income 118 63 (27) (227) 78 80 82 87 91
BALANCE SHEET ($M) 02/28/04 02/26/05 02/25/06 3/3/2007 3/2008E 3/2009E 3/2010E 3/2011E 3/2012E
Cash & Cash Equivalents 225 186 246 167 121 261 399 508 611 Inventory & Receivables 432 413 433 382 305 313 322 330 339 Tax Benefit (NOL Carryforward) 0 0 18 35 97 54 10 0 0 Other Current 41 81 78 50 50 50 50 50 50 PP&E 290 320 299 240 119 104 95 87 80 Store Leases 867 921 947 947 757 757 757 757 757 Other 64 77 96 43 43 43 43 43 43
Total Assets 1,919 1,996 2,117 1,863 1,491 1,581 1,675 1,774 1,879
Payables & Accrued Expenses 195 204 203 215 172 180 189 199 209 Income Tax 26 12 5 3 0 0 0 0 0 Deferred Income 59 76 81 66 53 55 58 61 64 Other Liabilities 70 101 107 87 87 87 87 87 87 Debt 19 19 184 184 184 184 184 184 184 Lease Obligations 867 921 947 947 757 757 757 757 757 Equity 684 664 590 361 239 318 400 487 578
Total Assets 1,919 1,996 2,117 1,863 1,491 1,582 1,675 1,774 1,879
Memo: # Stores (Year-end) 1,083 1,150 1,183 1,243 993 993 993 993 993
Exhibit VI Notes: 1. Income statement adjusted to reflect Earnings before Interest Taxes Depreciation Amortization and Rental (EBITDAR) costs to better reflect actual product margins without the impact of fixed
rental expense which has been treated similar to debt service. 2. Value of lease minimum lease obligations capitalized (10% discount rate) as a debt obligation with an equal and offsetting fixed asset value. 3. Net operating loss (NOL) carry‐forwards utilized in 2009 and 2010 and result in positive adjustments to cash flow.

Page 64 of 78
Exhibit VII: Primal Branding
From Primal Branding by Patrick Hanlon, pp. 9‐10:
All belief systems have seven pieces of code that work together to make them believable.
The more pieces, the more believable the belief system becomes. When products and services
have all seven pieces of code (the creation story; the creed; the icons; the rituals; the pagans, or
nonbelievers; the sacred words; and the leader), they become a meaningful part of our culture.
They become the Googles and Nikes of the world. When causes have all seven pieces of code,
they become the civil rights movement, the women’s movement, or the global fight against AIDS.
When civic communities have all seven pieces of code, they become sizzling communities like
New York City and Las Vegas. When personalities have the seven pieces of code in place, they
become Oprah, Andy Warhol, or U2.
Certainly there have been remarkable products in the past, worthy causes and persons
with extraordinary talent. But for some reason they fell short in the public imagination. When
you consider that nine out of ten new products never survive in the marketplace, you have to
consider that something else is in play beyond terrific innovation, distribution, and price point.
This is no longer inexplicable. They simply did not have the pieces of primal code. Having the
primal code is why brands seize the public imagination while their competitors are relegated to
second place commodities and transactions.
…the seven pieces of primal code…together create a sustainable belief system that
provides the unarticulated, intangible emotional glue that attracts people and helps them feel
that they belong. This sense of belonging manifests itself in evangelist tribes, cults, members of
political parties, product geeks and enthusiasts.
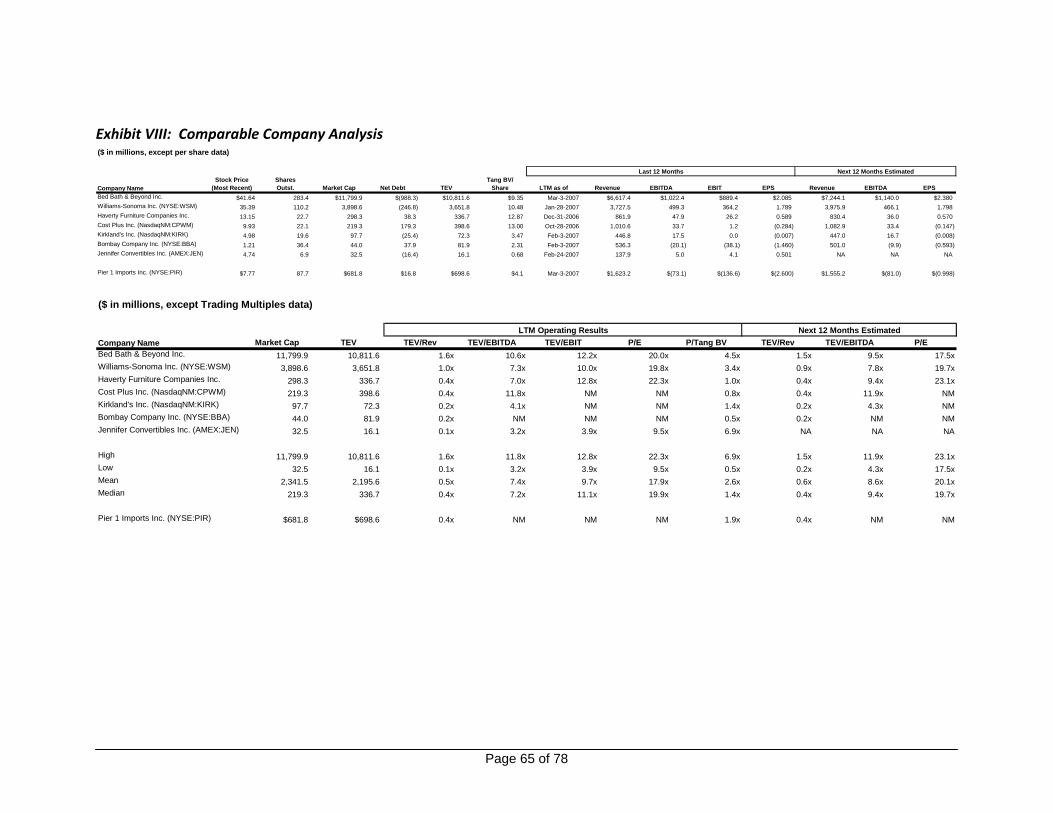
Page 65 of 78
Exhibit VIII: Comparable Company Analysis ($ in millions, except per share data)
Company NameStock Price
(Most Recent)SharesOutst. Market Cap Net Debt TEV
Tang BV/Share LTM as of Revenue EBITDA EBIT EPS Revenue EBITDA EPS
Bed Bath & Beyond Inc. $41.64 283.4 $11,799.9 $(988.3) $10,811.6 $9.35 Mar-3-2007 $6,617.4 $1,022.4 $889.4 $2.085 $7,244.1 $1,140.0 $2.380Williams-Sonoma Inc. (NYSE:WSM) 35.39 110.2 3,898.6 (246.8) 3,651.8 10.48 Jan-28-2007 3,727.5 499.3 364.2 1.789 3,975.9 466.1 1.798Haverty Furniture Companies Inc. 13.15 22.7 298.3 38.3 336.7 12.87 Dec-31-2006 861.9 47.9 26.2 0.589 830.4 36.0 0.570Cost Plus Inc. (NasdaqNM:CPWM) 9.93 22.1 219.3 179.3 398.6 13.00 Oct-28-2006 1,010.6 33.7 1.2 (0.284) 1,082.9 33.4 (0.147)Kirkland's Inc. (NasdaqNM:KIRK) 4.98 19.6 97.7 (25.4) 72.3 3.47 Feb-3-2007 446.8 17.5 0.0 (0.007) 447.0 16.7 (0.008)Bombay Company Inc. (NYSE:BBA) 1.21 36.4 44.0 37.9 81.9 2.31 Feb-3-2007 536.3 (20.1) (38.1) (1.460) 501.0 (9.9) (0.593)Jennifer Convertibles Inc. (AMEX:JEN) 4.74 6.9 32.5 (16.4) 16.1 0.68 Feb-24-2007 137.9 5.0 4.1 0.501 NA NA NA
Pier 1 Imports Inc. (NYSE:PIR) $7.77 87.7 $681.8 $16.8 $698.6 $4.1 Mar-3-2007 $1,623.2 $(73.1) $(136.6) $(2.600) $1,555.2 $(81.0) $(0.998)
Last 12 Months Next 12 Months Estimated
($ in millions, except Trading Multiples data)
Company Name Market Cap TEV TEV/Rev TEV/EBITDA TEV/EBIT P/E P/Tang BV TEV/Rev TEV/EBITDA P/EBed Bath & Beyond Inc. 11,799.9 10,811.6 1.6x 10.6x 12.2x 20.0x 4.5x 1.5x 9.5x 17.5xWilliams-Sonoma Inc. (NYSE:WSM) 3,898.6 3,651.8 1.0x 7.3x 10.0x 19.8x 3.4x 0.9x 7.8x 19.7xHaverty Furniture Companies Inc. 298.3 336.7 0.4x 7.0x 12.8x 22.3x 1.0x 0.4x 9.4x 23.1xCost Plus Inc. (NasdaqNM:CPWM) 219.3 398.6 0.4x 11.8x NM NM 0.8x 0.4x 11.9x NMKirkland's Inc. (NasdaqNM:KIRK) 97.7 72.3 0.2x 4.1x NM NM 1.4x 0.2x 4.3x NMBombay Company Inc. (NYSE:BBA) 44.0 81.9 0.2x NM NM NM 0.5x 0.2x NM NMJennifer Convertibles Inc. (AMEX:JEN) 32.5 16.1 0.1x 3.2x 3.9x 9.5x 6.9x NA NA NA
High 11,799.9 10,811.6 1.6x 11.8x 12.8x 22.3x 6.9x 1.5x 11.9x 23.1xLow 32.5 16.1 0.1x 3.2x 3.9x 9.5x 0.5x 0.2x 4.3x 17.5xMean 2,341.5 2,195.6 0.5x 7.4x 9.7x 17.9x 2.6x 0.6x 8.6x 20.1xMedian 219.3 336.7 0.4x 7.2x 11.1x 19.9x 1.4x 0.4x 9.4x 19.7x
Pier 1 Imports Inc. (NYSE:PIR) $681.8 $698.6 0.4x NM NM NM 1.9x 0.4x NM NM
LTM Operating Results Next 12 Months Estimated

Page 66 of 78
Company Name Gross EBITDA EBIT Net Income Revenue EBITDA EBIT Net IncomeDebt/
CapitalLong TermGrowth Est.
Bed Bath & Beyond Inc. 42.8 15.4 13.4 9.0 13.9 0.6 (1.8) 3.7 NA 15.6 Williams-Sonoma Inc. (NYSE:WSM) 40.0 13.4 9.8 5.6 5.3 3.4 1.2 (2.8) 2.4 15.1 Haverty Furniture Companies Inc. 49.7 5.6 3.0 1.9 3.7 9.2 14.8 6.3 14.7 10.7 Cost Plus Inc. (NasdaqNM:CPWM) 30.9 3.3 0.1 (0.6) 6.8 (50.7) (97.0) NM 38.6 13.8 Kirkland's Inc. (NasdaqNM:KIRK) 31.4 3.9 0.0 (0.0) 7.6 6.7 (99.1) NM NA 13.8 Bombay Company Inc. (NYSE:BBA) 22.5 (3.8) (7.1) (9.8) (5.1) NM NM NM 31.8 25.0 Jennifer Convertibles Inc. (AMEX:JEN) 31.0 3.6 3.0 3.2 2.5 41.2 49.0 (17.1) 2.0 NA
High 49.7 15.4 13.4 9.0 13.9 41.2 49.0 6.3 38.6 25.0 Low 22.5 (3.8) (7.1) (9.8) (5.1) (50.7) (99.1) (17.1) 2.0 10.7 Mean 35.5 5.9 3.2 1.3 5.0 1.7 (22.1) (2.5) 17.9 15.7 Median 31.4 3.9 3.0 1.9 5.3 5.0 (0.3) 0.5 14.7 14.5
Pier 1 Imports Inc. (NYSE:PIR) 29.2 (4.5) (8.4) (14.0) (8.6) NM NM NM 33.8 11.6
LTM Margin (%) One Year Growth (%)
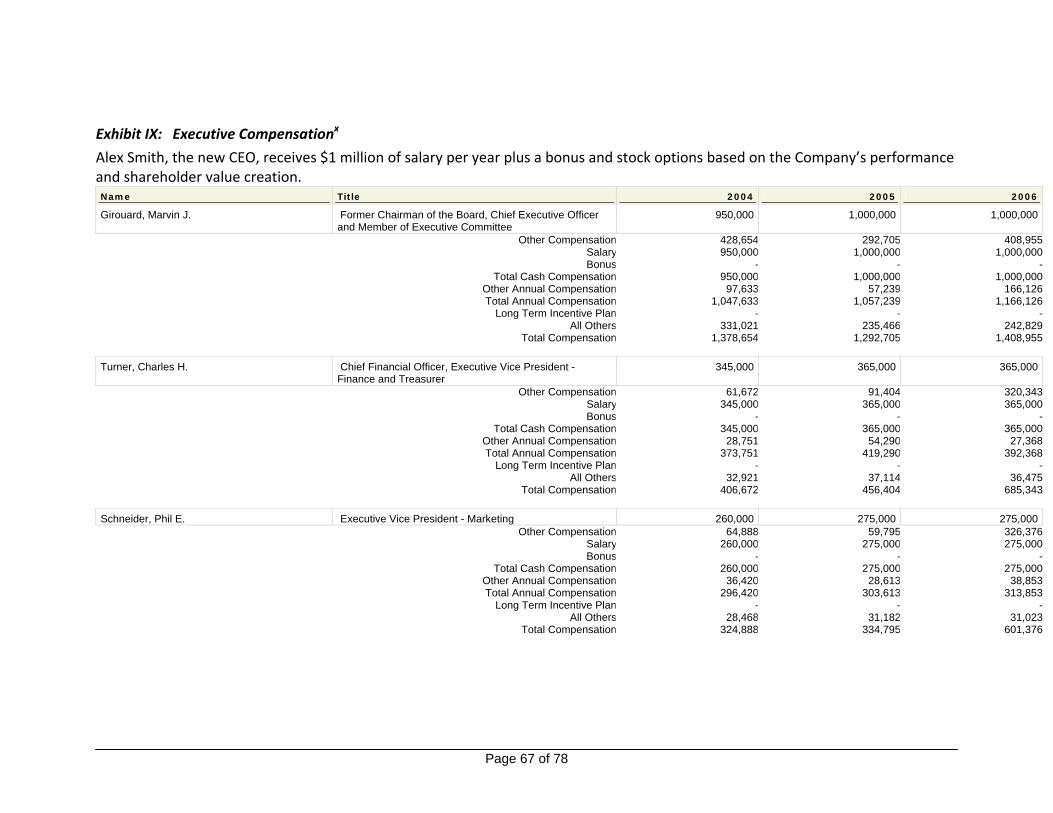
Page 67 of 78
Exhibit IX: Executive Compensationx
Alex Smith, the new CEO, receives $1 million of salary per year plus a bonus and stock options based on the Company’s performance and shareholder value creation. Name Title 2004 2005 2006
Girouard, Marvin J. Former Chairman of the Board, Chief Executive Officer and Member of Executive Committee
950,000 1,000,000 1,000,000
Other Compensation 428,654 292,705 408,955Salary 950,000 1,000,000 1,000,000Bonus - - -
Total Cash Compensation 950,000 1,000,000 1,000,000Other Annual Compensation 97,633 57,239 166,126Total Annual Compensation 1,047,633 1,057,239 1,166,126
Long Term Incentive Plan - - -All Others 331,021 235,466 242,829
Total Compensation 1,378,654 1,292,705 1,408,955 Turner, Charles H. Chief Financial Officer, Executive Vice President -
Finance and Treasurer 345,000 365,000 365,000
Other Compensation 61,672 91,404 320,343Salary 345,000 365,000 365,000Bonus - - -
Total Cash Compensation 345,000 365,000 365,000Other Annual Compensation 28,751 54,290 27,368Total Annual Compensation 373,751 419,290 392,368
Long Term Incentive Plan - - -All Others 32,921 37,114 36,475
Total Compensation 406,672 456,404 685,343 Schneider, Phil E. Executive Vice President - Marketing 260,000 275,000 275,000
Other Compensation 64,888 59,795 326,376Salary 260,000 275,000 275,000Bonus - - -
Total Cash Compensation 260,000 275,000 275,000Other Annual Compensation 36,420 28,613 38,853Total Annual Compensation 296,420 303,613 313,853
Long Term Incentive Plan - - -All Others 28,468 31,182 31,023
Total Compensation 324,888 334,795 601,376
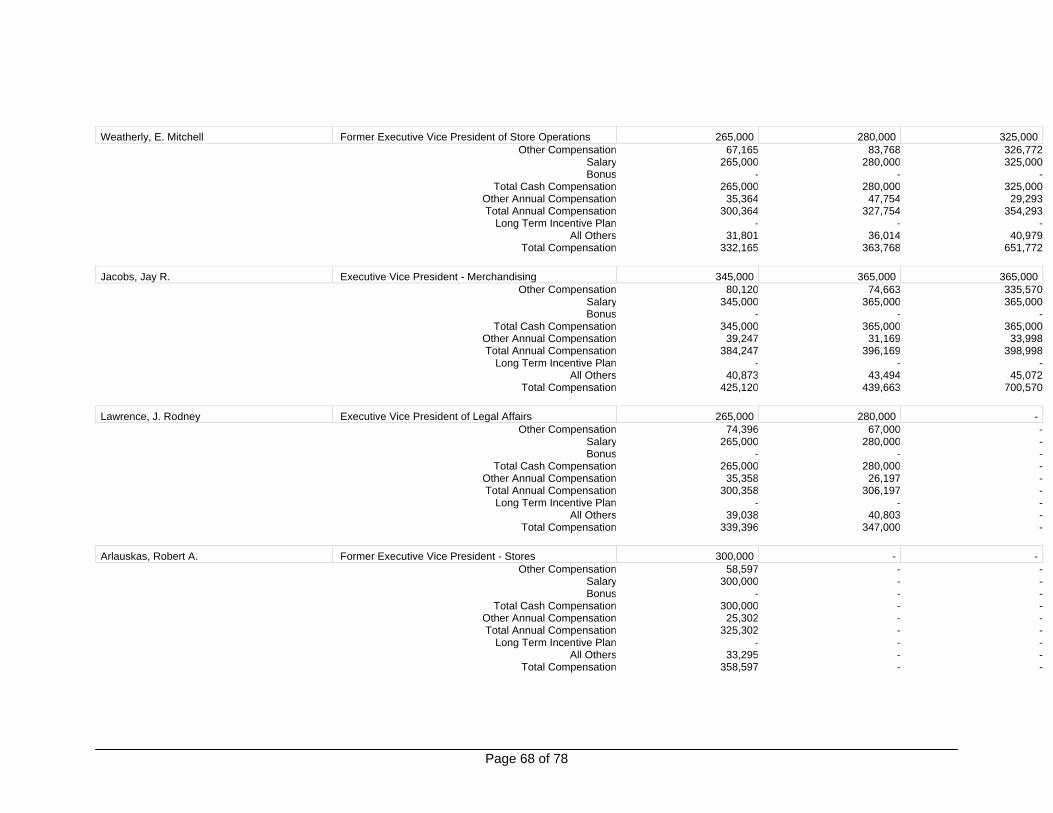
Page 68 of 78
Weatherly, E. Mitchell Former Executive Vice President of Store Operations 265,000 280,000 325,000
Other Compensation 67,165 83,768 326,772Salary 265,000 280,000 325,000Bonus - - -
Total Cash Compensation 265,000 280,000 325,000Other Annual Compensation 35,364 47,754 29,293Total Annual Compensation 300,364 327,754 354,293
Long Term Incentive Plan - - -All Others 31,801 36,014 40,979
Total Compensation 332,165 363,768 651,772 Jacobs, Jay R. Executive Vice President - Merchandising 345,000 365,000 365,000
Other Compensation 80,120 74,663 335,570Salary 345,000 365,000 365,000Bonus - - -
Total Cash Compensation 345,000 365,000 365,000Other Annual Compensation 39,247 31,169 33,998Total Annual Compensation 384,247 396,169 398,998
Long Term Incentive Plan - - -All Others 40,873 43,494 45,072
Total Compensation 425,120 439,663 700,570 Lawrence, J. Rodney Executive Vice President of Legal Affairs 265,000 280,000 -
Other Compensation 74,396 67,000 -Salary 265,000 280,000 -Bonus - - -
Total Cash Compensation 265,000 280,000 -Other Annual Compensation 35,358 26,197 -Total Annual Compensation 300,358 306,197 -
Long Term Incentive Plan - - -All Others 39,038 40,803 -
Total Compensation 339,396 347,000 - Arlauskas, Robert A. Former Executive Vice President - Stores 300,000 - -
Other Compensation 58,597 - -Salary 300,000 - -Bonus - - -
Total Cash Compensation 300,000 - -Other Annual Compensation 25,302 - -Total Annual Compensation 325,302 - -
Long Term Incentive Plan - - -All Others 33,295 - -
Total Compensation 358,597 - -
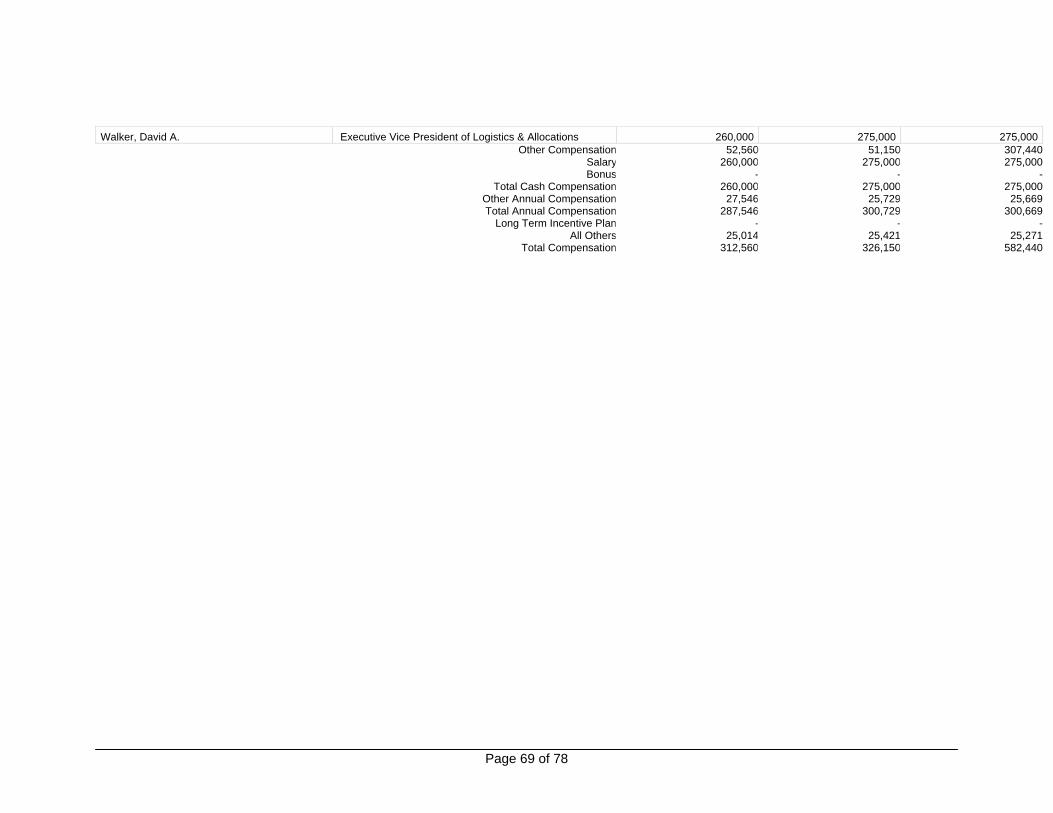
Page 69 of 78
Walker, David A. Executive Vice President of Logistics & Allocations 260,000 275,000 275,000
Other Compensation 52,560 51,150 307,440Salary 260,000 275,000 275,000Bonus - - -
Total Cash Compensation 260,000 275,000 275,000Other Annual Compensation 27,546 25,729 25,669Total Annual Compensation 287,546 300,729 300,669
Long Term Incentive Plan - - -All Others 25,014 25,421 25,271
Total Compensation 312,560 326,150 582,440

Page 70 of 78
Exhibit X: Sample Products
Artificial Lemon A lemon so lifelike, even we had to look twice. But while it looks fresh-picked, this fab faux is actually handcrafted of clay and Styrofoam, with tiny glass beads just beneath the surface to create its amazingly realistic texture.

Page 71 of 78
Balinese Entertainment Center Hand-carved meranti wood panels and hand-painted detailing reflect exquisite artisanship. With adjustable shelves, wood pole, and generous interior dimensions, there is ample room for clothing or a large TV. A Pier 1 exclusive.

Page 72 of 78
Canyon Stripe Dinnerware The Painted Desert, re-imagined as a modern dinnerware collection, and created with bands of hand-applied color, layers of luminous glaze, and novel square shapes. Dishwasher safe.
Crazy Weave Placemats The art of table-setting can be fun and free-style with these Abstract-style placemats. To create the novel effect of light and line, we’ve woven natural rattan over a metal frame. The unexpected touch of luxury: a subtle, shimmering gold wash finish. Simply wipe with a dry cloth to keep clean. A Pier 1 exclusive.

Page 73 of 78

Page 74 of 78

Page 75 of 78
Shoe Jewelry Boxes Add a splash of color and organize at the same time with our Funky Shoe Jewelry Boxes made of resin.

Page 76 of 78

Page 77 of 78
Exhibit XI: Store Images

Page 78 of 78
Exhibit XII: Bibliography and End Notes
Capital IQ Pier 1 10K and 10Q Filings 1999 ‐ 2006 Pier 1 Schedule 13D April 3, 2007 Primal Branding by Patrick Hanlon Cowen & Company, Piper Jaffray and Morgan Keegan equity research reports i Business and Company Resource Center; Thompson / Gale; 2007 ii SIC Code 512 Encyclopedia of American Industries. Online Edition. Thomson Gale, 2007 iii "Miscellaneous Home Furnishings Stores." Encyclopedia of American Industries. Online Edition. Thomson Gale, 2007.(SICs: 5719) iv Pier 1 2006 Annual Report v More information on Primal Branding can be found in the appendix. The foundation of this section is based on Primal Branding by Patrick Hanlon. vi Source: Capital IQ. vii Capital IQ. viii Comparable data from Capital IQ. ix Buxton and Geoview are two modeling and mapping services to identify strategically optimized retail locations. x Capital IQ