
ITRC IDSS 122215ibtppt.ppt - CLU-IN · managers i d l t f it td it dil t t Thi hihliht fi i t tf t...
83
Sites contaminated by chlorinated solvents present a daunting environmental challenge, especially at sites with dense nonaqueous phase liquid (DNAPL) still present Restoring sites contaminated by chlorinated solvents to typical nonaqueous phase liquid (DNAPL) still present. Restoring sites contaminated by chlorinated solvents to typical regulatory criteria (low parts-per-billion concentrations) within a generation (~20 years) has proven exceptionally difficult, although there have been successes. Site managers must recognize that complete restoration of many of these sites will require prolonged treatment and involve several remediation technologies. To make as much progress as possible requires a thorough understanding of the site, clear descriptions of achievable objectives, and use of more than one remedial technology. Making efficient progress will require an adaptive management approach, and may also require transitioning from one remedy to another as the optimum range of a technique is surpassed. Targeted monitoring should be used and re-evaluation should be done periodically. This ITRC Integrated DNAPL Site Strategy (IDSS-1, 2011) technical and regulatory guidance document will assist site i d l t f it td it di l t t Thi hi hli ht fi i t tf t f managers in development of an integrated site remedial strategy. This course highlights five important features of an IDSS including: 1. A conceptual site model (CSM) that is based on reliable characterization and an understanding of the subsurface conditions that control contaminant transport, reactivity, and distribution 2. Remedial objectives and performance metrics that are clear, concise, and measureable 3. Treatment technologies applied to optimize performance and take advantage of potential synergistic effects 4. Monitoring based on interim and final cleanup objectives, the selected treatment technology and approach, and remedial performance goals 5. Reevaluating the strategy repeatedly and even modifying the approach when objectives are not being met or when alternative methods offer similar or better outcomes at lower cost This IDSS guidance and training is intended for regulators, remedial project managers, and remediation engineers responsible for sites contaminated by chlorinated solvents. Because the subject matter is complex, this guidance assumes a functional understanding of the field and is targeted towards experienced users; however, novices will benefit through descriptions and references of the latest evolution of site characterization challenges; realistic planning of site restoration; evolving treatment techniques; and evaluating, monitoring and interpreting mass transport in the subsurface aqueous and vapor phases. While the primary focus of the document is on DNAPL sites, other types of contaminated sites (e.g. petroleum, mixed contaminants, etc.) can use the same fundamental process described in this guidance. ITRC (Interstate Technology and Regulatory Council) www.itrcweb.org Training Co-Sponsored by: US EPA Technology Innovation and Field Services Division (TIFSD) (www.clu-in.org) ITRC Training Program: [email protected]; Phone: 402-201-2419
Transcript of ITRC IDSS 122215ibtppt.ppt - CLU-IN · managers i d l t f it td it dil t t Thi hihliht fi i t tf t...
Sites contaminated by chlorinated solvents present a daunting environmental challenge, especially at sites with dense nonaqueous phase liquid (DNAPL) still present Restoring sites contaminated by chlorinated solvents to typicalnonaqueous phase liquid (DNAPL) still present. Restoring sites contaminated by chlorinated solvents to typical regulatory criteria (low parts-per-billion concentrations) within a generation (~20 years) has proven exceptionally difficult, although there have been successes. Site managers must recognize that complete restoration of many of these sites will require prolonged treatment and involve several remediation technologies. To make as much progress as possible requires a thorough understanding of the site, clear descriptions of achievable objectives, and use of more than one remedial technology. Making efficient progress will require an adaptive management approach, and may also require transitioning from one remedy to another as the optimum range of a technique is surpassed. Targeted monitoring should be used and re-evaluation should be done periodically.
This ITRC Integrated DNAPL Site Strategy (IDSS-1, 2011) technical and regulatory guidance document will assist site i d l t f i t t d it di l t t Thi hi hli ht fi i t t f t fmanagers in development of an integrated site remedial strategy. This course highlights five important features of an
IDSS including:1. A conceptual site model (CSM) that is based on reliable characterization and an understanding of the subsurface conditions that control contaminant transport, reactivity, and distribution2. Remedial objectives and performance metrics that are clear, concise, and measureable3. Treatment technologies applied to optimize performance and take advantage of potential synergistic effects4. Monitoring based on interim and final cleanup objectives, the selected treatment technology and approach, and remedial performance goals5. Reevaluating the strategy repeatedly and even modifying the approach when objectives are not being met or when alternative methods offer similar or better outcomes at lower cost
This IDSS guidance and training is intended for regulators, remedial project managers, and remediation engineers responsible for sites contaminated by chlorinated solvents. Because the subject matter is complex, this guidance assumes a functional understanding of the field and is targeted towards experienced users; however, novices will benefit through descriptions and references of the latest evolution of site characterization challenges; realistic planning of site restoration; evolving treatment techniques; and evaluating, monitoring and interpreting mass transport in the subsurface aqueous and vapor phases. While the primary focus of the document is on DNAPL sites, other types of contaminated sites (e.g. petroleum, mixed contaminants, etc.) can use the same fundamental process described in this guidance.
ITRC (Interstate Technology and Regulatory Council) www.itrcweb.org
Training Co-Sponsored by: US EPA Technology Innovation and Field Services Division (TIFSD) (www.clu-in.org)
ITRC Training Program: [email protected]; Phone: 402-201-2419
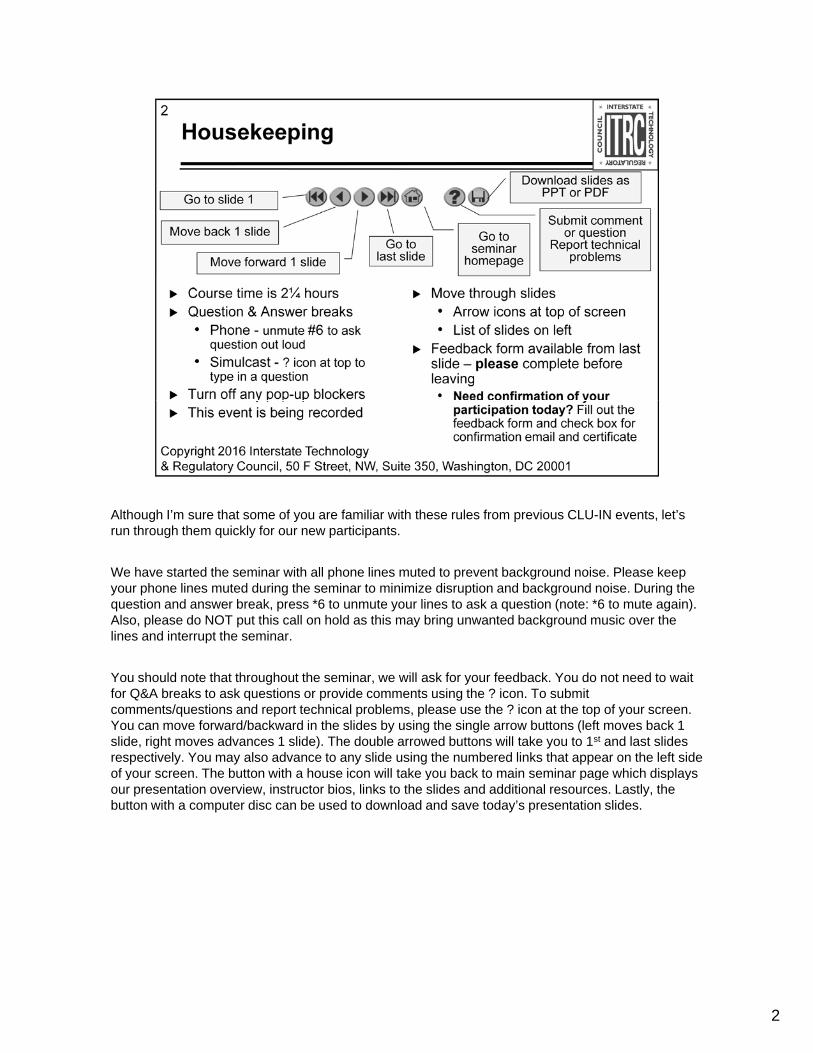
Although I’m sure that some of you are familiar with these rules from previous CLU-IN events, let’s th h th i kl f ti i trun through them quickly for our new participants.
We have started the seminar with all phone lines muted to prevent background noise. Please keep your phone lines muted during the seminar to minimize disruption and background noise. During the question and answer break, press *6 to unmute your lines to ask a question (note: *6 to mute again). Also, please do NOT put this call on hold as this may bring unwanted background music over the lines and interrupt the seminar.
You should note that throughout the seminar, we will ask for your feedback. You do not need to wait for Q&A breaks to ask questions or provide comments using the ? icon. To submit comments/questions and report technical problems, please use the ? icon at the top of your screen. You can move forward/backward in the slides by using the single arrow buttons (left moves back 1 slide, right moves advances 1 slide). The double arrowed buttons will take you to 1st and last slides respectively. You may also advance to any slide using the numbered links that appear on the left side of your screen. The button with a house icon will take you back to main seminar page which displaysof your screen. The button with a house icon will take you back to main seminar page which displays our presentation overview, instructor bios, links to the slides and additional resources. Lastly, the button with a computer disc can be used to download and save today’s presentation slides.
2
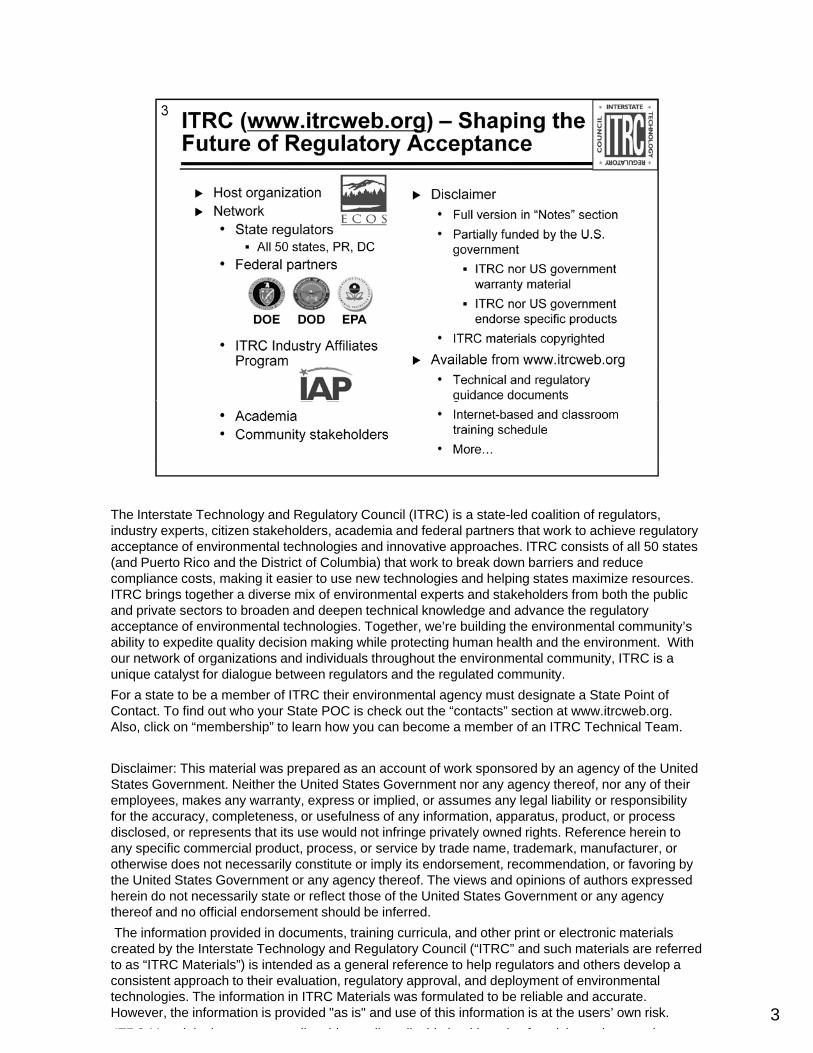
The Interstate Technology and Regulatory Council (ITRC) is a state-led coalition of regulators, i d t t iti t k h ld d i d f d l t th t k t hi l tindustry experts, citizen stakeholders, academia and federal partners that work to achieve regulatory acceptance of environmental technologies and innovative approaches. ITRC consists of all 50 states (and Puerto Rico and the District of Columbia) that work to break down barriers and reduce compliance costs, making it easier to use new technologies and helping states maximize resources. ITRC brings together a diverse mix of environmental experts and stakeholders from both the public and private sectors to broaden and deepen technical knowledge and advance the regulatory acceptance of environmental technologies. Together, we’re building the environmental community’s ability to expedite quality decision making while protecting human health and the environment. With our network of organizations and individuals throughout the environmental community, ITRC is a unique catalyst for dialogue between regulators and the regulated community.
For a state to be a member of ITRC their environmental agency must designate a State Point of Contact. To find out who your State POC is check out the “contacts” section at www.itrcweb.org. Also, click on “membership” to learn how you can become a member of an ITRC Technical Team.
Disclaimer: This material was prepared as an account of work sponsored by an agency of the United States Government. Neither the United States Government nor any agency thereof, nor any of their employees, makes any warranty, express or implied, or assumes any legal liability or responsibility for the accuracy, completeness, or usefulness of any information, apparatus, product, or process disclosed, or represents that its use would not infringe privately owned rights. Reference herein to any specific commercial product, process, or service by trade name, trademark, manufacturer, or otherwise does not necessarily constitute or imply its endorsement, recommendation, or favoring by the United States Government or any agency thereof. The views and opinions of authors expressed herein do not necessarily state or reflect those of the United States Government or any agency
3
thereof and no official endorsement should be inferred.
The information provided in documents, training curricula, and other print or electronic materials created by the Interstate Technology and Regulatory Council (“ITRC” and such materials are referred to as “ITRC Materials”) is intended as a general reference to help regulators and others develop a consistent approach to their evaluation, regulatory approval, and deployment of environmental technologies. The information in ITRC Materials was formulated to be reliable and accurate. However, the information is provided "as is" and use of this information is at the users’ own risk.
ITRC M t i l d t il dd ll li bl h lth d f t i k d ti
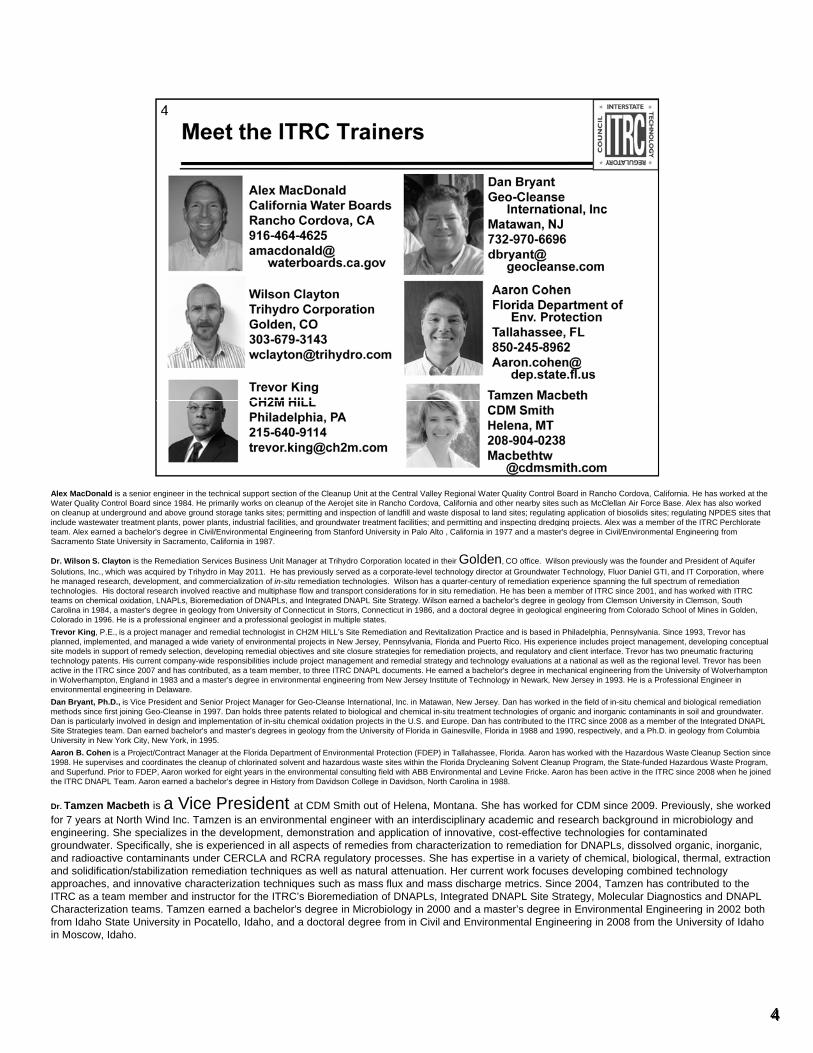
Alex MacDonald is a senior engineer in the technical support section of the Cleanup Unit at the Central Valley Regional Water Quality Control Board in Rancho Cordova, California. He has worked at the Water Quality Control Board since 1984. He primarily works on cleanup of the Aerojet site in Rancho Cordova, California and other nearby sites such as McClellan Air Force Base. Alex has also worked on cleanup at underground and above ground storage tanks sites; permitting and inspection of landfill and waste disposal to land sites; regulating application of biosolids sites; regulating NPDES sites that include wastewater treatment plants, power plants, industrial facilities, and groundwater treatment facilities; and permitting and inspecting dredging projects. Alex was a member of the ITRC Perchlorate p p p g p g p g g g p jteam. Alex earned a bachelor's degree in Civil/Environmental Engineering from Stanford University in Palo Alto , California in 1977 and a master's degree in Civil/Environmental Engineering from Sacramento State University in Sacramento, California in 1987.
Dr. Wilson S. Clayton is the Remediation Services Business Unit Manager at Trihydro Corporation located in their Golden, CO office. Wilson previously was the founder and President of Aquifer Solutions, Inc., which was acquired by Trihydro in May 2011. He has previously served as a corporate-level technology director at Groundwater Technology, Fluor Daniel GTI, and IT Corporation, where he managed research, development, and commercialization of in-situ remediation technologies. Wilson has a quarter-century of remediation experience spanning the full spectrum of remediation technologies. His doctoral research involved reactive and multiphase flow and transport considerations for in situ remediation. He has been a member of ITRC since 2001, and has worked with ITRC teams on chemical oxidation, LNAPLs, Bioremediation of DNAPLs, and Integrated DNAPL Site Strategy. Wilson earned a bachelor's degree in geology from Clemson University in Clemson, South Carolina in 1984, a master's degree in geology from University of Connecticut in Storrs, Connecticut in 1986, and a doctoral degree in geological engineering from Colorado School of Mines in Golden, Colorado in 1996. He is a professional engineer and a professional geologist in multiple states.
Trevor King, P.E., is a project manager and remedial technologist in CH2M HILL’s Site Remediation and Revitalization Practice and is based in Philadelphia, Pennsylvania. Since 1993, Trevor has planned, implemented, and managed a wide variety of environmental projects in New Jersey, Pennsylvania, Florida and Puerto Rico. His experience includes project management, developing conceptual site models in support of remedy selection developing remedial objectives and site closure strategies for remediation projects and regulatory and client interface Trevor has two pneumatic fracturingsite models in support of remedy selection, developing remedial objectives and site closure strategies for remediation projects, and regulatory and client interface. Trevor has two pneumatic fracturing technology patents. His current company-wide responsibilities include project management and remedial strategy and technology evaluations at a national as well as the regional level. Trevor has been active in the ITRC since 2007 and has contributed, as a team member, to three ITRC DNAPL documents. He earned a bachelor's degree in mechanical engineering from the University of Wolverhamptonin Wolverhampton, England in 1983 and a master’s degree in environmental engineering from New Jersey Institute of Technology in Newark, New Jersey in 1993. He is a Professional Engineer in environmental engineering in Delaware.
Dan Bryant, Ph.D., is Vice President and Senior Project Manager for Geo-Cleanse International, Inc. in Matawan, New Jersey. Dan has worked in the field of in-situ chemical and biological remediation methods since first joining Geo-Cleanse in 1997. Dan holds three patents related to biological and chemical in-situ treatment technologies of organic and inorganic contaminants in soil and groundwater. Dan is particularly involved in design and implementation of in-situ chemical oxidation projects in the U.S. and Europe. Dan has contributed to the ITRC since 2008 as a member of the Integrated DNAPL Site Strategies team. Dan earned bachelor's and master’s degrees in geology from the University of Florida in Gainesville, Florida in 1988 and 1990, respectively, and a Ph.D. in geology from Columbia University in New York City, New York, in 1995.
Aaron B. Cohen is a Project/Contract Manager at the Florida Department of Environmental Protection (FDEP) in Tallahassee, Florida. Aaron has worked with the Hazardous Waste Cleanup Section since 1998. He supervises and coordinates the cleanup of chlorinated solvent and hazardous waste sites within the Florida Drycleaning Solvent Cleanup Program, the State-funded Hazardous Waste Program, and Superfund. Prior to FDEP, Aaron worked for eight years in the environmental consulting field with ABB Environmental and Levine Fricke. Aaron has been active in the ITRC since 2008 when he joined the ITRC DNAPL Team. Aaron earned a bachelor’s degree in History from Davidson College in Davidson, North Carolina in 1988.
Dr. Tamzen Macbeth is a Vice President at CDM Smith out of Helena, Montana. She has worked for CDM since 2009. Previously, she worked for 7 years at North Wind Inc. Tamzen is an environmental engineer with an interdisciplinary academic and research background in microbiology and engineering. She specializes in the development, demonstration and application of innovative, cost-effective technologies for contaminated groundwater. Specifically, she is experienced in all aspects of remedies from characterization to remediation for DNAPLs, dissolved organic, inorganic, and radioactive contaminants under CERCLA and RCRA regulatory processes. She has expertise in a variety of chemical, biological, thermal, extraction and solidification/stabilization remediation techniques as well as natural attenuation. Her current work focuses developing combined technology approaches, and innovative characterization techniques such as mass flux and mass discharge metrics. Since 2004, Tamzen has contributed to the ITRC as a team member and instructor for the ITRC’s Bioremediation of DNAPLs, Integrated DNAPL Site Strategy, Molecular Diagnostics and DNAPL
44
Characterization teams. Tamzen earned a bachelor's degree in Microbiology in 2000 and a master’s degree in Environmental Engineering in 2002 both from Idaho State University in Pocatello, Idaho, and a doctoral degree from in Civil and Environmental Engineering in 2008 from the University of Idaho in Moscow, Idaho.
Are you achieving your cleanup goals and/or objectives?
Is it time to think about making a change in your remedial approach?
If you are like most of us the answer is probably, “yes”
If you answered YES to the questions above, then boy do I have the guidance document for you!
No associated notes.
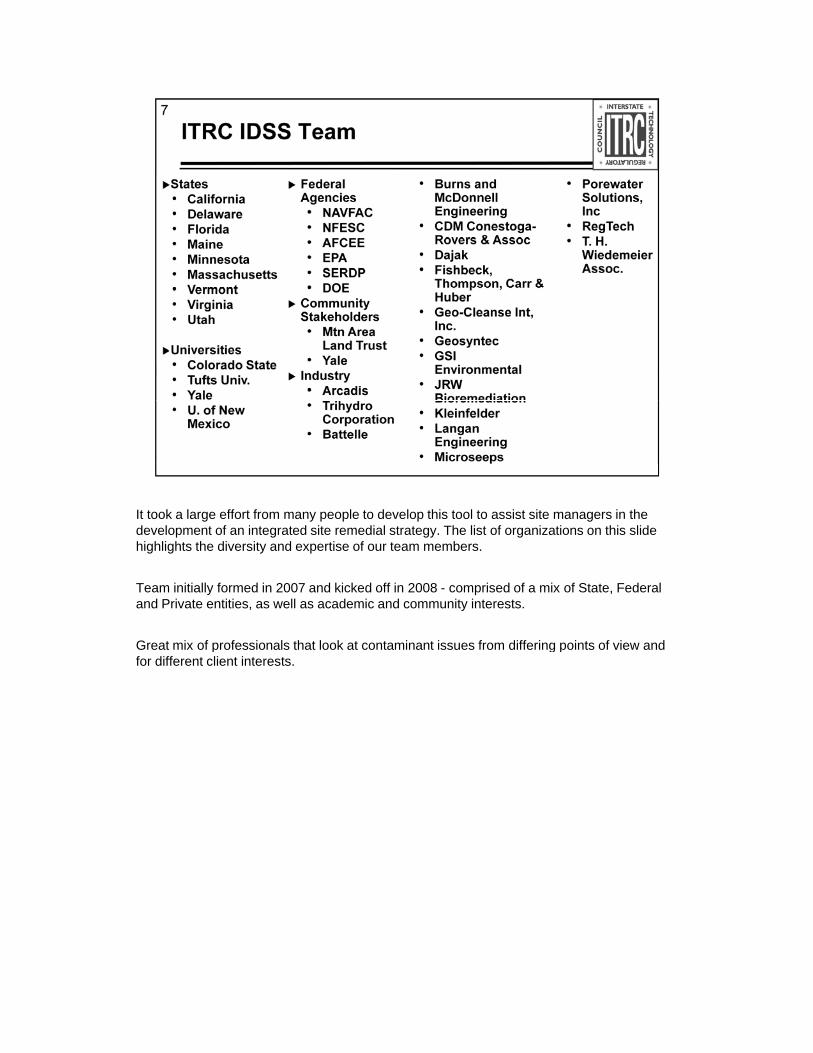
It took a large effort from many people to develop this tool to assist site managers in the d l t f i t t d it di l t t Th li t f i ti thi liddevelopment of an integrated site remedial strategy. The list of organizations on this slide highlights the diversity and expertise of our team members.
Team initially formed in 2007 and kicked off in 2008 - comprised of a mix of State, Federal and Private entities, as well as academic and community interests.
Great mix of professionals that look at contaminant issues from differing points of view and p g pfor different client interests.
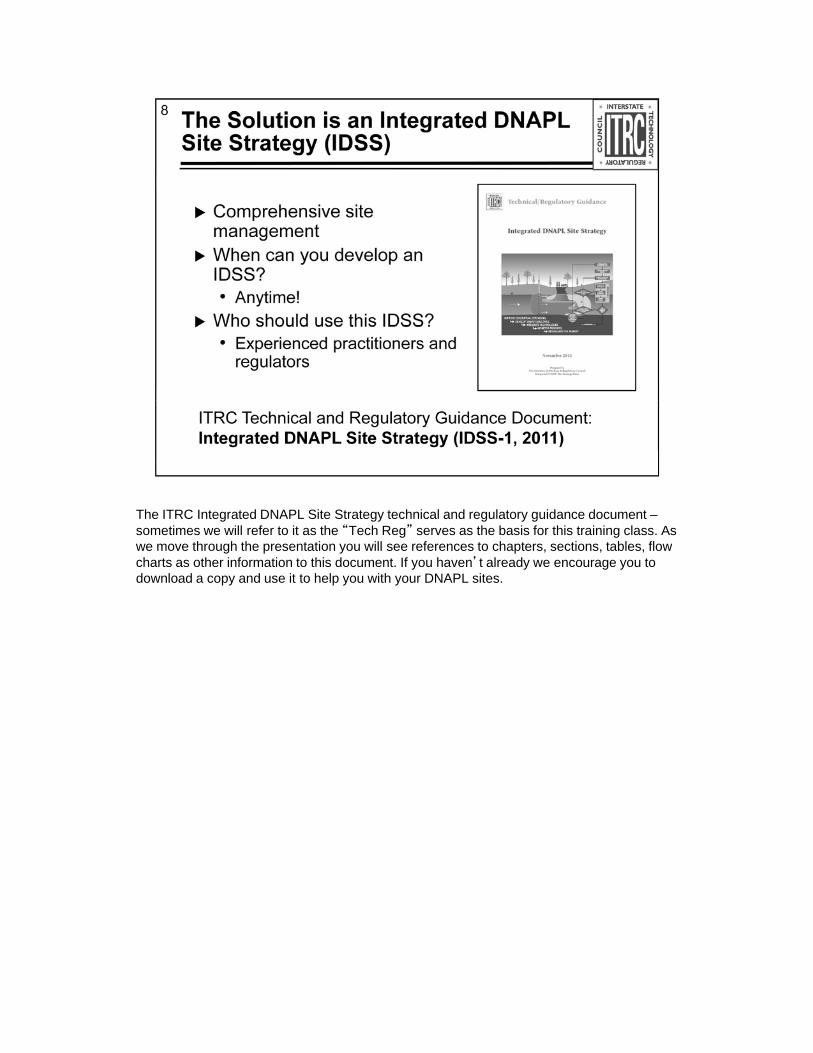
The ITRC Integrated DNAPL Site Strategy technical and regulatory guidance document –ti ill f t it th “T h R ” th b i f thi t i i l Asometimes we will refer to it as the “Tech Reg” serves as the basis for this training class. As
we move through the presentation you will see references to chapters, sections, tables, flow charts as other information to this document. If you haven’t already we encourage you to download a copy and use it to help you with your DNAPL sites.
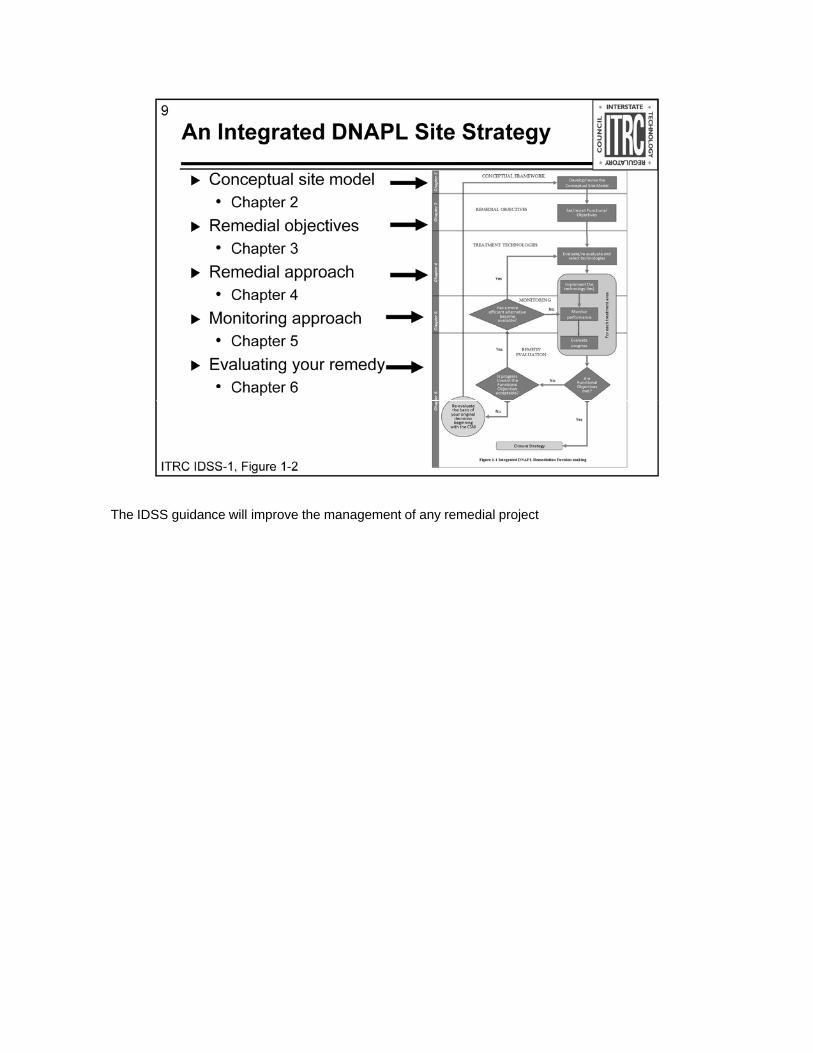
The IDSS guidance will improve the management of any remedial project
No associated notes.
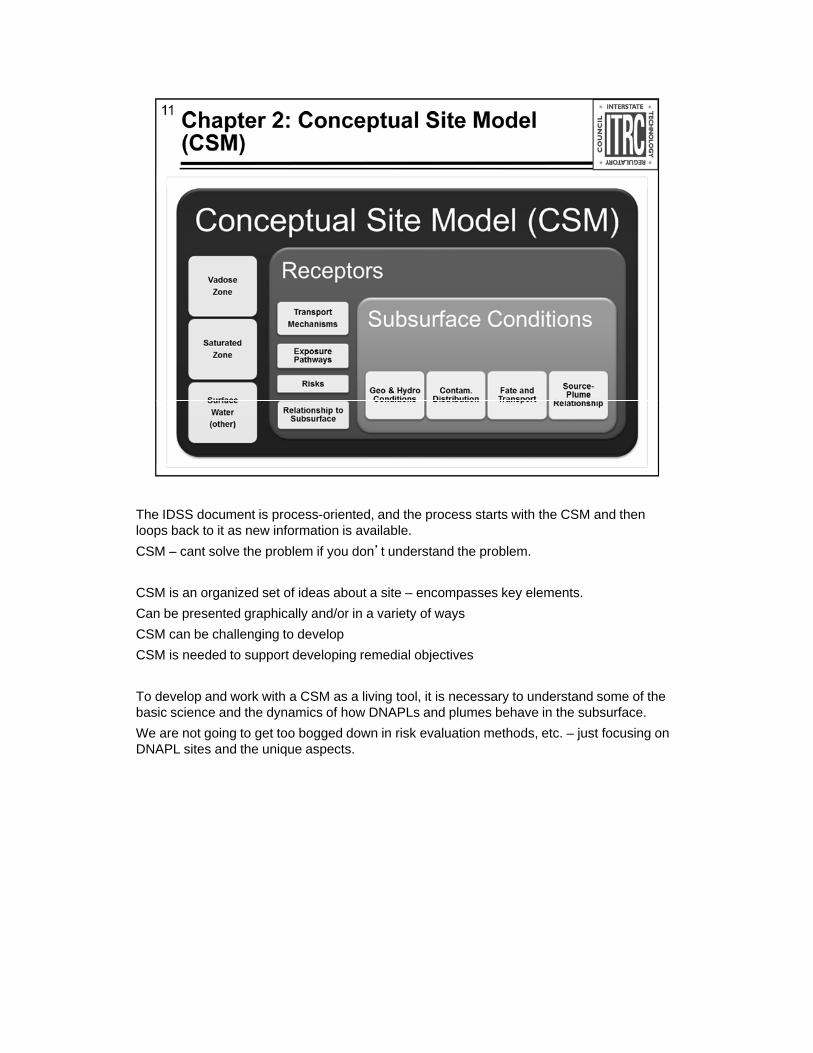
The IDSS document is process-oriented, and the process starts with the CSM and then l b k t it i f ti i il blloops back to it as new information is available.
CSM – cant solve the problem if you don’t understand the problem.
CSM is an organized set of ideas about a site – encompasses key elements.
Can be presented graphically and/or in a variety of ways
CSM can be challenging to develop
CSM i d d t t d l i di l bj tiCSM is needed to support developing remedial objectives
To develop and work with a CSM as a living tool, it is necessary to understand some of the basic science and the dynamics of how DNAPLs and plumes behave in the subsurface.
We are not going to get too bogged down in risk evaluation methods, etc. – just focusing on DNAPL sites and the unique aspects.
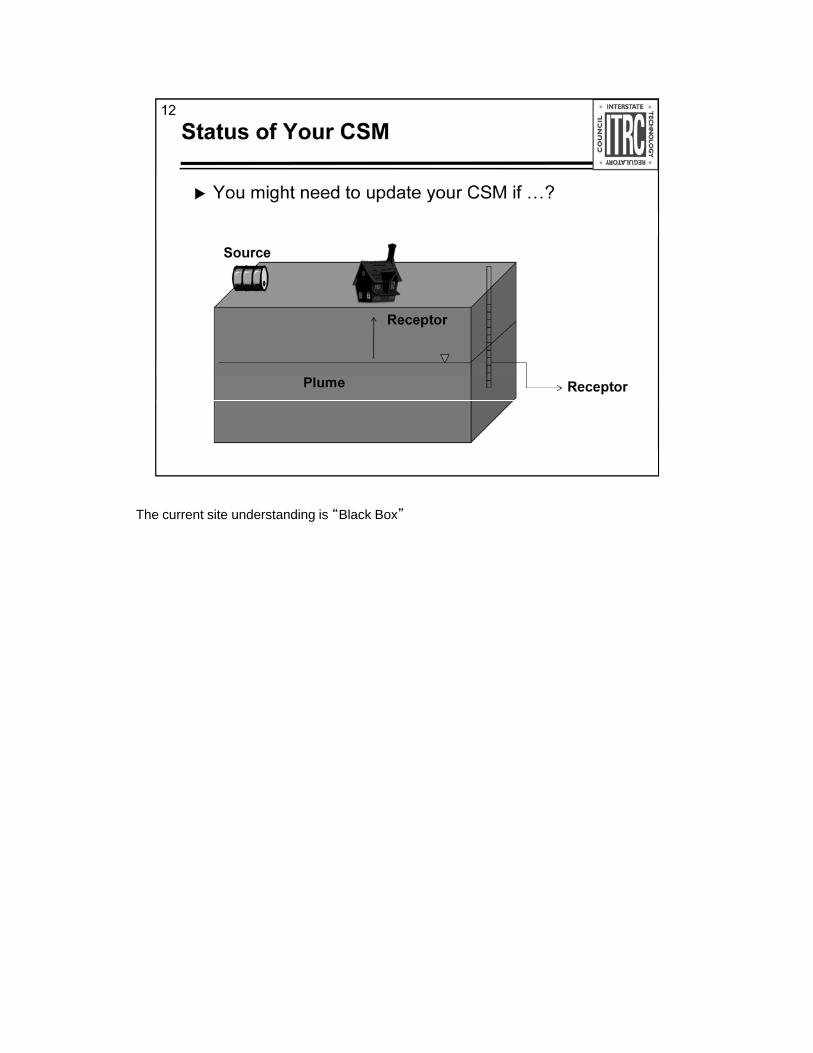
The current site understanding is “Black Box”
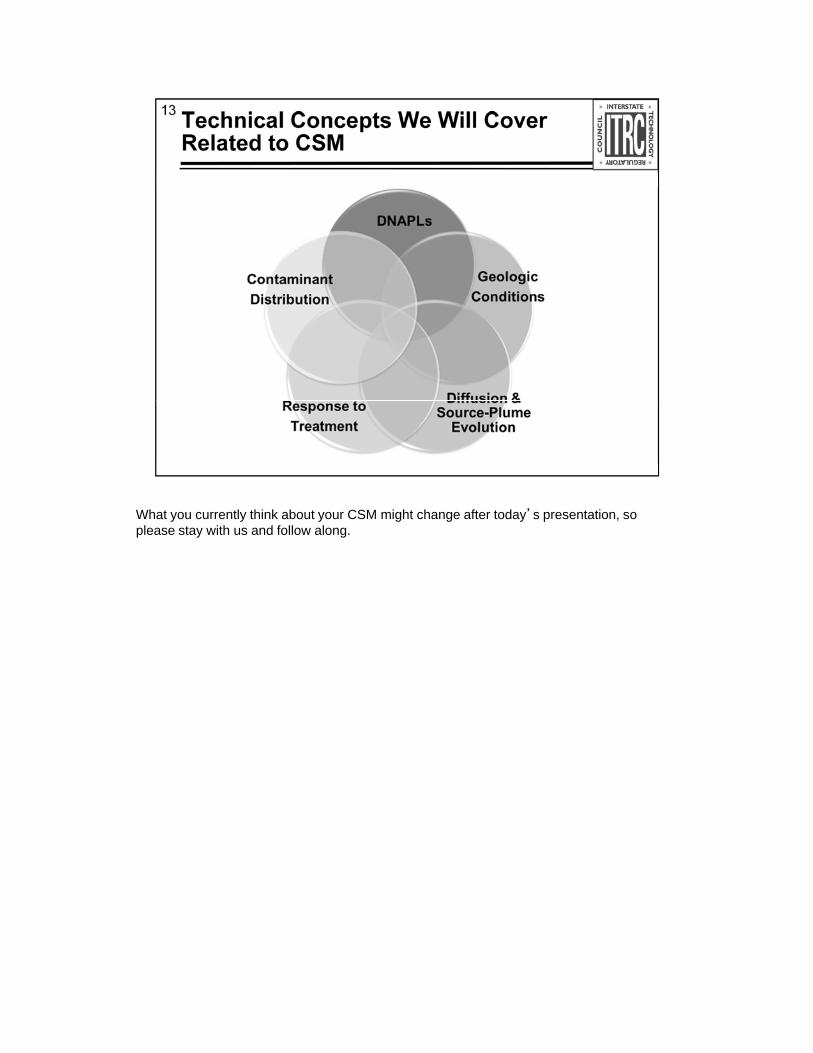
What you currently think about your CSM might change after today’s presentation, so l t ith d f ll lplease stay with us and follow along.
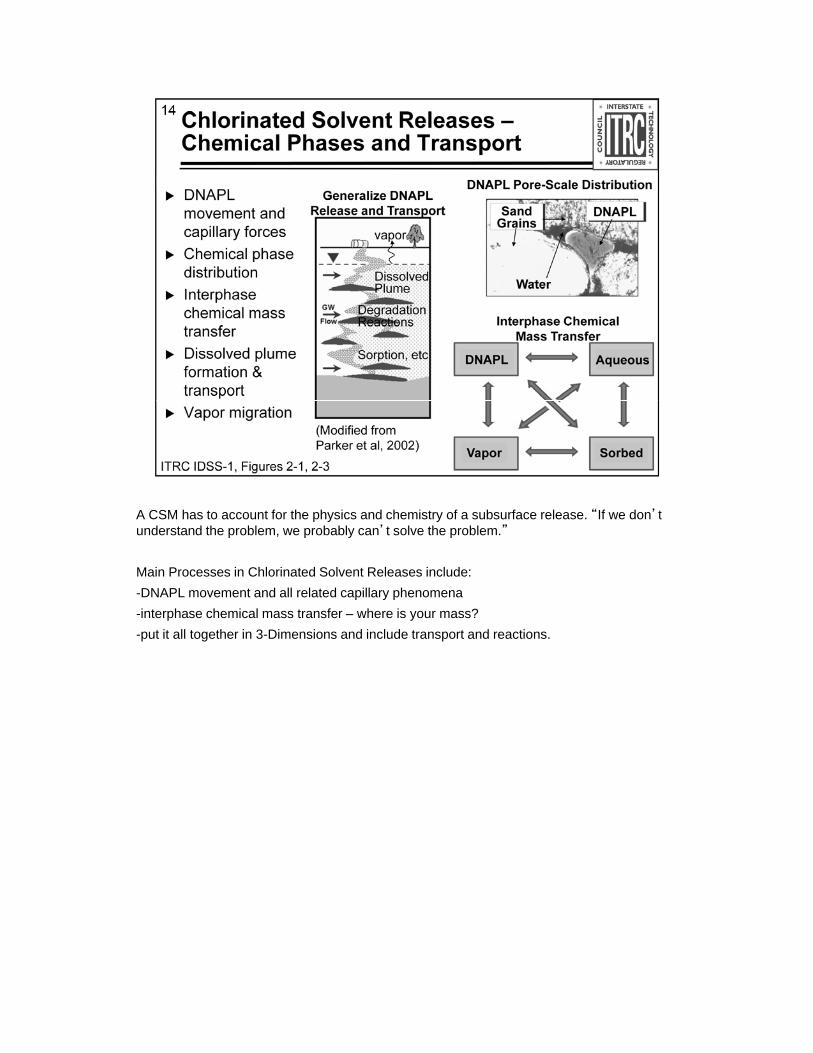
A CSM has to account for the physics and chemistry of a subsurface release. “If we don’t d t d th bl b bl ’t l th bl ”understand the problem, we probably can’t solve the problem.”
Main Processes in Chlorinated Solvent Releases include:
-DNAPL movement and all related capillary phenomena
-interphase chemical mass transfer – where is your mass?
-put it all together in 3-Dimensions and include transport and reactions.
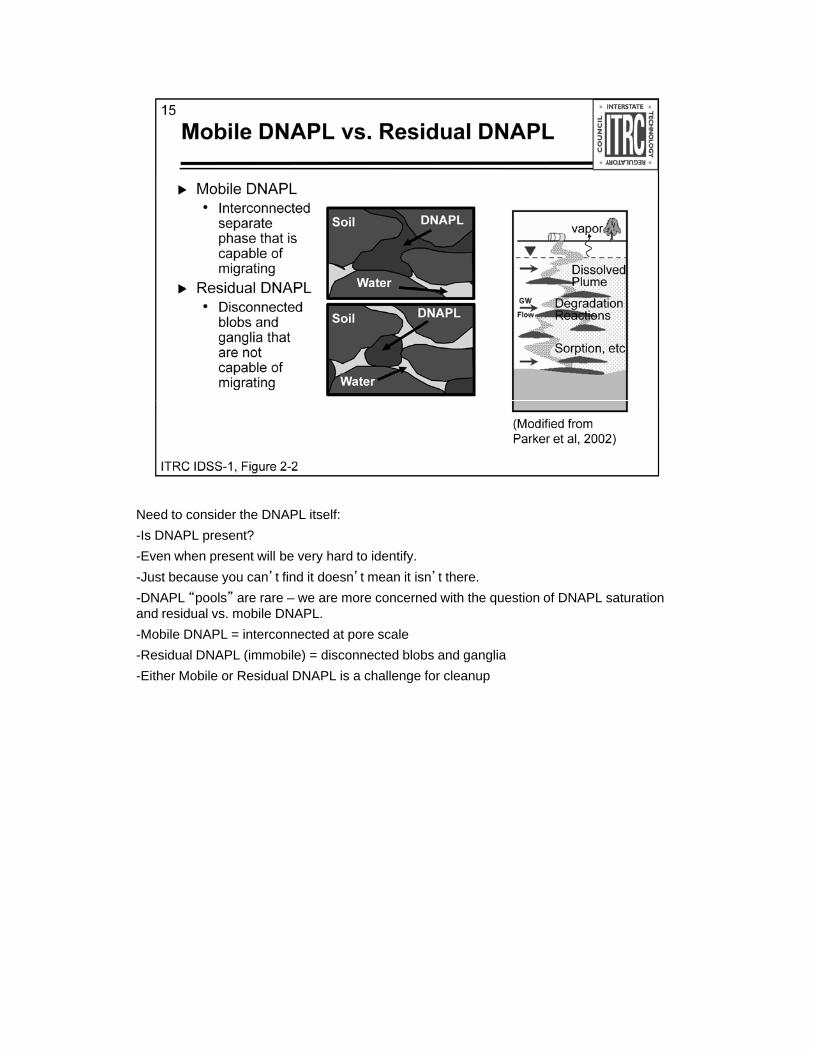
Need to consider the DNAPL itself:
-Is DNAPL present?
-Even when present will be very hard to identify.
-Just because you can’t find it doesn’t mean it isn’t there.
-DNAPL “pools” are rare – we are more concerned with the question of DNAPL saturation and residual vs. mobile DNAPL.
-Mobile DNAPL = interconnected at pore scale
R id l DNAPL (i bil ) di t d bl b d li-Residual DNAPL (immobile) = disconnected blobs and ganglia
-Either Mobile or Residual DNAPL is a challenge for cleanup
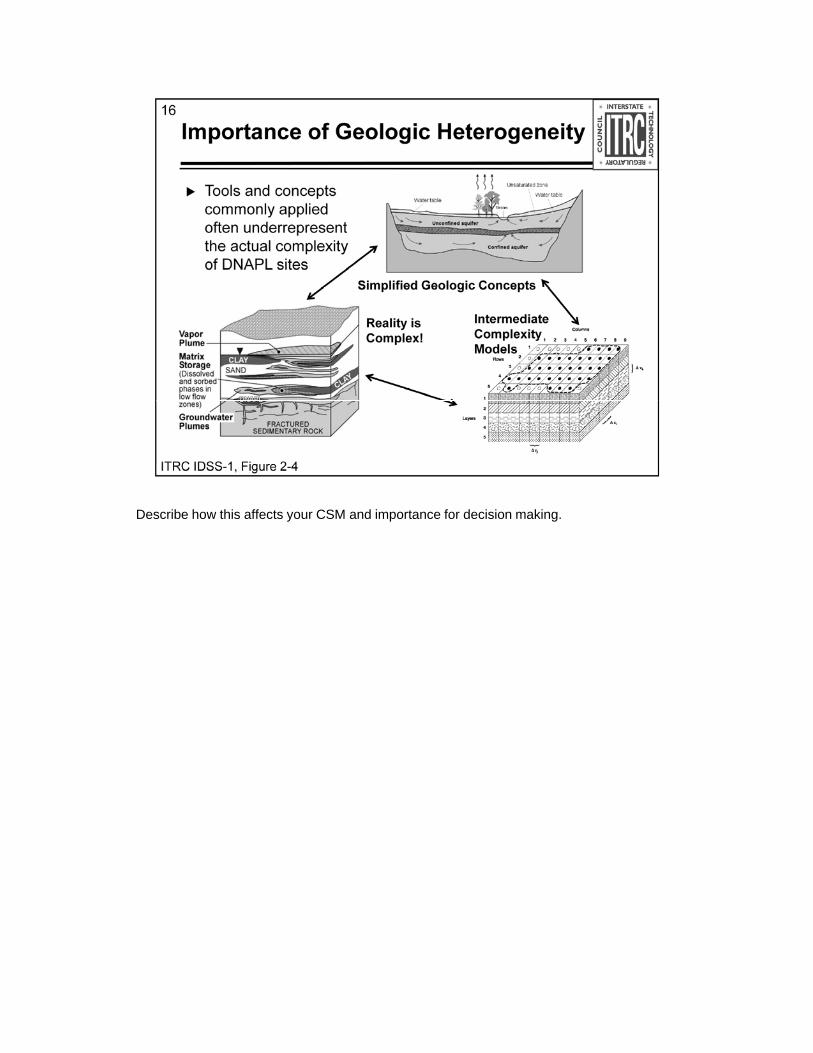
Describe how this affects your CSM and importance for decision making.
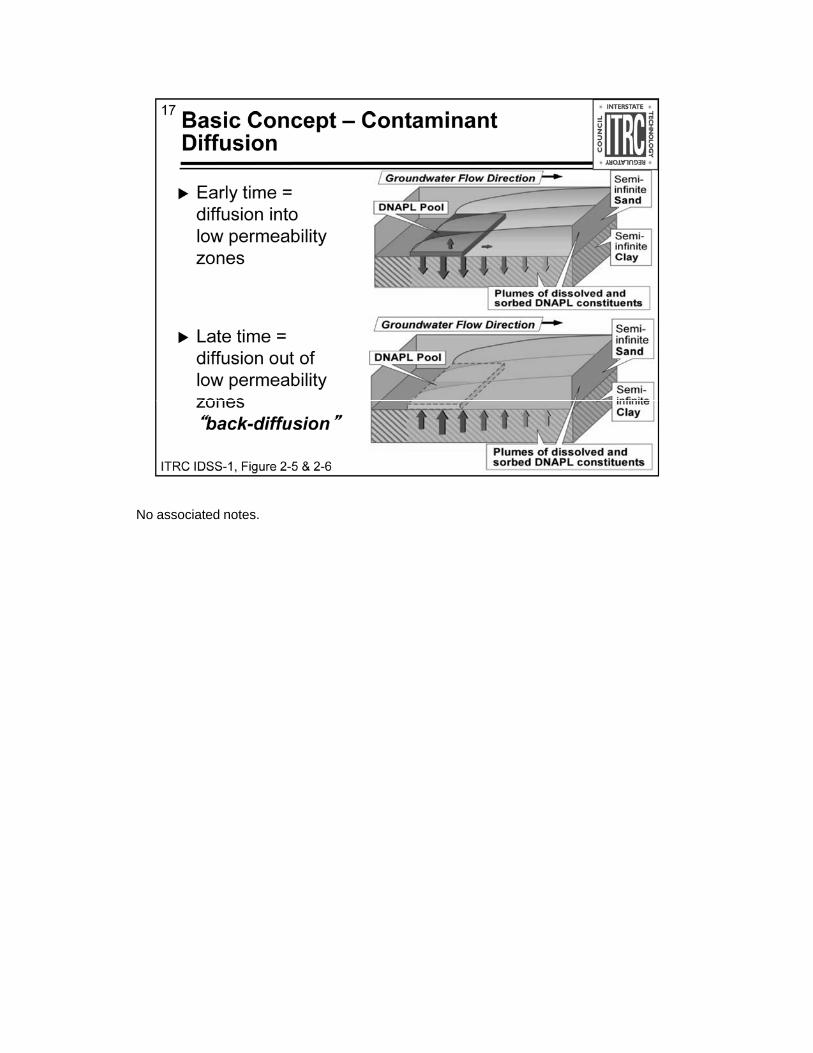
No associated notes.
No associated notes.
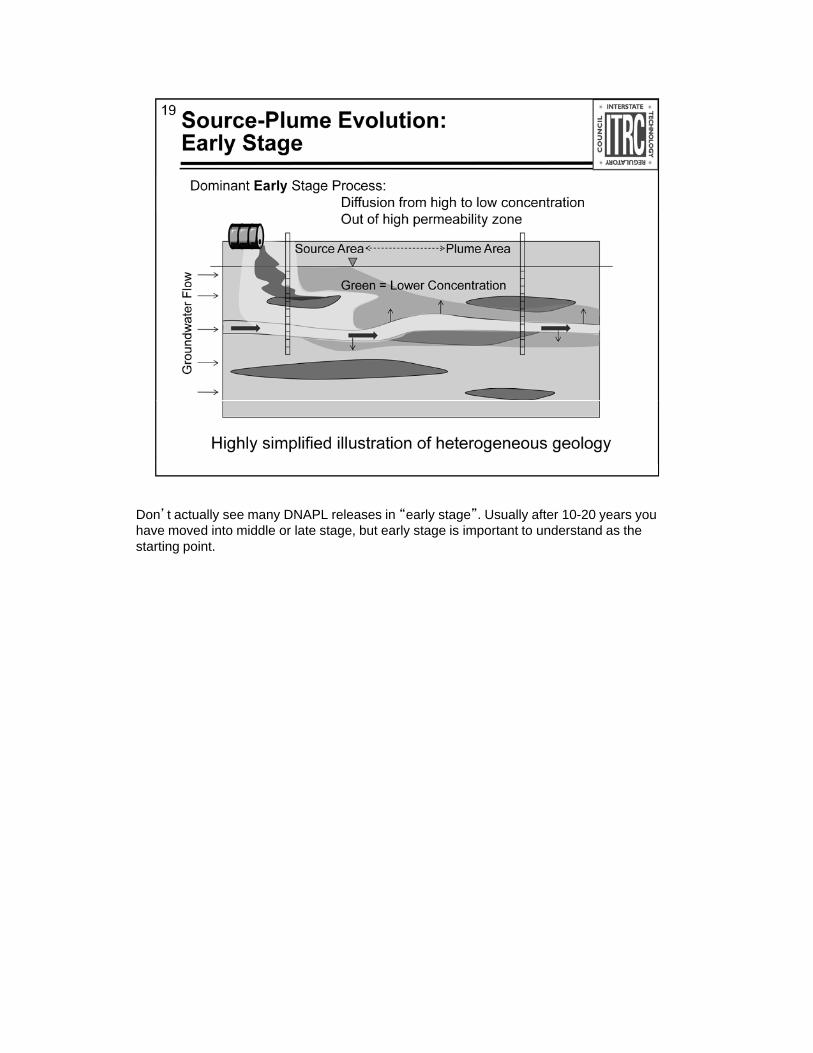
Don’t actually see many DNAPL releases in “early stage”. Usually after 10-20 years you h d i t iddl l t t b t l t i i t t t d t d thhave moved into middle or late stage, but early stage is important to understand as the starting point.
No associated notes.
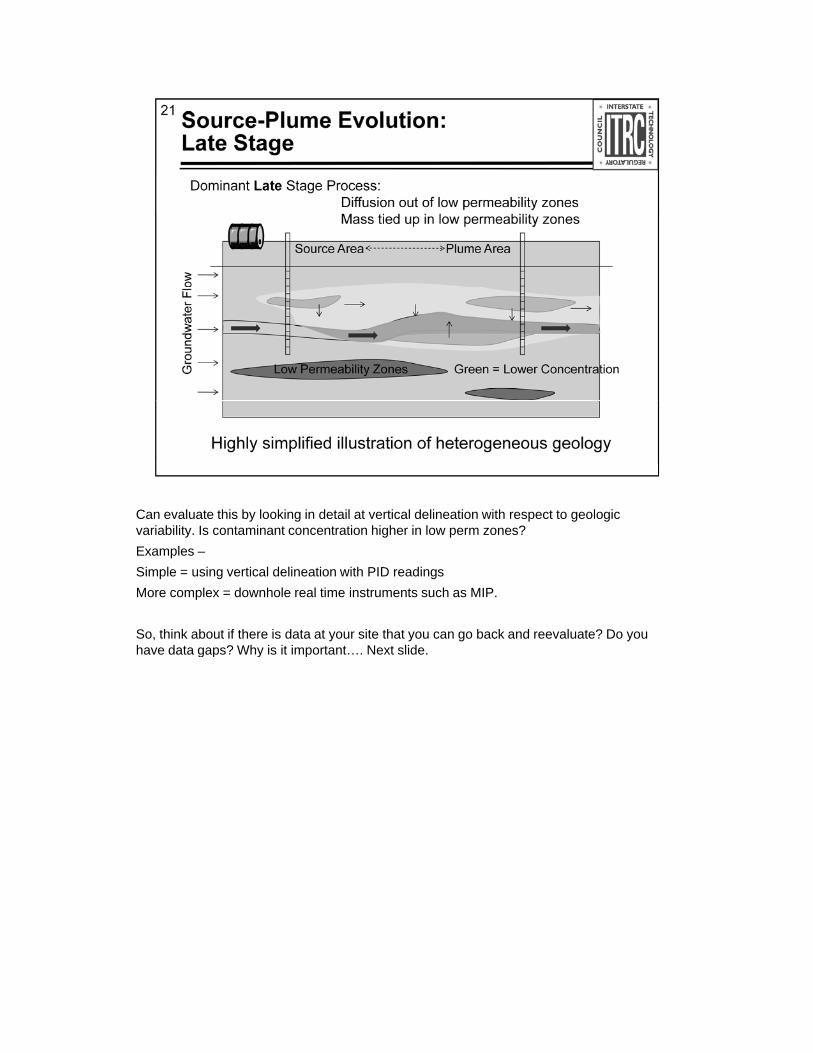
Can evaluate this by looking in detail at vertical delineation with respect to geologic i bilit I t i t t ti hi h i l ?variability. Is contaminant concentration higher in low perm zones?
Examples –
Simple = using vertical delineation with PID readings
More complex = downhole real time instruments such as MIP.
So, think about if there is data at your site that you can go back and reevaluate? Do you have data gaps? Why is it important Next slidehave data gaps? Why is it important…. Next slide.
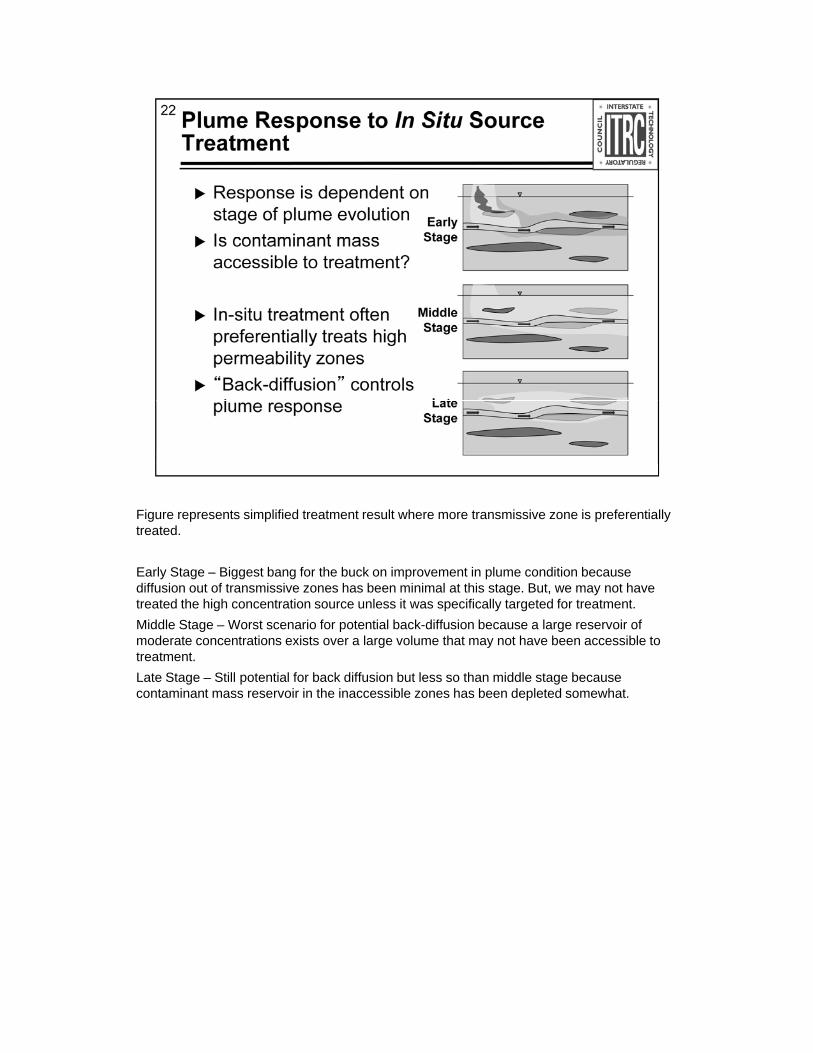
Figure represents simplified treatment result where more transmissive zone is preferentially t t dtreated.
Early Stage – Biggest bang for the buck on improvement in plume condition because diffusion out of transmissive zones has been minimal at this stage. But, we may not have treated the high concentration source unless it was specifically targeted for treatment.
Middle Stage – Worst scenario for potential back-diffusion because a large reservoir of moderate concentrations exists over a large volume that may not have been accessible to t t ttreatment.
Late Stage – Still potential for back diffusion but less so than middle stage because contaminant mass reservoir in the inaccessible zones has been depleted somewhat.
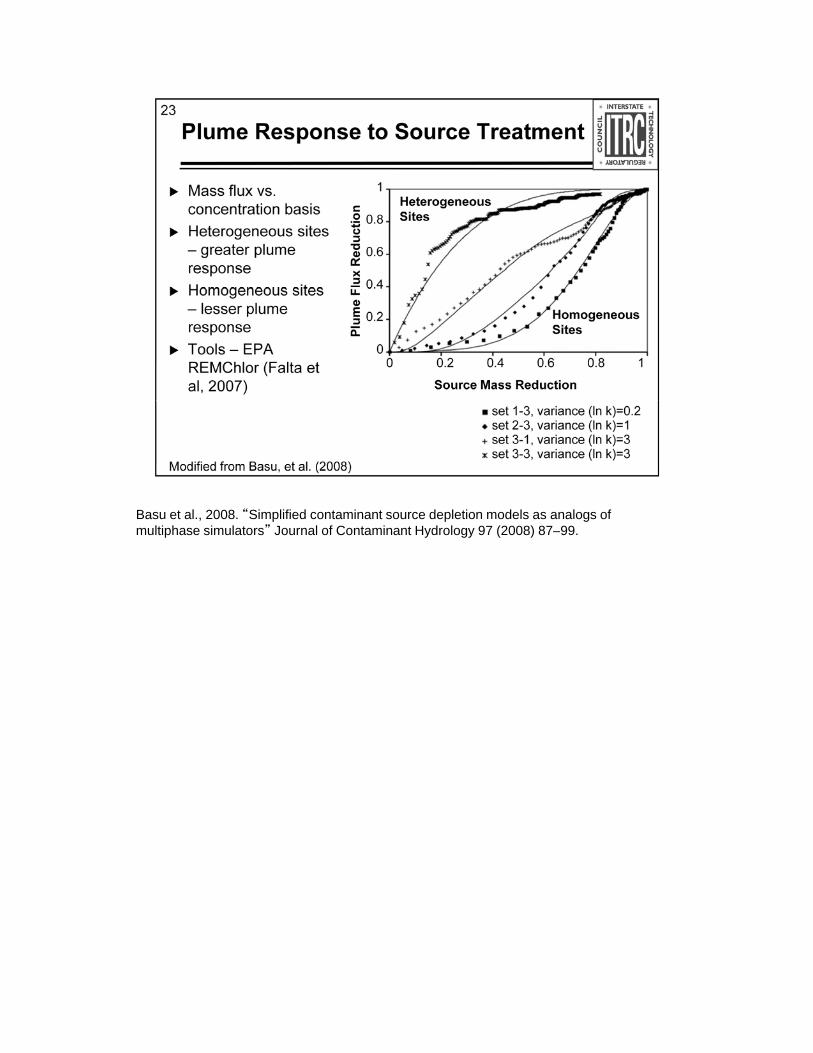
Basu et al., 2008. “Simplified contaminant source depletion models as analogs of lti h i l t ” J l f C t i t H d l 97 (2008) 87 99multiphase simulators” Journal of Contaminant Hydrology 97 (2008) 87–99.
No associated notes.
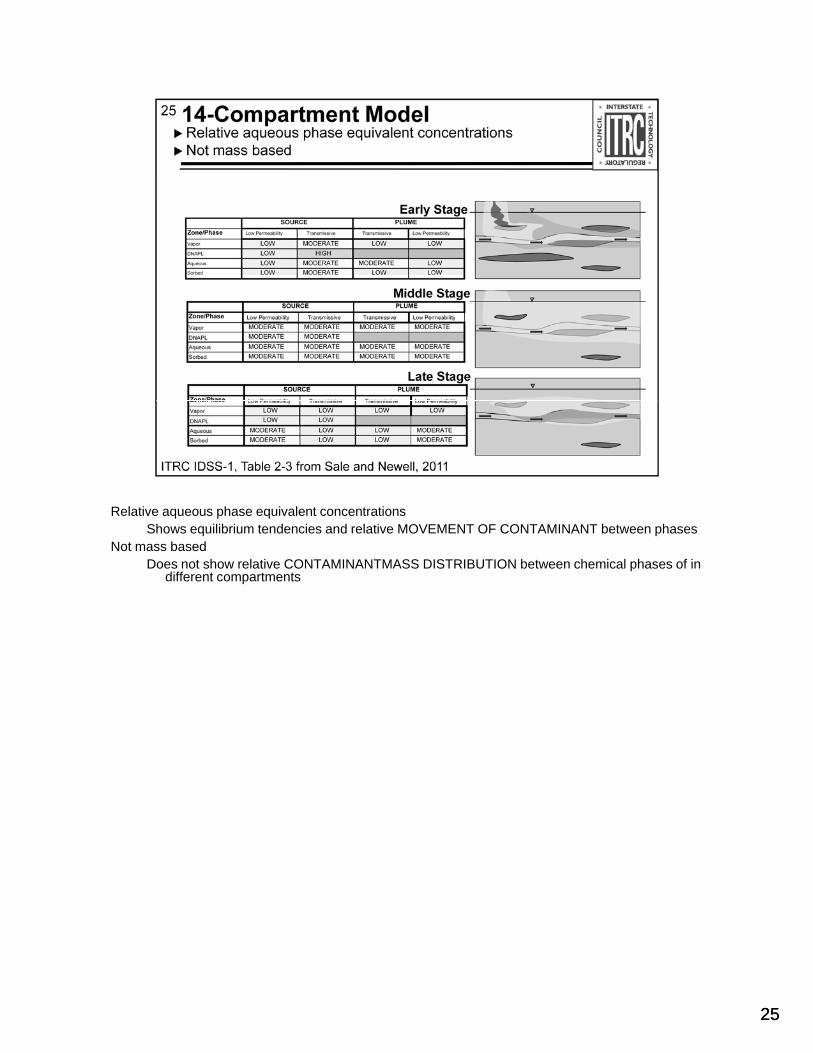
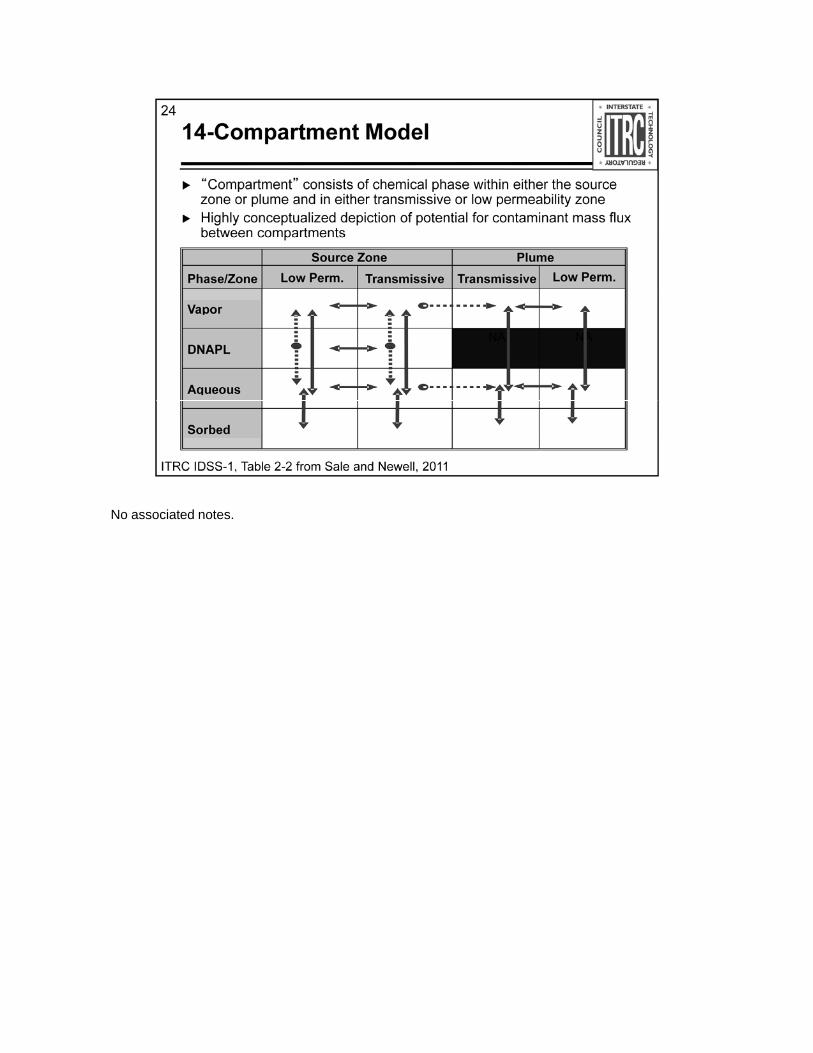
Relative aqueous phase equivalent concentrationsSh ilib i t d i d l ti MOVEMENT OF CONTAMINANT b t hShows equilibrium tendencies and relative MOVEMENT OF CONTAMINANT between phases
Not mass basedDoes not show relative CONTAMINANTMASS DISTRIBUTION between chemical phases of in
different compartments
2525
No associated notes.
There is always more to know, but…
Do you think you can formalize your CSM?
Are there areas of your site where you need to question your assumptions?
Do you think you can update your CSM?
Make this work for you, develop your CSM using any combination of graphics, maps, cross ti d t tsections, data, etc.
Refer to ITRC MASS FLUX document: ITRC Use and Measurement of Mass Flux and Mass Discharge (MASSFLUX-1, 2010)
http://www.itrcweb.org/guidancedocument.asp?TID=82
Now will briefly discuss a tool that can help in organizing your CSM and that is used laterNow… will briefly discuss a tool that can help in organizing your CSM and that is used later in this presentation.
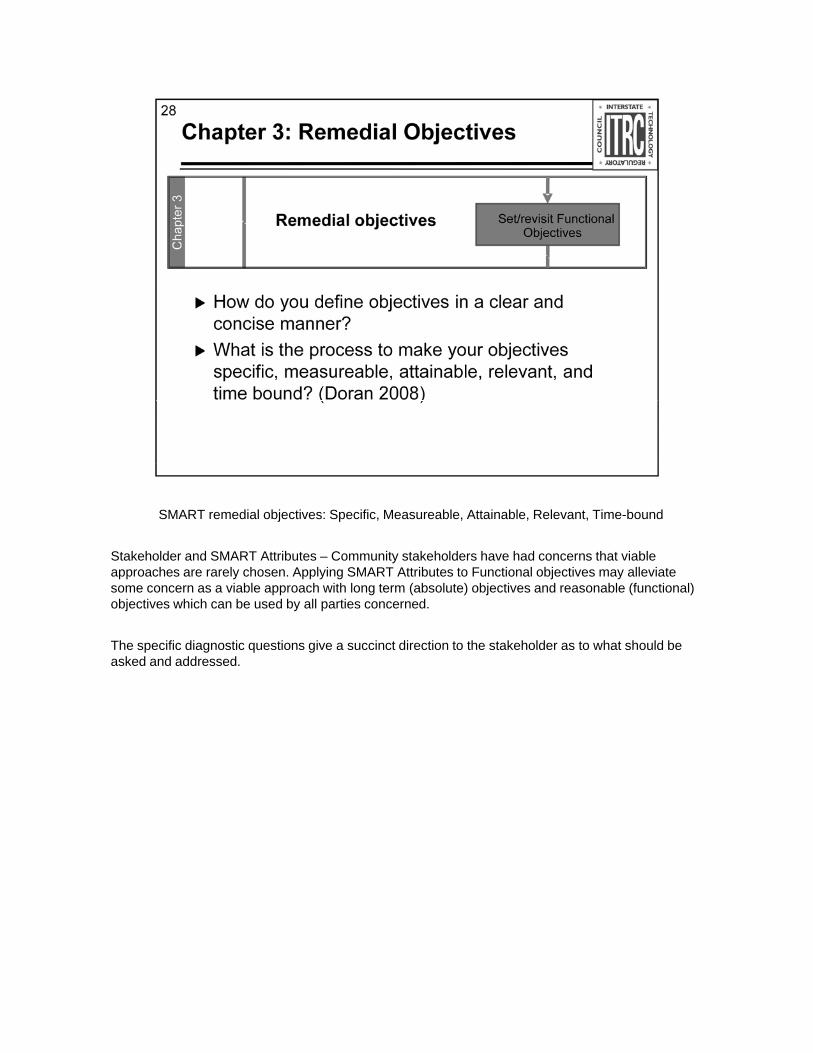
SMART remedial objectives: Specific, Measureable, Attainable, Relevant, Time-bound
Stakeholder and SMART Attributes – Community stakeholders have had concerns that viable approaches are rarely chosen. Applying SMART Attributes to Functional objectives may alleviate some concern as a viable approach with long term (absolute) objectives and reasonable (functional) objectives which can be used by all parties concerned.
The specific diagnostic questions give a succinct direction to the stakeholder as to what should be p g q gasked and addressed.
At most sites, the ultimate objective of site restoration is to achieve MCLs in all impacted di b t thi bj ti i ft t h i ll d/ i ll i ti bl ithimedia, but this objective is often technically and/or economically impracticable within
“reasonable” time frames.
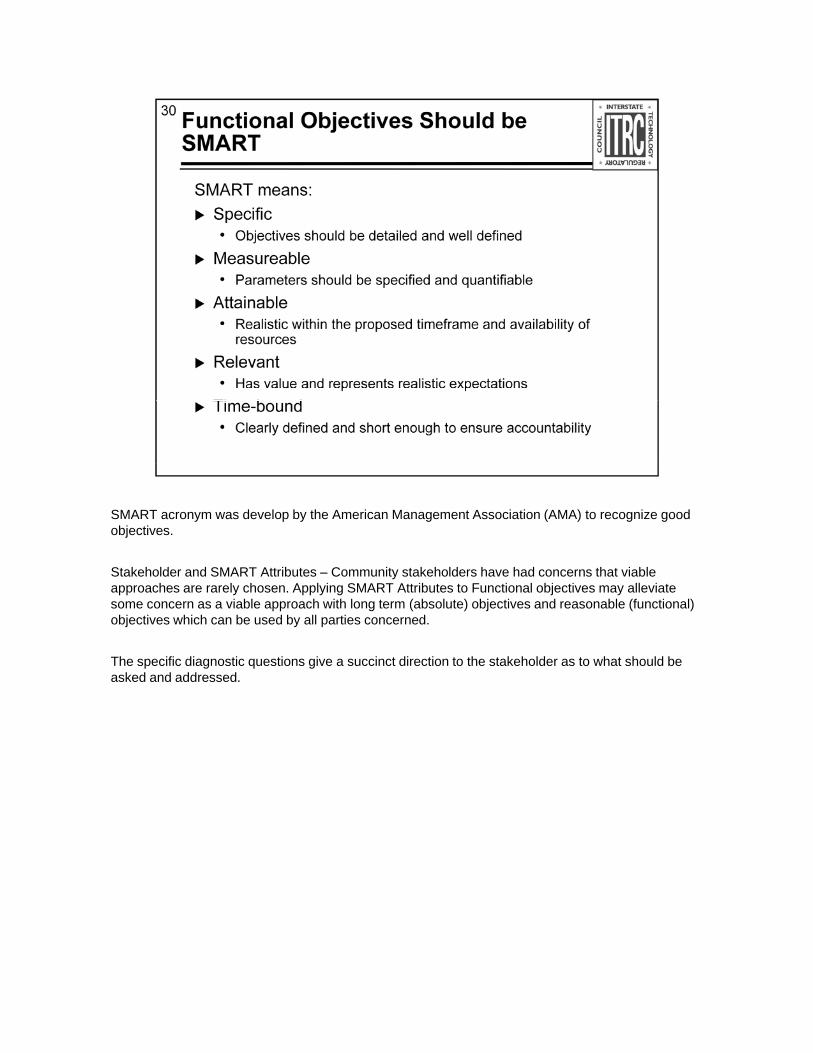
SMART acronym was develop by the American Management Association (AMA) to recognize good bj tiobjectives.
Stakeholder and SMART Attributes – Community stakeholders have had concerns that viable approaches are rarely chosen. Applying SMART Attributes to Functional objectives may alleviate some concern as a viable approach with long term (absolute) objectives and reasonable (functional) objectives which can be used by all parties concerned.
The specific diagnostic questions give a succinct direction to the stakeholder as to what should be asked and addressed.
No associated notes.
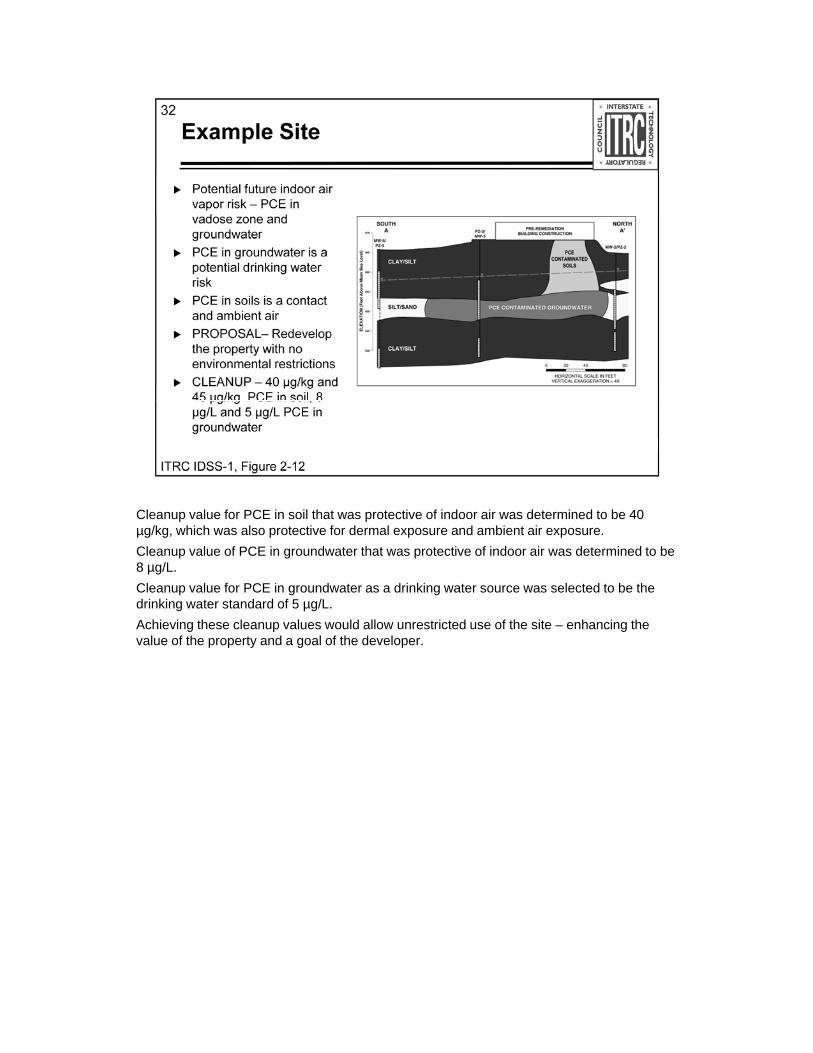
Cleanup value for PCE in soil that was protective of indoor air was determined to be 40 /k hi h l t ti f d l d bi t iµg/kg, which was also protective for dermal exposure and ambient air exposure.
Cleanup value of PCE in groundwater that was protective of indoor air was determined to be 8 µg/L.
Cleanup value for PCE in groundwater as a drinking water source was selected to be the drinking water standard of 5 µg/L.
Achieving these cleanup values would allow unrestricted use of the site – enhancing the value of the property and a goal of the developer.
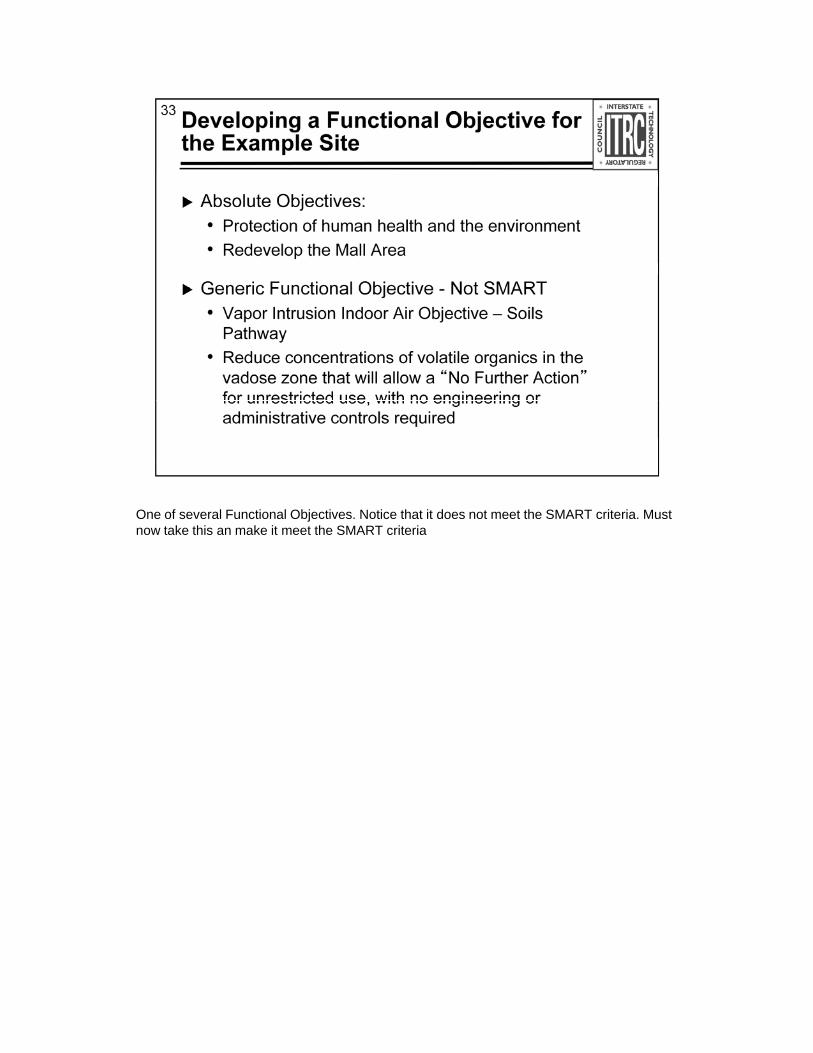
One of several Functional Objectives. Notice that it does not meet the SMART criteria. Must t k thi k it t th SMART it inow take this an make it meet the SMART criteria
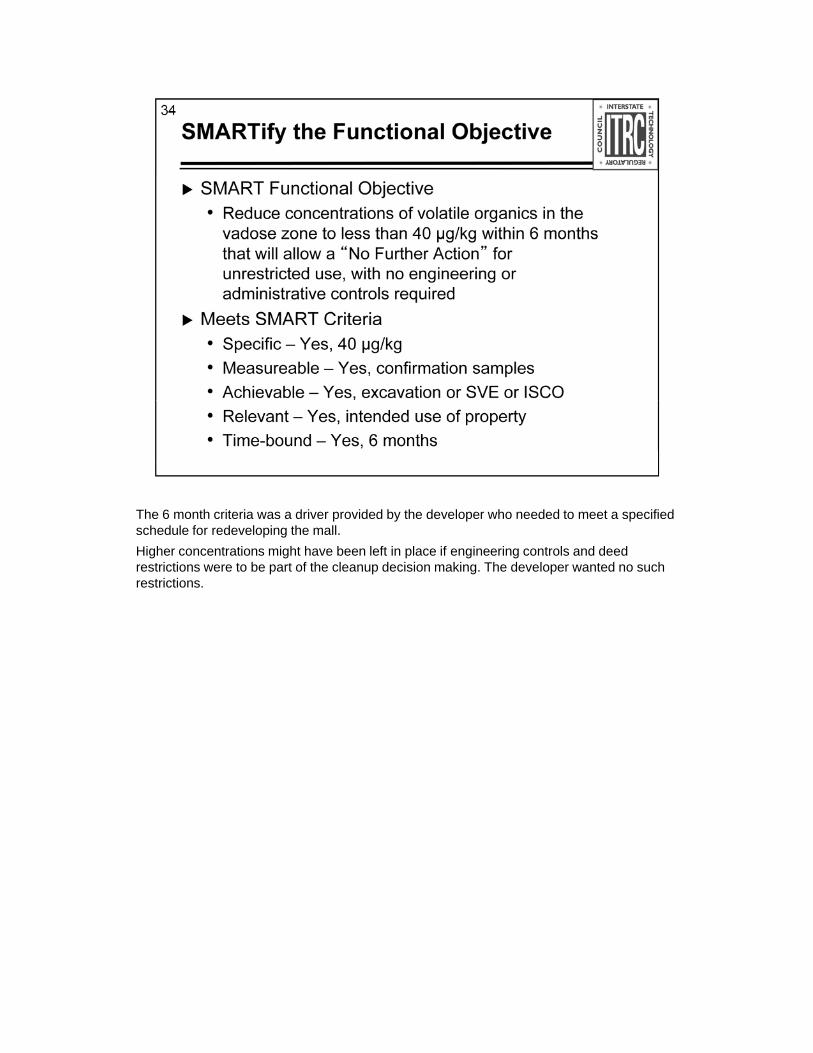
The 6 month criteria was a driver provided by the developer who needed to meet a specified h d l f d l i th llschedule for redeveloping the mall.
Higher concentrations might have been left in place if engineering controls and deed restrictions were to be part of the cleanup decision making. The developer wanted no such restrictions.
No associated notes.
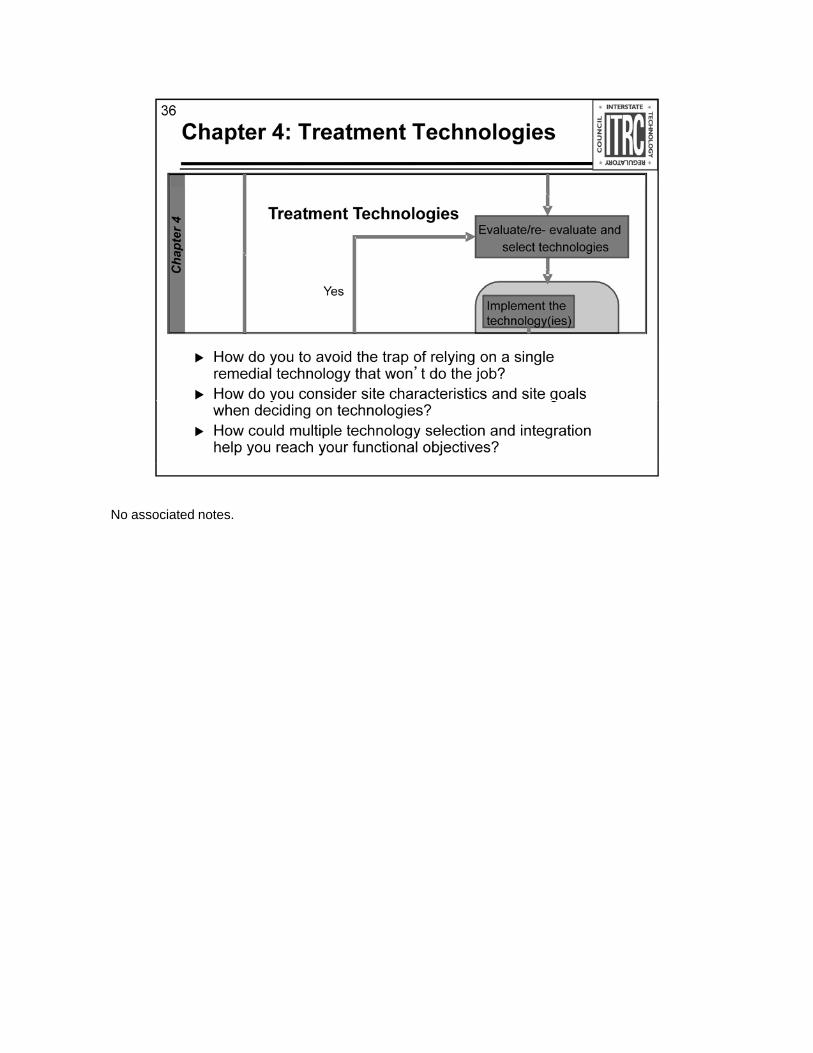
No associated notes.

No associated notes.
No associated notes.
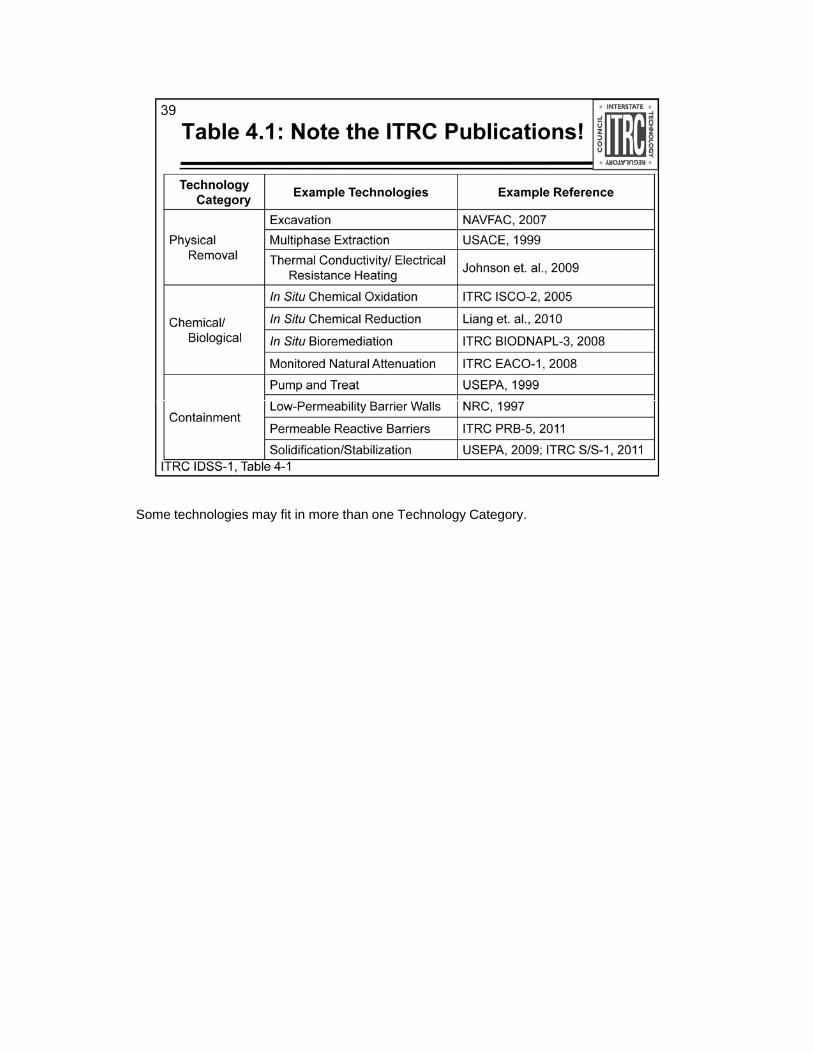
Some technologies may fit in more than one Technology Category.
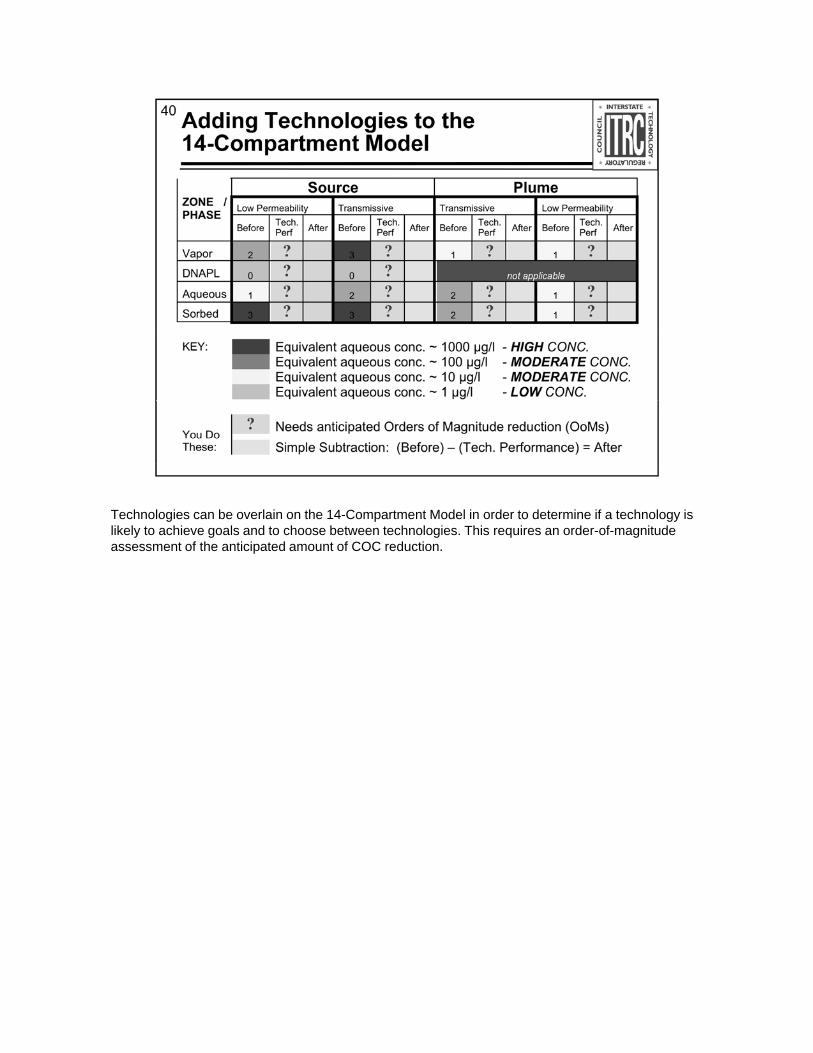
Technologies can be overlain on the 14-Compartment Model in order to determine if a technology is lik l t hi l d t h b t t h l i Thi i d f it dlikely to achieve goals and to choose between technologies. This requires an order-of-magnitude assessment of the anticipated amount of COC reduction.
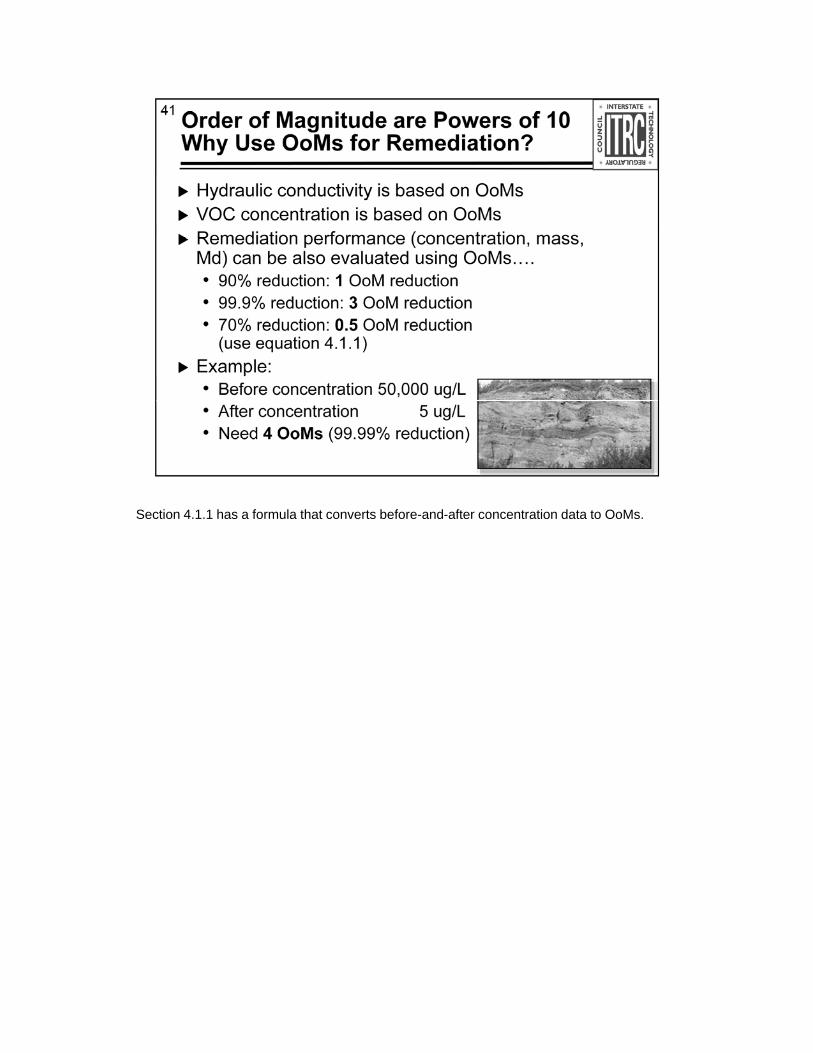
Section 4.1.1 has a formula that converts before-and-after concentration data to OoMs.
A practitioner’s knowledge of site conditions coupled with experience using a technology d th t f diti ft id th b t f O M H thunder those types of conditions often provide the best source of OoMs. However the
scientific literature and the opinions of technology specialists are also important resources to consider.
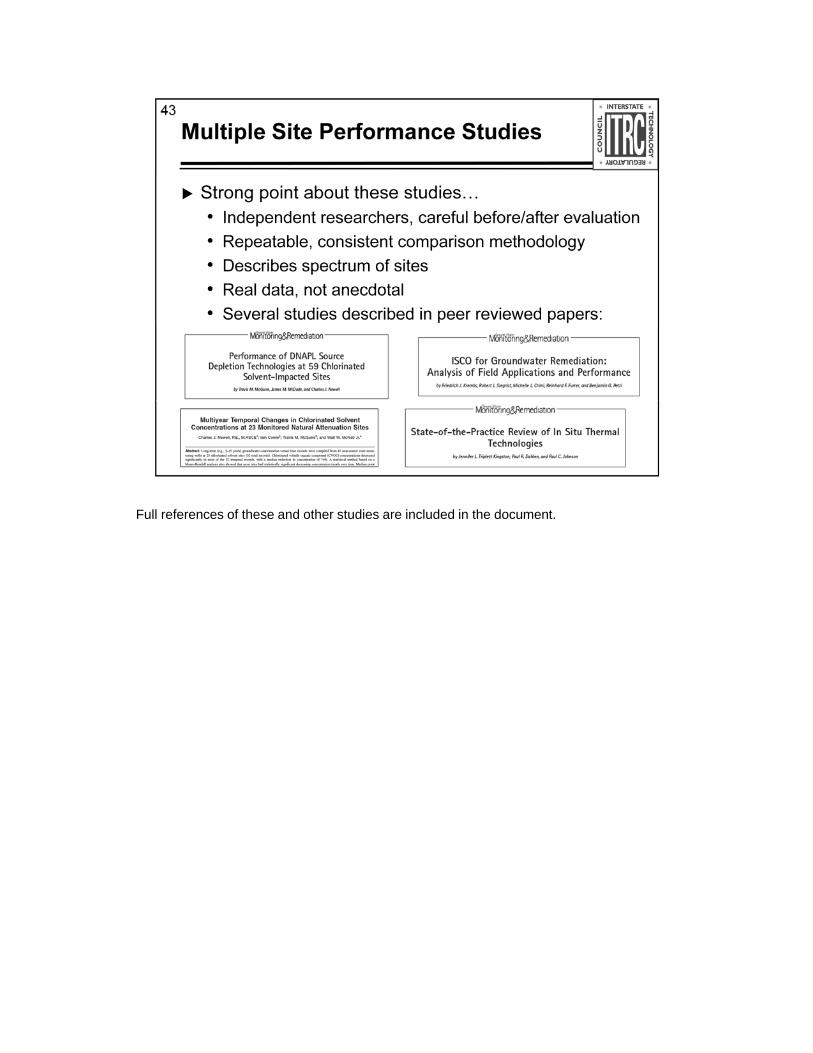
Full references of these and other studies are included in the document.
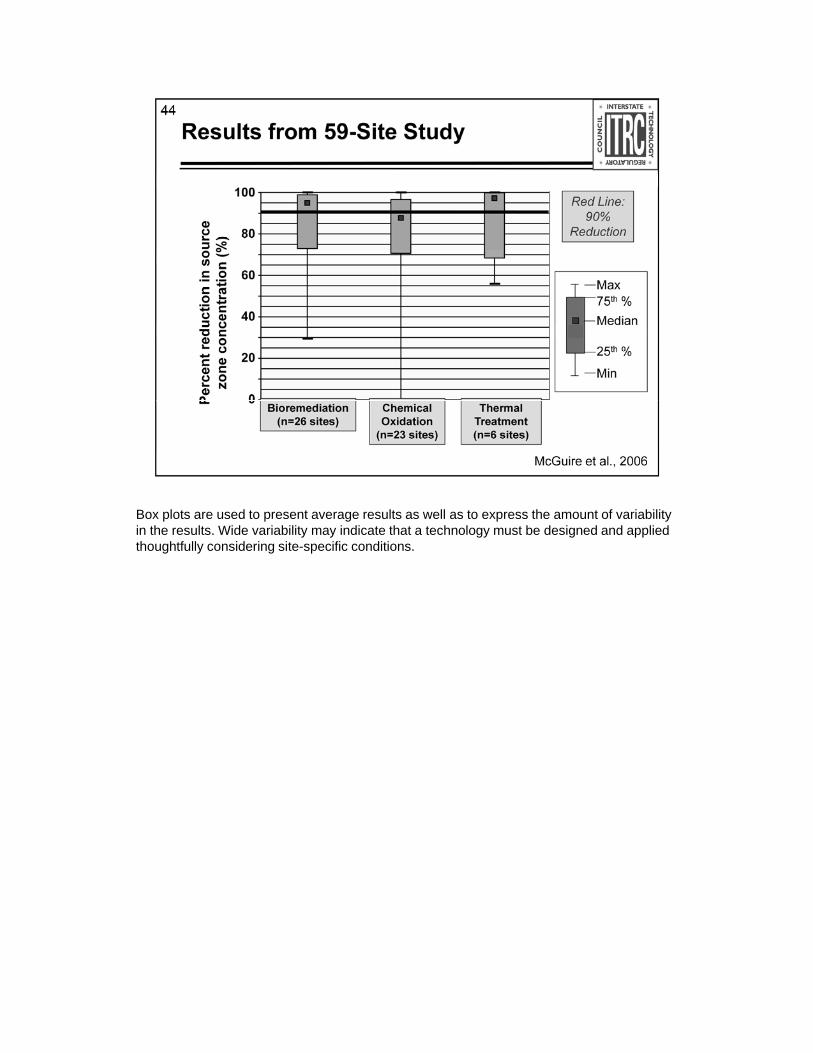
Box plots are used to present average results as well as to express the amount of variability i th lt Wid i bilit i di t th t t h l t b d i d d li din the results. Wide variability may indicate that a technology must be designed and applied thoughtfully considering site-specific conditions.
Multi-site studies also of important limitations to recognize, emphasizing caution in just using f d t ith t id i th it ifi iperformance data without considering the site-specific issues.
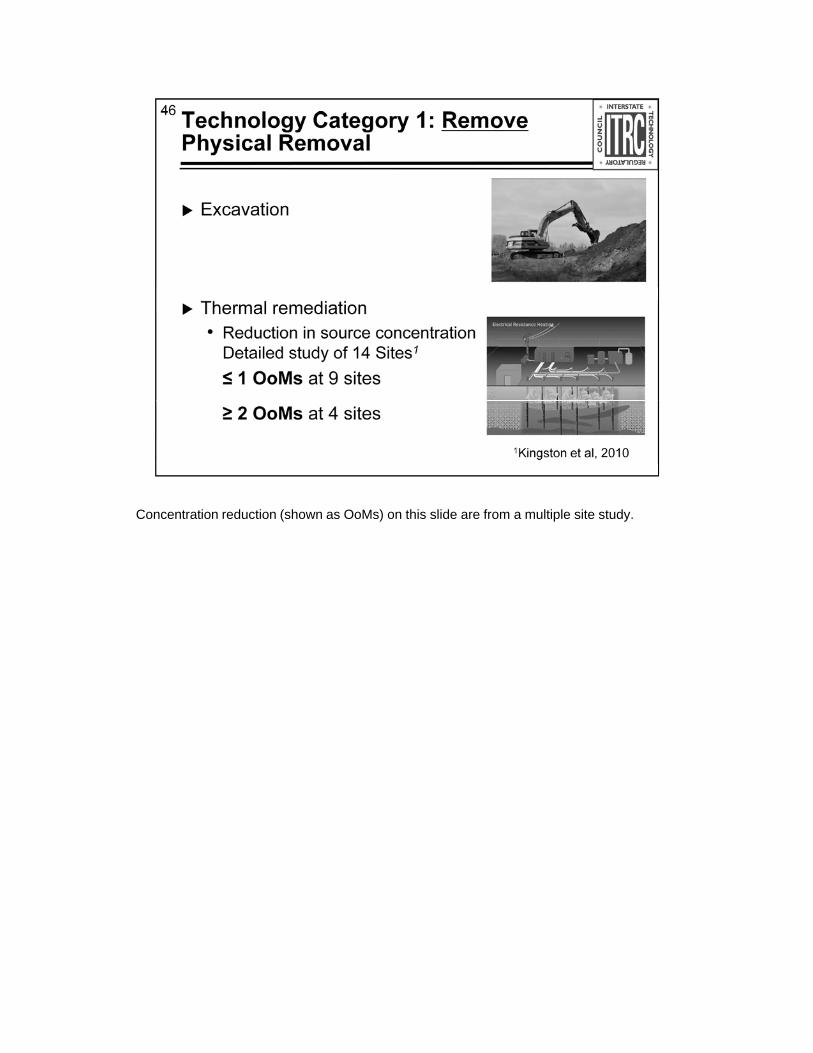
Concentration reduction (shown as OoMs) on this slide are from a multiple site study.
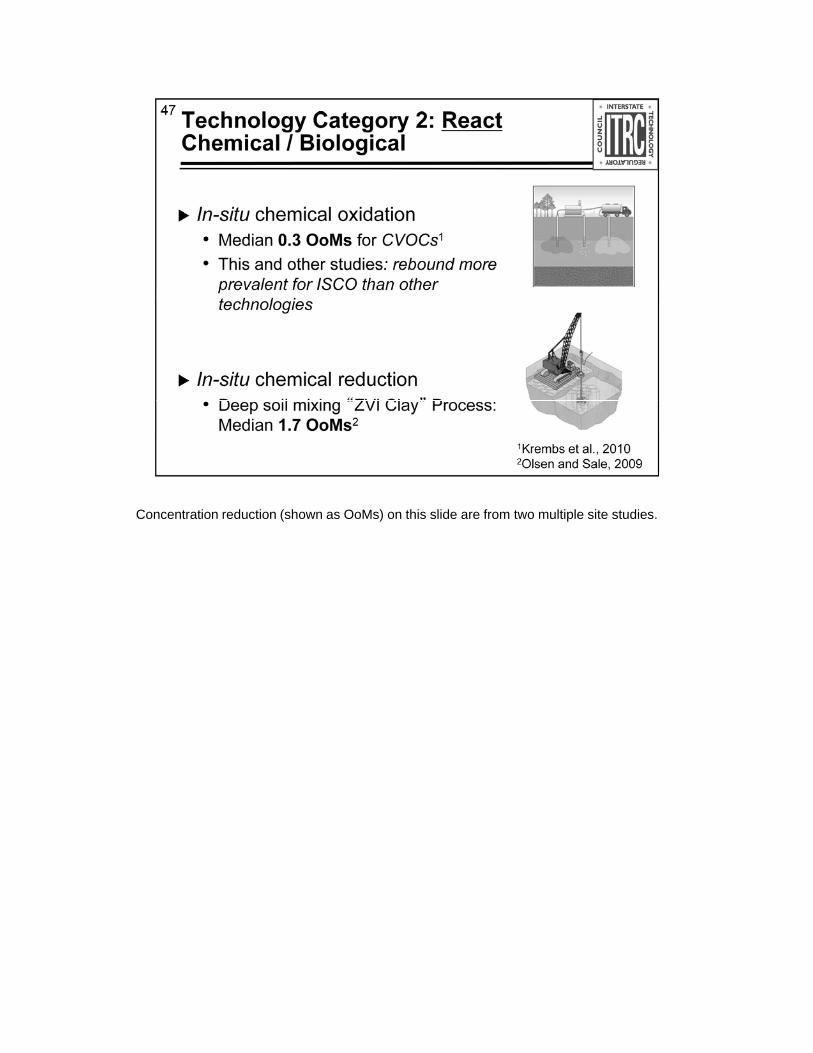
Concentration reduction (shown as OoMs) on this slide are from two multiple site studies.
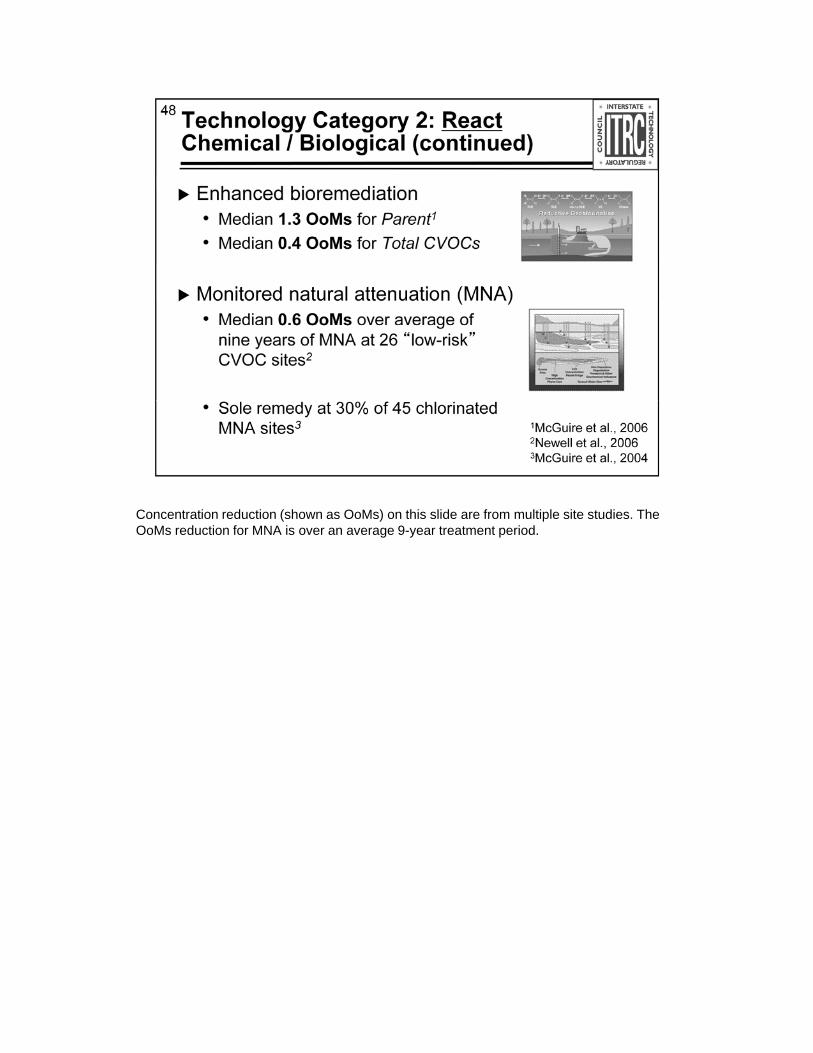
Concentration reduction (shown as OoMs) on this slide are from multiple site studies. The O M d ti f MNA i 9 t t t i dOoMs reduction for MNA is over an average 9-year treatment period.
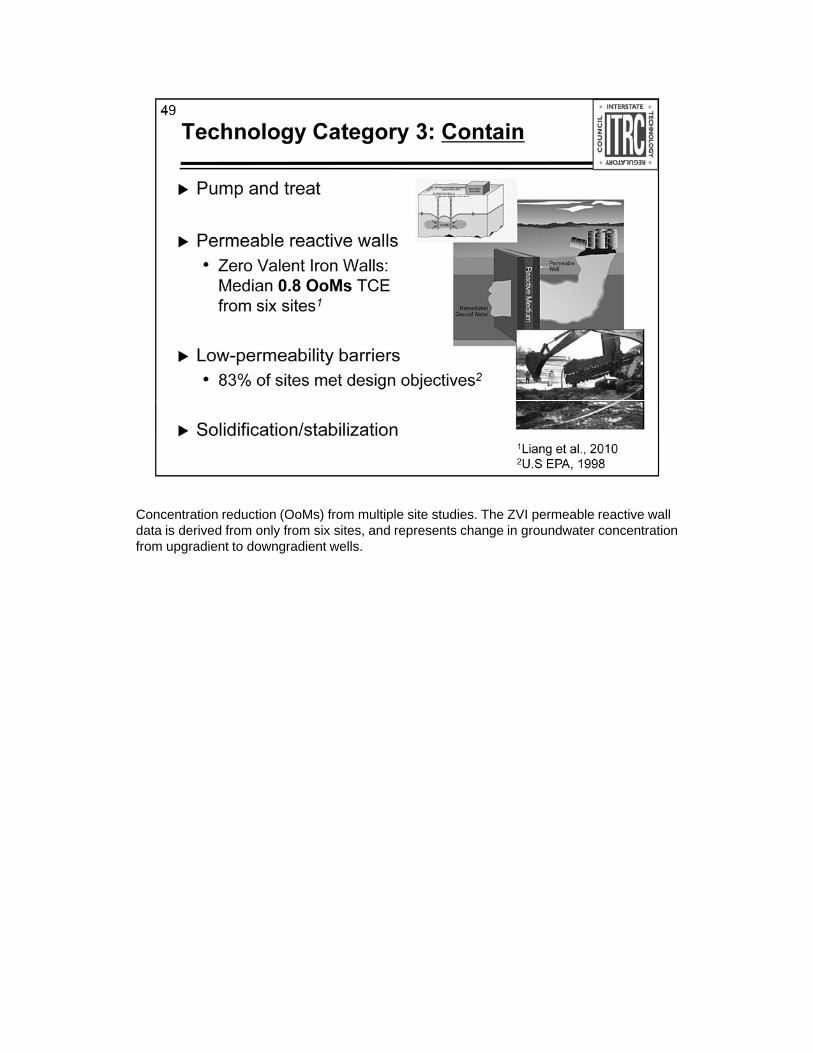
Concentration reduction (OoMs) from multiple site studies. The ZVI permeable reactive wall d t i d i d f l f i it d t h i d t t tidata is derived from only from six sites, and represents change in groundwater concentration from upgradient to downgradient wells.
No associated notes.
No associated notes.
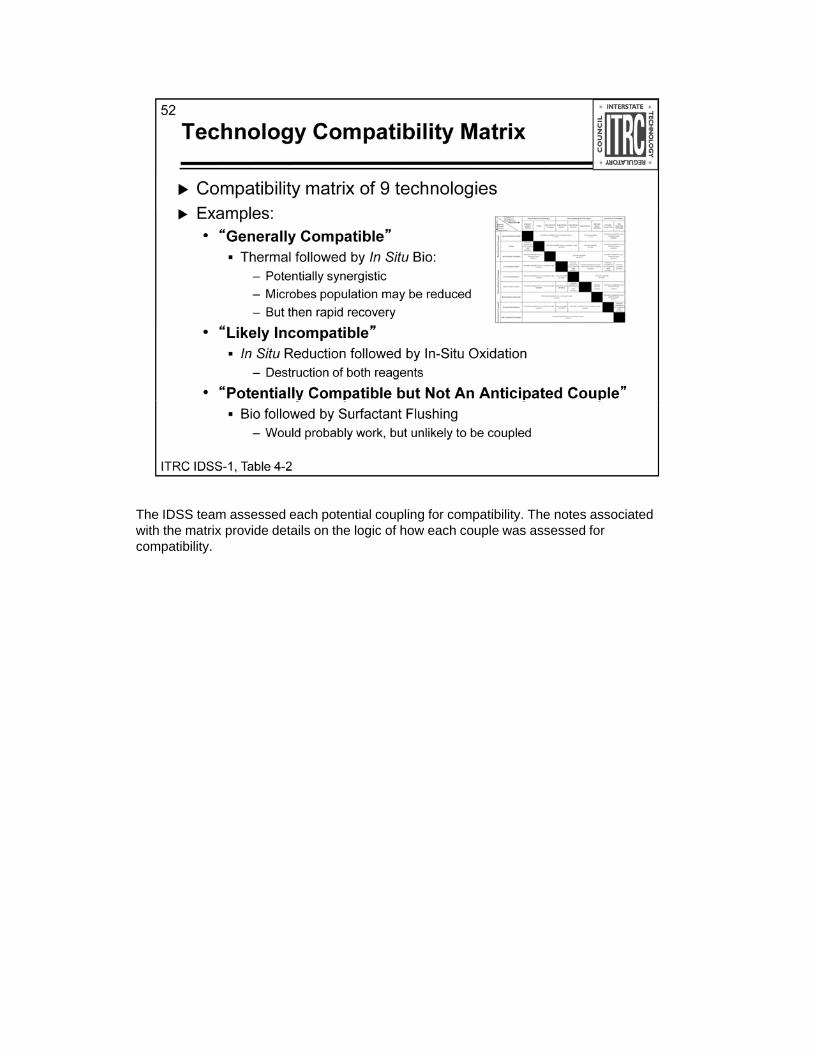
The IDSS team assessed each potential coupling for compatibility. The notes associated ith th t i id d t il th l i f h h l d fwith the matrix provide details on the logic of how each couple was assessed for
compatibility.
No associated notes.
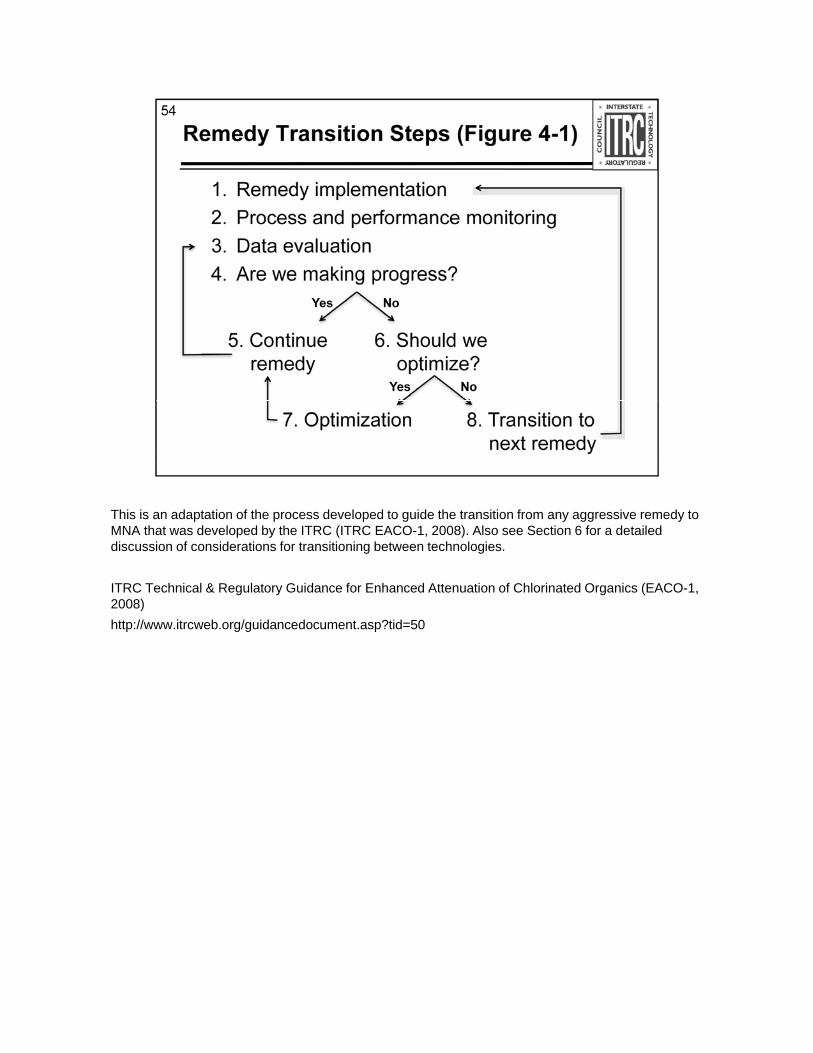
This is an adaptation of the process developed to guide the transition from any aggressive remedy to MNA th t d l d b th ITRC (ITRC EACO 1 2008) Al S ti 6 f d t il dMNA that was developed by the ITRC (ITRC EACO-1, 2008). Also see Section 6 for a detailed discussion of considerations for transitioning between technologies.
ITRC Technical & Regulatory Guidance for Enhanced Attenuation of Chlorinated Organics (EACO-1, 2008)
http://www.itrcweb.org/guidancedocument.asp?tid=50
No associated notes.
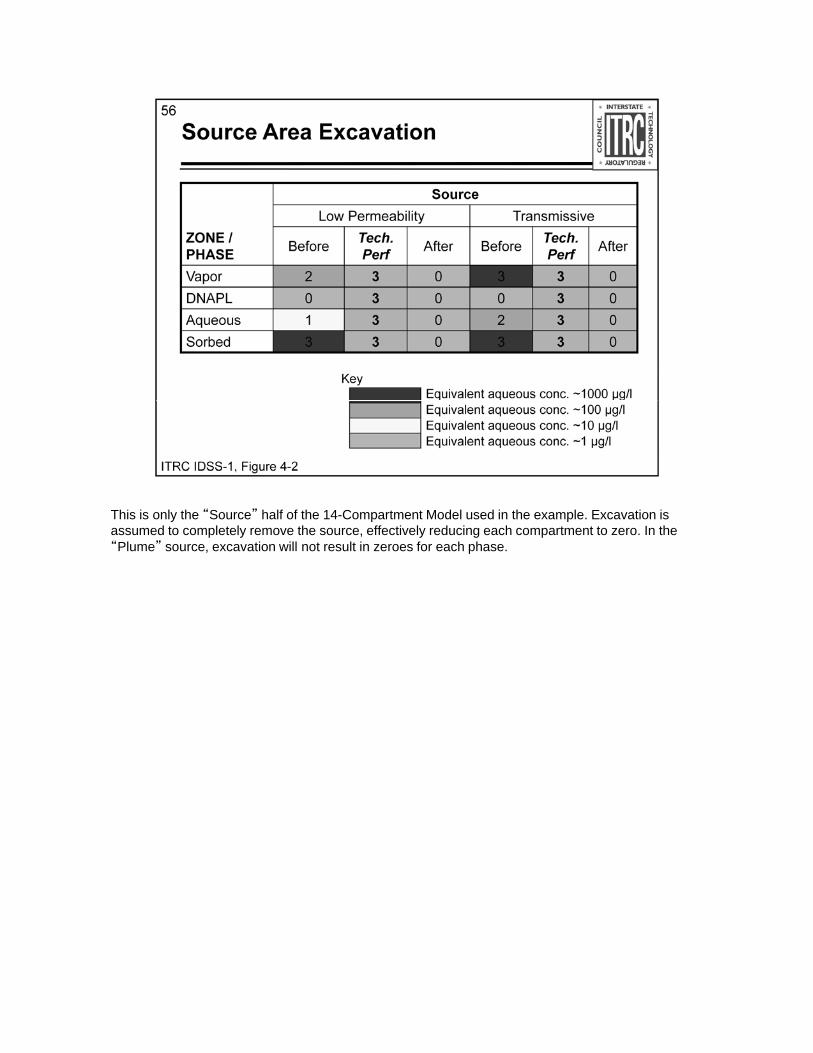
This is only the “Source” half of the 14-Compartment Model used in the example. Excavation is d t l t l th ff ti l d i h t t t I thassumed to completely remove the source, effectively reducing each compartment to zero. In the
“Plume” source, excavation will not result in zeroes for each phase.
No associated notes.
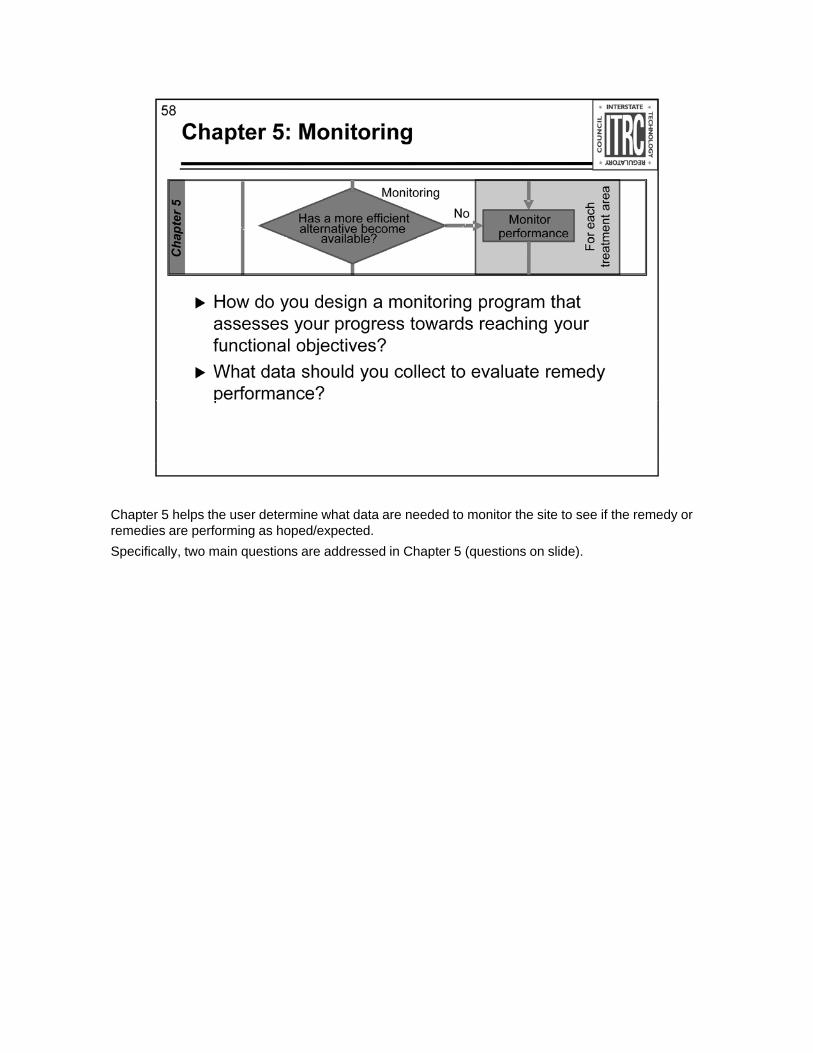
Chapter 5 helps the user determine what data are needed to monitor the site to see if the remedy or di f i h d/ t dremedies are performing as hoped/expected.
Specifically, two main questions are addressed in Chapter 5 (questions on slide).
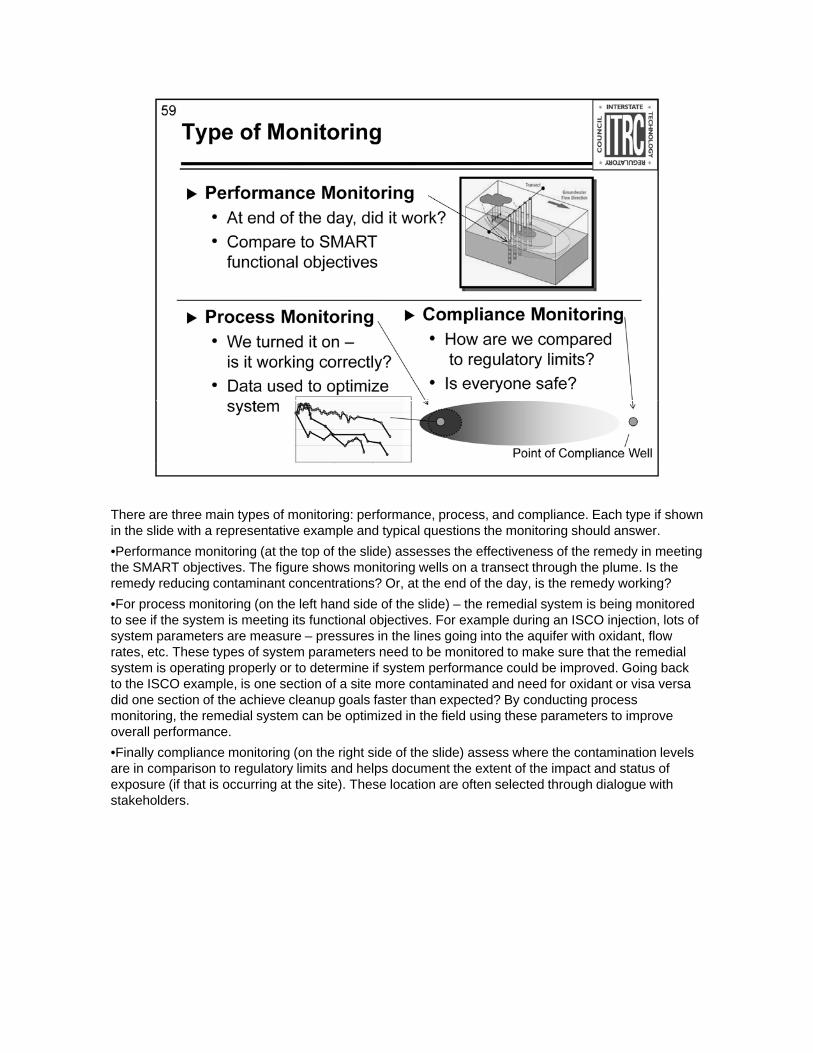
There are three main types of monitoring: performance, process, and compliance. Each type if shown i th lid ith t ti l d t i l ti th it i h ldin the slide with a representative example and typical questions the monitoring should answer.
•Performance monitoring (at the top of the slide) assesses the effectiveness of the remedy in meeting the SMART objectives. The figure shows monitoring wells on a transect through the plume. Is the remedy reducing contaminant concentrations? Or, at the end of the day, is the remedy working?
•For process monitoring (on the left hand side of the slide) – the remedial system is being monitored to see if the system is meeting its functional objectives. For example during an ISCO injection, lots of system parameters are measure – pressures in the lines going into the aquifer with oxidant, flow rates etc These types of system parameters need to be monitored to make sure that the remedialrates, etc. These types of system parameters need to be monitored to make sure that the remedial system is operating properly or to determine if system performance could be improved. Going back to the ISCO example, is one section of a site more contaminated and need for oxidant or visa versa did one section of the achieve cleanup goals faster than expected? By conducting process monitoring, the remedial system can be optimized in the field using these parameters to improve overall performance.
•Finally compliance monitoring (on the right side of the slide) assess where the contamination levels are in comparison to regulatory limits and helps document the extent of the impact and status of exposure (if that is occurring at the site). These location are often selected through dialogue with stakeholders.
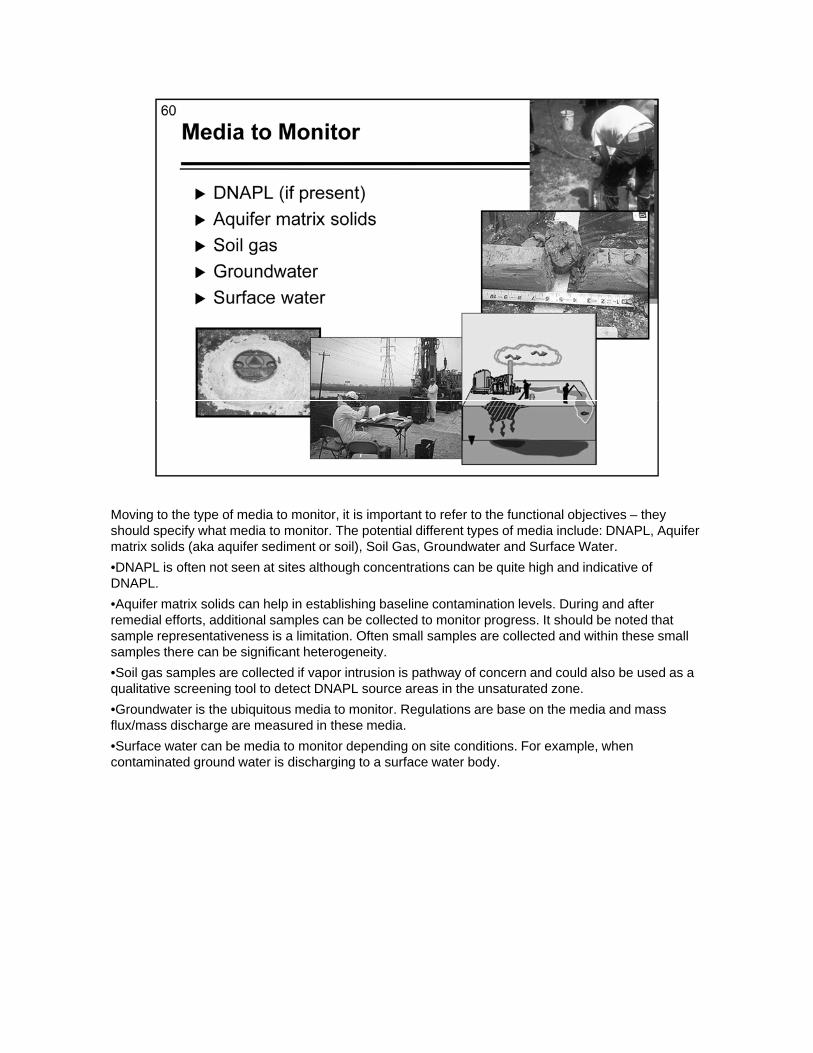
Moving to the type of media to monitor, it is important to refer to the functional objectives – they h ld if h t di t it Th t ti l diff t t f di i l d DNAPL A ifshould specify what media to monitor. The potential different types of media include: DNAPL, Aquifer
matrix solids (aka aquifer sediment or soil), Soil Gas, Groundwater and Surface Water.
•DNAPL is often not seen at sites although concentrations can be quite high and indicative of DNAPL.
•Aquifer matrix solids can help in establishing baseline contamination levels. During and after remedial efforts, additional samples can be collected to monitor progress. It should be noted that sample representativeness is a limitation. Often small samples are collected and within these small samples there can be significant heterogeneitysamples there can be significant heterogeneity.
•Soil gas samples are collected if vapor intrusion is pathway of concern and could also be used as a qualitative screening tool to detect DNAPL source areas in the unsaturated zone.
•Groundwater is the ubiquitous media to monitor. Regulations are base on the media and mass flux/mass discharge are measured in these media.
•Surface water can be media to monitor depending on site conditions. For example, when contaminated ground water is discharging to a surface water body.
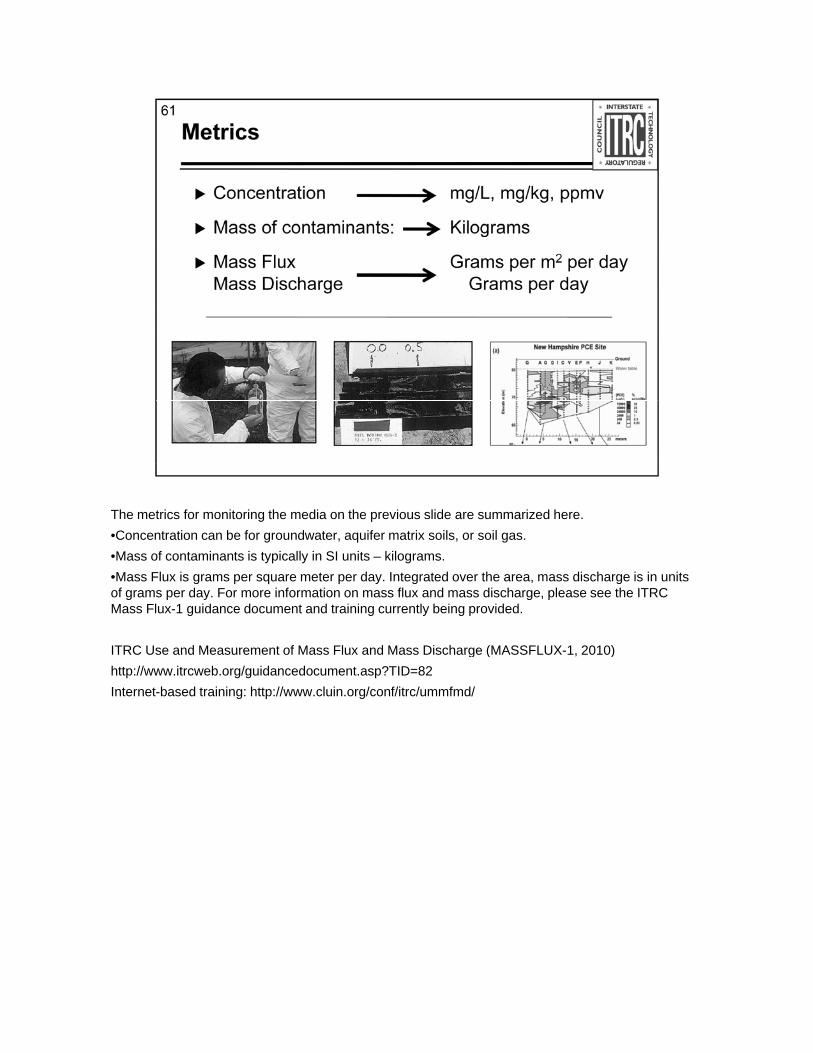
The metrics for monitoring the media on the previous slide are summarized here.
•Concentration can be for groundwater, aquifer matrix soils, or soil gas.
•Mass of contaminants is typically in SI units – kilograms.
•Mass Flux is grams per square meter per day. Integrated over the area, mass discharge is in units of grams per day. For more information on mass flux and mass discharge, please see the ITRC Mass Flux-1 guidance document and training currently being provided.
ITRC Use and Measurement of Mass Flux and Mass Discharge (MASSFLUX-1 2010)ITRC Use and Measurement of Mass Flux and Mass Discharge (MASSFLUX 1, 2010)
http://www.itrcweb.org/guidancedocument.asp?TID=82
Internet-based training: http://www.cluin.org/conf/itrc/ummfmd/
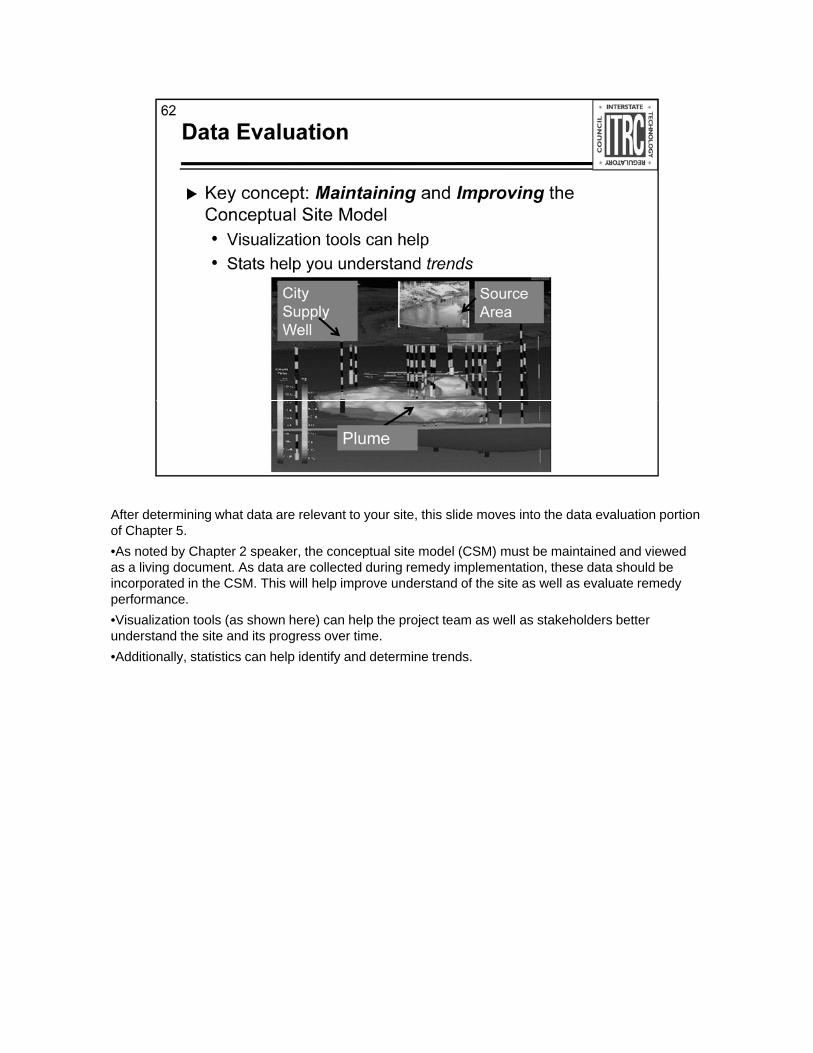
After determining what data are relevant to your site, this slide moves into the data evaluation portion f Ch t 5of Chapter 5.
•As noted by Chapter 2 speaker, the conceptual site model (CSM) must be maintained and viewed as a living document. As data are collected during remedy implementation, these data should be incorporated in the CSM. This will help improve understand of the site as well as evaluate remedy performance.
•Visualization tools (as shown here) can help the project team as well as stakeholders better understand the site and its progress over time.
Additi ll t ti ti h l id tif d d t i t d•Additionally, statistics can help identify and determine trends.
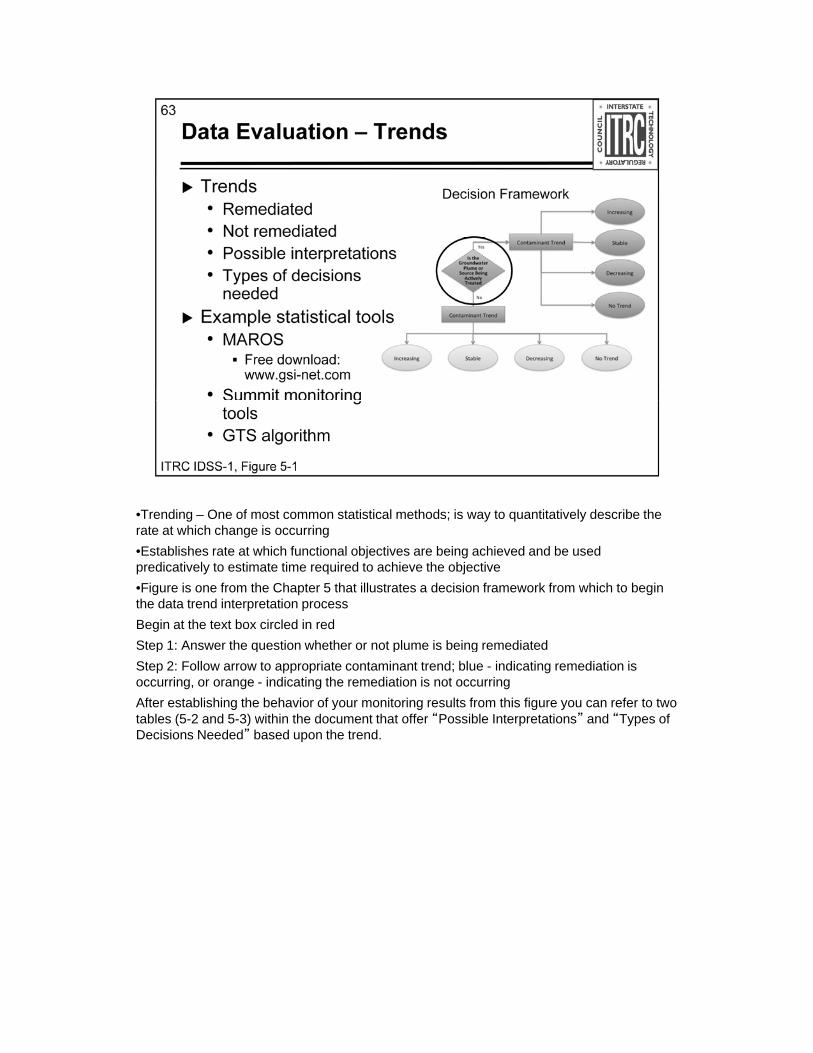
•Trending – One of most common statistical methods; is way to quantitatively describe the t t hi h h i irate at which change is occurring
•Establishes rate at which functional objectives are being achieved and be used predicatively to estimate time required to achieve the objective
•Figure is one from the Chapter 5 that illustrates a decision framework from which to begin the data trend interpretation process
Begin at the text box circled in red
Step 1: Answer the question whether or not plume is being remediated p q p g
Step 2: Follow arrow to appropriate contaminant trend; blue - indicating remediation is occurring, or orange - indicating the remediation is not occurring
After establishing the behavior of your monitoring results from this figure you can refer to two tables (5-2 and 5-3) within the document that offer “Possible Interpretations” and “Types of Decisions Needed” based upon the trend.
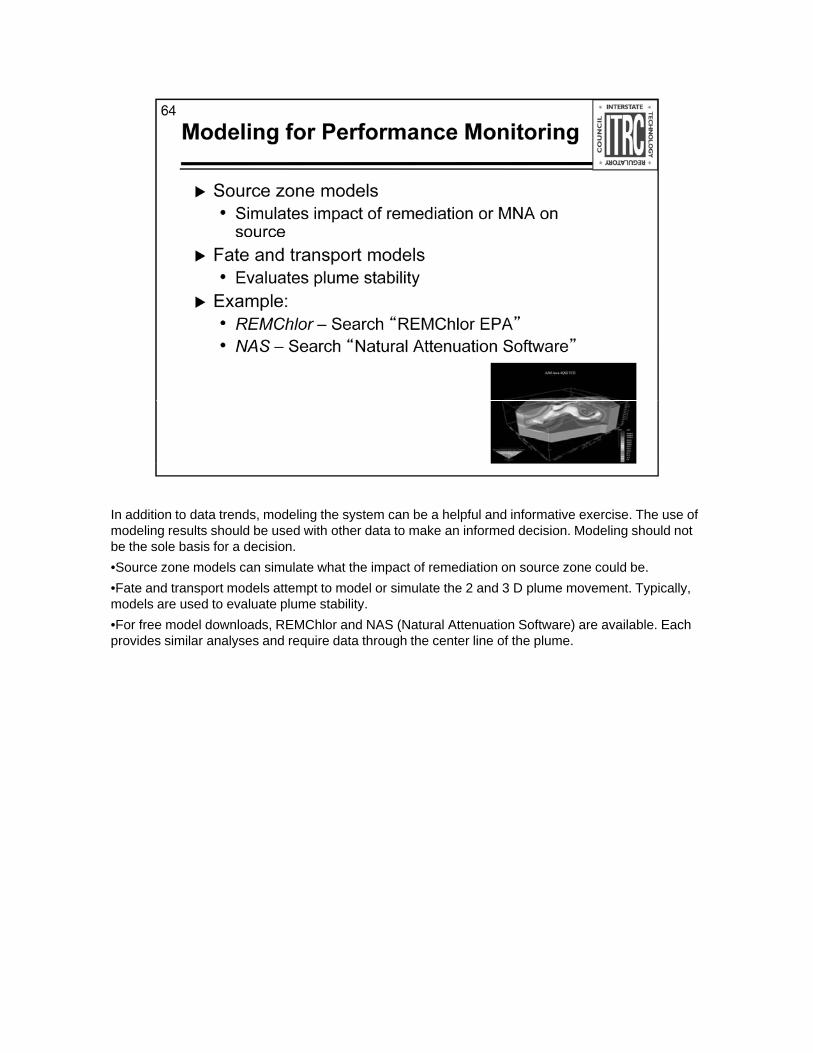
In addition to data trends, modeling the system can be a helpful and informative exercise. The use of d li lt h ld b d ith th d t t k i f d d i i M d li h ld tmodeling results should be used with other data to make an informed decision. Modeling should not
be the sole basis for a decision.
•Source zone models can simulate what the impact of remediation on source zone could be.
•Fate and transport models attempt to model or simulate the 2 and 3 D plume movement. Typically, models are used to evaluate plume stability.
•For free model downloads, REMChlor and NAS (Natural Attenuation Software) are available. Each provides similar analyses and require data through the center line of the plume.
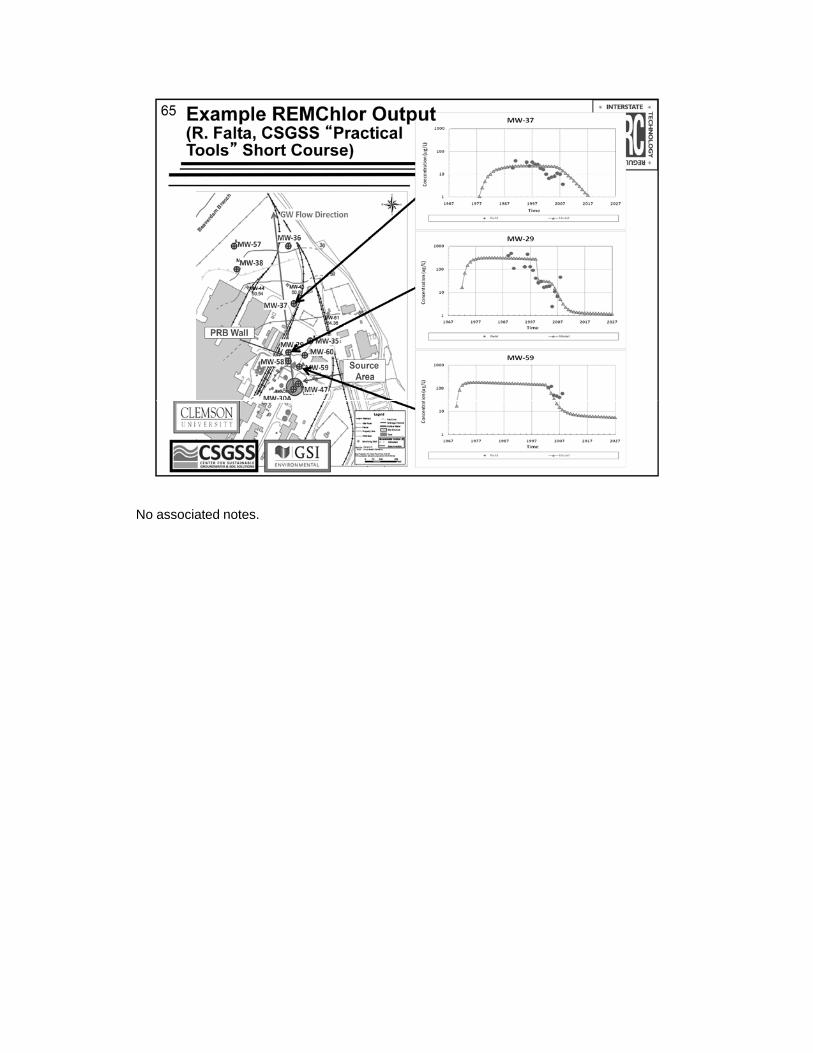
No associated notes.
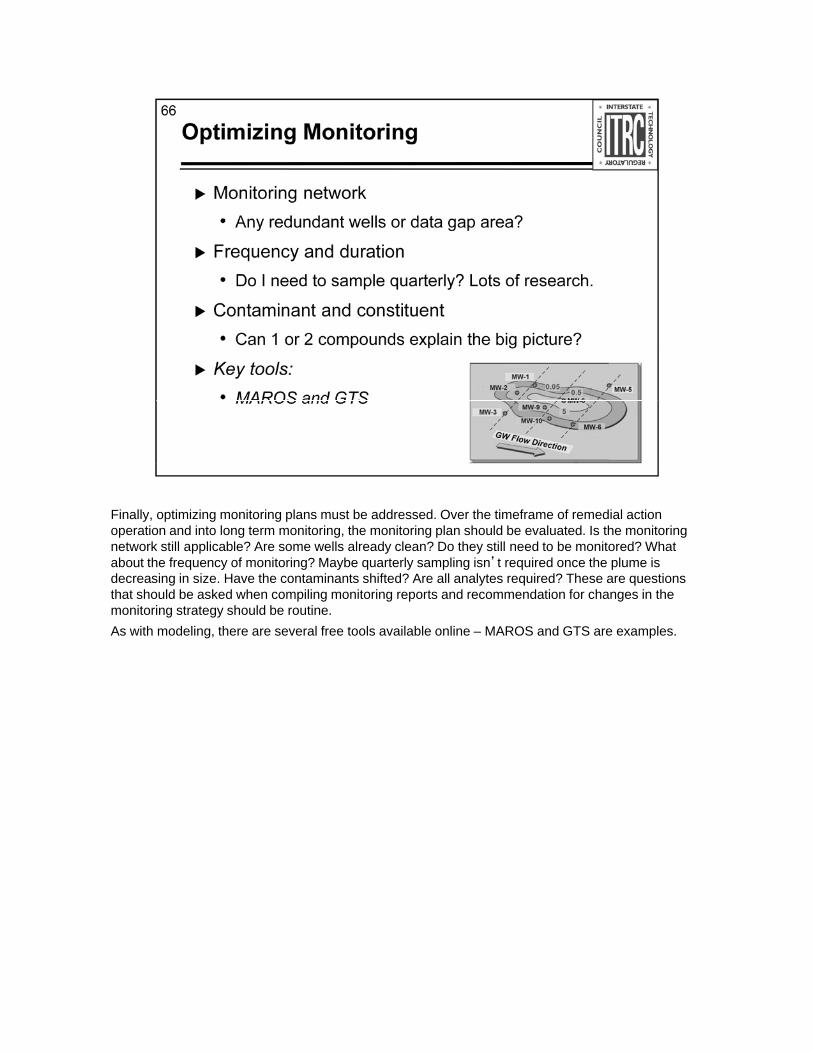
Finally, optimizing monitoring plans must be addressed. Over the timeframe of remedial action ti d i t l t it i th it i l h ld b l t d I th it ioperation and into long term monitoring, the monitoring plan should be evaluated. Is the monitoring
network still applicable? Are some wells already clean? Do they still need to be monitored? What about the frequency of monitoring? Maybe quarterly sampling isn’t required once the plume is decreasing in size. Have the contaminants shifted? Are all analytes required? These are questions that should be asked when compiling monitoring reports and recommendation for changes in the monitoring strategy should be routine.
As with modeling, there are several free tools available online – MAROS and GTS are examples.
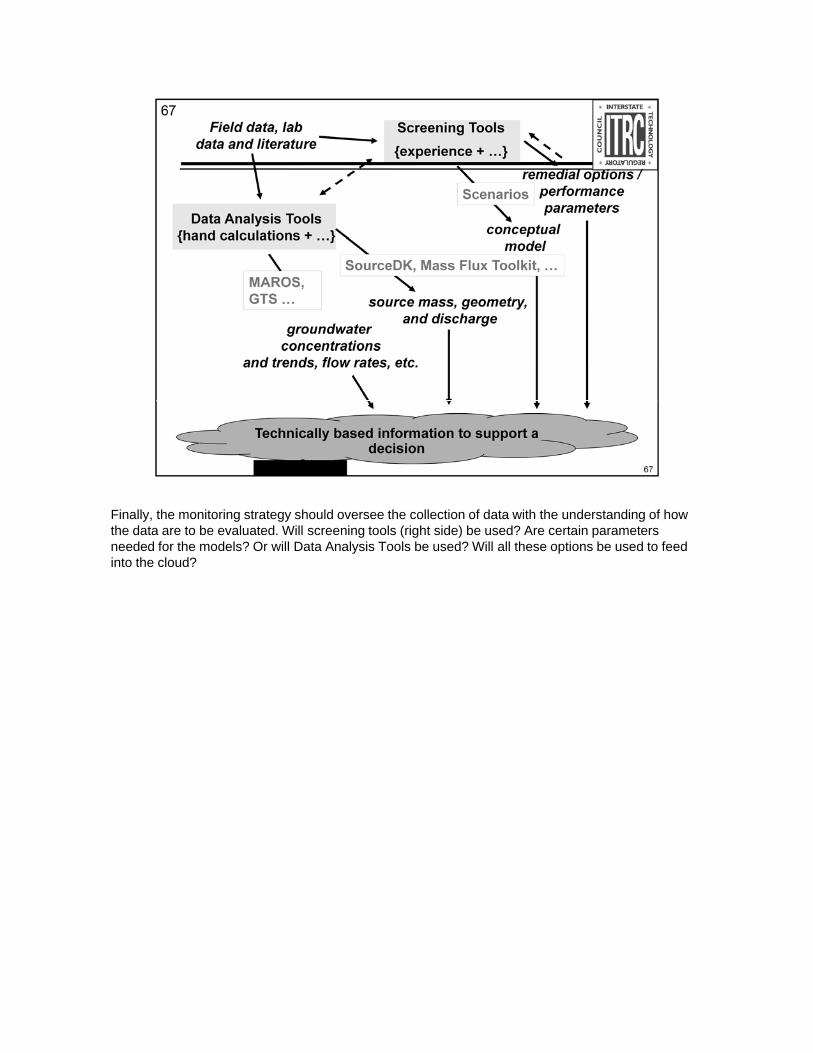
Finally, the monitoring strategy should oversee the collection of data with the understanding of how th d t t b l t d Will i t l ( i ht id ) b d? A t i tthe data are to be evaluated. Will screening tools (right side) be used? Are certain parameters needed for the models? Or will Data Analysis Tools be used? Will all these options be used to feed into the cloud?
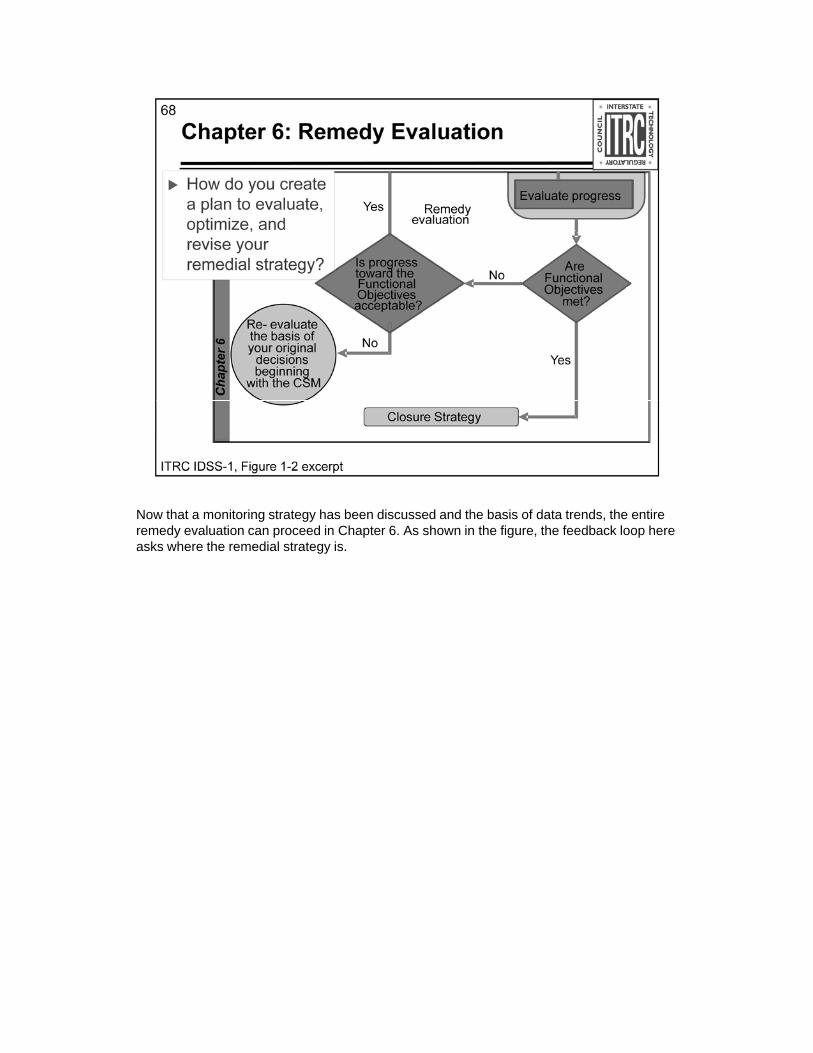
Now that a monitoring strategy has been discussed and the basis of data trends, the entire d l ti d i Ch t 6 A h i th fi th f db k l hremedy evaluation can proceed in Chapter 6. As shown in the figure, the feedback loop here
asks where the remedial strategy is.
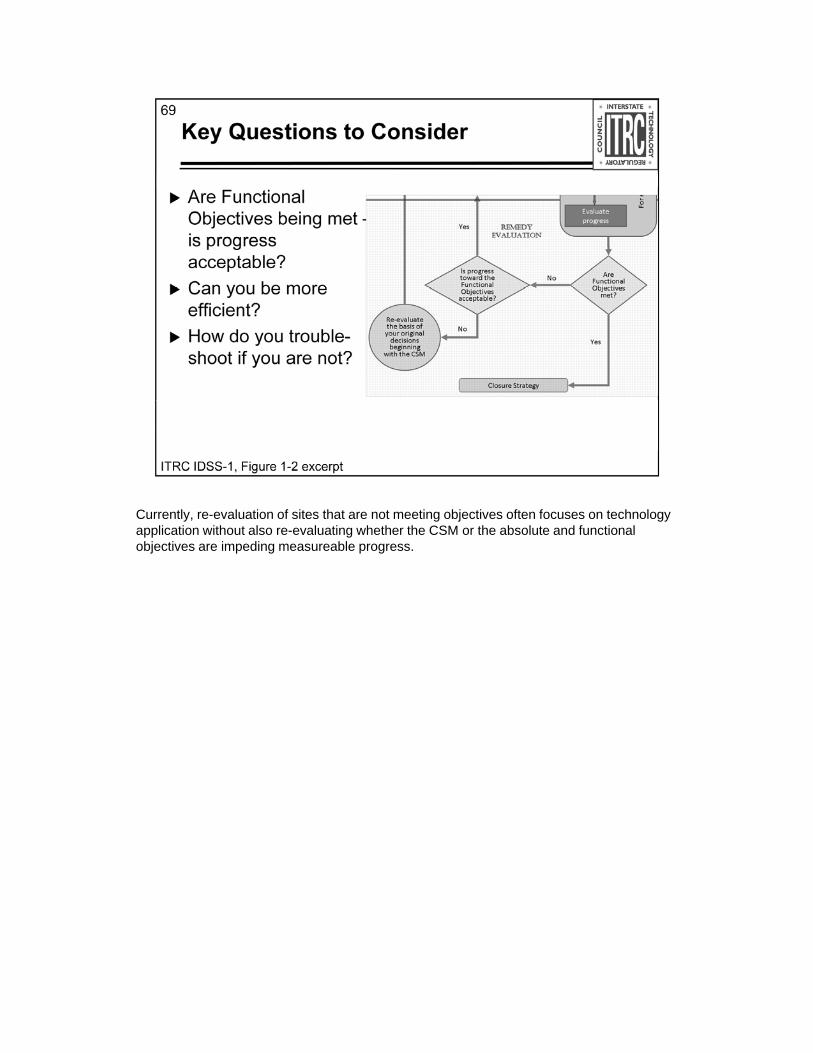
Currently, re-evaluation of sites that are not meeting objectives often focuses on technology li ti ith t l l ti h th th CSM th b l t d f ti lapplication without also re-evaluating whether the CSM or the absolute and functional
objectives are impeding measureable progress.
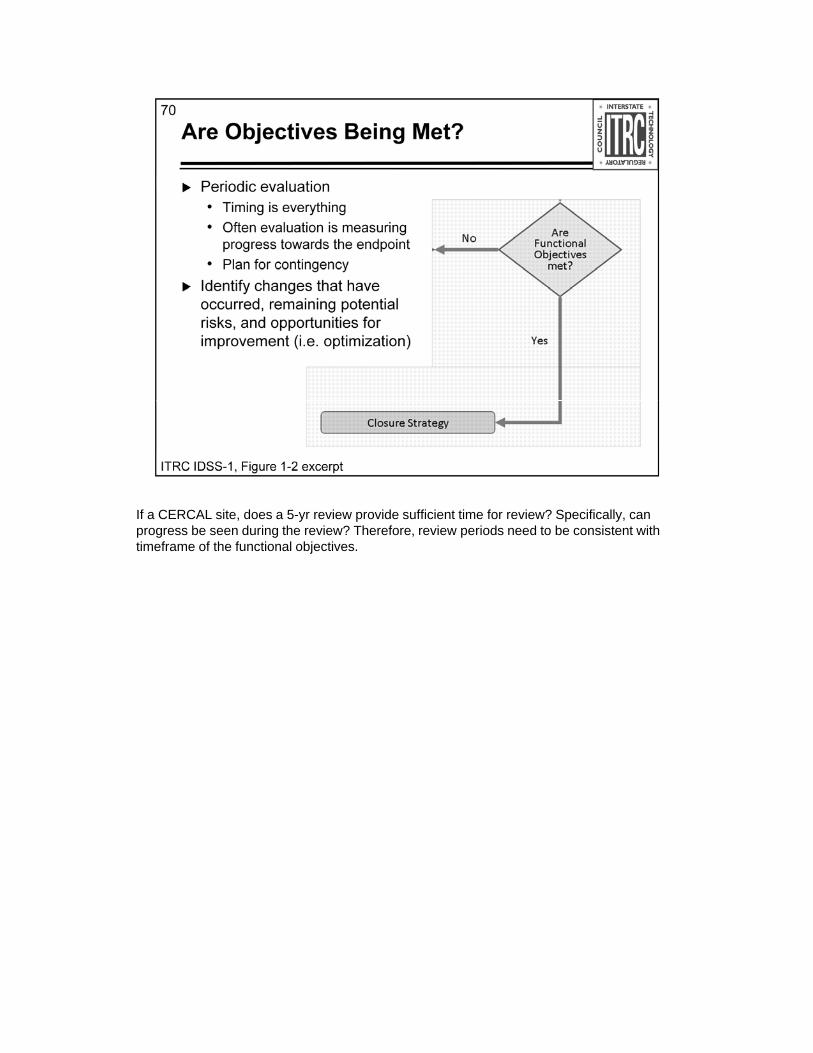
If a CERCAL site, does a 5-yr review provide sufficient time for review? Specifically, can b d i th i ? Th f i i d d t b i t t ithprogress be seen during the review? Therefore, review periods need to be consistent with
timeframe of the functional objectives.
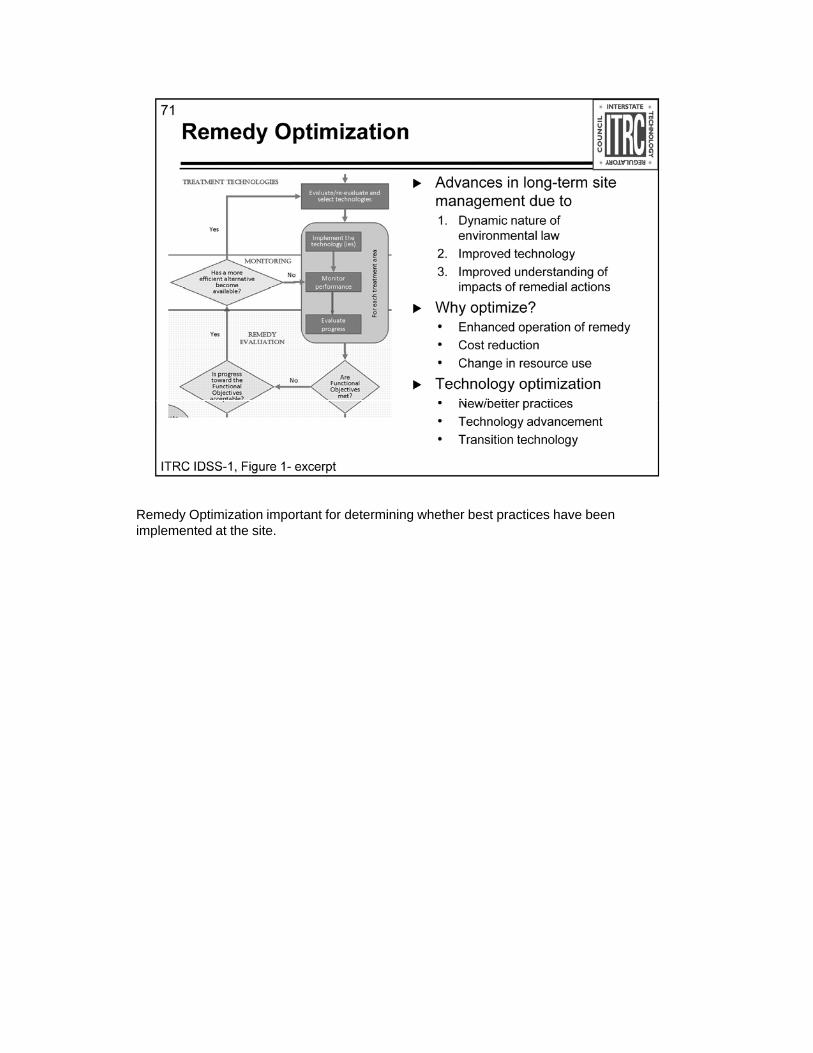
Remedy Optimization important for determining whether best practices have been i l t d t th itimplemented at the site.
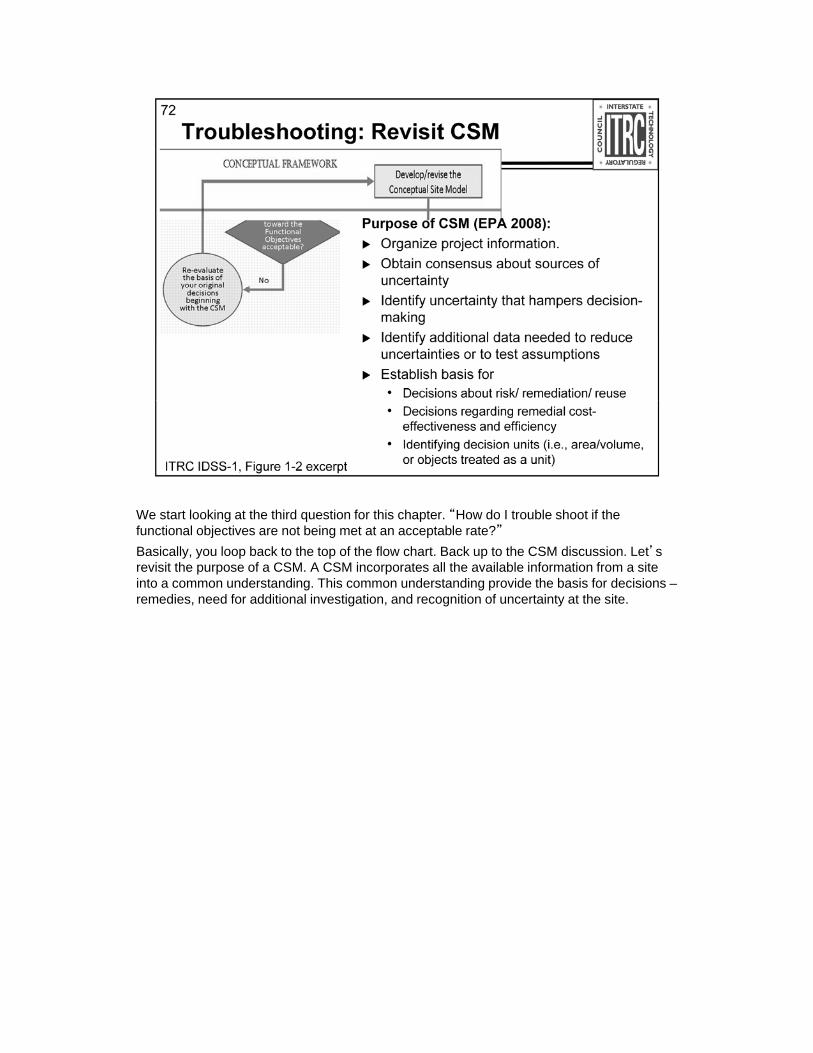
We start looking at the third question for this chapter. “How do I trouble shoot if the f ti l bj ti t b i t t t bl t ?”functional objectives are not being met at an acceptable rate?”
Basically, you loop back to the top of the flow chart. Back up to the CSM discussion. Let’s revisit the purpose of a CSM. A CSM incorporates all the available information from a site into a common understanding. This common understanding provide the basis for decisions –remedies, need for additional investigation, and recognition of uncertainty at the site.
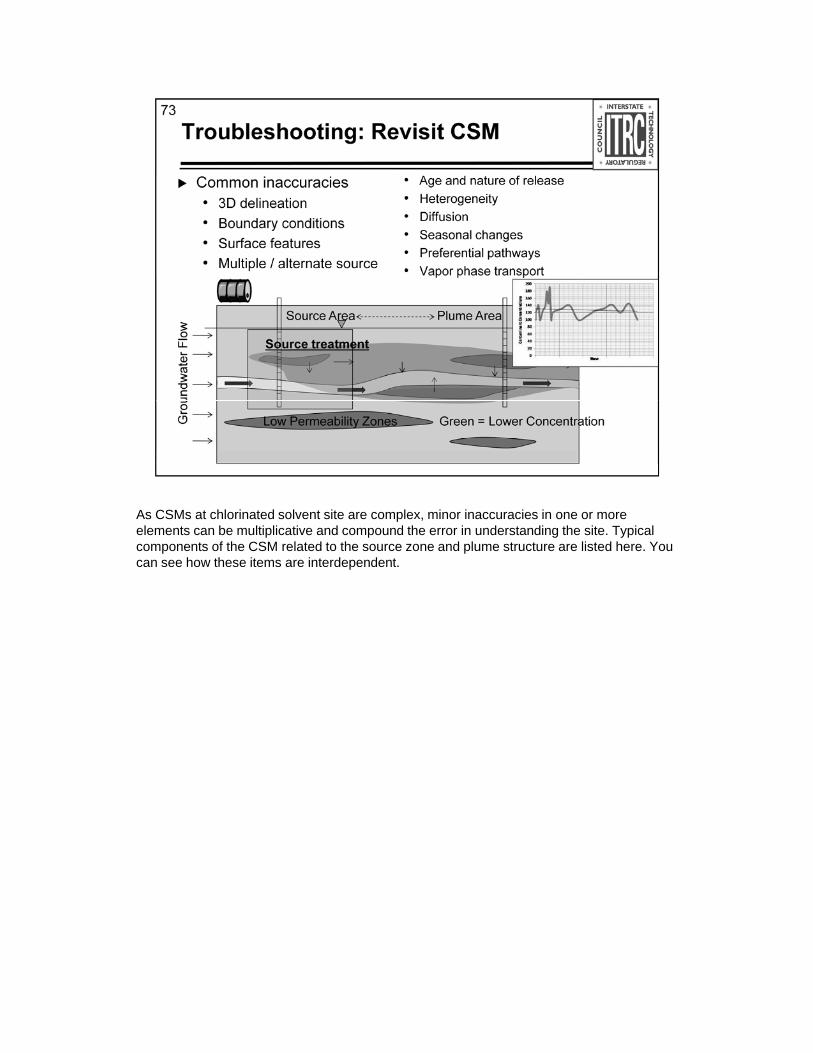
As CSMs at chlorinated solvent site are complex, minor inaccuracies in one or more l t b lti li ti d d th i d t di th it T i lelements can be multiplicative and compound the error in understanding the site. Typical
components of the CSM related to the source zone and plume structure are listed here. You can see how these items are interdependent.
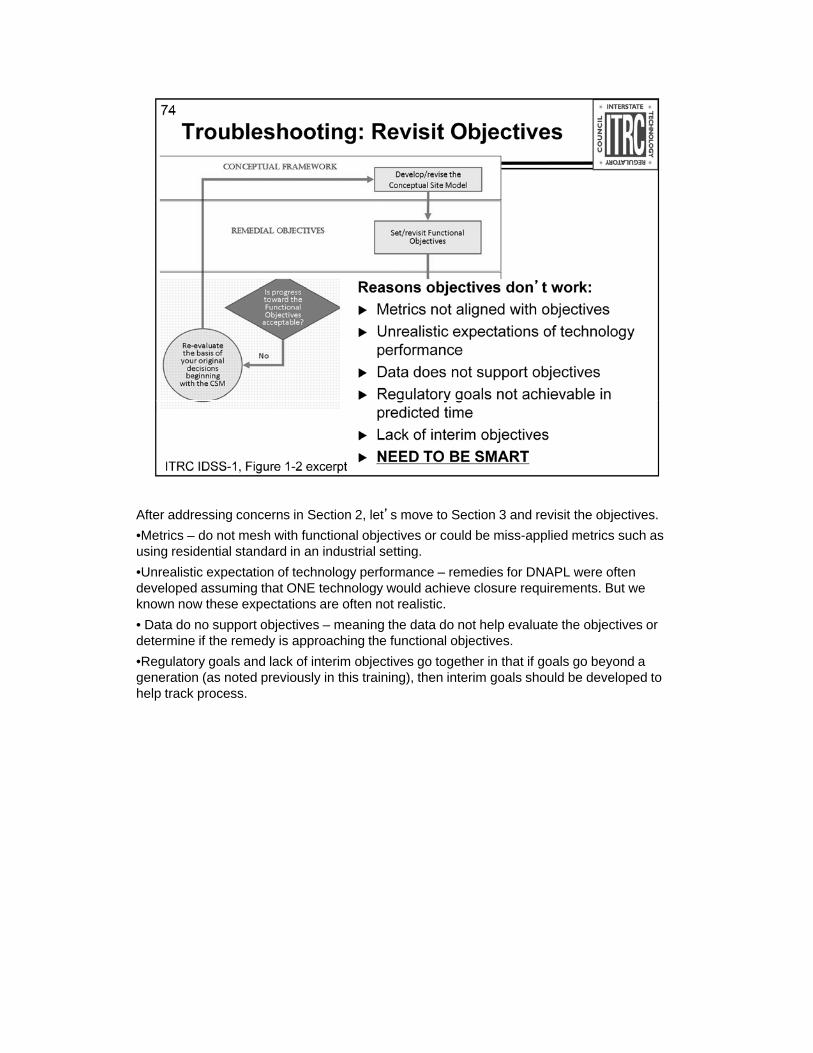
After addressing concerns in Section 2, let’s move to Section 3 and revisit the objectives.
•Metrics – do not mesh with functional objectives or could be miss-applied metrics such as using residential standard in an industrial setting.
•Unrealistic expectation of technology performance – remedies for DNAPL were often developed assuming that ONE technology would achieve closure requirements. But we known now these expectations are often not realistic.
• Data do no support objectives – meaning the data do not help evaluate the objectives or determine if the remedy is approaching the functional objectives.
•Regulatory goals and lack of interim objectives go together in that if goals go beyond a generation (as noted previously in this training), then interim goals should be developed to help track process.
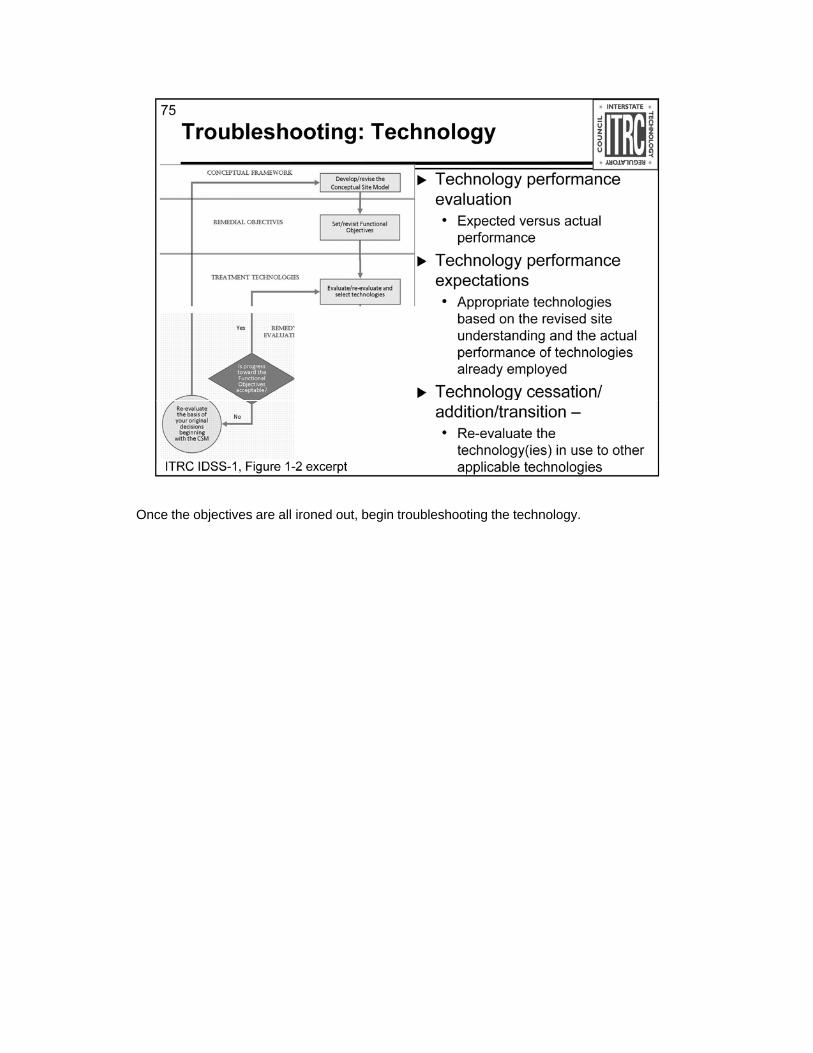
Once the objectives are all ironed out, begin troubleshooting the technology.
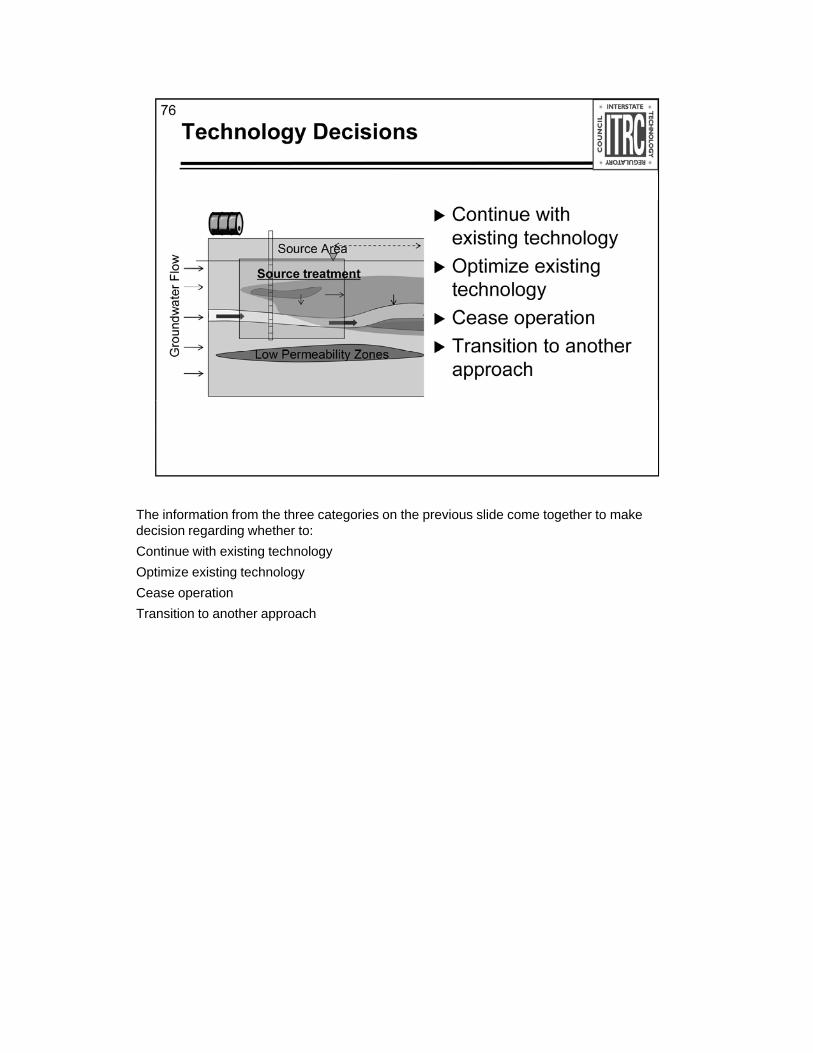
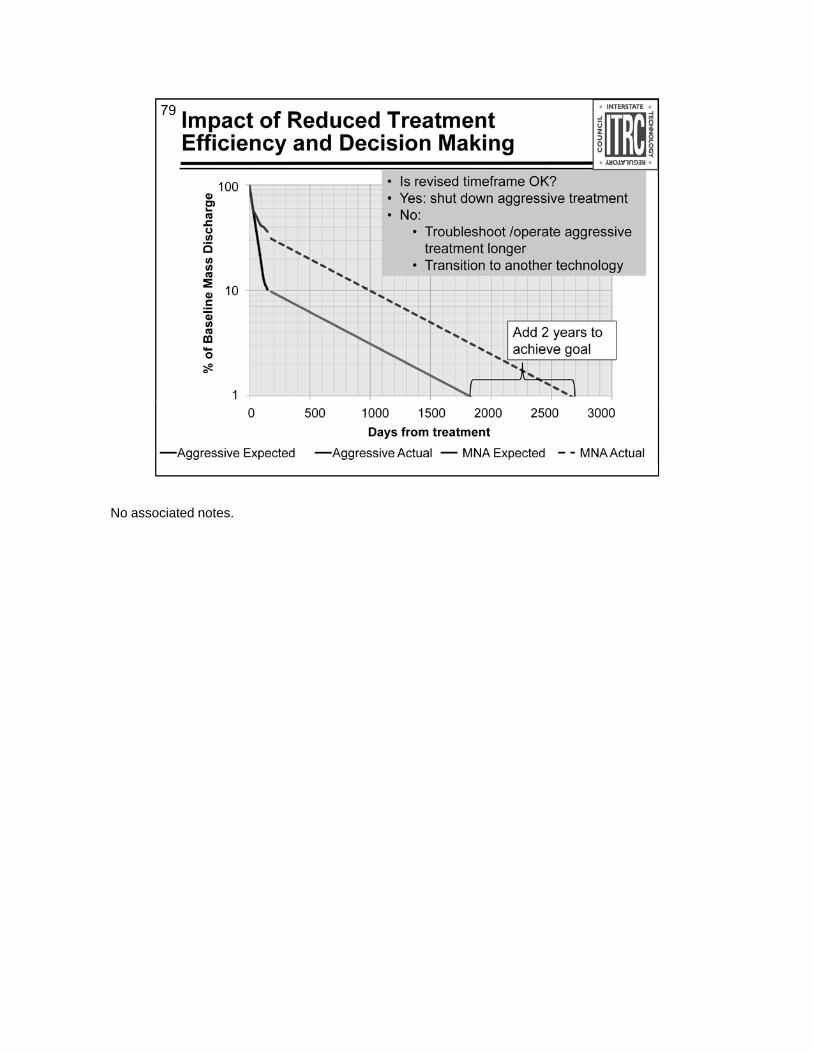
The information from the three categories on the previous slide come together to make d i i di h th tdecision regarding whether to:
Continue with existing technology
Optimize existing technology
Cease operation
Transition to another approach
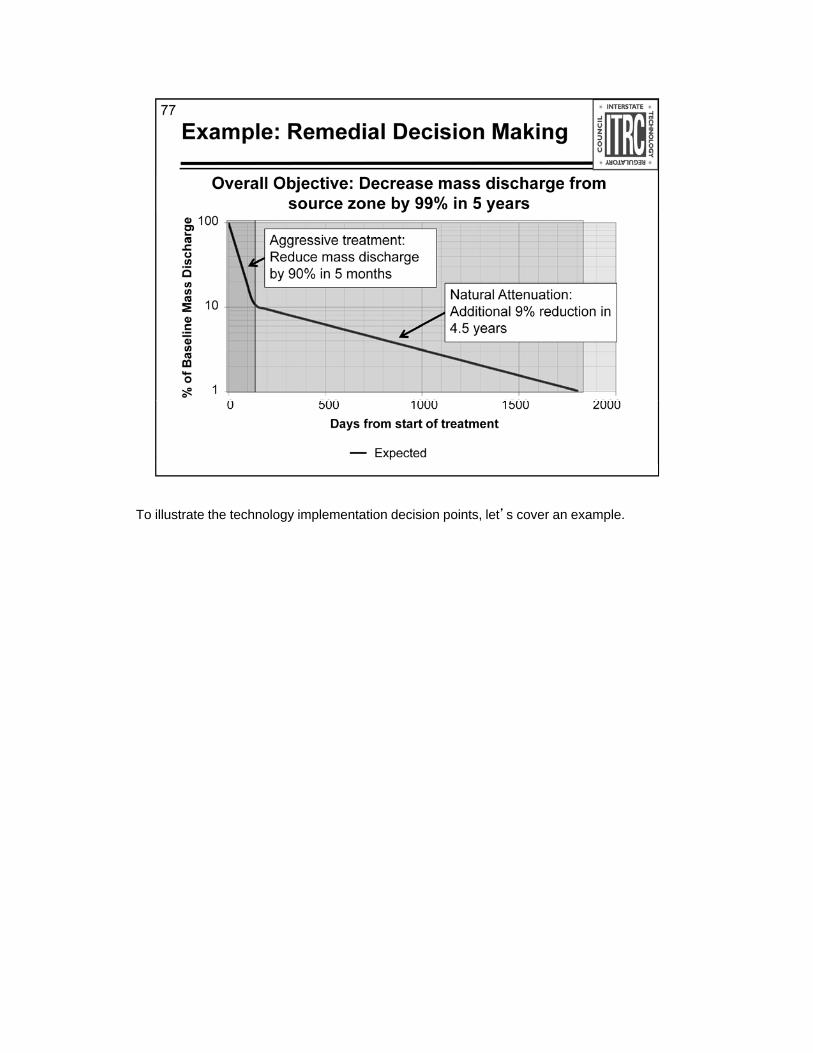
To illustrate the technology implementation decision points, let’s cover an example.
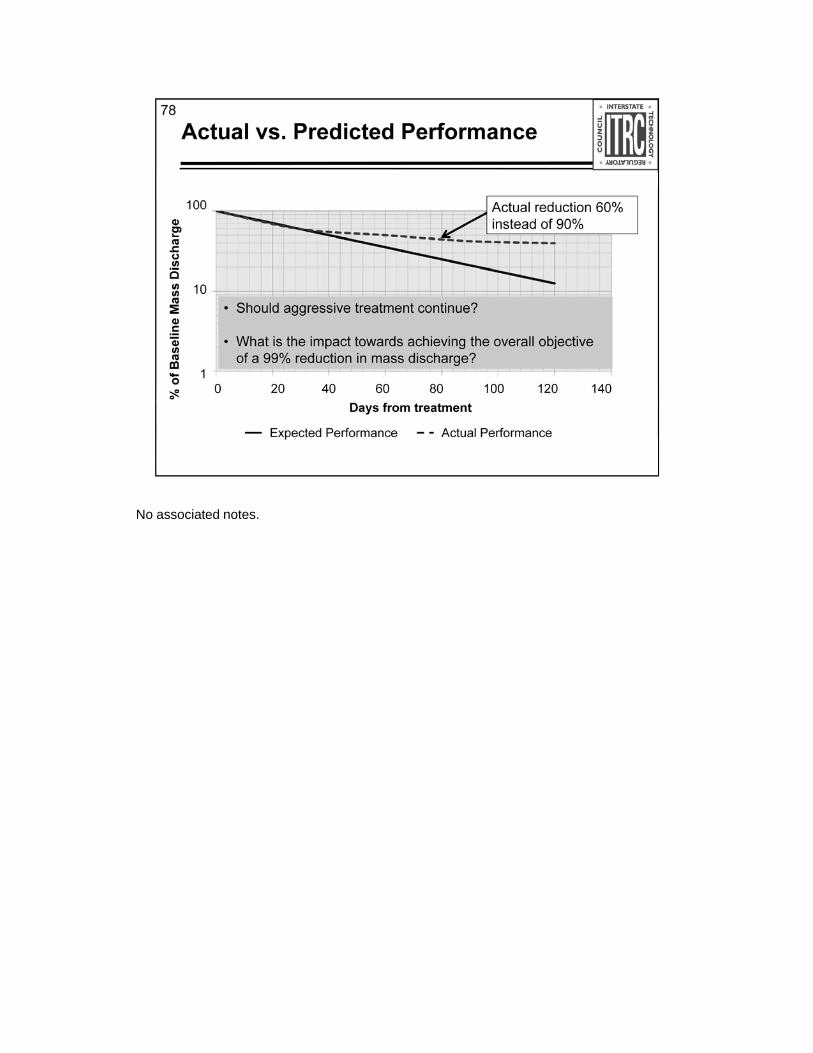
No associated notes.
No associated notes.
No associated notes.
80
No associated notes.
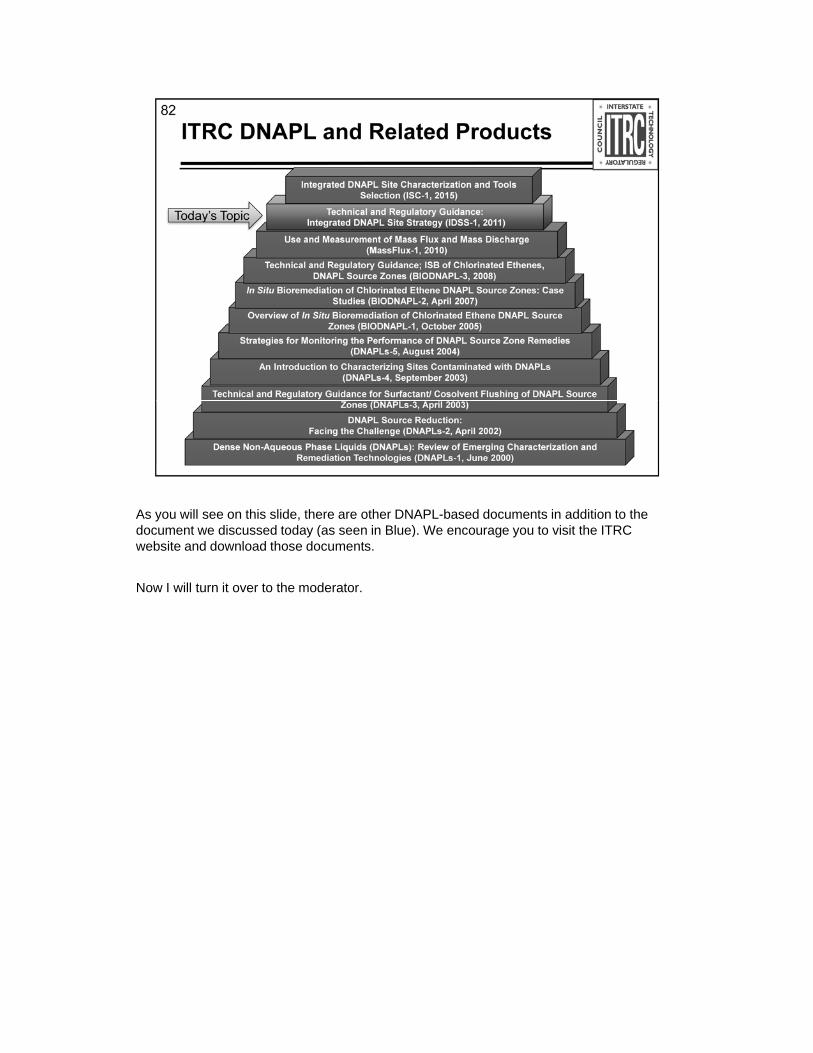
As you will see on this slide, there are other DNAPL-based documents in addition to the d t di d t d ( i Bl ) W t i it th ITRCdocument we discussed today (as seen in Blue). We encourage you to visit the ITRC website and download those documents.
Now I will turn it over to the moderator.
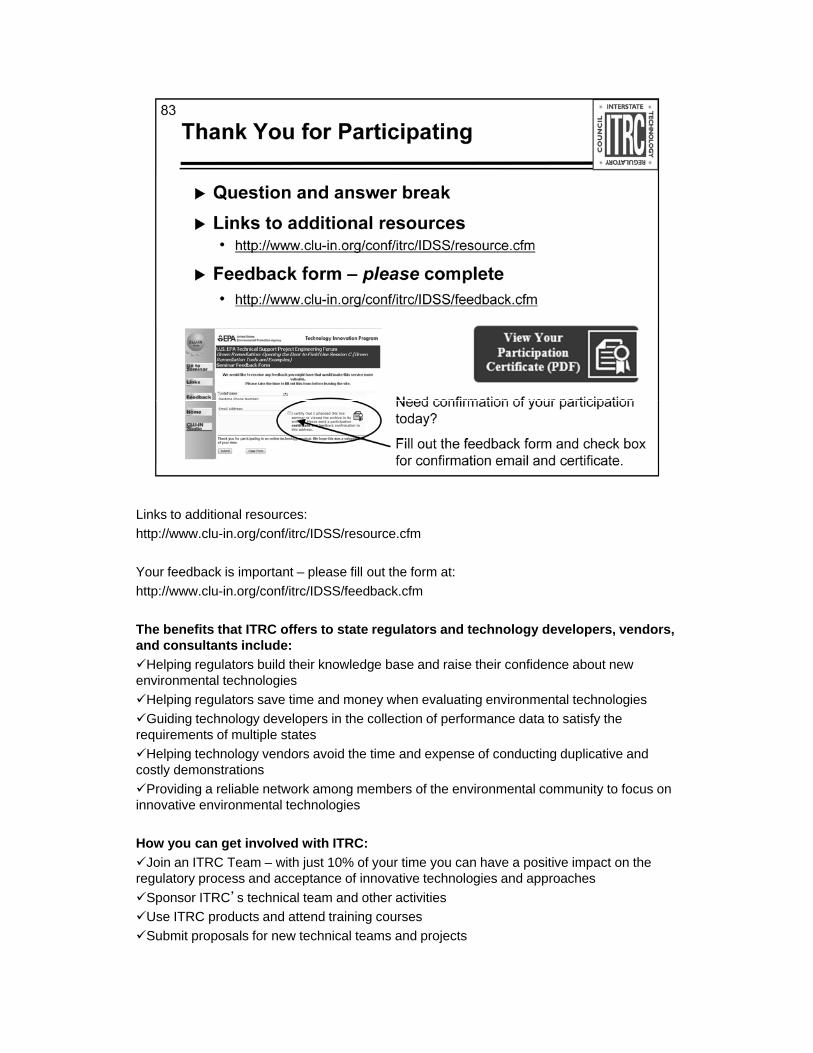
Links to additional resources:
http://www.clu-in.org/conf/itrc/IDSS/resource.cfm
Your feedback is important – please fill out the form at:
http://www.clu-in.org/conf/itrc/IDSS/feedback.cfm
The benefits that ITRC offers to state regulators and technology developers, vendors, and consultants include:
Helping regulators build their knowledge base and raise their confidence about new environmental technologies
Helping regulators save time and money when evaluating environmental technologies
Guiding technology developers in the collection of performance data to satisfy the requirements of multiple states
Helping technology vendors avoid the time and expense of conducting duplicative and costly demonstrations
Providing a reliable network among members of the environmental community to focus on innovative environmental technologies
How you can get involved with ITRC:
Join an ITRC Team – with just 10% of your time you can have a positive impact on the regulatory process and acceptance of innovative technologies and approaches
Sponsor ITRC’s technical team and other activitiesp
Use ITRC products and attend training courses
Submit proposals for new technical teams and projects


![FD21-50 wind turbine-20150630.ppt [兼容模式] · 2015-06-30 · 1.0 Design Features FD21 50 id t hihliht Ghrepower’s 50kW wind system is a gearless, direct drive permanent magnet](https://static.fdocuments.us/doc/165x107/5e9fcccb9218907dcb0bc50a/fd21-50-wind-turbine-2015-06-30-10-design-features-fd21-50-id.jpg)


![Intelligent Decision Support Systemsmiquel/idss/IDSS-Part 2-MAI-1112.pdf · Intelligent Decision Support Systems (IDSS) [90s] ... An IEDSS is an intelligent information system that](https://static.fdocuments.us/doc/165x107/5f0913f67e708231d4252044/intelligent-decision-support-systems-miquelidssidss-part-2-mai-1112pdf-intelligent.jpg)


