ITP Metal Casting: Energy and Environmental Profile of … · Energy and Environmental Profile of...
113
Energy and Environmental Profile of the U.S. Metalcasting Industry September 1999 Prepared by Energetics, Incorporated Prepared for U.S. Department of Energy Office of Industrial Technologies
Transcript of ITP Metal Casting: Energy and Environmental Profile of … · Energy and Environmental Profile of...
Energy and Environmental Profile of the
U.S. Metalcasting Industry
September 1999
Prepared by
Energetics, Incorporated
Prepared for
U.S. Department of EnergyOffice of Industrial Technologies

ACKNOWLEDGMENTS
This report was written by Nancy Margolis, Keith Jamison and Louise Dove of Energetics, Incorporated inColumbia, Maryland. The report was prepared under the general direction of Louis Sousa, U.S.Department of Energy, Office of Industrial Technologies (OIT), and Harvey Wong, Team Leader of OIT’sMetalcasting Team. Technical guidance was provided by John Svoboda, Process Metallurgy International,Inc. The authors would also like thank the following reviewers:
Dwight BarnhardSuperior Aluminum Castings, Inc.
Malcolm BlairSteel Founders’ Society of America
Raymond DonahueBrunswick Corporation
Dave KanickiModern Casting
Amy LucasWaterman & Associates
Paul MikkolaHitchiner Manufacturing Co.
Raymond MonroeSteel Founders’ Society of America
Gary MosherAmerican Foundrymen’s Society, Inc.
James OtiJohnson and Johnson Professional, Inc.
Steve RobersonAmerican Foundrymen’s Society, Inc.
Joseph SantnerAmerican Foundrymen’s Society, Inc.
Robert TrimbergerU.S. Department of Energy, Idaho Operations Office
Steve Udvardy North American Die Casting Association
Harry Ward Doehler-Jarvis (retired)

Table of Contents
1. Overview . . . . . . . . . . . . . . . . . . . . . . . . . . . . . . . . . . . . . . . . . . . . . . . . . . . . . . . . . . . . . 1
2. Moldmaking and Coremaking . . . . . . . . . . . . . . . . . . . . . . . . . . . . . . . . . . . . . . . . . . . 17
3. Cupola Melting Furnaces . . . . . . . . . . . . . . . . . . . . . . . . . . . . . . . . . . . . . . . . . . . . . . . 27
4. Electric Melting Furnaces . . . . . . . . . . . . . . . . . . . . . . . . . . . . . . . . . . . . . . . . . . . . . . 37
5. Fuel-Fired Melting Furnaces . . . . . . . . . . . . . . . . . . . . . . . . . . . . . . . . . . . . . . . . . . . . 51
6. Refining, Pouring, and Cooling . . . . . . . . . . . . . . . . . . . . . . . . . . . . . . . . . . . . . . . . . . 59
7. Cleaning and Finishing . . . . . . . . . . . . . . . . . . . . . . . . . . . . . . . . . . . . . . . . . . . . . . . . 69
8. Investment Casting . . . . . . . . . . . . . . . . . . . . . . . . . . . . . . . . . . . . . . . . . . . . . . . . . . . . 79
9. Lost Foam Casting . . . . . . . . . . . . . . . . . . . . . . . . . . . . . . . . . . . . . . . . . . . . . . . . . . . . 85
10. Die Casting . . . . . . . . . . . . . . . . . . . . . . . . . . . . . . . . . . . . . . . . . . . . . . . . . . . . . . . . . . 91
11. Other Casting Methods . . . . . . . . . . . . . . . . . . . . . . . . . . . . . . . . . . . . . . . . . . . . . . . . 99
References . . . . . . . . . . . . . . . . . . . . . . . . . . . . . . . . . . . . . . . . . . . . . . . . . . . . . . . . . . . 105
i

1
1.1 The Versatility of the Casting Process
Metalcasting has been described as “the most direct and shortest route from component design to production” (Kanicki 1994). Almost any metal that can be melted can also be cast, and the design of the casting can be extremely flexible.
The U.S. Department of Energy and theMetalcasting Industry of the Future
The U.S. Department of Energy’s (DOE’s) Office of Industrial Technologies has formed a partnership with the U.S. metalcasting industry to accelerate the development of technologies and processes that will improve the industry’s energy efficiency and environmental performance. This report is intended to support the DOE/metalcasting industry partnership.
Overview
This flexibility allows the metalcasting industry to produce simple or complex components of infinite variety, whether they are produced once as a prototype or thousands of times for use in a manufactured product. It is not surprising that metalcasting is chosen as the metal forming technique for 90% of all manufactured goods and for all machinery for manufacturing (Kanicki 1994).
In addition to producing components of larger products, foundries may also do machining, assembling, and coating of the castings. Among recognizable cast products are the engine blocks, transmission housings, and suspension parts of cars and trucks; undercarriages of farm and construction equipment; structural and metal fittings for appliances; and pipes and valves of plumbing fixtures and boilers. Figure 1-1 shows the distribution of products among various end-users.
1

Source: American Foundrymen’s Society 1998.
Figure 1-1. Casting End-use Markets (1997)
1.2 Casting Rebounds from a Two-Decade Decline
Metal casting is a mature industry that is important to the U.S. economy. Its shipments reached approximately 14.9 million tons in 1998, with sales valued at $28.3 billion (Kirgin 1998 and American Foundrymen’s Society [AFS] 1998).
In recent decades, the industry went through a long period of downsizing because of heightened foreign competition, decreases in the number and size of vehicles being manufactured, increased use of substitute materials for metals, and higher costs for environmental compliance. The casting industry’s production levels fell from 21.9 million tons in 1973 to 11.3 million in 1991, and metalcasters had closed a third of their foundries by the early 1990s.
Beginning this decade, however, there was heightened activity in domestic auto production and an increased demand from overseas for U.S. castings. The industry began to recover economically and in 1994 shipped its greatest volume of castings (14.6 million tons) since 1981. After a slight dip in production in 1995 and 1996
during a downturn in the economy, the industry regained its momentum. Overall, shipments have grown 25% since 1991, shown in Figure 1-2.
Several Slow Years Expected, Followed by Strong Growth
Despite a continued strong economy in the United States, a weakening global economy is expected to affect domestic shipments of metal castings. This is expected to result in a 2.7% decline in shipments in 1999 from 1998 levels to about 14.5 million tons (AFS 1998). Sales, however, are expected to increase slightly to $28.8 billion because of product mix changes (AFS 1998).
Continuing downturn is predicted for 2000 and 2001, followed by a period of strong growth between 2002 and 2008 (AFS 1998). It is estimated the metalcasting industry will grow 1.7% annually between 2001 and 2008, shipping nearly 17.7 million tons of casting in 2008. Casting sales will grow 4.7% per year during that period and will be worth nearly $45 billion in 2008, with lighter and more expensive castings dominating (Kirgin 1998 and AFS 1998).
Sources: American Foundrymen’s Society, modern casting, January 1998 and December 1997.
Figure 1-2. Total U.S. Casting Shipments (1991 - 1998)
2
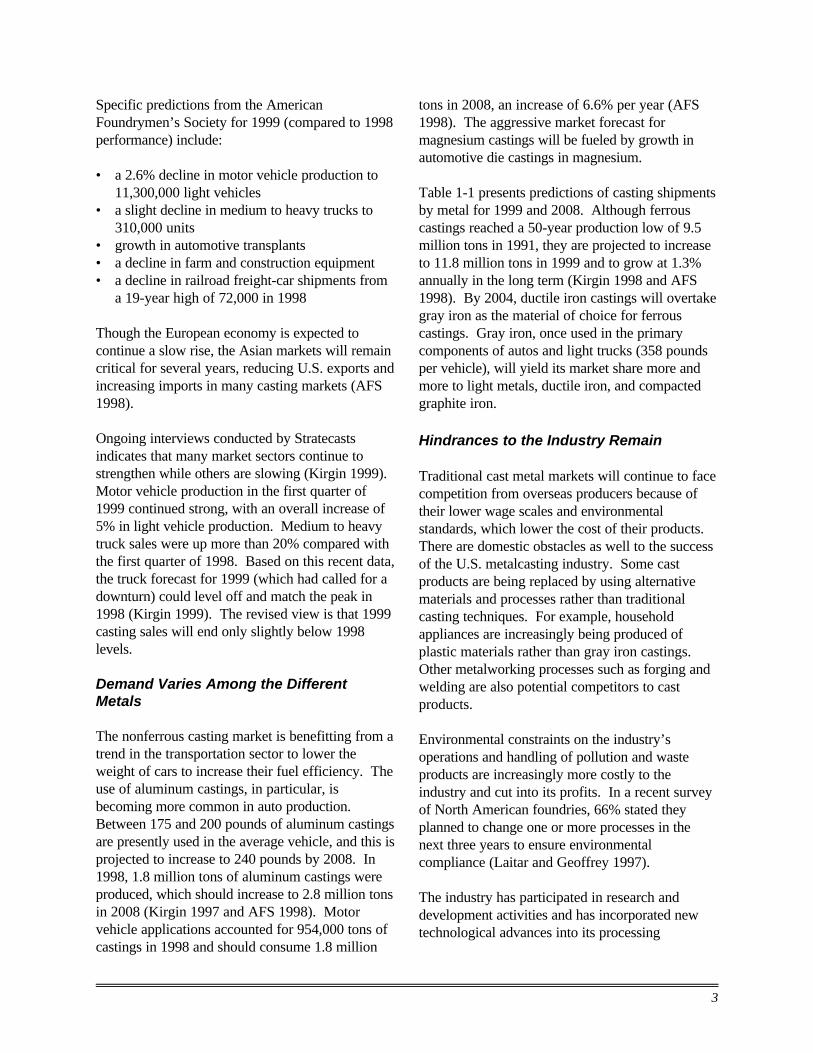
Specific predictions from the American Foundrymen’s Society for 1999 (compared to 1998 performance) include:
• a 2.6% decline in motor vehicle production to 11,300,000 light vehicles
• a slight decline in medium to heavy trucks to 310,000 units
• growth in automotive transplants • a decline in farm and construction equipment • a decline in railroad freight-car shipments from
a 19-year high of 72,000 in 1998
Though the European economy is expected to continue a slow rise, the Asian markets will remain critical for several years, reducing U.S. exports and increasing imports in many casting markets (AFS 1998).
Ongoing interviews conducted by Stratecasts indicates that many market sectors continue to strengthen while others are slowing (Kirgin 1999). Motor vehicle production in the first quarter of 1999 continued strong, with an overall increase of 5% in light vehicle production. Medium to heavy truck sales were up more than 20% compared with the first quarter of 1998. Based on this recent data, the truck forecast for 1999 (which had called for a downturn) could level off and match the peak in 1998 (Kirgin 1999). The revised view is that 1999 casting sales will end only slightly below 1998 levels.
Demand Varies Among the Different Metals
The nonferrous casting market is benefitting from a trend in the transportation sector to lower the weight of cars to increase their fuel efficiency. The use of aluminum castings, in particular, is becoming more common in auto production. Between 175 and 200 pounds of aluminum castings are presently used in the average vehicle, and this is projected to increase to 240 pounds by 2008. In 1998, 1.8 million tons of aluminum castings were produced, which should increase to 2.8 million tons in 2008 (Kirgin 1997 and AFS 1998). Motor vehicle applications accounted for 954,000 tons of castings in 1998 and should consume 1.8 million
tons in 2008, an increase of 6.6% per year (AFS 1998). The aggressive market forecast for magnesium castings will be fueled by growth in automotive die castings in magnesium.
Table 1-1 presents predictions of casting shipments by metal for 1999 and 2008. Although ferrous castings reached a 50-year production low of 9.5 million tons in 1991, they are projected to increase to 11.8 million tons in 1999 and to grow at 1.3% annually in the long term (Kirgin 1998 and AFS 1998). By 2004, ductile iron castings will overtake gray iron as the material of choice for ferrous castings. Gray iron, once used in the primary components of autos and light trucks (358 pounds per vehicle), will yield its market share more and more to light metals, ductile iron, and compacted graphite iron.
Hindrances to the Industry Remain
Traditional cast metal markets will continue to face competition from overseas producers because of their lower wage scales and environmental standards, which lower the cost of their products. There are domestic obstacles as well to the success of the U.S. metalcasting industry. Some cast products are being replaced by using alternative materials and processes rather than traditional casting techniques. For example, household appliances are increasingly being produced of plastic materials rather than gray iron castings. Other metalworking processes such as forging and welding are also potential competitors to cast products.
Environmental constraints on the industry’s operations and handling of pollution and waste products are increasingly more costly to the industry and cut into its profits. In a recent survey of North American foundries, 66% stated they planned to change one or more processes in the next three years to ensure environmental compliance (Laitar and Geoffrey 1997).
The industry has participated in research and development activities and has incorporated new technological advances into its processing
3

Table 1-1. Predictions of Casting Shipments
Metal 1999 Long Term (to 2008)
Gray iron 99 3% 88 0.2% per year
Ductile iron 99 1.5% 88 3% per year
Malleable iron 99 12% continued decline
Steel 99 11% slight growth
Aluminum 88 4% 88 4% per year
Copper alloy 99 4% some growth
Zinc 99 6% 99 2% per year
Magnesium 88 7% 88 15% per year
Sources: Kirgin 1999. American Foundrymen’s Society 1998.
systems. This has enhanced its energy efficiency, productivity, and product quality, but additional R&D is needed to generate continuing improvements to maintain its global leadership position.
1.3 The People and Places of the Industry
The 1995 Annual Survey of Manufactures found that more than 221,000 people are employed in foundries (SIC 332 and 336) in this country, and the industry’s total annual payroll is $6.82 billion (U.S. Department of Commerce 1996). Recent data provided by the American Foundrymen’s Society show there were 2,956 foundries in the United States in 1997 (Kanicki 1998). Small and medium-sized foundries dominate the industry, with about 80% of all foundries employing fewer than 100 people and only 6% having a staff larger than 250 (Kanicki 1998).
U.S. metalcasting facilities are concentrated in the Midwest, Southeast, and California, with the majority of the capacity (77%) located in 10 states: Alabama, Illinois, Indiana, Michigan,
Ohio, Pennsylvania, Tennessee, Texas, Virginia, and Wisconsin. Two states (Illinois and Ohio) are home to more than 200 foundries; six others have 100 to 200 foundries within their borders (California, Indiana, Michigan, Pennsylvania, Texas, and Wisconsin), and only the District of Columbia has no foundries at all.
Foundry locations have traditionally been sited close to raw materials, coal, water, and transportation. More recently, new foundries have been built near inexpensive supplies of scrap metal and electricity as well as local markets for the cast products (U.S. Environmental Protection Agency [EPA] 1997). Figure 1-3 illustrates the present distribution of foundries in the United States.
In addition to the working foundries, public and private research institutions and organizations are part of the infrastructure of the metalcasting industry. At least eight private trade organizations are concerned with different aspects of the industry, offering their support
4

100 - 205
40 - 99
10 - 39
0 - 9
Source: American Foundrymen’s Society 1998.
Figure 1-3. Distribution of Metalcasting Facilities in the United States, 1998
and expertise to enhance its productivity and competitiveness. A number of universities and national laboratories conduct research projects related to metal casting.
Under NAICS, Casting Has One Classification
The Standard Industrial Classification (SIC) system is a code developed by the Office of Management and Budget to organize statistical data about the U.S. economy by various production, trade, and service categories. The SIC system is being replaced by the North
American Industrial Classification System (NAICS), which reflects the economy’s greater emphasis on service industries and recognizes new and emerging technologies. Under SIC, the iron and steel foundries held the code 332, while nonferrous foundries and die casters held code 336. NAICS will group iron and steel foundries, nonferrous foundries, and die casters under one classification, NAIC 3315.
1.4 The Materials of Castings
Materials for castings can be ferrous (iron and steel) or nonferrous (e.g., aluminum, magnesium,
5
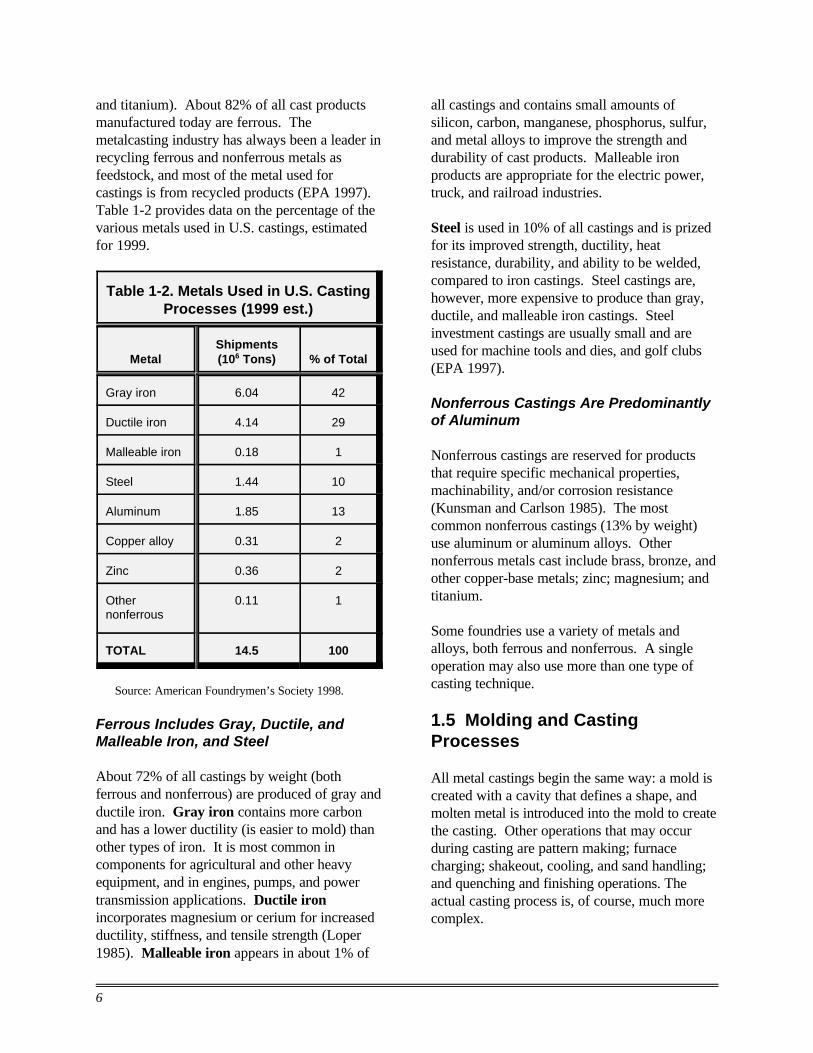
and titanium). About 82% of all cast products manufactured today are ferrous. The metalcasting industry has always been a leader in recycling ferrous and nonferrous metals as feedstock, and most of the metal used for castings is from recycled products (EPA 1997). Table 1-2 provides data on the percentage of the various metals used in U.S. castings, estimated for 1999.
Table 1-2. Metals Used in U.S. Casting Processes (1999 est.)
Metal Shipments (106 Tons) % of Total
Gray iron 6.04 42
Ductile iron 4.14 29
Malleable iron 0.18 1
Steel 1.44 10
Aluminum 1.85 13
Copper alloy 0.31 2
Zinc 0.36 2
Other nonferrous
0.11 1
TOTAL 14.5 100
Source: American Foundrymen’s Society 1998.
Ferrous Includes Gray, Ductile, and Malleable Iron, and Steel
About 72% of all castings by weight (both ferrous and nonferrous) are produced of gray and ductile iron. Gray iron contains more carbon and has a lower ductility (is easier to mold) than other types of iron. It is most common in components for agricultural and other heavy equipment, and in engines, pumps, and power transmission applications. Ductile iron incorporates magnesium or cerium for increased ductility, stiffness, and tensile strength (Loper 1985). Malleable iron appears in about 1% of
all castings and contains small amounts of silicon, carbon, manganese, phosphorus, sulfur, and metal alloys to improve the strength and durability of cast products. Malleable iron products are appropriate for the electric power, truck, and railroad industries.
Steel is used in 10% of all castings and is prized for its improved strength, ductility, heat resistance, durability, and ability to be welded, compared to iron castings. Steel castings are, however, more expensive to produce than gray, ductile, and malleable iron castings. Steel investment castings are usually small and are used for machine tools and dies, and golf clubs (EPA 1997).
Nonferrous Castings Are Predominantly of Aluminum
Nonferrous castings are reserved for products that require specific mechanical properties, machinability, and/or corrosion resistance (Kunsman and Carlson 1985). The most common nonferrous castings (13% by weight) use aluminum or aluminum alloys. Other nonferrous metals cast include brass, bronze, and other copper-base metals; zinc; magnesium; and titanium.
Some foundries use a variety of metals and alloys, both ferrous and nonferrous. A single operation may also use more than one type of casting technique.
1.5 Molding and Casting Processes
All metal castings begin the same way: a mold is created with a cavity that defines a shape, and molten metal is introduced into the mold to create the casting. Other operations that may occur during casting are pattern making; furnace charging; shakeout, cooling, and sand handling; and quenching and finishing operations. The actual casting process is, of course, much more complex.
6

The American Foundrymen’s Society has described 38 methods for producing a metal casting. Each process offers distinct advantages that are familiar to and exploited by casting designers and specialists. For the purposes of this document, however, they can be grouped into six broad categories, which are summarized in Table 1-3 and described below.
Conventional Molding Has a Long Track Record
Widely used for many years, conventional processes require that a mold be prepared of a refractory material with a cavity of the desired shape of the casting. Molten metal is poured into the cavity, and the casting must separate from the mold when it solidifies. Green sand molding is the most common technique, using silica sand as an economical and readily available medium for the mold. The sand is coated with a mixture of clay and water and pressed either manually or mechanically around the pattern to be cast. Since the casting is in direct contact with the sand, the quality of the molding sand affects the appearance of the casting.
Other conventional molding processes include high-density molding (the sand molds are well-compacted under pressures of 100 psi or more to improve surface finishes and casting tolerances); skin dried molding (the skin of the molding cavity is heated to drive water out of the sand into the mold, leaving dry sand next to the cavity and facilitating separation of sand from casting); and dry sand molding (the mold is heated to remove water, which makes it long-lasting, but it is a time-consuming and energy-intensive process).
Precision Molding Ensures Physical/Mechanical Excellence
Precision molding processes are used when the castings must have superior physical and mechanical properties. The pattern for an investment casting is made in a die of wax, polystyrene, or plastic. In producing the mold,
Conventional Molding
Green sand molding
High-density molding
Skin dried molding
Dry sand molding
Precision Molding
Investment casting
Die casting
Permanent molding process
Cosworth process
Semi-Precision Molding
Shell process
Lost foam casting
Special Molding
Centrifugal casting
Floor and pit molding
Chemically Bonded Self-Setting Sand Molding
No-bake processes
Coldbox and SO2 processes
Liquid catalyst systems
Innovative Molding
Table 1-3. The Major Metalcasting Processes
Squeeze casting
FM process
Rheocasting and Thixomolding
Source: Kanicki 1994.
the pattern is covered or “invested” with a ceramic slurry to produce a monolithic mold that will be melted or broken away after the casting is
7

cooled. Investment casting is often used for large castings and castings of expensive materials such as titanium and is noted for smooth and detailed surface finishes and excellent dimensional tolerances.
Die casting molds are made of metal and considered permanent, and are used to produce small- to medium-sized castings in large volume. Most die castings are made of nonferrous alloys, although small amounts of iron and steel are used in specific instances. Die casting is the choice for producing highly accurate components in a variety of sizes and shapes, such as gears, and when a casting needs to be produced in large numbers. Castings can be produced in thin sections with excellent mechanical properties.
Aluminum is primarily used in die castings, but magnesium, lead, zinc, copper, nickel, and other nonferrous metals may be cast.
In the permanent molding process, the mold is prepared in two sections from cast iron or steel and the casting can be poured in a horizontal or vertical position. Castings are generally of aluminum alloys, less frequently of copper and cast iron, and have excellent mechanical properties.
The Cosworth process was developed to produce the highly precise components of racing cars from aluminum alloys. Castings are accurate with little porosity, excellent surface detail, and superior mechanical properties.
Semi-Precision Molding Is Similar to Precision Molding
Semi-precision processes produce castings with properties similar or superior to those produced using Precision Molding techniques. In the shell process, sand is coated with thermosetting resin to make a thin-walled shell mold. Shell molds can be used to produce cores (to form the internal surface of the casting) or molds (to form the external surface). They produce castings with good surfaces and dimensional accuracies and are useful for high-volume production.
In lost foam castings, the pattern is made of expandable polystyrene beads bonded with a heat source. Unbonded sand is poured into the pattern and compacted, and when molten metal is added to the mold, it replaces the pattern. In other versions of this process, the pattern is “burned” out of the mold before the metal is added. The castings can be of any size, and their surface finish and dimensional tolerances are excellent.
Special Molding Can Produce Unique Shapes
Special processes are used for economically engineered components of unique shapes and sizes. In centrifugal casting, the mold is spun at very high speeds as the metal is poured, producing hollow cylinders and tubes of different lengths and wall thicknesses.
Floor and pit molding processes are used when the casting is too large for conventional molding machines. Floor molding is accomplished using flasks that sit on the foundry floor, or if the casting is still too large, the flask is divided into intermediate sections called cheeks. Floor molds are made of green sand or other materials. Pit molding occurs in a pit dug into the foundry floor to accommodate castings too large for flasks. Floor and pit processes are only undertaken when very large iron and steel castings are produced.
Chemically Bonded Self-Setting Sand Molding Saves Energy
Processes that are distinguished by use of chemical binders and catalysts to cure or harden the sand mold without using heat help the industry save energy costs. They are used to produce cores and molds, and the shape of the casting can be quite intricate, although they may be too time-consuming for high-production runs.
No-bake processes are binder systems for producing cores, core molds, or plain molds. The binder may be cured with a gas or a liquid catalyst. This process forms hard, rigid cores and molds, giving the casting good dimensional tolerances.
8

Coldbox and SO2 processes use gas catalysts to produce cores or molds and have short production cycles and reduced production costs; they create dimensionally accurate cores and molds and castings with good surface features.
In liquid catalyst systems, refractory sand is coated with the binder, and a liquid catalyst is then added to harden (cure) the binder.
Innovative Molding Processes Take Casting in New Directions
Unique techniques are used in the relatively new area of innovative molding to engineer molten or semi-molten metal into various shapes. In squeeze casting, molten metal is introduced into a permanent metallic mold die cavity, and pressure is applied as it becomes solid. Often used for high-volume production of aluminum alloy castings, squeeze castings do not undergo dimensional shrinkage and have excellent surface finishes. They also use less metal than conventional methods.
The FM process is a filling rather than a pouring method and is used when thin-walled
iron and steel castings are needed. Using any type of mold, the mold is rapidly filled under negative pressure; casting thicknesses of 2.5 to 3.0 mm have been attained.
In rheocasting and thixomolding, a semisolid metal is agitated and the metal alloy is turned into a liquid or semiliquid alloy that can be die cast. Presently used for magnesium automotive components, the technology will be extended to zinc and aluminum alloys, and metal matrix composites.
Sand Casting Dominates
The various forms of sand casting account for a combined total of 60% of U.S. castings by weight. Permanent mold and die casting combined together account for another 20% of the total, while investment casting has increased to about 7% of the total. Table 1-4 indicates the casting methods used in U.S. foundries in 1994, including the value of shipments by casting method.
This cursory description of the primary metalcasting processes provides some background on where energy is used and waste is generated by the industry, topics that will be addressed next.
Table 1-4. Casting Methods Used and Value of Castings Shipped by U.S. Metalcasting Facilities (1994)
Method Use (%) Value of Shipments
($ billion)
Sand 60 10.4
Permanent Mold 11 1.8
Die 9 7.6
Investment 7 2.3
Other (combined) Shell Mold Centrifugal, Plaster, and
Evaporative Pattern
13 7 6
0.9 ----
TOTAL 100 23.0
Sources: American Metalcasting Consortium 1995. Idaho National Engineering Laboratory 1994.
9

1.6 Energy Overview
Metal casting is among the most energy-intensive industries in the United States. The heating and melting of metals consume large amounts of energy. It has been estimated that as much as 20 million Btu are required to melt and cast one ton of saleable iron castings (Stevenson 1995), although 13 to 15 million Btu per ton is more typical.
As shown in Table 1-5, most of this energy use (an average of 55% of total energy costs) can be attributed to melting. This has forced the industry to find ways to become more energy efficient in order to remain competitive. The industry has made good progress in reducing its energy costs by developing and adopting more efficient equipment and by making changes in some of its processes.
Total industry energy use in 1994 for gray and ductile iron foundries (representing 72% of total industry production) was reported to be 154 trillion Btu (U.S. Energy Information Administration [EIA] 1997). Industry-wide energy consumption for all foundries is estimated to be approximately 200 trillion Btu.
The industry’s energy mix for gray and ductile iron foundries is shown in Table 1-6. In 1994, its energy expenditures were $1.1 billion, about
5% of the value of its shipments (U.S. Department of Energy [DOE] 1997).
1.7 Environmental Overview
As environmental standards have tightened since the 1970s, foundries have come under increased scrutiny by regulators at the Federal, state, and local levels. Although the metalcasting industry is renowned for using recycled metal to produce new goods, 75% of its own byproducts could be easily recycled but instead end up in landfills or are released into the air or water (Reuland et al.1997). Iron and steel foundries are also considered major sources of hazardous air pollutants (HAPs) from processes such as melting, pouring, cooling, and shakeout. Table 1-7 summarizes the types of waste products and emissions that can potentially be generated by the major foundry processes.
The industry estimates that it invests more than $1.25 billion annually in pollution prevention technologies and in meeting environmental standards. The industry also provides an important environmental benefit by using scrap metal (for which it pays $1 billion annually) as 85% of its feedstock for ferrous castings. This significant recycling of waste materials keeps 13.3 million tons of metal out of U.S. landfills each year (Radia, French, and Slavin 1996; AFS et al. 1998).
Table 1-5. Breakdown of Process Energy Costs
Process Step % of Total Costs
Coremaking 8
Moldmaking 12
Melting 55
Heat Treatment 6
Post Cast 7
Other 12
TOTAL 100
Table 1-6. Energy Use Mixa (1994)
Fuel Percentage Use
Natural Gas 21.4
Electricity 19.5
Electricity Losses 39.0
Coke and Breeze 18.9
LPG 0.6
Coal 0.6
TOTAL 100.0
a Gray and ductile iron foundries.Source: U.S. Energy Information Administration 1997.
Source: Bates 1997.
10

Table 1-7. Waste Products of the Metalcasting Industry
Operation Materials Used Potential Waste/Emissions
Pattern Making Wood, plastic, metal, wax, polystyrene
Nonmetal scrap materials, solvents, cleaners, particulates, VOCs
Mold and Core Preparation Sand, chemical binders, plaster, refractory slurry, wax, plastic, steel, salt
Spent sand; damaged cores; mold plaster; particulates; organic compounds; HAPs; VOCs; carbon monoxide; hydrogen sulfide; sulfur dioxide; nitrous oxide; metallic oxide fumes; ammonia; hydrogen cyanide; nitrogen oxides; polystyrene vapors; wastewater with suspended solids, phenols, dissolved salts, and elevated temperature
Furnace Charge & Metal Melting
Metal scrap, ingot and returned castings, fluxing agents, refractory materials, fuel
Particulates, combustion products, chloride and fluoride compounds, metallic oxide fumes, hydrochloric acid, emissions from additives, wastewater with metals, solvents, refractory materials
Quenching, Finishing, Cleaning, Coating
Paint, rust inhibitor; unfinished castings, water, steel shot, solvents
VOCs; dust and metallic particulates; spent solvents; steel shot; cutting wheels; metallic filings; wastewater with solvents, oil and grease, suspended solids, elevated temperature, low or high pH
Shakeout, Cooling, Sandhandling
Water, caustic for wet scrubbers Waste sand; fines (nonmetals); particulates; carbon monoxide, other gases; organic compounds; wastewater with mold coating, elevated temperature
Die Casting Metal, fuel, lubricants, fluxing agents, hydraulic fluid
Waste hydraulic fluid, lubricants, floor absorbent, plunger tips; wastewater with oil, phenols, elevated temperature
Source: Adapted from U.S. Environmental Protection Agency 1997.
The industry is finding new ways to recycle spent sand and to recover and reuse metals, chemicals, and other waste products. Many foundries have also made changes to their processes to help reduce air and water emissions.
Quantitative Data Exist on Waste and Emissions
Wastes fall into four major categories: sand, slag, dusts, and other. About 7 million to 8 million tons of spent sand must be handled annually, which is about 800 pounds per ton of casting.
Waste sand may account for nearly 70% of an individual foundry’s total waste stream, depending on how much can be recycled on site. Slag typically comprises 20% to 25% of a foundry’s byproducts. Cupola ash and refractories may contribute to the residual slag that forms. Dusts can comprise 10% or more of the total wastes, and other wastes fall into a number of categories (Regan and Tekalsky 1997; Reuland, Wabiszewski, and Gusten 1997).
Air pollutants released in 1995 included approximately 115,000 tons of carbon monoxide,
11

12,000 tons of nitrogen dioxide, 11,000 tons of particulates less than 10 microns in diameter (PM10), 21,000 tons of total particulates, 6,500 tons of sulfur dioxide, and 19,000 tons of volatile organic compounds (EPA 1997).
Regulations Help Drive Environmental Programs
A number of Federal regulations apply to metal-casting operations (see Figure 1-4) and have contributed to the closure of one in four foundries since 1980. The Clean Air Act Amendments of 1990 (CAAA) have had an impact on foundries and their operations for most of this decade. For example, companies must apply for operating permits each time they carry out construction activities or modify their plants. Title III (Maximum Achievable Control Technology, or MACT) of CAAA may force additional closures or cause a number of foundries to move offshore, according to Schifo and Stone (1997). Under the CAAA, the U.S. Environmental Protection Agency’s (EPA’s) new MACT standards may significantly reduce the quantity of allowable emissions from foundry operations by 2003.
Figure 1-4. Federal Legislation That Pertains to the Metalcasting Industry
• Clean Air Act Amendments of 1990 • Clean Water Act • Comprehensive Environmental Response,
Compensation, and Liability Act of 1980 • Pollution Prevention Act of 1990 • Emergency Planning and Community
Right-to-Know Act • Resource Conservation and Recovery Act • Superfund Amendments and
Reauthorization Act
For example, the EPA has identified a number of HAPs that should be regulated, including acrolein, benzene, chromium, formaldehyde, manganese, naphthalene, nickel, phenol, and toluene. New technologies to help control these emissions could cost the ferrous industry $100 million a year according to the American
Foundrymen’s Society, a trade organization for the industry. MACT may also impose a need for processing changes, limits on production, or use of new materials (AFS 1997b, 1997c).
The CAAA requires many foundries to collect accurate information on their air emissions. Unless the foundry has conducted specific tests, it must rely on published emissions values to estimate these numbers. This may result in an underestimate of the true level of emissions, and expose the foundry to legal liabilities. If the foundry overestimates the emissions, its permitting fees will be high. Some of the values sought are for carbon monoxide emissions from electric arc furnaces, particulate matter emissions from pouring and cooling processes, and volatile organic compound (VOC) emissions from sand reclamation (Morency 1997).
The industry may also be affected by revisions to the National Ambient Air Quality Standard for PM10 (particulate matter less than 10.0 microns in diameter). New national health standards for ozone and particulate matter (PM2.5) were adopted by EPA in 1997. In May 1999, the U.S. Circuit Court of Appeals for the District of Columbia ruled that EPA could not use a PM10 standard in combination with a fine particulate standard. New standards will not be in effect until EPA satisfies the Court’s requirement for criteria in setting the level of the standards.
Under the Pollution Prevention Act of 1990, manufacturing facilities must provide an accounting of how they handle toxic chemical wastes. The Toxic Chemical Release Inventory (TRI) of reporting foundries showed they produced 208 million pounds of toxic waste in 1996. Past records show that the metalcasting industry decreased its production of toxic chemicals 46% between 1988 and 1995 (EPA 1997). About 55% of the industry’s TRI waste is managed on-site, through recycling, treatment, or recovery of energy content. About 45% of the foundries’ TRI chemicals, primarily metallic wastes, are released to air, water, and land, or are transferred off-site for recycling or disposal (EPA 1998).
12

The Resource Conservation and Recovery Act (RCRA) of 1976 set up a “cradle-to-grave” system to track hazardous wastes from their point of generation to their disposal. Facilities that generate hazardous substances must obtain a permit and keep records on all these materials and are restricted in the methods of disposal. About 2% of foundry sand is usually hazardous. The industry also produces 30,000 tons of hazardous sludge and dust annually (Radia, French, and Slavin 1996). The Comprehensive Environmental Response, Compensation, and Liability Act of 1980 (Superfund) allows the EPA to respond to releases of hazardous materials that may endanger the public or the environment. It also forces those at fault to clean up the contaminants or reimburse the Superfund for such costs. A number of sites that house waste from foundries are on the National Priorities (Superfund) List.
When hazardous wastes are landfilled, they are subject to treatment to remove the hazardous characteristic and must meet universal treatment standards (UTS) under RCRA. Typical foundry wastes where UTS apply include
• ignitable wastes such as solvents and paints; • reactive products such as sulfides, cyanides,
and calcium carbide; • organics such as cleaning and quenching
solvents and waste resins and coatings; • metals from baghouse dust (e.g., lead,
cadmium, zinc) and waste sludges; and • hazardous sands, dust, and slags.
To date, UTS have been developed for more than 200 constituents, a significant number of which are potentially present in hazardous waste from foundries (Curtis 1997).
The Superfund Amendments and Reauthorization Act (SARA) of 1986 created the Emergency Planning and Community Right-to-Know Act (known as SARA Title III) to provide communities with access to information about any environmental releases of hazardous substances of a certain quantity.
The Clean Water Act regulates various pollutants in the Nation’s surface waters that result from direct or indirect discharges. A foundry that planned to discharge into surface waters would have to obtain a permit and provide data on the quantitative make-up of the effluent. Although water quality criteria vary among the states, most follow the guidance of the EPA.
Where Are Processing Wastes and Pollutants Generated?
Wastes and pollutants are generated at foundries during the metal melting, mold and core making, shakeout and sand handling, and cleaning and finishing stages (see Table 1-7).
Furnaces used to melt metal may emit the products of fuel combustion, particulates such as metallic dust, carbon monoxide, organic vapors from oily scrap materials, and fumes from molten metal oxides. Slag produced during melting processes may or may not be hazardous. During mold and core making, waste and emissions may include particulates of sand and other refractory materials, VOCs, carbon monoxide, sulfur dioxide, ammonia, hydrogen sulfide, hydrogen cyanide, nitrogen oxides, and other gases and other organic compounds.
Investment casting shells also become part of the waste stream. During cleaning and finishing, wastewater from cooling and scrubbing operations can have an extreme pH and contain oil and suspended solids. Other waste includes dust particles (EPA 1997).
Die casting emissions include VOCs, and there is often waste cooling water contaminated with oil, phenols, and other residues (EPA 1997).
EPA has recently declared that scrap metal is not a “solid waste,” and now excludes “prompt” scrap (from metalworking and machining facilities), “home” scrap (from melting operations), processed scrap, and agglomerated fines and drosses from the waste category. This new classification makes it easier for the recycling industry to comply with environmental law (AFS 1997d). These categories of scrap
13
metal have not been included as waste products in Table 1-7.
The Waste Stream Is Being Reduced
The Pollution Prevention Act of 1990 sets a priority for reducing the amount of manufacturing waste through “source reduction”— preventing the generation of waste on the factory floor. If this is impossible, the second-best option is to recycle any wastes produced, followed by a third option of recovering the energy content of wastes, with the treatment of the waste stream as a last resort.
Some foundries are practicing source reduction of waste sand, which presently accounts for the majority of the industry’s waste stream, by choosing techniques that generate less waste sand.
Source Reduction Priorities
CC Avoid on-site waste production CC Recycle waste CC Recover energy content of waste CC Treat the waste stream
The industry is also making an effort to reclaim and reuse waste sand or to move it off-site for reuse. On-site recycling techniques include methods to remove contaminants from the sand with various screening, magnetic-separation, scrubbing, or thermal systems. Nonhazardous sand is sometimes directed to the construction industry for cement and concrete production or used for and fill or landfill cover replacement (EPA 1997).
More energy efficient furnaces and ovens reduce the generation of pollutants associated with fossil fuels and those produced during various casting processes that require heat. Foundries have reduced their nitrous oxide and carbon monoxide emissions by upgrading reverberatory or crucible furnace systems with new oxygen burners and computerized gas-flow metering (EPA 1997). Induction furnaces, which are 75% to 80% energy efficient and have 75% fewer emissions,
are helping minimize the industry’s need for emission-control equipment for some applications.
Where there is a choice of the furnace fuel used, foundries also find it possible to lower emissions. Natural gas combustion produces fewer emissions than fuel oils, and lower-grade fuel oils are more desirable than the heavier grade fuels. Fuels that have a lower sulfur and nitrogen content are used to reduce emissions of sulfur dioxide and nitrogen oxides. In addition, proper maintenance of furnaces ensures better fuel/air mixing and reduced levels of emissions (EPA 1997).
Furnace dust from the electric arc furnace (EAF) can sometimes be reduced by avoiding excessive superheating of the metal, keeping a cover of flux or slag over the molten metal, preheating the metal charged, and other methods. Some foundries have found that EAF dust can be recycled to the original process or reusued outside the process if zinc, lead, and cadmium residues are recovered first (EPA 1997).
Improvements in casting designs in order to reduce casting defects have also helped the industry prevent waste and reduce costs. Computer software is available to ensure optimal casting designs.
There are several other areas in which the metalcasting industry is becoming more environmentally sensitive (EPA 1997):
C The wastewater from die casting operations often contains oils and phenols. Substituting raw materials that have few or no phenols helps reduce this problem.
C The overall wastewater stream can be minimized by recycling the cooling water for various operations.
C Use of water-based die lubricants will reduce VOC emissions during die casting.
14
1.8 Who Are the International Competitors?
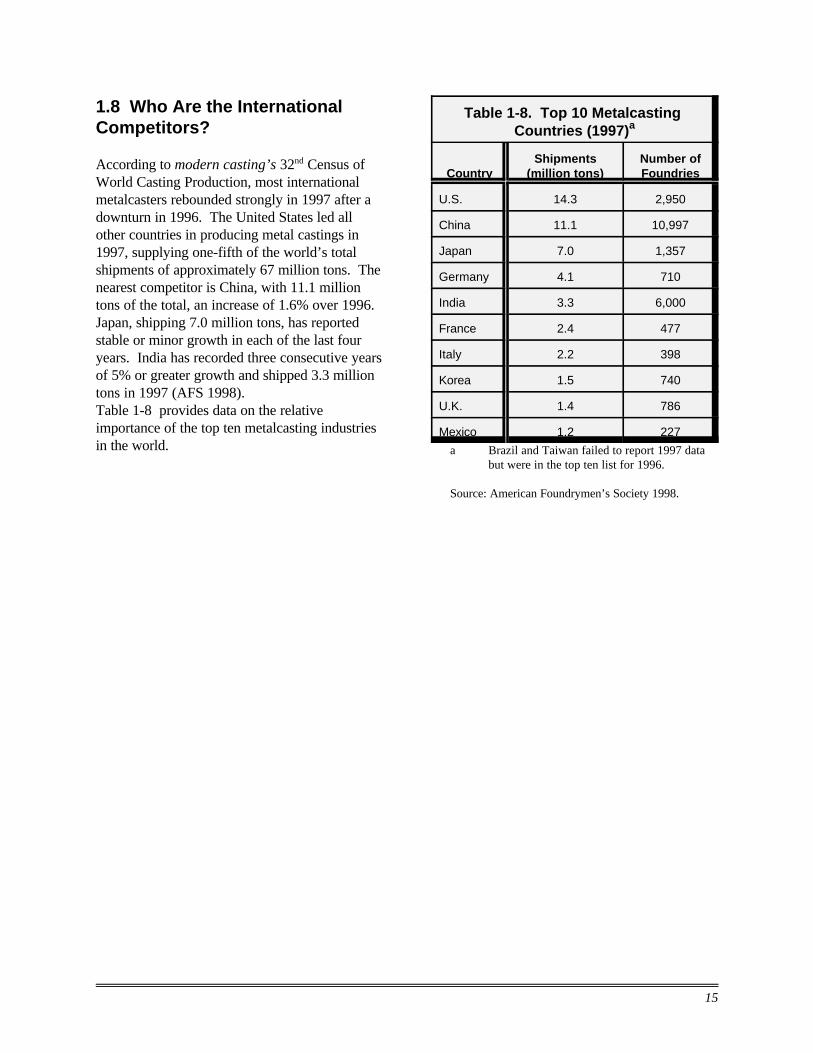
According to modern casting’s 32nd Census of World Casting Production, most international metalcasters rebounded strongly in 1997 after a downturn in 1996. The United States led all other countries in producing metal castings in 1997, supplying one-fifth of the world’s total shipments of approximately 67 million tons. The nearest competitor is China, with 11.1 million tons of the total, an increase of 1.6% over 1996. Japan, shipping 7.0 million tons, has reported stable or minor growth in each of the last four years. India has recorded three consecutive years of 5% or greater growth and shipped 3.3 million tons in 1997 (AFS 1998). Table 1-8 provides data on the relative importance of the top ten metalcasting industries in the world.
Table 1-8. Top 10 Metalcasting Countries (1997)a
Country Shipments
(million tons) Number of Foundries
U.S. 14.3 2,950
China 11.1 10,997
Japan 7.0 1,357
Germany 4.1 710
India 3.3 6,000
France 2.4 477
Italy 2.2 398
Korea 1.5 740
U.K. 1.4 786
Mexico 1.2 227
a Brazil and Taiwan failed to report 1997 data but were in the top ten list for 1996.
Source: American Foundrymen’s Society 1998.
15

16

2 Moldmaking and Coremaking
2.1 Process Overview
Castings are metal engineered components formed by designing a mold to produce a desired shape, and introducing controlled metal flow into the cavity where the metal solidifies. High-tolerance, smooth-surface-finish castings are produced using high-quality molds. In addition to molds, separate preformed masses called cores may be used in the casting process to make internal or external features that cannot be obtained with the mold pattern alone. Patterns for both molds and cores are made from wood, epoxy resins, polyurethane and other plastics, metals, ceramics, and certain other materials. The pattern must compensate for contraction and volume change in transforming from liquid to solid in order to conform with the dimensions of the final casting.
In general, casting methods fall into three categories: (1) molding processes that use a permanent pattern to produce an expendable mold, (2) molding processes that use an expendable pattern and an expendable mold, and (3) molding processes that use a permanent mold.
The selection of the appropriate casting process is dependent on the types and numbers of castings required and engineering properties sought. Table 2-1 presents a summary of the relationships between the process used and the properties of the resulting casting.
Sand Casting Is the Most Popular Process
Silica sand is the primary molding material used by the foundryman to produce expendable molds, a process referred to as sand casting. Sand is relatively inexpensive and sufficiently refractory for this purpose and is used in nearly two-thirds of all foundries. Sand casting will be the primary focus of this chapter.
There are several types of sand casting molds, including
• green sand,
17

Table 2-1. Comparison of Casting Methods
Property Green Sand Permanent
Mold Die Casting
Chemically Bonded (No-
Bake) Investment
Casting
Relative cost in quantity
Low Low Lowest Medium Highest
Relative cost for small number
Lowest High Highest Medium Medium
Permissible weight of casting
Up to 1 ton 100 lbs 60 lbs Unlimited Ounces to 100 lbs
Thinnest section castable (inches)
1/10 1/8 1/32 1/10 1/16
Typical dimensional tolerance (inches)
0.012 0.03 0.01 0.01 0.01
Surface finish Fair to good Good Best Good Very good
Alloys that can be cast
Unlimited Copper base and lower melting point metals preferable
Aluminum base and lower melting point metals preferable
Unlimited Limited
Source: American Foundrymen’s Society 1982.
• dry sand, • loam, • pit, • shell, and • chemically bonded (air-set or self-curing)
molds.
The type of sand casting mold used for a specific casting is based upon casting size and the types of binders used. Cores are usually classified according to the material from which they are made.
In green sand casting, moldmaking and coremaking begin with preparation and mixing of the raw materials, which include sand, binders, additives, and water. These various ingredients are mixed in a machine known as a muller and the mixture is then transported (by a belt or pneumatic conveyor system) to the moldmaking or coremaking area, where it is stored in hoppers or bins until needed.
For most types of sand casting, molds are made in molding machines that hold the patterns for the molds. Cores are made in coreboxes, which are composed of wood, metal, or another durable material. Molds are generally formed from two halves, known as the cope and the drag, which are clamped together for pouring operations.
During preparations of a sand mold, the sand is surrounded by a “box” called a flask and undergoes “ramming” around each half of the pattern. Ramming may be performed by hand; however, mechanical ramming allows for quicker production for large-volume production rates. Methods to accomplish this include jolt ramming, squeezing, and sand slinging. Chemically bonded molds generally require only simple vibration to accomplish this step.
In most cases, the patterns are removed after the sand has been properly rammed. A gating system, composed of runners, sprue, gates, and risers, is built into the mold to control metal flow into the
18

cavity during pouring. (Risers are openings that form reservoirs of molten metal that compensate for metal shrinkage during solidification, and are included for most metals.) The finished mold is then forwarded to the pouring area.
The various steps in the sand casting of molds and cores are illustrated in Figure 2-1.
Binder Systems Keep the Sand Together
A binder is a material that is added to the sand, or that is a natural component of the sand, which
Other Sand Materials
gives cohesiveness to the sand. Both organic and inorganic binders, such as chemicals and clay, are used in moldmaking and coremaking. Binder technology is constantly improving in response to concerns over the environment and worker health and safety.
Sand molds made with a moist sand, in which the mold is also kept moist during pouring, are used in green sand molding. Green sand mixtures utilize clay and water as the main binders and include other constituents such as carbons, cereals, starches, celluloses, chemicals, and refractories. Green sand is generally only used to form molds, not cores.
SandMixing
MoldMolding
Finishing
To Pouring Coremaking Operations
Key Energy and Environmental Facts - Moldmaking and Coremaking
Energy Emissions Effluents Byproducts
Uses 7% to 20% (on the order of 1.0 to 3.0 106 Btu/ton) of a foundry’s total energy consumption, depending on casting type and metal
Particulate, VOCs, CO, hydrogen sulfide, SO2, NOx
Benzene, phenols, and other HAPs if chemically bonded cores are used
Sludge from dust collection scrubbers
Waste green sand
Figure 2-1. Sand Casting Production Flow Diagram for Moldmaking and Coremaking
19

There are three other types of binder processes:
• heat-activated • no-bake • coldbox
Heat-Activated Processes Include the Hotbox, Shell, Warmbox, and Core Oil
The hotbox process can quickly produce solid cores that are light and result in a high-quality casting finish. It is also occasionally used to produce molds. Hotbox binding is initiated by blowing a resin and the dry sand mixture into a heated corebox or mold fixture in order to activate the binder. Operating temperatures for hotbox binding are in the range of 450oF to 550oF. Binder systems used include phenolic resins, furan resins, or a combination of the two, along with a catalyst. This allows an exothermic reaction to take place in which the binder continues to cure after the mold is removed from the box or fixture.
The shell process is technically very similar to the hotbox process, although it is more often used to produce hollow cores or thin molds halves than solid cores. In this process, a blow machine feeds dry coated sand into the box at an operating temperature of at least 450oF in order to create a thin shell that forms on the surface of the hot pattern that is then used as the mold. For intricate castings, the hotbox or shell method is often the most cost-effective means of producing a good mold or core. A particular advantage of the shell process is its ability to use reclaimed sands effectively.
The warmbox binding process is similar to hotbox binding but it operates at lower temperatures (generally, 300oF to 450oF). Warmbox binders are the same as those used in the hotbox process, but different catalysts allow warmbox binding to proceed at lower temperatures.
The core oil process involves mixing sand with a linseed-based product or other oil, known as core oil. This mixture is blown into the corebox at room temperature, and the core is then removed
and placed into an oven for baking. No separate catalyst is required in this process.
No-Bake Processes Are Self-Setting
No-bake systems include binders that cure at room temperature, usually between 75oF and 85oF. Clean dry sand, binder, and catalyst are continuously mixed and blown or poured into the corebox or molding fixture. Heat can be used to speed the binder-setting process. This category of binders is becoming the most popular when a moderate volume of castings is needed (Svoboda 1998).
Coldbox binder systems are relatively new and use a gas or vaporization catalyst to cure the mold or core. The sand is injected into the mold fixture or corebox, and then is pressure gassed; the gas is later purged. Some coldbox systems use inorganic binders and are thus more environmentally benign.
A summary of the various binder systems is provided in Table 2-2.
2.2 Summary of Inputs/Outputs
Depending on the process, the following list summarizes typical inputs and outputs of the mold- and coremaking processes.
Inputs: Sand Chemical binders Clays Water Fuel (for heating) Electricity Patterns Dies
Outputs: Molds Cores Emissions Waste sand Wastewater
20

Table 2-2. Binder Systems Used in Moldmaking and Coremaking
Binder Method Binders Used
Hotbox or Shell
Phenolic resins Furan resins Phenolic/furan resins Urea modified resins
Warmbox Phenolic resins Furan resins Urea modified resins
Nobake Furan/acid Phenolic/acid Phenolic/ester Silicate/ester Phenolic/urethane Alkyd urethane
Coldbox Phenolic/urethane/amine Phenolic/ester Silicate/CO2 Furan/CO2 Epoxy/CO2 FRC/CO2
Source: Rickun 1993.
2.3 Energy Requirements
Energy used in the molding department of a typical foundry is between 7% and 20% of the foundry’s total energy consumption, depending on type of castings produced, the metal that is melted and poured, and the size of the foundry operation. Energy is used for three basic purposes: materials transport; mechanical mixing, and moldmaking and coremaking; and heating of molds and cores. Table 2-3 describes energy usage for various processes.
The oil sand method requires a baking process to activate the binder and harden the liquid material between the sand grains. The energy source can be oil, gas, or electricity, and in some cases, microwave heating can be used. However, microwave energy will not cause a reaction with all binders, limiting its use. The hotbox and
warmbox coremaking processes also require heating.
The no-bake (chemically bonded) process uses little energy, since no heat is required in most cases. Special refractories may be used to coat the surfaces of molds and cores with a slurry to promote surface finish. When these refractory core coatings, washes, or pastes are used, energy is required for the drying steps.
2.4 Emissions
VOCs and Gaseous Emissions Are Associated with the Use of Binders
The two major emissions associated with the sand casting process are particulates and VOCs.Few significant particulate emissions occur during the blowing of sand into mold machines or coreboxes. Additional particulates are emitted from the sand after pouring and cooling, during the shakeout process (discussed in Section 6).
Emissions of VOCs and other gaseous air pollutants (carbon monoxide, sulfur dioxide, ammonia, hydrogen sulfide, hydrogen cyanide, nitrogen oxides, and a large number of other organic compounds) result from the use of organic chemical binders to produce cores and molds. Emissions occur primarily during heating or curing of the molds and cores or during removal of the cores from the coreboxes. Other sources of VOCs from sand casting include catalyst introduction and air sweep in coldbox processes and core washing and burn off in oven bake systems. The volatile organic compounds are from unreacted components of the resin, solvents, or catalysts.
Some of the gases that may be emitted are HAPs, including benzene, formaldehyde, methylene diphenyl diisocyanate, phenol, methanol, toluene, and cyanide compounds. Table 2-4 lists the types of HAP emissions from various binder systems.
21
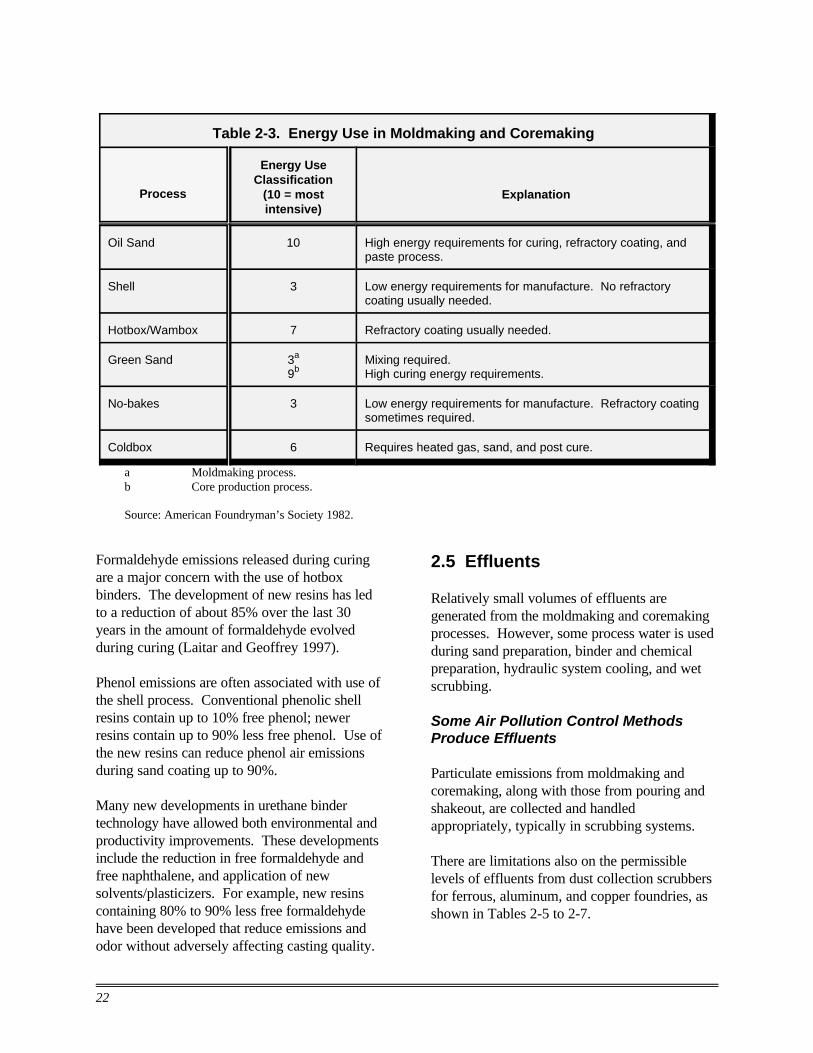
Table 2-3. Energy Use in Moldmaking and Coremaking
Process
Energy Use Classification
(10 = most intensive)
Explanation
Oil Sand 10 High energy requirements for curing, refractory coating, and paste process.
Shell 3 Low energy requirements for manufacture. No refractory coating usually needed.
Hotbox/Wambox 7 Refractory coating usually needed.
Green Sand 3a
9b Mixing required. High curing energy requirements.
No-bakes 3 Low energy requirements for manufacture. Refractory coating sometimes required.
Coldbox 6 Requires heated gas, sand, and post cure.
a Moldmaking process.b Core production process.
Source: American Foundryman’s Society 1982.
Formaldehyde emissions released during curing are a major concern with the use of hotbox binders. The development of new resins has led to a reduction of about 85% over the last 30 years in the amount of formaldehyde evolved during curing (Laitar and Geoffrey 1997).
Phenol emissions are often associated with use of the shell process. Conventional phenolic shell resins contain up to 10% free phenol; newer resins contain up to 90% less free phenol. Use of the new resins can reduce phenol air emissions during sand coating up to 90%.
Many new developments in urethane binder technology have allowed both environmental and productivity improvements. These developments include the reduction in free formaldehyde and free naphthalene, and application of new solvents/plasticizers. For example, new resins containing 80% to 90% less free formaldehyde have been developed that reduce emissions and odor without adversely affecting casting quality.
2.5 Effluents
Relatively small volumes of effluents are generated from the moldmaking and coremaking processes. However, some process water is used during sand preparation, binder and chemical preparation, hydraulic system cooling, and wet scrubbing.
Some Air Pollution Control Methods Produce Effluents
Particulate emissions from moldmaking and coremaking, along with those from pouring and shakeout, are collected and handled appropriately, typically in scrubbing systems.
There are limitations also on the permissible levels of effluents from dust collection scrubbers for ferrous, aluminum, and copper foundries, as shown in Tables 2-5 to 2-7.
22

Table 2-4. Potential Hazardous Air Pollutants from Moldmaking and Coremaking
System Binder Type Pollutant
Hotbox/Warmbox Phenolic Formaldehyde Phenol
Shell Resin-Coated Sand Formaldehyde Phenol Methanol
No-bake Furan/Acid Benzene Phenol Methanol Toluene
Phenolic/Acid Formaldehyde Phenol Methanol Toluene
Phenolic/Ester Formaldehyde Phenol
Phenolic/Urethane Formaldehyde Phenol Methylene diphenyl
diisocyanate
Coldbox Phenolic/Urethane Formaldehyde Phenol Methylene diphenyl Triethylene
diisocyanate
Phenolic/Ester Formaldehyde Phenol
Source: Rickun 1993.
Table 2-5. Effluent Limitations for Dust Collection Scrubber Operations - Ferrous Casting for 30 Consecutive Days
(kg/62.3 106 SM3 or lbs per 109 SCF of air scrubbed)
Pollutant BPTa BATb NSPSc
Copper 0.12 0.12 0.12
Lead 0.293 0.195d/0.293e 0.195d/0.293e
Zinc 0.421 0.278d/0.421e 0.276d/0.421e
Total Phenols 0.225 0.225 0.225
Oil & Grease 7.51 -- 7.51
TSSf 11.3 -- 9.01d/11.3e
pH g -- g
a Best Practicable Control Technology Currently Available. b Best Available Technology Economically Achievable. c New Source Performance Standards. d Applicable to plants casting primarily ductile or gray iron and to plants casting primarily
malleable iron (> 3,557 tons/year). e Applicable to plants casting primarily steel and plants casting primarily malleable iron
(< 3,557 tons/year). f Total Suspended Solids. g Within the range of 7.0 to 10.0 at all times. Source: Bureau of National Affairs 1996.
23

Table 2-6. Effluent Limitations for Dust Collection Scrubber Operations (Aluminum Casting) - Average of Daily
Values for 30 Consecutive Days (kg/62.3 106 SM3 or lbs per 109 SCF of air scrubbed)
Pollutant BPTa BATb NSPSc
Copper 0.126 0.126 0.126
Lead 0.117 0.117 0.117
Zinc 0.129 0.129 0.129
Total Phenols 0.09 0.09 0.09
Oil & Grease 3.0 -- 3.0
TSSd 4.51 -- 4.51
pH e -- e
a-c Same as Table 2-5. d Total Suspended Solids. e Within the range of 7.0 to 10.0 at all times. Source: Bureau of National Affairs 1996.
Table 2-7. Effluent Limitations for Dust Collection Scrubber Operations - Copper Casting for 30 Consecutive Days
(kg/106 kg or lbs per 106 lbs of metal poured)
Pollutant BPTa BATb NSPSc
Copper 0.301 0.301 0.301
Lead 0.28 0.187 0.167
Zinc 0.309 0.208 0.208
Total Phenols 0.215 0.215 0.215
Oil & Grease 7.18 -- 7.18
TSSd 10.8 -- 8.61
pH e -- e
a-e Same as Table 2-6. Source: Bureau of National Affairs 1996.
In addition, amine scrubbers may be used for sulfur dioxide control, although amine- scrubbing solution is sometimes released to the plant effluent system through leaks and spills (EPA 1997).
Those coremaking processes that use strongly acidic or basic substances for scrubbing the off gases may generate sludges or liquors. Scrubber sludges are typically pH-controlled prior to
discharge to sewer system as nonhazardous waste. Finally, sand molding slurry may be present from cleaning spills and is considered nonhazardous (EPA 1997).
24

2.6 Byproducts
The byproducts of sand casting include broken cores, sand that has set up prematurely or inadequately, waste resins and binders generated from spills, residuals in containers, and outdated materials. Sand not used in the mold may be either reused or reclaimed. Most of the materials used in the moldmaking and coremaking process are utilized at the pouring area (EPA 1997).
The Majority of Sand Is Reclaimed
Used molding/core sand may be reclaimed using thermal and/or mechanical reclamation systems. Approximately 80% to 90% of the sand can be reused, depending on the reclamation process selected. Sand reclamation is discussed in Section 7, Cleaning and Finishing.
2.7 Hazardous Wastes
There are generally no RCRA-listed hazardous wastes associated with moldmaking and coremaking, although untreated sludges may be classified as hazardous, corrosive waste due to the pH of the sludge (EPA 1997).
25

26

3 Cupola Melting Furnaces
3.1 Process Overview
The metal to be cast must be changed from a solid to a molten state through the application of heat. The major types of melting furnaces used in metalcasting facilities are the following:
• cupola furnaces • electric furnaces
- induction furnaces (coreless type and channel type) - arc furnaces - resistance-heated reverberatory
• reverberatory furnaces (gas or oil) • crucible furnaces (gas or oil)
The melting process used depends on the metal, product mix, available raw materials, energy source, melt volume, environmental requirements and costs, and other factors.
Cupola furnaces are used almost exclusively in melting iron. Induction furnaces are also used extensively in iron foundries, as well as in steel
foundries. Gas-fired reverberatory and crucible furnaces are used to melt aluminum.
Cupola furnaces are more tolerant of the presence of lead and other contaminants in charge materials. For example, cupolas can handle materials such as oxidized or organically contaminated iron and steel scrap, zinc-coated steel materials, and carbon-bearing iron oxide agglomerates.
Cupola Operation Has Potential for Efficiency
The cupola is a coke-fired, counterflow heat exchanger for melting iron. It consists of a vertical, cylindrical steel shaft furnace lined with refractory, at the bottom of which is the well section where the molten metal accumulates and is withdrawn through tap holes. Just above the well section are tuyeres (ports) through which blast air is introduced into the furnace to provide oxygen for combustion of the coke.
27

At the start of the process, a bed of coke covered with alternating layers of iron, coke, and limestone (to flush ash from the coke) is charged into the cupola and ignited. When the bed is ready, the metallic charge is fed into the cupola with a predetermined amount of coke known as the iron-to-coke ratio. Additional charges are made until the cupola is full.
The heat released from the burning coke melts the metal. As one layer of coke is consumed, the next layer reaches the bed and the process continues. The heat and gases (carbon dioxide and carbon monoxide) released during coke combustion rise through the upper charges of metal and are exhausted from the stack at the top of the furnace.
Cupola modifications that can increase energy efficiency include the use of preheated air blast (hot blast) and oxygen-enriched blast. Preheating is typically provided by gas-fired external heater systems capable of 1,000oF - 1,200oF blast. Oxygen-enrichment of cupola blast air has been used both intermittently and continuously. The amount of oxygen added is usually between 1% and 5% (for a maximum of 26% total oxygen) (Williams 1994).
Modern installations may also incorporate recuperative heating in order to utilize the combustion potential of the off-gas (American Cast Metals Association [ACMA] et al. 1990). Gas temperatures in the cupola are estimated to be approximately 540oF higher than the melting temperature of the solid charge. A melting temperature of 2,192oF for cast iron would then correspond to a gas temperature of 2,732oF (AFS 1982).
Cupola Furnace Variations Are Possible
Some variations of cupola melting include “cokeless” cupola melting and plasma arc cupola melting. The cokeless cupola is a relatively new technology that relies on oil- or gas-fired burners. The charge material is supported by a bed of either refractory spheres or broken refractory products such as bricks. The entire mass rests on a water-cooled grate. The cokeless cupola is often
used in conjunction with a channel induction holding furnace (ACMA et al. 1990).
The plasma-fired cupola consists of a conventional cupola shaft furnace fitted with plasma torches. Although some coke is used to provide carbon and to ensure proper charge porosity, the energy to melt the iron is supplied mainly by plasma gas rather than coke combustion. The velocity of the gases rising in this type of furnace is low compared to a conventional cupola furnace. This enables low-cost charging materials (e.g., borings and turnings) to be used because they do not become entrained in the lower-velocity gases.
3.2 Summary of Inputs/Outputs
Inputs: Iron (scrap and/or pig) Coke Limestone Air Electricity Oil and/or gas (for “cokeless” cupolas) Process water
Outputs: Molten iron Slag Carbon dioxide Carbon monoxide Sulfur dioxide and nitrogen oxides Particulate emissions (dust and fume) Gaseous organic emissions Effluents
Figure 3-1 illustrates a typical cupola furnace and a “cokeless” gas-fired cupola.
3.3 Energy Requirements
Cupola Is Major Energy Consumer in Iron Foundries
Approximately half of the total energy used in iron foundries with cupolas is consumed in the furnaces (ACMA et al. 1990). Table 3-1 shows estimated energy use in the cupola furnace.
28

Key Energy and Environmental Facts - Cupola Melting
Energy Emissions Effluents Byproducts
Energy Use (106 Btu/ton of good castings shipped)
Coke - 5.8 Electricity - 1.1 Natural Gas - 1.6 Oxygen - 0.1
TOTAL - 8.6 106 Btu/ton
CO2, CO, SO2, NOx, Particulate (can contain cadmium, CaO, FeO, lead, MgO, MnO, SiO, zinc), gaseous organic compounds
Largest Source - Incomplete combustion of carbon additives, dirt and scale on the scrap charge
Largest Source - Wet scrubber systems
Typical Scrubber Water Volume - ~1,000 gallons per
ton of dust
Slag Wet scrubber sludge
Typical Melt Losses - 7% to 10%
Charging Door
Lining
Shell
Blast Air Duct to Windbox
Air
Tuyere
Slag Spout
Sand Bottom
MeltingZone
CokeBed
Metal Charge
Limestone
Coke Charge
Windbox
Downcomer, Pipes to Blast Air to Tuyere
Air Sight Port at Tuyere
Slag Molten Metal
Tapping Spout Steel-Bottom Doors
Figure 3-1. Cupola Furnace Diagram
29

“Cokeless” Gas-Melting Cupola
Figure 3-1 (continued)
Table 3-1. Energy Use in the Cupola Furnacea
MJ/net metric 106 Btu/net ton MJ/net metric 106 Btu/net ton ton of good of good ton of metal of metal castings castings
Energy Source melted meltedc shippedb shippedb
Coke 3,689 3.5 6,113 5.8
Electricity 632 0.6 1,159 1.1
Natural Gas 1,054 1.0 1,686 1.6
Oxygen 105 0.1 105 0.1
NET TOTAL 5,480 5.2 9,063 8.6
a Estimated on a national basis. Excludes transportation energy. b Assumes 60% yield from molten iron to good castings shipped.
Based on coke energy content of 24.8 million Btu/ton (Energy Information Administration 1995) (excludes cokemaking energy requirements).
Sources: American Cast Metals Association et al. 1990. Williams 1994.
Casting Plant Technology International 1997.
30
c

Traditional cupola furnaces have thermal efficiencies in the range of 40% to 50%. Inefficiencies are usually due to incomplete combustion of coke and deficient heat exchange in the cupola stack (Krymsky 1995). The metallurgical coke used to fuel cupola furnaces has an energy content of approximately 14,500 Btu/lb (AFS 1992). Coke fines are sometimes injected into the cupola as supplementary charge fuel in order to reduce fuel costs. Supplemental natural gas firing may also be used to reduce slag, emissions, and energy costs.
A well-designed cupola requires about 200 pounds of coke per ton of hot metal. This includes carbon for carburizing the hot metal, and the bed coke and the carbon monoxide contained in the top gas to supply the necessary energy for preheating blast air, oxidizing VOCs in the tops gas, and aiding in dioxin control. Additional energy is required for carburizing, afterburners, and air pollution control systems (Kaiser 1994).
The energy requirements of cupola melting depend on the specifics of the coke combustion process and the transfer of heat from the combustion gases to the metal. The cupolas with the highest thermal efficiency are those operated continuously at high utilization rates.
The total energy distribution of the coke used in a typical lined cupola is as follows (AFS 1992):
• Heat content of iron 42% • Heat content of slag 3% • Heat loss through lining shell 7% • Sensible heat stack gas 13% • Latent heat stack gas 35%
This breakdown shows that more than half of the heat generated by the burning coke is lost to the surroundings, mainly through exhaust gases.
The air pollution control systems (discussed in Section 3.4) used with cupola furnaces also use energy (e.g., wet scrubber systems use electric power to run fans and pumps). In general, the higher the degree of gas cleaning that is desired, the more the power that is used per unit weight of gas throughput (Beckwith 1994).
Energy can be recovered from the hot blast using recuperators or heat exchangers. As stated in Section 3.1, the recovered energy is used to preheat the blast air being injected into the cupola. Disincentives for adopting this technique include the capital costs and the tendency for plugging.
Other energy efficiency improvements include the use of divided blast systems, where the tuyeres are located in two rows, and oxygen enrichment (discussed in Section 3.1). Anthracite coke and shredded auto tires have also been used as supplementary fuels to reduce cupola coke consumption, but they require process modifications and may lead to operating problems.
3.4 Emissions
Because the cupola is coke-fired and requires a high volume of air flow for the combustion process, it produces relatively high levels of emissions.
CO2 Is Emitted During Combustion
Emissions from cupola furnaces include carbon dioxide and carbon monoxide. Carbon dioxide is a product of combustion, and carbon monoxide is produced because of incomplete combustion of the coke. The partial reduction of carbon dioxide to carbon monoxide depends on the furnace temperature and the amount and type of organic material contaminating the scrap. A typical exhaust gas contains 15% to 20% carbon monoxide (Krymsky 1995).
Proper combustion of hydrocarbons in exhaust gas and control of dioxin formation require relatively precise and adjustable steady-state temperature conditions in the top gas. In continuously operating cupola melting, coke-generated carbon monoxide provides the heat energy for achieving this on a relatively constant basis (Kaiser 1994).
It has been estimated that 683 pounds of carbon dioxide are emitted during coking and subsequent melting of a ton of metal in the hot blast cupola,
31

including the use of an electric holder (Kaiser 1994). Table 3-2 shows estimated emissions of various other compounds associated with cupola melting.
Cupola Emissions Include Other Gases and Particulate
The presence of sulfur in the coke gives rise to sulfur dioxide emissions. Nitrogen oxides are also emitted as a product of combustion. Cupola particulate emissions generated during the production of molten iron are dynamic because of the nature of the melting operation. This type of furnace has varying air flow, gas temperature, gas velocity, iron-to-coke ratio, and scrap quality, all of which affect particulate emissions. An AFS survey of cupola emissions found that an average of 13 to 17 pounds of particulates are emitted per ton of metal melted in an uncontrolled cupola (Schmidt 1994).
Particulate emissions are generated during cupola melting because of incomplete combustion of carbon additives and dirt and scale on the scrap charge. Cupola particulate
a S = % sulfur in the coke.
Source: U.S. Environmental Protection Agency 1995.
emissions can contain the following: cadmium, calcium oxide, iron oxide, lead, magnesium oxide, manganese oxide, silicon oxide, and zinc. Fine particulate fumes emitted from melting furnaces result from the condensation of volatilized metal and metal oxides.
Gaseous organic compounds may also be generated if grease or oil contaminates the scrap charged to the furnace. Dioxins and furans are sometimes found in cupola furnace emissions. Compared to other melting equipment, cupolas produce the most toxic emissions. Table 3-3 shows estimates of emission factors for dioxins and dibenzofurans from cupola furnaces.
It has been found through trials heats in test cupolas that 89% to 96% of the lead contained in a cupola charge is vaporized within the cupola, subsequently oxidized, and then captured in the baghouse or scrubber (Kaiser 1994).
A modern cupola with a below-charge take-off provides a sealed gas take-off system and, with proper design and operation, eliminates fugitive emissions (Kaiser 1994). The cokeless cupola generates less dust and fume than the traditional cupola, although it still requires pollution control equipment.
Table 3-2. Emission Factors for Cupola Melting (kg/metric ton of molten metal)
Source Total Particulate
[lb/ton] CO
[lb/ton] SO2
[lb/ton] Lead
[lb/ton]
Uncontrolled 6.9 [13.8] 73 [146] 0.6Sa [1.2Sa] 0.05 - 0.6 [0.1 - 1.2]
Scrubber 1.6 [3.2] - - -
Venturi scrubber 1.5 [3.0] - - -
Electrostatic precipitator 0.7 [1.4] - - -
Baghouse 0.3 [0.6] - - -
32

Table 3-3. Emission Factors of Dioxins and Dibenzofurans for Cupola Melting
(kg/metric ton of molten metal)
Source Total Dioxins
[lb/ton] Total Dibenzofurans
[lb/ton]
Uncontrolled (baghouse inlet) 2.7 10-7 [5.3 10-7] 0.8 10-6 [1.5 10-6]
Controlled (baghouse outlet) 4.3 10-8 [8.6 10-8] 1.9 10-7 [3.8 10-7]
Source: National Center for Manufacturing Sciences 1999.
Industry Uses Controls for These and one-half with wet scrubbers. About one-fifth Pollutants of cupolas use afterburners in combination with
either fabric filters or wet scrubbers. The Wet scrubbers and fabric filters (baghouses) are afterburner is located in the furnace stack to the most commonly used devices for removing oxidize carbon monoxide and burn organic particulate from cupola exhaust gas. fumes, tars, and oils, thereby protecting the As shown in Table 3-4, approximately one-third scrubber or baghouse from possible plugging and of cupola furnaces are fitted with fabric filters explosion.
Table 3-4. Type of Air Pollution Control Devices (APCD) Used in Cupola Furnaces
Cupola Melting Rate Capacity
(tons/hour)
Air Pollution Control Device Used (% of total furnaces in each size range)
Afterburnera Fabric Filter Wet
Scrubber Other
Total with APCD (% in size range)b
0 to <10 3 27 43 5 75
10 to <20 23 47 40 6 93
20 to <30 0 50 44 0 94
30 to <40 55 46 36 9 91
40 to <50 80 10 90 0 100
50 to <70 40 40 60 0 100
70 or higher 33 67 33 0 100
a All cupolas with afterburners had some additional APCD (typically wet scrubber or fabric filter). b Total based on 144 cupolas, 125 of which had some form of APCD (some forms not specifically broken out
in table).
Source: Chester and Coburn 1996.
33

Typical efficiencies for removing particulates in baghouses exceed 99%; the efficiency of scrubbers averages around 95%, as does that of afterburners.
As mentioned in Section 3.1, more modern cupola furnaces have recuperators to recover heat from and clean furnace exhaust gas. These recuperators, when combined with a wet scrubber system, can be used in two major configurations:
• clean first and burn later • burn first and clean later
Typical contaminants found in “clean first and burn later” wet systems include cyanide compounds, phenols, aldehydes, mercaptans, oils, polynuclear aromatic hydrocarbons, glycol ethers, benzenes, normal fly ash particulate, metals, and inorganic salts.
Typical contaminants found in “burn first and clean later” wet systems include calcium, iron, manganese, zinc, lead, copper, arsenic, cadmium, chromium, and cobalt. These systems allow the complete combustion of any volatile organics and oxidation of metals. The exact contaminants found in the fumes that are washed out in the scrubbers depend on the cleanliness of the scrap used and the sources of steel. A rough estimate is that these contaminants represent about 1.5% of the content by weight of typical dust collected from cupolas (Beckwith 1994).
3.5 Effluents
Process water needs associated with the cupola furnace include cooling and wet scrubbing for air pollution control. Some foundries using cupola furnaces generate wastewater containing metals from cooling slag with water.
Process Water Used in Wet Scrubbing
Wet scrubber systems used for controlling particulate emissions from cupolas consume large quantities of water. These systems generate both a high-water-content slurry and a residual
water stream that have to be treated. The contact of the water with the particulate matter does not form a simple suspension. Instead, it forms solutions and leachable sludges that are very difficult and expensive to treat (Beckwith 1994).
Wastewater treatment systems for cupola furnace installations are designed to circulate high-quality water back to the emission control equipment and provide water whose chemistry will accomplish the following:
• provide buffering for acid gas scrubbing • provide additional agglomeration of
particulates • prevent scaling of system piping
Typical wastewater treatment equipment includes separators, flash tanks, clarifiers, final effluent tanks, cooling towers, sludge holding tanks, dewatering presses, and lime and sand storage systems. The amount of water used by wet scrubber systems is in the range of 1,000 gallons per ton of typical dust (Beckwith 1994). Facilities using large cupola furnaces can generate up to 3,000 gallons per minute of wet scrubber wastewater (EPA 1997).
Tables 3-5 and 3-6 show the EPA’s effluent guidelines for melting furnace scrubber operations (applicable to cupola furnaces) and slag quench operations, respectively. The guidelines shown include the BPT (Best Practicable Control Technology Currently Available), BAT (Best Available Technology Economically Achievable), and NSPS (New Source Performance Standards). In addition to the guidelines shown, the pH of the effluents must be in the range of 7.0 to 10.0 at all times.
34

Table 3-5. Effluent Limitations for Melting Furnace Scrubber Operations - Average of Daily Values for 30 Consecutive Days
(kg/62.3 106 SM3 or lbs per 109 SCF of air scrubbed)
Pollutant BPTa BATb,c NSPSc,d
Copper 0.561 0.561 0.561
Lead 1.37 0.911 0.911
Zinc 1.98 1.3 1.3
Total Phenols 1.05 1.05 1.05
Oil & Grease 35 -- 35
TSSe 52.6 -- 42.1
a Best Practicable Control Technology Currently Available. b Best Available Technology Economically Achievable. c Applicable to plants casting primarily ductile or gray iron or primarily malleable.
iron where more than 3,557 tons of metal are poured per year. d New Source Performance Standards. e Total Suspended Solids. Source: Bureau of National Affairs 1996.
Table 3-6. Effluent Limitations for Slag Quench Operations Average of Daily Values for 30 Consecutive Days
(kg/106 kg, or lbs per 106 lbs of metal poured)
Pollutant BPTa BATb,c NSPSc,d
Copper 0.0291 0.0291 0.0291
Lead 0.0709 0.0473 0.0473
Zinc 0.102 0.0673 0.0673
Oil & Grease 1.82 -- 1.82
TSSe 2.73 -- 2.18
a - e Same as Table 3-5. Source: Bureau of National Affairs 1996.
3.6 Byproducts
Slag Contains Impurities from the Molten Metal
A limestone flux is typically added to the cupola charge to absorb impurities from the metallic charge. These impurities collect as a layer of nonmetallic slag on top of the layer of molten metal. Oxidation of the metal also leads to slag formation. Slag includes a varying amount of pure metal, depending on operating practices.
Cupola furnaces typically generate relatively large quantities of slag. These furnaces normally oxidize more alloy than electric melting furnaces, with a differential of about 10% of in-going silicon as a normal difference (Kaiser 1994). Melt losses in cupolas are typically in the range of 7% to 10% (ACMA et al. 1990). While this may be slightly higher than for electric melters, the amount is offset by the lower metal loss associated with cupola slagging methods. Continuously operating cupolas furnaces typically have the most efficient metal/slag separation technologies.
35
It has been found that between 3.5% to 10% of the lead contained in a cupola charge leaves the cupola in the molten iron. The cupola slag contained less than 1% of the in-going lead (Kaiser 1994).
In most cases, slag is simply disposed of to a landfill. In certain states, slag may be used for road construction, but this usually involves further pre-processing such as sizing and grading. The volume of slag generated by the average foundry does not allow economical use in this manner.
Sludge May Contain Toxic Heavy Metals
Cupola wet scrubber sludge can contain heavy metals that are not permitted to be released into the environment. Foundry sludge must be tested using the Toxicity Characteristic Leaching Procedure (TCLP) to determine if unacceptable levels of heavy metals exist. Sludge failing the TCLP test must be disposed of as a hazardous material; sludge that passes the test may be sent to regular landfills or may be used as roadbed material (Fuller et al. 1996).
3.7 Hazardous Wastes
Potential sources of hazardous wastes in foundries using cupola furnaces include furnace slag, baghouse dust, and wet scrubber sludge. Hazardous slag may be produced in melting operations if the charge materials contain toxic metals such as lead, cadmium, or chromium.
Baghouse dust from the air pollution control systems of cupola furnaces may contain hazardous components. Some efforts have been made to explore the feasibility of injecting baghouse dust through the tuyeres in the cupola, which would substantially reduce possible hazardous waste disposal costs (Kaiser 1994).
There is a wide variety of techniques in use to stabilize sludge that would otherwise be hazardous. One method uses lime and portland cement to create a matrix around the sludge to prevent the release of metals. The introduction of sulfur-containing compounds into the matrix appears to form a material that passes the TCLP and subsequent weathering tests, allowing the resulting pellets to be used as supplement to roadbed material (Fuller et al. 1996).
36

4 Electric MeltingFurnaces
4.1 Process Overview
In electric melting furnaces, energy is introduced by radiation, convection, or induction directly to the metal to be melted. Electric melting methods are flexible in terms of the metal charged and can have very high melting rates.
According to a 1996 survey of iron and steel foundries by the EPA’s Office of Air Quality Planning and Standards, the 675 responding facilities had a total of 1,202 induction furnaces and 176 electric arc furnaces installed. Of these, only 31% of the electric arc furnaces (EAFs) and fewer than 5% of the induction furnaces reported melting rate capacities of 10 tons/hr or higher. Despite these relatively small capacities, induction furnaces appear to be responsible for a significant portion of all the metal melted in the United States metalcasting industry, based on production rate information.
The survey also found that almost 87% of the EAFs are used to melt steel (or iron and steel), while only 13% are used at foundries that melt
iron only. Induction furnaces are used extensively for melting both iron and steel. Some coreless induction furnaces may also be used in aluminum melting.
Induction Furnaces Use Magnetic Fields to Generate Heat
Induction furnace technology is used in both ferrous and nonferrous melting applications, although it has historically been used most frequently for the former. Many small furnaces (in the range of 2,000 to 15,000 pounds capacity) are being used by the foundry industry to reduce costs and improve environmental performance.
Induction furnaces can be operated in several configurations, including
• single furnace system, • tandem operation, • melter and holder configuration, and • power sharing. In the conventional single furnace system, each furnace body is supplied from its own power
37

supply. In tandem operation, two furnace bodies (usually identical) are fed from a single power supply that is switched from one furnace to the other.
In melter/holder systems, an additional small power supply is used for the holding requirements. The power sharing configuration is similar to melting/holding except that a single power supply simultaneously provides melting power to one furnace and holding power to the second. In both of these configurations, the two furnaces alternate in their melting and pouring roles. Metal production can be increased by up to 20% with this type of operation (Mortimer 1994).
The major types of induction furnaces used in foundries use either coreless or channel induction technology. An induction furnace consists of a refractory structure that contains a metal coil through which an alternating current is passed. This current creates a magnetic field that induces a current on the surface of the metal. The heat generated by this current is conducted into the center of the metal mass, melting it quickly. Two variables can affect the degree of heating achieved in an induction furnace: the magnetic field’s rate of variation (frequency) and its intensity (power).
Coreless Induction Furnace Can Be Operated Using “Heel” or “Batch” Method
In a coreless induction furnace, a water-cooled, helical copper coil surrounds a refractory-lined cavity containing the charge material. An induced current is produced in the charge material by an alternating current in the coil. Once the charge is molten, stirring action occurs as a result of the interaction of currents in the melt with the magnetic field. Stirring velocity increases at higher powers and lower frequencies. Depending on the capacity and melting rate required, the frequency of the current supplied is usually classified in one of three categories as shown in Table 4-1 (Horwath et al. 1994).
Table 4-1. Induction Furnace Categories
Frequency Designation Frequency (Hz)
Mains (or line) 50 - 60
Low 150 - 500
Medium or high 500 - 10,000
Two methods are used for operating a coreless induction furnace. In the heel method (also called “tap and charge”), a portion of the liquid charge is retained in the furnace and solid charge material is added. The batch method requires the furnace to be completely emptied between melts. Batch melting on a large scale has become more common since the development of reliable high-power components for variable frequency equipment and technology that allows utilization of full power input during the entire melting cycle.
Channel Induction Furnaces Originally Used Only for Holding
In a channel-type induction furnace, the induction coil surrounds a loop of molten metal (surrounded by refractory) external to the main bath of molten metal. Liquid metal in the melting channels, combined with electromagnetic forces, causes the metal to circulate in the hearth. Channel induction furnaces were originally used as holding furnaces but more recently have been used as melting furnaces. As melting furnaces, they are limited to heel operation (which makes alloy changes difficult); other limitations may include refractory and inductor design and inductor power level. Channel induction melting furnaces have been built with capacities exceeding 100,000 pounds. Overall efficiencies are on the order of 75%. When used for holding, channel induction furnaces have capacities in the range of 1 ton to 150 tons.
38

There are three basic channel furnace designs:
• horizontal drum furnace
• semi-drum or low-profile furnace with removable cover
• vertical furnace
Electric Arc Furnaces Depend on Electricity for Heat
Electric arc furnaces are refractory-lined melting furnaces that obtain heat generated from an electric arc within the furnace. When an arc is maintained between two electrodes, the furnace is known as an indirect-arc furnace. When an arc is maintained between an electrode and the metal being melted, it is known as a direct-arc furnace. The direct-arc furnace generally has three electrodes, each connected to one of the leads of a three-phase power source.
Electrical-Resistance-Heated Reverberatory Melting Furnace Is Best for Melting Aluminum
The electrical-resistance-heated reverberatory melting furnace (ERMF) is used for aluminum melting. Much like its fuel-fired counterpart (see Section 5), this furnace is constructed with an aluminum-resistant refractory lining and a structural steel shell. The furnace is heated by silicon carbide or other resistance elements mounted horizontally above the bath. Heat is transferred through direct radiation from the refractory roof and sides (ACMA et al. 1990).
Another type of ERMF uses electric immersion-type elements. The elements are inserted into silicon carbide tubes that are immersed in the molten aluminum. Through radiation, the element passes its heat to the silicon carbide tube. Through conduction, the tube releases its heat into the bath (ACMA et al. 1990).
Drying/Preheating Improves Energy Efficiency
Although not required, scrap drying/preheating is desirable in many melting applications,
particularly iron and aluminum. Preheating serves the following functions (drying accomplishes only the first two):
• removes moisture from the charge, reducing the possibility of water/metal explosions
• removes dirt and oil, producing a cleaner charge and inhibiting slag formation
• reduces furnace energy requirements • increases furnace melting capacity
In drying systems, a non-ferrous charge is typically heated from room temperature to 600oF; preheating systems heat a ferrous charge as high as 1,200oF. Drying systems heat the scrap and other materials by passing them through an oil- or gas-fired flame tunnel, or by using heat recovered from melting. Charge preheaters are essentially charge drying systems engineered to bring scrap temperatures to around 1,000oF.
Preheating systems provide all the advantages of dryers and the added benefit of significant energy savings in the furnace (Mortimer 1994). Gas-fired preheaters have thermal efficiencies of about 60%, lower than furnace efficiency. Despite the efficiency loss, use of the relatively inexpensive gas reduces net operating costs.
EPA’s 1996 survey of iron and steel foundries reported that approximately one-fourth of the facilities with induction furnaces use scrap preheating, compared with about one-tenth of facilities with EAFs.
4.2 Summary of Inputs/Outputs
Inputs: Scrap metal Virgin metal Electrodes (for electric arc furnaces) Electricity Oxygen (for electric arc furnaces) Cooling water
Outputs: Molten metal Slag Carbon dioxide Carbon monoxide Sulfur dioxide and nitrogen oxides
39
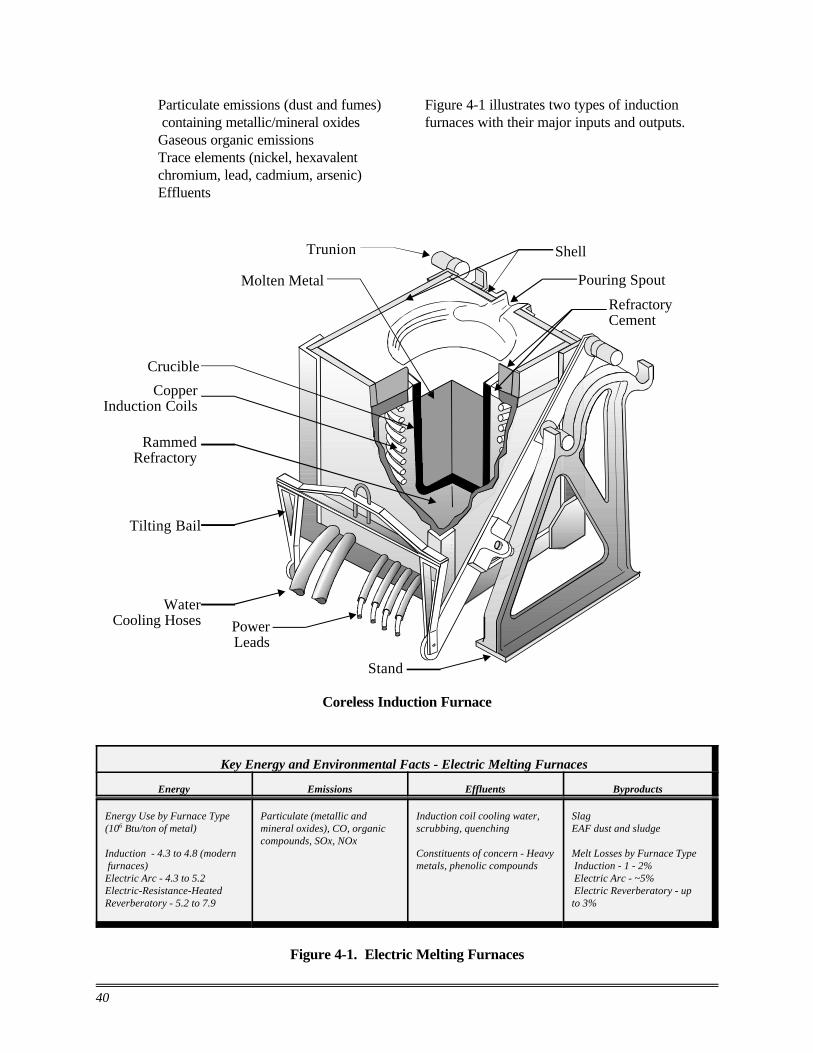
Particulate emissions (dust and fumes) containing metallic/mineral oxides
Gaseous organic emissions Trace elements (nickel, hexavalent chromium, lead, cadmium, arsenic) Effluents
Trunion
Molten Metal
Crucible
Copper Induction Coils
RammedRefractory
Tilting Bail
WaterCooling Hoses Power
Leads
Figure 4-1 illustrates two types of induction furnaces with their major inputs and outputs.
Shell
Pouring Spout
Refractory Cement
Stand
Coreless Induction Furnace
Key Energy and Environmental Facts - Electric Melting Furnaces
Energy Emissions Effluents Byproducts
Energy Use by Furnace Type Particulate (metallic and Induction coil cooling water, Slag (106 Btu/ton of metal) mineral oxides), CO, organic scrubbing, quenching EAF dust and sludge
compounds, SOx, NOx Induction - 4.3 to 4.8 (modern Constituents of concern - Heavy Melt Losses by Furnace Type furnaces) metals, phenolic compounds Induction - 1 - 2%Electric Arc - 4.3 to 5.2 Electric Arc - ~5%Electric-Resistance-Heated Electric Reverberatory - up Reverberatory - 5.2 to 7.9 to 3%
Figure 4-1. Electric Melting Furnaces
40

Power Leads
CarbonElectrodes
Door
Spout Slag
Metal
Rammed Hearth
Electric Arc FurnaceFigure 4-1 (continued)
4.3 Energy Requirements
Energy Consumption of Induction Furnace Depends on Many Variables
The overall efficiency of coreless induction furnaces depends on furnace operating parameters and factors related to the charge. Energy consumption in coreless induction furnaces is affected by the contaminants (e.g., rust, sand, oil, water, coatings) on the charge since these materials contribute to slag formation (Horwath et al. 1994). Removing the slag requires additional time during the melt cycle, thereby lowering efficiency.
About 20% more energy is required to melt virgin gray iron in coreless induction furnaces than if the iron is scrap material. Researchers theorize that it takes a higher temperature and longer melting times to get the carbon from virgin material into solution. These differences between virgin materials and scrap have not been shown, however, for carbon and low-alloy steel (Horwath et al. 1994).
Other variables affecting energy use during coreless induction melting include the melting method (heel versus batch); power application (step power versus full power); use of covers; and furnace condition (e.g., hot, medium, or cold). For ferrous materials, heel melting typically requires less energy than batch melting (on the order of 5% less for stainless steel), as does the use of a hot furnace (about 2% to 4% less for gray iron and low-alloy steel compared to cold conditions).
Coreless induction furnaces have electrical efficiencies in the range of 76% to 81%, although the efficiency of an inductor is around 95% (ACMA et al. 1990). Induction furnaces operated in tandem can achieve a maximum electric power utilization exceeding 80% (excluding power plant losses).
41

Coil Cooling Energy Losses Are Highest
About 75% of the energy delivered to the furnace is used for increasing the temperature of the metal. The main source of energy loss is via the coil water cooling system, typically a 20% to 30% loss (ACMA et al. 1990, Smith and Bullard 1995).
Other energy losses in a coreless induction furnace come from
• conductive losses through the lining, • heat losses associated with the slag, and • radiation losses when the furnace lid is open.
Heat losses associated with slag are a function of the temperature and composition of the slag produced. The heat content of a typical slag is about 410 kWh/ton at 2,800oF. Unless large quantities of slag are produced, the heat loss due to slag does not detract substantially from the overall performance of the furnace (AFS 1982). Radiation heat losses from an uncovered molten bath and the bottom of an opened cover can reach 130 kW for a 10-ton furnace. However, radiant heat loss, which is so significant for iron melting, is less of an issue for aluminum melting.
Efficient Induction Furnaces Can Use As Little As 500 kWh/Metric Ton
Table 4-2 summarizes the energy requirements for various types of electric melting furnaces. Overall energy consumption for medium-frequency induction melting is generally in the range of 520 to 800 kWh/metric ton. The use of furnace covers and other energy efficiency measures can reduce melting-related energy consumption to as low as 500 kWh/metric ton. Allowing for holding power requirements and ancillary equipment, overall energy consumption is reported to be in the range of 550 to 650 kWh/metric ton (Booth 1996).
With modern, efficient, solid state power electronics, the energy required in many induction furnaces can be as low as 500 kWh per metric ton for aluminum or iron at high utilization rates (Smith and Bullard 1995).
Energy consumption for electric arc furnaces ranges from 450 to 550 kWh/ton of charge, depending on the scrap type and length of time heat is applied (ACMA et al. 1990).
For the electric-resistance-heated reverberatory melting furnace, the only heat loss is through the shell and from exposed radiant metal surfaces.
Table 4-2. Electricity Use in Electric Melting Furnaces (kWh/metric ton of metal)
Induction [106 Btu/tona]
Electric Arc [106 Btu/tona]
Electric-Resistance-Heated Reverb
[106 Btu/tona]
520 - 800b [5.0 - 7.6] 500 - 550c [4.3 - 4.8]
500 - 600 [4.3 - 5.2] 600 - 825 [5.2 - 7.9]
a Using electricity conversion factor of 10,500 Btu/kWh. b Ferrous melting. Medium-frequency coreless. When ancillary equipment energy use is included, the total
ranges from 550 to 650 kWh/metric ton of metal. c Modern, efficient furnaces.
Sources: Smith and Bullard 1995. Booth 1996. Process Metallurgy International 1998.
42

4.4 Emissions
Induction Furnaces Have Small Off-Gas Emissions
Emissions from electric melting furnaces include particulates and gases. The particulate emissions from induction furnaces are mainly comprised of iron oxides. High emissions rates from clean charge are typically the result of a cold charge. The dirtier the charge material, the higher the emissions. Dust emissions from induction furnaces also depend on the composition of the charge material, the melting method, and the melting rate.
Emissions released from melting furnaces are primarily particulate matter consisting of volatile metals. Fine particulate fumes emitted from melting furnaces result from the condensation of volatilized metal and metal oxides (EPA 1995). Other emissions include carbon monoxide, organic compounds, sulfur dioxide, and nitrogen oxides. These emissions are generated from incomplete combustion of carbon additives, and dirt and scale on the scrap charge.
Organic material in the scrap and the furnace temperature affect the amount of carbon monoxide generated. Any polymers (especially vinyl polymers) in the scrap may generate organic emissions, but the levels of these emissions have not been quantified because of variability in scrap composition (McKinley et al. 1993).
The highest concentrations of furnace emissions occur when furnace doors are open during charging, backcharging, alloying, pouring, slag removal, and tapping operations. The charging and pouring operations generate the vast majority of all the dust and fume emissions within the melt cycle. These emissions are normally collected and vented through roof openings.
Since the heat in an induction furnace is applied electrically, and the molten metal/air interface is relatively small, off-gas volumes are smaller for
induction furnaces than for electric arc furnaces (A.D. Little 1992). Induction furnaces emit about 75% less dust and fumes than electric arc or cupola furnaces because of the absence of combustion bases and lower superheat temperatures (EPA 1997).
Electric arc furnace melting generates particulate emissions of metallic and mineral oxides from the vaporization of iron and transformation of mineral additives. This particulate matter is controlled by high-energy scrubbers and fabric filters. Carbon monoxide emissions result from the combustion of graphite from electrodes and of carbon added to the charge. Hydrocarbons result from vaporization and incomplete combustion of any oil remaining on the scrap iron charge (EPA 1995).
Table 4-3 presents data on process emissions of particulate, CO, SO2, VOCs, and lead from electric melting furnaces. In addition, a recently published report by the National Center for Manufacturing Sciences (NCMS) found an average of 6.0 pounds of particulate matter per ton of metal melted for gray iron foundries, which includes some cupola furnaces (NCMS 1999). Table 4-4 presents estimates of combustion-related emissions associated with the generation of the electricity required for each type of electric furnace described in Table 4-2.
Control Devices Handle Furnace Emissions
Emission controls for melting and refining operations involve venting furnace gases and fumes directly to a control device. Canopy hoods or special hoods near furnace doors and tapping points capture emissions and route them to emission control systems (EPA 1992). Capture systems handle dust and fumes from charging operations, melting, backtilting for deslagging, and pouring. Particulate emissions are generally controlled by fabric filters. Table 4-5 lists the types of air pollution control devices (APCDs) used by induction and electric arc furnaces.
43

Table 4-3. Process Emission Factors for Electric Furnace Melting (kg/metric ton of molten metal)
Source Total Particulate
[lb/ton] CO
[lb/ton] SO2
[lb/ton] VOCs
[lb/ton] Lead
[lb/ton]
Induction Uncontrolled
Baghouse
0.5 [1.0]
0.1 [0.2]
Negligible
-
Negligible
-
Unknown
-
0.005 - 0.05 [0.01 - 0.1]
-
Electric Arc Furnace Uncontrolled
Baghouse
6.3 [12.6]
0.2 [0.4]
0.5 - 19 [1 - 38]
-
Negligible
-
0.03 - 0.15 [0.06 - 0.30]
-
Unknown
-
Source: U.S. Environmental Protection Agency 1995.
Table 4-4. Combustion-Related Emission Factors for Electric Furnace Meltinga
(kg/metric ton of molten metal)
Source Total Particulate
[lb/ton] SOx
[lb/ton] NOx
[lb/ton] VOCs
[lb/ton] CO2
[lb/ton]
Induction Medium-freq. coreless furnace
Modern, efficient furnace
1.0 - 1.6 [2.0 - 3.2] 1.0 - 1.1
[2.0 - 2.2]
3.6 - 5.6 [7.2 - 11.2] 3.45 - 3.85 [6.9 - 7.7]
1.4 - 2.2 [2.8 - 4.3] 1.35 - 1.5 [2.7 - 3.0]
0.0085 - 0.0135 [0.017 - 0.027] 0.008 - 0.009
[0.016 - 0.018]
326.5 - 506.5 [653 - 1,013] 312.5 - 347 [625 - 694]
Electric Arc 1.0 - 1.2 [2.0 - 2.4]
3.45 - 4.2 [6.9 - 8.4]
1.4 - 1.6 [2.7 - 3.2]
0.008 - 0.01 [0.016 - 0.020]
312.5 - 378 [625 - 756]
Electric-Resistance-Heated Reverb
1.2 - 1.65 [2.4 - 3.3]
4.2 - 5.75 [8.4 - 11.5]
1.6 - 2.2 [3.2 - 4.4]
0.01 - 0.014 [0.020 - 0.028]
378 - 520.5 [756 - 1,041]
a Electricity-based emissions based on the U.S. National Grid (57% coal, 20% nuclear, 11% hydro, 9% natural gas, 2% oil). Combustion emissions factors used (in lb/million Btu) were as follows: Particulate 0.412, SOx - 1.459, NOx - 0.5615, VOCs - 0.0035, CO2 - 132.105. Based on data in Table 4-2.
Sources: U.S. Environmental Protection Agency 1995. U.S. Department of Energy, Energy Information Administration 1997.
Table 4-6 summarizes the number of induction Because induction furnaces emit negligible furnaces and electric arc furnaces (by melting amounts of hydrocarbon and carbon monoxide rate capacity) that have installed air pollution emissions and relatively little particulate, they are control devices. Fabric filters represent the vast often not controlled except during charging and majority of APCDs on these furnaces (about pouring operations (EPA 1992). Over 75% of 85% for induction furnaces and 100% for electric the induction furnaces that have a capacity arc furnaces) of APCDs on these furnaces. greater than 5 tons/hour have APCDs. Furnaces with the largest melting capacities all have APCDs.
44

Table 4-5. Types of Air Pollution Control Devices Used in Electric Furnacesa,b
Air Pollution Control Device
Number of Furnaces by Type
Induction Electric Arc
Fabric Filter 276 168
Web Scrubber 16 --
Fabric Filter & Wet Scrubber -- --
Fabric Filter & Other 7 --
Other 25 --
None 871 7
Not Reported 7 1
Afterburner -- --
TOTAL 1,202 176
a Not all furnace capacities were reported with units. Therefore, some of the capacities may be holding capacities rather than melting rates. Only the responses that specifically reported capacities in units of melting rates were included in this table.
b Nearly all air pollution control devices used for electric furnaces are fabric filters. Source: Chester and Coburn 1996.
4.5 Effluents
Process water is used for furnace cooling, scrubbing, and slag quenching.
Induction Furnaces Produce Several Effluents
A water cooling system is used to cool the power coil in induction furnaces, preventing overheating of the copper. Some furnaces use once-through cooling systems; a few induction furnaces are cooled by open recirculating cooling water systems.
Foundry effluents contain heavy metals that may exceed EPA limits. These metals are typically removed from wastewater by pH adjustment to form insoluble metal hydroxide followed by a settling step.
Foundry effluents also contain a number of phenolic compounds which are typically chemically oxidized or destroyed if the concentration exceeds prescribed limits. Current technology uses chlorine dioxide as the oxidant of choice to destroy phenols. This oxidant is injected directly into the wastewater stream either before or after a clarifier. The reaction of the chlorine dioxide with phenols can form hydroquinones and subsequently 1,4 benzoquinone at pH < 10. These compounds are oxidized further to organic acids (mainly maleic and oxalic) and, if the reactions continue to completion, to carbon dioxide and water (Fuller et al. 1996).
Tables 4-7 and 4-8 show the EPA’s guidelines for the effluents from melting furnace scrubber operations and slag quench operations, respectively. The guidelines shown include the BPT (Best Practicable Control Technology Currently Available), BAT (Best Available
45

Table 4-6. Numbers of Electric Furnaces Fitted with Air Pollution Control Devices (APCD) a,b
Furnace Melting Rate
Capacity (tons/hour)
Induction Furnaces Electric Arc Furnaces
Total Furnaces
Total Furnaces with
APCD (%)
Total Furnaces
Total Furnaces with APCD (%)
0 to <5 554 140 (25) 51 45 (88)
5 to < 10 53 40 (75) 23 23 (100)
10 to <20 16 12 (75) 15 15 (100)
20 to <30 7 4 (57) 13 13 (100)
30 to <40 2 2 (100) 2 2 (100)
40 to <50 0 0 0 0
50 to <70 0 0 3 3 (100)
70 or higher 4 4 (100) 0 0
TOTAL 636 202 (32) 107 101 (94)
a Not all furnace capacities were reported with units. Therefore, some of the capacities may be holding capacities rather than melting rates. Only the responses that specifically reported capacities in units of melting rates were included in this table.
b Nearly all air pollution control devices used for electric furnaces are fabric filters.
Source: Chester and Coburn 1996.
Technology Economically Achievable), and NSPS (New Source Performance Standards). In addition to meeting the guidelines shown, the pH of the effluents must be in the range of 7.0 to 10.0 at all times.
Cooling Water Treatment Systems Process Water for Reuse
The major types of cooling water treatment systems are (Fuller et al. 1996)
• open recirculating systems, • once-through systems, and • closed recirculating systems.
Open systems generally utilize a cooling tower (sometimes a spray pond) that cools recirculating
water by evaporation. As water evaporates, dissolved and suspended solids concentrate.
In a once-through system, water is passed through a system or piece of equipment only once and is discharged essentially unchanged except for an increase in temperature. Some induction furnace cooling systems use once-through cooling systems. Closed recirculating systems are often used to cool furnaces, especially induction furnaces.
Water in closed systems is almost always cooled by passing it through a shell-and-tube heat exchanger, with water in the closed system on the shell side and cooling water forming an open recirculating system on the tube side.
46
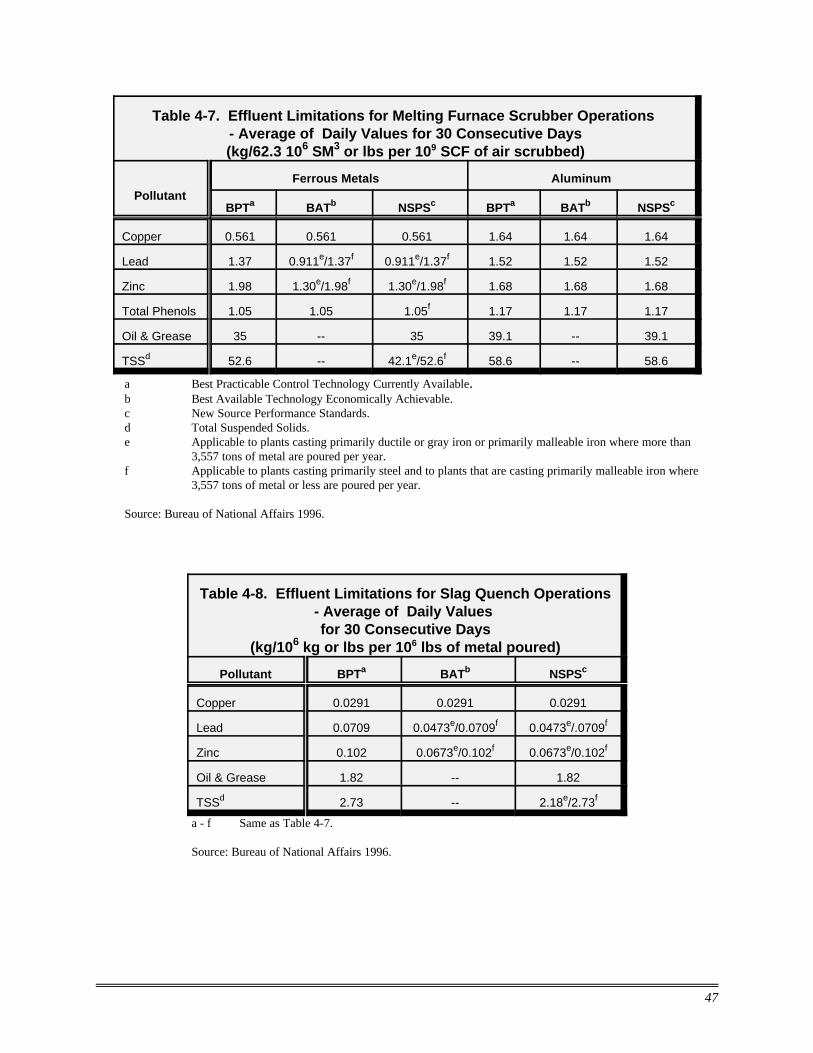
Table 4-7. Effluent Limitations for Melting Furnace Scrubber Operations - Average of Daily Values for 30 Consecutive Days (kg/62.3 106 SM3 or lbs per 109 SCF of air scrubbed)
Pollutant Ferrous Metals Aluminum
BPTa BATb NSPSc BPTa BATb NSPSc
Copper 0.561 0.561 0.561 1.64 1.64 1.64
Lead 1.37 0.911e/1.37f 0.911e/1.37f 1.52 1.52 1.52
Zinc 1.98 1.30e/1.98f 1.30e/1.98f 1.68 1.68 1.68
Total Phenols 1.05 1.05 1.05f 1.17 1.17 1.17
Oil & Grease 35 -- 35 39.1 -- 39.1
TSSd 52.6 -- 42.1e/52.6f 58.6 -- 58.6
a Best Practicable Control Technology Currently Available. b Best Available Technology Economically Achievable. c New Source Performance Standards. d Total Suspended Solids. e Applicable to plants casting primarily ductile or gray iron or primarily malleable iron where more than
3,557 tons of metal are poured per year. f Applicable to plants casting primarily steel and to plants that are casting primarily malleable iron where
3,557 tons of metal or less are poured per year.
Source: Bureau of National Affairs 1996.
Table 4-8. Effluent Limitations for Slag Quench Operations - Average of Daily Values for 30 Consecutive Days
(kg/106 kg or lbs per 106 lbs of metal poured)
Pollutant BPTa BATb NSPSc
Copper 0.0291 0.0291 0.0291
Lead 0.0709 0.0473e/0.0709f 0.0473e/.0709f
Zinc 0.102 0.0673e/0.102f 0.0673e/0.102f
Oil & Grease 1.82 -- 1.82
TSSd 2.73 -- 2.18e/2.73f
a - f Same as Table 4-7.
Source: Bureau of National Affairs 1996.
47
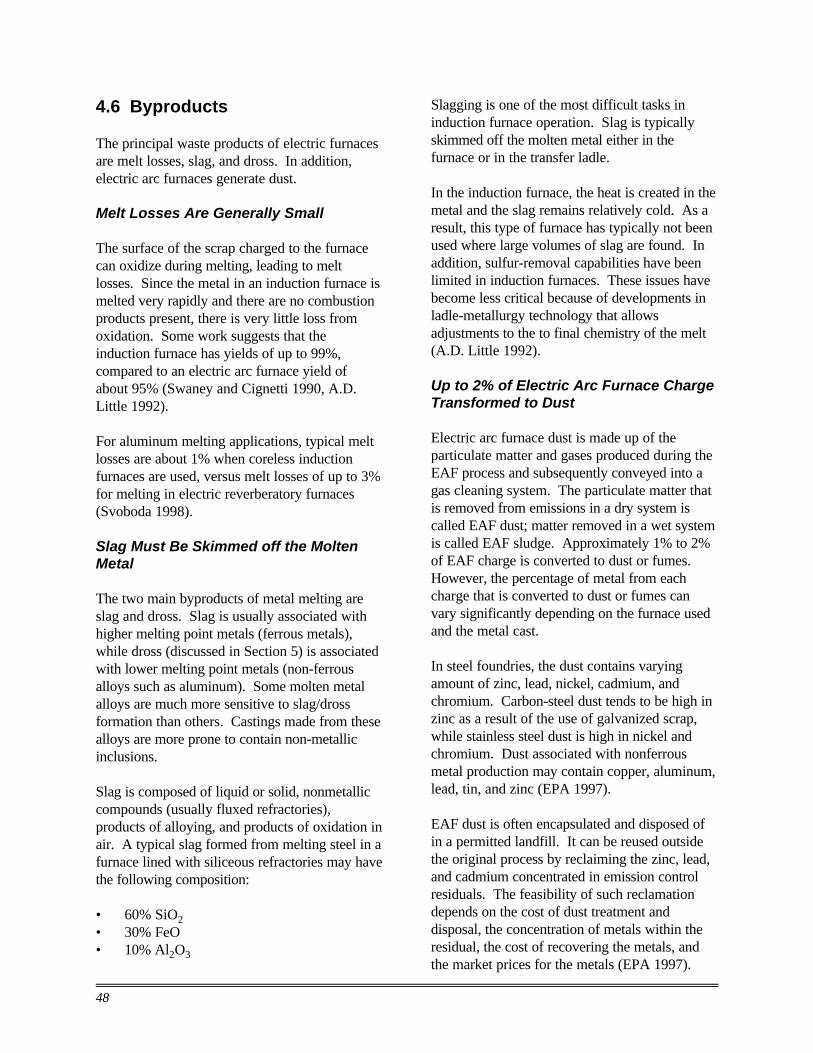
4.6 Byproducts
The principal waste products of electric furnaces are melt losses, slag, and dross. In addition, electric arc furnaces generate dust.
Melt Losses Are Generally Small
The surface of the scrap charged to the furnace can oxidize during melting, leading to melt losses. Since the metal in an induction furnace is melted very rapidly and there are no combustion products present, there is very little loss from oxidation. Some work suggests that the induction furnace has yields of up to 99%, compared to an electric arc furnace yield of about 95% (Swaney and Cignetti 1990, A.D. Little 1992).
For aluminum melting applications, typical melt losses are about 1% when coreless induction furnaces are used, versus melt losses of up to 3% for melting in electric reverberatory furnaces (Svoboda 1998).
Slag Must Be Skimmed off the Molten Metal
The two main byproducts of metal melting are slag and dross. Slag is usually associated with higher melting point metals (ferrous metals), while dross (discussed in Section 5) is associated with lower melting point metals (non-ferrous alloys such as aluminum). Some molten metal alloys are much more sensitive to slag/dross formation than others. Castings made from these alloys are more prone to contain non-metallic inclusions.
Slag is composed of liquid or solid, nonmetallic compounds (usually fluxed refractories), products of alloying, and products of oxidation in air. A typical slag formed from melting steel in a furnace lined with siliceous refractories may have the following composition:
• 60% SiO2 • 30% FeO • 10% Al2O3
Slagging is one of the most difficult tasks in induction furnace operation. Slag is typically skimmed off the molten metal either in the furnace or in the transfer ladle.
In the induction furnace, the heat is created in the metal and the slag remains relatively cold. As a result, this type of furnace has typically not been used where large volumes of slag are found. In addition, sulfur-removal capabilities have been limited in induction furnaces. These issues have become less critical because of developments in ladle-metallurgy technology that allows adjustments to the to final chemistry of the melt (A.D. Little 1992).
Up to 2% of Electric Arc Furnace Charge Transformed to Dust
Electric arc furnace dust is made up of the particulate matter and gases produced during the EAF process and subsequently conveyed into a gas cleaning system. The particulate matter that is removed from emissions in a dry system is called EAF dust; matter removed in a wet system is called EAF sludge. Approximately 1% to 2% of EAF charge is converted to dust or fumes. However, the percentage of metal from each charge that is converted to dust or fumes can vary significantly depending on the furnace used and the metal cast.
In steel foundries, the dust contains varying amount of zinc, lead, nickel, cadmium, and chromium. Carbon-steel dust tends to be high in zinc as a result of the use of galvanized scrap, while stainless steel dust is high in nickel and chromium. Dust associated with nonferrous metal production may contain copper, aluminum, lead, tin, and zinc (EPA 1997).
EAF dust is often encapsulated and disposed of in a permitted landfill. It can be reused outside the original process by reclaiming the zinc, lead, and cadmium concentrated in emission control residuals. The feasibility of such reclamation depends on the cost of dust treatment and disposal, the concentration of metals within the residual, the cost of recovering the metals, and the market prices for the metals (EPA 1997).
48

Most of the EAF dust recovery options are only economically viable for dust with a zinc content of at least 15% (EPA 1997). For example, while EAF dust recovery is feasible in some nonferrous foundries (e.g., brass), its use in gray iron foundries is extremely limited. Some foundries market furnace dust as input to brick manufacturing and other consumer product applications (EPA 1997).
4.7 Hazardous Wastes
Both hazardous slag and dust can be generated from electric furnaces.
Hazardous Slag Can Be Recycled to Cupola Furnace
Hazardous slag may be produced in melting operations if the charge materials contain toxic metals such as lead, cadmium, or chromium. For example, slag from stainless steel melting operations is hazardous as a result of high chromium concentrations. Such slag can be recycled as a feed to cupola furnaces; the cupola furnace slag scavenges trace metals from the induction furnace slag. The resulting cupola slag may be rendered a nonhazardous waste (EPA 1997).
Hazardous EAF Dust Can Be Treated in High-Temperature Metals Recovery Facilities
A number of high-temperature processes have been developed in which the EAF dust is processed in a furnace or reactor with a reductant to recover the zinc, lead, and cadmium as metals or in the oxide state. The element of the most value is zinc.
Pyrometallurgical methods for metals recovery are based on the reduction and volatilization of zinc, lead, cadmium, and other components of EAF dust. Lead is removed through roasting in an oxidizing environment, while zinc, cadmium, and other metals are removed through roasting under reduced conditions. The rotary or Waelz kiln method can simultaneously reduce ferrous iron oxide to solid iron and lead and zinc oxide to their metallic forms (EPA 1997). These metals become entrained in the furnace off-gas and are carried to an external dust collection system. The resulting oxide is a crude zinc-bearing product that is further refined at zinc smelters.
49

50
5 Fuel-Fired Melting Furnaces
5.1 Process Overview
There are two major types of fuel-fired furnaces used in the metal casting industry — crucible furnaces and reverberatory furnaces. Both of these furnaces are used almost exclusively in nonferrous metal melting applications. In addition, the “cokeless” cupola (discussed in Section 3) is fueled by oil or gas.
A distinction must be made between furnaces used in the typical foundry and those used by smelters and refiners. Although smelters and refiners are part of the metalcasting industry, these operations are very different from those of foundries, as are their energy and environmental characteristics. Foundries typically purchase their metal already alloyed by the refiner/smelter. They then melt this pre-alloyed ingot, and their own foundry-generated castings and returns, to produce castings.
Crucible Furnaces Have a Simple Design
Crucible furnaces, the simplest and oldest metal melting furnaces, are typically used for alloys that melt at relatively low temperatures, such as aluminum and copper-based alloys. These furnaces may be of the stationary lift-out type or the tilting type. A crucible furnace usually consists of a refractory-lined steel shell with a movable cover. A crucible made of either a clay-graphite or clay-silicon-carbide mixture is used within the furnace.
The capacity of the crucible furnace is limited by the size of the crucible. Lift-out crucibles are the most flexible in terms of alloys that can be melted.
Most crucibles are fired by gas or oil (or electricity), although coal or coke is also occasionally used.
51

Reverberatory Furnaces Are the Choice for Melting Aluminum
Gas-fired reverberatory furnaces are the most commonly used technology for aluminum melting applications. The reverberatory furnace is constructed with an aluminum-resistant refractory lining and a structural steel shell. The furnace is heated by direct-fired burners. Heat is transferred through direct radiation from the elements and radiation from the hot combustion products.
In a fuel-fired reverberatory furnace, heat from ignited fuel is directed down from the furnace roof and into the melted charge. The molten metal may be circulated using pumps or other methods to increase productivity, reduce fuel consumption, and enhance homogeneity.
Scrap is charged into the furnace with flux materials that combine with contaminants and float to the surface, trapping impurities and providing a barrier that reduces oxidation of the melted aluminum. Scrap may be charged as high-density bales, loosely packed bales, or as dry shredded scrap.
At refiners and smelters, reverberatory furnaces are required to melt dirty scrap containing paint, oil, lubricants, coatings, and/or any substance containing HAPs. Typical types of dirty scrap include insulated wire, oily borings and turnings, coated used beverage cans, and coated/painted aluminum foil. Reverberatory melters with a side-charge well and rotary barrel furnaces both work well with smaller, dirtier types of scrap.
Fluxing Minimizes Loss of Aluminum
Fluxing is usually performed with standard reverberatory melting furnaces to minimize metal loss. A molten salt, usually a mixture of about 60% NaCl and 40% KCl, is added to the furnace. Upon agitation, the molten salt wets the impurities in the scrap and causes them (and the flux itself) to separate from the aluminum. The flux also prevents the melted aluminum from becoming oxidized in the furnace. The separated aluminum forms droplets that coalesce to form a liquid
aluminum pool beneath the molten salt (Sheth et al. 1995).
Smelters Use Demagging and Degassing to Improve Aluminum Quality
Removal of magnesium (“demagging”), one of the most critical impurities in scrap, is an important step in the production and smelting of low-magnesium aluminum alloys for sand, permanent mold, and die casting applications. Since the blend of scrap materials used to charge aluminum melting furnaces can contain materials with relatively high levels of magnesium, it is often necessary to remove a portion of the magnesium so the final product meets the specifications.
Demagging reduces the magnesium content of the molten charge from approximately 0.5% to about 0.1%. The most common materials used in demagging operations are chlorine and aluminum fluoride. In chlorine demagging, chlorine gas is injected into the turbulent flow of the molten aluminum, where it reacts with the magnesium to form a solid that floats to the surface of the molten aluminum and is trapped in the flux layer. Other chlorinating agents or fluxes, such as anhydrous aluminum chloride or chlorinated organics, can also be used. In fluoride demagging, aluminum fluoride is reacted with magnesium to produce a magnesium fluoride salt.
Demagging operations are typically carried out by larger metal casters, for example large die casting companies that work with large volumes of metal. Smaller casting operations do not perform demagging, typically relying on higher-purity charge materials.
Molten aluminum may also be degassed to remove hydrogen gas bubbles, which cause undesirable porosity in solid-phase aluminum. The molten aluminum is agitated using inert gases (chiefly nitrogen or argon), causing any entrained gases and solid particles to rise to the surface and be removed. Exposure to oxygen in the atmosphere causes the molten aluminum to oxidize, and the flotation of the impurities to the surface along with any salt flux creates a semi-solid known as
52
black dross. The dross is then skimmed from the surface of the melt.
5.2 Summary of Inputs/Outputs
Inputs: Scrap metal Flux (a mixture of salts, usually NaCl
and KCl) Oil and/or gas Chlorine and/or aluminum fluoride for demagging (at smelters) Process water
Outputs: Molten metal Dross Carbon dioxide Carbon monoxide Sulfur dioxide and nitrogen oxides Particulate emissions (dust and fumes) containing metallic and mineral oxides Gaseous organic emissions Chloride and fluoride emissions Trace elements (nickel, hexavalent chromium, lead, cadmium, arsenic) Effluents
Figure 5-1 illustrates the crucible furnace and the reverberatory furnace with their major inputs and outputs.
5.3 Energy Requirements
Most Fuel-Fired Furnaces Rely on Natural Gas
Natural gas is the most commonly used fuel for crucible and reverberatory furnaces. Table 5-1 summarizes the energy consumption needs for some of these furnaces. These requirements are expressed as ranges for some of the technologies. The higher energy requirements reflect older, less efficient furnaces, while the lower numbers represent newer furnaces or those that have been modified with energy-saving features.
For gas-fired reverberatory furnaces operating at temperatures of 1,500oF to 1,800oF (in aluminum melting applications), only about one-third of the energy introduced is utilized in the furnace, with the remainder leaving in the form of flue gas losses (Wechsler and Gitman 1990). Some older furnaces can have efficiencies less than 25% (Robinson 1998). The use of oxygen-enriched combustion air can increase this efficiency, although there have been problems with adapting this technique to aluminum melting.
5.4 Emissions
Both Combustion and Process Emissions Are Generated
Emissions released from melting furnaces are primarily particulate matter consisting of volatile metals. Fine particulate fumes emitted from melting furnaces result from the condensation of volatilized metal and metal oxides (EPA 1995). Other emissions may include carbon monoxide, organic compounds, sulfur dioxide, nitrogen oxides, and small quantities of chloride and fluoride compounds. These emissions are generated from dirt and scale on the scrap charge. Emissions of chloride and fluoride compounds arise when flux is added to the furnace in the case of aluminum melting.
Organic material on scrap and the furnace temperature affect the amount of carbon monoxide generated. Any polymers (especially vinyl polymers) in the scrap may generate organic emissions, but the amount of these emissions has not been measured (McKinley et al. 1993).
The highest concentrations of furnace emissions occur when furnace doors are open during charging, backcharging, alloying, pouring, slag removal, and tapping operations. The charging and pouring operations generate the majority of the dust and fume emitted from the melt cycle. These emissions are typically collected and vented through roof openings.
53

Crucible Furnace
Reverberatory Furnace
Key Energy and Environmental Facts - Gas-Fired Melting Furnaces
Energy Emissions Effluents Byproducts
Energy Use by Furnace Type (106 Btu/ton of metal melted)
Crucible - 1.8 to 6.8 Reverb - 2.5 to 5.0
Particulate (metallic and mineral oxides), CO, organic compounds, SOx, NOx, chloride and fluoride compounds
Demagging and wet-method residue processing (if used)
Dross (Al melting furnaces) Dust
Melt Losses by Furnace Type Crucible - 2 to 3% Reverb - 2 to 12%
Figure 5-1. Fuel-Fired Melting Furnaces
54

Table 5-1. Energy Use in Gas-Fired Melting Furnacesa
Energy Source
Crucible Furnace Reverberatory Furnace
MJ/metric ton of metal melted
106 Btu/net ton of metal melted
MJ/metric ton of metal melted
106 Btu/net ton of metal melted
Natural Gas 2,087 - 7,884 1.8 - 6.8 2,899 - 5,797 2.5 - 5.0
a For aluminum melting. Lower end of range represents use of advanced burners.
Sources: Wechsler and Gitman 1990. Svoboda 1998. Robinson 1998.
Aluminum melting in reverberatory furnaces generates particulate and gaseous emissions. Those from the charging well consist of carbon dioxide and organic and inorganic particulates, as well as unburned organic vapors from partial combustion of oil and coatings on the charge.
Natural gas combustion generates nitrogen oxides, carbon monoxide, aldehydes, benzene, and toluene. Emissions from furnace burners contain carbon monoxide, carbon dioxide, sulfuric oxide, and nitrogen oxide. Furnace burner emissions are usually separated from process emissions.
Table 5-2 presents estimated process emissions factors for particulate, CO, SO2, VOCs, and lead from reverberatory furnaces. Table 5-3 presents estimated emissions of criteria pollutants and CO2 generated from the combustion of natural gas in crucible and reverberatory furnaces.
Fluxing Emissions Consist of Salts and Fume
Emissions from fluxing operations are dependent upon the type of fluxing agents used and the amount required, both of which are a function of scrap quality. Emissions may include common fluxing salts such as sodium chloride and potassium chloride, but aluminum and magnesium chloride may be generated from the fluxing materials being added to the melt.
Fluxing reactions also produce fume. Studies have suggested that particulate emissions from fluxing are typically less than one micron in diameter. EPA does not have quantitative data on the amount of these compounds that is released.
Table 5-2. Process Emission Factors for Reverberatory Furnaces (kg/metric ton of molten metal)
Source Total Particulate
[lb/ton] CO
[lb/ton] SO2
[lb/ton] VOCs
[lb/ton] Lead
[lb/ton]
Uncontrolled 1.1 [2.2] Unknown N/A Unknown 0.006 - 0.07 [0.012 -0.14]
Baghouse 0.1 [0.2] - - - -
Sources: U.S. Environmental Protection Agency 1995.
55

Table 5-3. Combustion-Related Emission Factors for Gas-Fired Melting Furnacesa
(kg/metric ton of molten metal)
Source Total Particulate
[lb/ton] SOx
[lb/ton] NOx
[lb/ton] VOCs
[lb/ton] CO2
[lb/ton]
Crucible 0.0 0.0005 -0.002 [0.001-0.004]
0.125 - 0.475 [0.25-0.95]
0.005 - 0.02 [0.01-0.04]
106 - 400 [212-800]
Reverberatory 0.0 0.001 - 0.002 [0.002-0.003]
0.18 - 0.35 [0.35-0.70]
0.005 - 0.015 [0.01-0.03]
147 - 294 [294-588]
a Combustion emissions factors for natural gas used (in lb/million Btu) were as follows: Particulate - 0.0, SOx - 0.0006, NOx - 0.140, VOCs - 0.0054, CO2 - 117.60. Based on data in Table 5-1.
Sources: U.S. Environmental Protection Agency 1995. U.S. Department of Energy, Energy Information Administration 1997.
Demagging Emissions Can Be Corrosive
Both chlorine and aluminum fluoride demagging processes create highly corrosive emissions. Chlorine demagging results in the formation of magnesium chloride that contributes to fumes leaving the dross. Excess chloride combines with aluminum to form aluminum chloride, a vapor at furnace temperatures, but one that condenses into submicrometer particles as it cools. Aluminum chloride has an extremely high affinity for water and combines with water vapor to form hydrochloric acid. Free chlorine that does not form compounds may escape from the furnace and become an air pollutant.
Total chlorine emissions are directly related to the amount of demagging undertaken, which depends upon product specifications. As the proportion of magnesium decreases during demagging, emissions increase disproportionately because of the decreased efficiency of the scavenging process.
Aluminum fluoride (AlF3) demagging results in the formation of magnesium fluoride as a byproduct. Excess fluorine combines with hydrogen to form hydrogen fluoride. The principal emission resulting from aluminum fluoride demagging is a highly corrosive fume containing aluminum fluoride, magnesium fluoride, and hydrogen fluoride. The use of AlF3 rather than chlorine in demagging reduces demagging emissions. Fluorides are emitted as
gaseous fluorides (hydrogen fluoride, aluminum and magnesium fluoride vapors, and silicon tetrafluoride) or as dusts.
Hazardous Air Pollutants May Be Generated in Reverberatory Furnaces
According to the OVC/PM Speciate Data Base Management System, the following HAPs have been found in emissions from reverberatory furnaces:
• compounds of manganese • compounds of nickel • compounds of lead • compounds of chromium
Specific emission factors for these HAPs are not available from EPA. However, Table 5-4 presents a listing of average measured concentrations of air toxic compounds emitted by melting operations, assuming the use of control systems normal for the industry. In addition to these data, emissions associated with fluxing operations have an average hydrogen chloride concentration of 150 mg/m3 (Jackson et al. 1992).
Control Devices Capture Process and Fugitive Emissions
Emission controls for melting and refining operations involve venting furnace gases and
56

Table 5-4. Emissions Concentrations of Toxic Elements/Compounds for Aluminum Meltinga
Element/Compound (mg/m3) Element/Compound (mg/m3)
Arsenic 0.02 Manganese 0.01
Cadmium 0.02 Mercury 0.0002
Chromium (total) 0.002 Nickel 0.02
Chromium (hexavalent) 0.001 Selenium 0.02
Copper 0.15 Zinc 0.8
Lead 0.03 Hydrogen chloride 55.0
a Data are average values for processes having control systems normal for the industry.
Source: Jackson et al. 1992.
fumes directly to a control device. Canopy hoods or special hoods near furnace doors and tapping points capture both process and fugitive emissions.
Capture systems handle dust and fumes from charging operations, melting, backtilting for deslagging, and pouring. Particulate emissions are generally controlled by fabric filters. For example, after fugitive emissions are captured by hood systems, they are ducted to a baghouse. Emissions of acid gases (specifically from reverberatory furnaces melting dirty scrap) are controlled using injection of a scrubbing agent, usually lime, prior to the baghouse.
Cyclones are used to remove larger particulate matter from hot vent streams and/or from streams that will subsequently be sent to baghouses for particulate removal. Furnace off-gas emissions, mainly fluxing salt fume, are often controlled by a venturi scrubber. Venturi scrubbers are also used for controlling gaseous fluoride emissions from aluminum fluoride demagging.
5.5 Effluents
Little process water is required to carry out melting in a reverberatory furnace. Some may be required for fluxing, degassing, demagging, and scrubbing. Foundry effluents contain heavy metals, which are typically removed from wastewater by pH adjustment (which allows
formation of insoluble metal hydroxide) followed by a settling step. Although EPA has guidelines for melting furnace wet scrubber operations, almost all fuel-fired melting furnaces use dry collection methods (Svoboda 1998).
5.6 Byproducts
Melt Losses Depend upon Furnace Used
The surface of the scrap charged to the furnace can oxidize during melting, leading to melt losses. Melt losses for aluminum range from 2% to 12% when melting takes place in reverberatory furnaces, and 2% to 3% in gas-fired crucibles (McKenna and Wisdom1998).
Skim and Dross Diminish the Volume of the Melt
Skim is the mixture of oxides, entrained metal, and entrained gases that forms when molten aluminum is exposed to the atmosphere. Aluminum reacts with oxygen and nitrogen in the air, forming aluminum oxides and nitrides. Dross is technically skim that has been treated or processed to reduce metallic content through the use of solid fluxes, active gas fluxes, or by post-furnace treatment. The dark-colored dross produced by reverberatory melters that melt scrap in contact with a molten salt flux is known as black dross.
57

Dross production depends on factors such as furnace temperature, charge material, and contaminants in the charge. If the charge material is clean scrap, dross may be generated in amounts of around 1% of the metal melted. Those installations melting dirty, painted, or light-gauge scrap may produce dross in quantities of greater than 15% of the charge materials (Roberts 1990, McMahon 1990). For electric resistance heated reverberatory melting furnaces, the metal loss from dross due to oxidation is approximately 1% for 11,000 lbs of aluminum metal (ACMA et al. 1990).
Dross can vary from a sludgy material, high in metallic aluminum content and relatively low in temperature, to a dry, friable material that is very hot (Roberts 1990). Dross must be skimmed away from the surface after melting is complete.
On a percentage basis, black dross typically consists of approximately 45% salt (a mixture of 50% to 60% sodium chloride and 40% to 50% potassium chloride), 45% aluminum oxide and other oxides, and about 10% aluminum metal fines (Sheth et al. 1995).
Due to the high metallic content, larger metal casting operations cool the dross and recover the aluminum (most commonly in rotary salt furnaces). Smaller foundries typically ship the dross to secondary aluminum smelters to recover the metals and salt on a toll-processing basis.
5.7 Hazardous Wastes
There are no RCRA-listed hazardous wastes associated with fuel-fired melting furnaces used in foundries.
58
6
6.1 Process Overview
After the metal to be cast is melted in one of the furnaces described in Sections 3 to 5, the molten metal is tapped and transferred to ladles from which it is poured into molds and cooled.
There are at least seven different types of ladles used in foundries, several of which are self-descriptive: bottom-pour, lip-pour, teapot, hand, bull, trolley, and crane. Ladle capacities range from 100 pounds up to 35 tons or higher, although most have a capacity of 5 tons or less.
After being tapped from the furnace, the molten metal is often initially stored in larger holding ladles and then transferred to smaller pouring ladles. In many cases, heat is added to the holding ladle to ensure the metal stays at the appropriate temperature. Any additives are thoroughly mixed if refining is to occur at this stage.
Refining, Pouring, and
Cooling
Refining Is Used to Adjust Metal Composition, Improve Quality
The refining process responds to the need for cleaner metal and improved control over melt composition in order to produce more homogeneous and higher quality castings. Refining is used to add alloys (e.g., carbon, silicon) and other chemicals to the molten metal to produce the desired melt composition. Refining processes also remove unwanted inclusions and impurities, such as sulfur, from the melt.
While refining often takes place in ladles, it can also occur in furnaces. Additives may be introduced into molten iron, for example, by direct feeding into a ladle, by impingement into the iron stream during pouring, or by the controlled feeding of additives into a process, such as cupola tuyere injection.
During the production of ductile iron castings, magnesium and other elements are added to the molten iron by using special enclosed reaction
59

vessels. One of the best established processes uses a converter in which ingots of magnesium are introduced into the bottom of the liquid metal in a tiltable vessel under atmospheric conditions (Fischer converter).
A covered ladle contains the ejection of metal, fume, and flame when molten iron reacts with metallic magnesium. This technique also improves magnesium recovery.
In the production of ductile iron, it is often necessary to add a desulfurizing agent such as solid calcium carbide to the melt to produce the desired casting microstructure.
Steel can be refined using the AOD (argonoxygen-decarburization) process. The plasma ladle refining process is particularly useful for processing smaller quantities of steel.
Molten Metal Is Poured into the Mold
Pouring is the process of filling the mold cavity with molten metal. The pouring cup, also called the sprue cup or pouring basin, is attached to the gating system, and the metal is carefully poured into the mold cavity.
The pouring technique that is used is especially critical with sand molds. The fluid dynamics of the liquid metal during pouring is a high-priority concern. Whether manual or automated, the pouring technique should focus on fill rate and turbulence. The correct fill rate involves filling the basin and holding it full until mold filling is complete. To minimize turbulence, it is essential that a consistently shaped, controlled pour stream is suitably targeted into the basin.
Table 6-1 depicts the approximate pouring temperature of several alloys.
After the metal is poured, the casting is cooled by one of a variety of methods while the molds are conveyed automatically through cooling tunnels or are placed on the floor. As it cools,
Table 6-1. Metal Alloys and Their Approximate Pouring Temperature
Alloy Temperature
(oF)
Lead 650
Zinc Alloys 650 - 850
Aluminum Alloys 1,150 -1,350
Magnesium Alloys 1,150 - 1,350
Copper-based Alloys 1,650 - 2,150
Cast Irons; Gray, Ductile, Malleable
2,450 - 2,700
High Manganese Steel 2,550 - 2,650
High Alloy Steels 2,700 - 2,900
High Alloy Irons 2,800 - 3,000
Carbon & Low Alloy Steels
2,850 - 3,100
Source: Kanicki 1994.
the metal solidifies, which in itself is a very complicated function of many variables, including heat transfer, metal composition, and cast shape.
6.2 Summary of Inputs/Outputs
Inputs: Molten metal Alloying elements Fuel Electricity
Outputs: Solid casting Emissions of HAPs (aldehyde, metal, semi-volatile and volatile), particulates Slag Dross
Figure 6-1 provides key energy and environmental facts of refining and pouring operations.
60

Key Energy and Environmental Facts - Refining, Pouring, and Cooling
Energy Emissions Effluents Byproducts
0.6 106 Btu/ton of good castings shipped
Particulate metallic oxide fumes
Organic compounds and hazardous air pollutants (including benzene and formaldehyde)
Minimal Slag Dross Spent ladles and refractory materials Metal losses ~5%
Figure 6-1. Key Facts of Refining and Pouring
6.3 Energy Requirements
Energy requirements for refining and pouring can be quite substantial. Preheating of the holding ladle can account for a significant percentage of a foundry’s total energy use depending on the metal cast and length of time during refining.
Heat losses from the small ladles used by the foundry industry are proportionally greater than the losses from the large ladles used in the steel industry. This heat loss restricts the time available for refining in the ladle before the molten metal must be heated once again. Table 62 shows the energy used in ladle refining and pouring processes.
6.4 Emissions
Toxic Emissions May Be Released During Refining
Toxic emissions of particulate, arsenic, chromium, halogenated hydrocarbons, and aromatic hydrocarbons can be released during the refining process (EPA 1992). Ferrous castings can generate particulate emissions of iron oxides during tapping, as well as oxide fumes from alloys added to the ladle. In processing ductile iron, particulates are emitted during the refining of molten iron before pouring. When magnesium is added to molten metal, a violent reaction ensues, with emissions of magnesium oxides and metallic fumes. Particulate emissions from pouring operations have been estimated at 0.6 lbs/ton of metal (NCMS 1999).
Table 6-2. Energy Use in Refining and Pouring
Energy Source
MJ/net metric ton of metal
melted 106 Btu/net ton of metal melted
MJ/net metric ton of good
castings shipped
106 Btu/net ton of good castings shipped
Electricity 232 0.2 464 0.4
Natural Gas 116 0.1 232 0.2
TOTAL 348 0.3 696 0.6
Source: Process Metallurgy International 1998.
61

Treating the slag generated during calcium carbide desulfurization by reacting it with water may generate an off-gas that contains arsine, phosphine, and other toxic materials (EPA 1997).
Pouring-Related Emissions Depend on Metal, Binder
Pouring produces gases, some of which may be hazardous to human health. Typical pouring-related emissions include metal fumes from the melt, and carbon monoxide, organic compounds, and particulates evolved from the mold and core materials. Organic compounds are emitted when the molten metal comes in contact with the organic constituents added to the mold sands and core binders. Such emissions continue during cooling. These emissions are normally discharged through proper ventilation systems after being captured by a collection system and vented, either controlled or uncontrolled, to the atmosphere (EPA 1992).
Pouring-related emissions will be different for each type of metal and binder system used. However, they are less dependent on the binder
used than are core and moldmaking emissions because all organic binders generate similar products of decomposition. Despite differences in specific materials and levels, the same general classes of chemical compounds are formed during organic binder decomposition (Laitar and Geoffrey 1997).
A recently published study published NCMS and performed by the University of Alabama at Birmingham has compiled data on emissions of HAPs from pouring and cooling operations in ferrous foundries (emissions from shakeout are discussed in Section 11.4). Estimates of emission factors for aldehyde HAPs and metal HAPs are shown in Tables 6-3 and 6-4, respectively. Estimated emission factors for volatile and semi-volatile HAPs (including naphthalene, phenol, polycyclic organic matter, benzene, xylene, styrene, and toluene) are shown in Table 6-5. Most of the data in Tables 6-3 to 6-5 reflect green sand foundries using a variety
of core types, including no cores; hot, warm, and cold box cores; and shell cores (NCMS 1999).
The NCMS study analyzed the data and reached a number of conclusions:
• emission factors for organic compounds appear to be higher for cooling and shakeout than for pouring
• benzene and toluene appear to have higher emission factors during cooling than during shakeout
• formaldehyde emission factors for pouring, cooling, and shakeout are about the same
• emission factors of formaldehyde from molds with cores appear higher than emissions from molds with no cores
• when cores are used in molds, phenol emissions are much greater in cooling than in shakeout
• phenol emissions are likely to be substantially increased by the use of phenolic cores in green sand molds; in fact, core type is the major factor in determining the phenol emission rate from green sand molds
• emissions of formaldehyde and benzene from pouring, cooling, and shakeout in steel production are lower than emissions from iron production
• metal HAP emissions from pouring and cooling appear to be insignificant when compared to melting and shakeout
The results of the NCMS study compared well in many instances with the results of other foundry emission studies. For example, the average benzene emissions factors for pouring and cooling in a study by Kauffmann and Voigt were 0.069 lbs/ton of metal with cores present in the mold and 0.036 lbs/ton without cores, yielding an overall average of 0.061 lbs/ton (NCMS 1999). The NCMS study yielded a value of 0.048 lbs/ton of metal for a variety of core types and primarily for green sand molds.
62

Table 6-3. Average Emission Factors for Aldehyde HAPs During Pouring and Coolinga
(kg/metric ton of metal)
HAP Pouring EF
[lb/ton] Cooling EF
[lb/ton]
Acetaldehyde 1.25 10-4 [2.5 10-4] 7.0 10-4 [1.4 10-3]
Acrolein 1.2 10-3 [2.4 10-3] 3.9 10-3 [7.8 10-3]
Formaldehyde 6.5 10-4 [1.3 10-3] 1.3 10-3 [2.6 10-3]
a Data mainly for gray iron foundries; some malleable iron foundries represented in the pouring data, and some ductile iron foundries represented in the cooling data.
Source: National Center for Manufacturing Sciences 1999.
Table 6-4. Average Emission Factors for Metal HAPs During Pouring and Coolinga
(kg/metric ton of metal)
HAP Pouring EF
[lb/ton] Cooling EF
[lb/ton]
Antimony 7.5 10-7 [1.5 10-6] -
Arsenic 7.0 10-7 [1.4 10-6] -
Beryllium 2.0 10-8 [4.0 10-8] 0.0
Cadmium 2.7 10-6 [5.4 10-6] 1.25 10-5 [2.5 10-5]
Chromium 5.5 10-5 [1.1 10-4] 1.15 10-4 [2.3 10-4]
Cobalt 3.5 10-7 [7.0 10-7] -
Lead 7.5 10-5 [1.5 10-4] 1.1 10-4 [2.2 10-4]
Manganese 3.7 10-4 [7.4 10-4] 2.05 10-4 [4.1 10-4]
Mercury 5.5 10-6 [1.1 10-5] 0.0
Nickel 2.55 10-5 [5.1 10-5] -
Selenium 5.0 10-8 [1.0 10-7] 2.05 10-6 [4.1 10-6]
Metal HAPs 0.0145 [0.029] -
a Data mainly for gray iron foundries; some ductile iron foundries represented in the pouring data.
Source: National Center for Manufacturing Sciences 1999.
63

Table 6-5. Average Emission Factors for Volatile and Semi-Volatile HAPs During Pouring and Coolinga
(kg/metric ton of metal)
HAP Pouring EF
[lb/ton] Cooling EF
[lb/ton]
1,2 -Dimethylnaphthalene ND 1.05 10-4 [2.1 10-4]
1,3-Dimethylnaphthalene 3.9 10-5 [5.8 10-5] 4.35 10-4 [8.7 10-4]
1,4-Dimethylnaphthalene ND 2.0 10-5 [4.0 10-5]
1,5-Dimethylnaphthalene ND 8.0 10-6 [1.6 10-5]
1,6-Dimethylnaphthalene 1.3 10-5 [2.6 10-5] 2.3 10-4 [4.6 10-4]
1,8-Dimethylnaphthalene ND 4.15 10-5 [8.3 10-5]
1-Methylnaphthalene 2.45 10-4 [4.9 10-4] 1.6 10-3 [3.2 10-3]
2,3-Dimethylnaphthalene ND 4.3 10-5 [8.6 10-5]
2,6-Dimethylnaphthalene 8.0 10-5 [1.6 10-4] 3.2 10-4 [6.2 10-4]
2-Methylnaphthalene 3.8 10-4 [7.6 10-4] 2.85 10-3 [5.7 10-3]
Acenaphthalene ND 3.35 10-5 [6.7 10-5]
Anthracene ND 8.0 10-6 [1.6 10-5]
Biphenyl 3.8 10-6 [7.6 10-6] 1.45 10-4 [2.9 10-4]
Cumene 1.85 10-6 [3.7 10-6] 7.0 10-5 [1.4 10-4]
m,p-Cresol 4.45 10-5 [8.9 10-5] 1.15 10-3 [2.3 10-3]
Naphthalene 2.5 10-4 [5.0 10-4] 2.7 10-3 [5.4 10-3]
Nitrobenzene ND 2.45 10-6 [4.9 10-6]
o-Cresol 1.0 10-4 [2.0 10-4] 4.15 10-3 [8.3 10-3]
Phenol 3.25 10-3 [6.5 10-3] 8.0 10-3 [0.016]
Polycyclic organic matter (POM) 6.5 10-4 [1.3 10-3] 7.5 10-3 [0.015]
1,3-Butadiene 2.75 10-5 [5.5 10-5] 3.05 10-4 [6.1 10-4]
Benzene 3.9 10-3 [7.8 10-3] 0.02 [0.04]
Ethylbenzene 5.5 10-5 [1.1 10-4] 5.5 10-4 [1.1 10-3]
Hexane 1.55 10-4 [3.1 10-4] 1.3 10-4 [2.6 10-4]
m,p-Xylene 2.75 10-4 [5.5 10-4] 2.8 10-3 [5.6 10-3]
o-Xylene 7.5 10-5 [1.5 10-4] 1.1 10-3 [2.2 10-3]
Styrene 5.0 10-5 [1.0 10-4] 2.05 10-4 [4.1 10-4]
Toluene 9.5 10-4 [1.9 10-3] 9.5 10-3 [0.019]
ND Not determined.a Data for gray iron foundries.Source: National Center for Manufacturing Sciences 1999.
64

6.5 Effluents
Few Effluents Are Produced
The effluents from pouring and refining operations are generally minimal in amount. Only particulate dust is produced, and the pouring and refining areas of the foundry are not normally cleaned with water. Tables 6-6 to 6-9 provide the limits set on effluents from mold-cooling operations in ferrous, aluminum, copper, and zinc casting.
6.6 Byproducts
Slag Layer Covers Top of Molten Ferrous Metals
Slag and dross (discussed in Sections 3 through 5) are normally found at the top of furnaces and ladles. Except in bottom-pour and teapot ladles, the slag is skimmed off prior to pouring. In
addition, skim gates and skim cores are also commonly used to prevent any remaining slag, dross, or other extraneous materials from entering the casting during pouring.
The use of calcium carbide (CaC2) as a desulfurization agent for ductile iron production makes a slag that is generally removed from the molten iron in the ladle and placed into a hopper. Since an excess of CaC2 is used to ensure adequate sulfur removal, the resulting slag contains both CaS and CaC2 and must be handled as a reactive waste. The slag can be treated by converting the carbide to acetylene and calcium hydroxide by reacting with water.
Other byproducts from pouring include spent ladles and refractory materials, which may be considered hazardous if they contain metals. In addition, metal losses (on the order of 5%) occur during refining and pouring as a result of spills and pigged metal.
Table 6-6. Effluent Limitations for Mold Cooling Operations (Ferrous Casting) - Average of Daily Values
for 30 Consecutive Days (kg/106 kg or lbs per 106 lbs of metal poured)
Pollutant BPTa BATb NSPSc
Copper 0.0236 0.0236 0.0236
Lead 0.0576 0.0384e/0.0576f 0.0384e/0.0576f
Zinc 0.0627 0.0546e/0.0827f 0.0546e/0.0627f
Oil & Grease 1.48 -- 1.48
TSSd 2.22 -- 1.77e/2.22f
pH g -- g
a Best Practicable Control Technology Currently Available. b Best Available Technology Economically Achievable. c New Source Performance Standards. d Total Suspended Solids. e Applicable to plants casting primarily ductile or gray iron or primarily malleable iron
where more than 3,557 tons of metal are poured per year. f Applicable to plants casting primarily steel and to plants that are casting primarily malleable
iron where 3,557 tons of metal or less are poured per year. g Within the range of 7.0 to 10.0 at all times.
Source: Bureau of National Affairs 1996.
65

Table 6-7. Effluent Limitations for Mold Cooling Operations (Aluminum Casting) - Average of Daily Values
for 30 Consecutive Days (kg/106 kg or lbs per 106 lbs of metal poured)
Pollutant BPTa BATb NSPSc
Copper 0.162 0.162 0.162
Lead 0.151 0.151 1.151
Zinc 0.166 0.166 0.166
Oil & Grease 3.85 -- 3.86
TSSd 5.79 -- 5.79
pH e -- e
a-d Same as Table 6-6.e Within the range of 7.0 to 10.0 at all times.
Source: Bureau of National Affairs 1996.
Table 6-8. Effluent Limitations for Mold Cooling Operations (Copper Casting) - Average of Daily Values
for 30 Consecutive Days (kg/106 kg or lbs per 106 lbs of metal poured)
Pollutant BPTa BATb NSPSc
Copper 0.214 0.214 0.214
Lead 0.199 0.132 0.132
Zinc 0.219 0.148 0.148
Oil & Grease 5.09 -- 5.09
TSSd 7.63 -- 6.11
pH e -- e
a-e Same as Table 6-7.
Source: Bureau of National Affairs 1996.
66

Table 6-9. Effluent Limitations for Mold Cooling Operations (Zinc Casting) - Average of Daily Values
for 30 Consecutive Days (kg/62.3 106 SM3 or lbs per 109 SCF of air scrubbed)
Pollutant BPTa BATb NSPSc
Copper 0.166 0.166 0.166
Lead 0.154 0.103 0.103
Zinc 0.17 0.114 0.114
Oil & Grease 3.94 -- 3.94
TSSd 5.91 -- 4.73
pH e -- e
a-e Same as Table 6-7.
Source: Bureau of National Affairs 1996.
6.7 Hazardous Wastes
Slag from producing stainless steel castings can be hazardous if it has a high chromium content. This slag is often fed to cupola furnaces, where the cupola slag scavenges trace metals and renders it nonhazardous (EPA 1997). Slag from
ductile iron production may also be considered hazardous if its concentration of heavy metals is sufficiently high.
Waste chromium refractories may be considered hazardous in some localities.
67

68

7
7.1 Process Overview
Cleaning and finishing operations are the last step in the casting process, although more optimal design and selection of gating, molding, equipment, and materials could help reduce the need for this effort. Up to 20% of the labor cost in foundries is incurred at this stage, and it is difficult to attract laborers to this type of work (AFS 1997).
Cleaning and finishing generally refer to the removal of sand, scale, and excess metal, such as gates, fins, wires, and risers, from the casting. Grinding may be used to remove sprue or risering irregularities. In many cases, castings are upgraded by welding, coating, heat treating, or other procedures to improve their properties. Afterwards, the casting is inspected for defects and general quality, sometimes utilizing nondestructive testing.
Cleaning and Finishing
Castings Are Cleaned After Cooling
After the casting has solidified and sufficiently cooled, it is separated from the mold and cleaned. In sand casting, this procedure is known as shakeout. The sand from the mold may be collected for reclamation (see Subsection 7.6); otherwise, the sand is beneficially reused or landfilled.
After the casting is removed from the mold, it is cleaned of any remaining sand and scale by a variety of means. Traditional techniques include vibrating, wire-brushing, or blast cleaning the mold; newer alternatives include subjecting it to rotary drum separators or fluidized-bed processing equipment. Manipulators and robots may be used to handle the castings, particularly larger ones.
Blast cleaning is the quickest and most uniform method. Air, water, or mechanical mediums may be used for blast cleaning.
69
In air blasting, sand, shot, grit, or glass beads are propelled at the casting. The use of water blasting helps to reduce the formation of dust. In mechanical blasting, shot or grit is propelled by a rotating wheel or other means. The use of shot produces a shiny surface, whereas grit dulls the surface (Sylvia 1995). Shot and grit are used primarily for ferrous castings, while sand and glass beads are used for nonferrous castings.
For aluminum, brass, or bronze alloy castings, wire brushing through mechanical means is often sufficient for cleaning, and it produces a shiny surface.
Vibration can be used to separate the sand from the casting either by brute force vibration or natural frequency resonance. Rotary separators separate sand from castings by a slow continuous tumbling action, usually breaking off the gate and runners, as well as crushing sand lumps. Robots and manipulators are used to help move hot and/or heavy castings to cleaning devices.
Finishing Includes Thermal and Mechanical Processes
The cutting or trimming of gates, risers, fins, or flashing may take place either before or after the cleaning operation. When physically practical, the cutting operation should be performed after the casting has been cleaned so the scrap metal is clean when it is subsequently remelted.
The removal of gates, risers, and other protuberances that are not part of the casting is accomplished by mechanical cutoff machines such as band saws, abrasive cutoff wheels, and metal shears. Shears are best for the more ductile materials. Large risers and gates on steel castings are readily removed with an oxy-acetylene cutting torch and oxygen lance. Plasma torches are also used for smaller gates and risers.
Powder cutting is another process for cutting large risers cast from oxidation-resistant alloys. Preheated iron powder is introduced into an oxygen stream; this burning iron then attacks the metal riser by a process of fluxing and oxidation. This allows the rapid removal of gates from
castings made of alloys that are highly resistant to oxidation.
The trimming of fins, flashing, and similar appendages is often accomplished by chipping with hand tools or with pneumatic chipping hammers. Portable grinding tools, stationary-stand grinders, and swing-frame grinders are used for rough removal of excess metal. Grinding tools may be driven by electricity or compressed air.
Castings are sometimes heat-treated in the foundry using controlled heating and cooling to achieve desired metallurgical properties. In many cases, castings may undergo additional chemical cleaning and finishing operations, including heat treating, painting, and coating, to improve their final properties. These operations are often performed by outside firms.
Waste Sand Is Often Processed for Reuse
In some foundries, sand is reclaimed or reconditioned for reuse. Sand reclamation is the physical, chemical, or thermal treatment of foundry sands so they may be safely substituted for new sand in molding and coremaking mixes. True reclamation treats and cleans all the individual grains within the sand mass.
Reconditioning, as practiced when regenerating green-system sands, treats and partially cleans the mass as a whole. Some forms of reclamation such as dry mechanical attrition are closer to reconditioning than true reclamation, since little cleaning is performed on individual sand grains.
Sand reclamation is discussed in detail in Subsection 7.6.
7.2 Summary of Inputs/Outputs
Inputs: Casting (with sand) Water, sand, shot, grit, or glass beads Electricity Fuel
Outputs: Waste sand Wastewater
70

Particulate emissions Emissions Scrap metal
Key energy and environmental facts for cleaning and finishing are shown in Figure 7-1.
7.3 Energy Requirements
A Variety of Processes Associated with Casting Require Thermal or Electrical Energy
Cleaning and finishing account for an estimated 7% of foundry energy use, or approximately 1 million Btu per ton of good castings shipped (Process Metallurgy International 1998). Energy is required for blowing or other mechanical cleaning methods. Heating may be required for heat treating or other finishing procedures. Energy is also required by the sand reclamation systems, in particular for heating sand in the thermal process.
Numerous motors are used for sand transport, sand reclamation, and dust collection equipment. Most chipping and grinding tools operate on compressed air. A typical compressed air load for an average cleaning and finishing area is 100 horsepower. Electric grinders (both wheel and belt) are becoming popular because of their higher energy efficiency.
Thermal sand reclamation units can be either electric (for infrared heating) or gas-fired. Electric units can be programmed to integrate into the plant power demand side management system to give optimal load factor and limit peak power use.
Typical energy consumption during reclamation is 150 kWh/ton using electric thermal equipment.
7.4 Emissions
Shakeout, Finishing, and Dry Sand Reclamation Can Produce Particulate
Significant quantities of dust and metallic particulate emissions are generated during the casting shakeout and cleaning operations. The particulates from the shakeout operation can be controlled with hoods and ducts at key dust-generating points and then passed through baghouses, electrostatic precipitators, or wet scrubbers.
During finishing operations, metallic particulates are emitted during the removal of burrs, risers, and gates, and during shot blast cleaning. These emissions are controlled by cyclone separators and fabric filters. Type of particulates are determined by the metal used, the blast media, and the grinding-wheel material.
Key Energy and Environmental Facts - Cleaning and Finishing
Energy Emissions Effluents Byproducts
1 x 10⁶ Btu/ton of good casting shipped
Dust, metallic particulates HAPs, VOCs, and organic compounds
Wastewater from finishing operations (e.g., quenching and deburring)
Wet scrubber wastewater
Spent foundry sand Dust Metal
Typical Metal Losses - 0.5% to 1.0% as particulates; 10% to 20% from removal of gates, risers, fins, etc.
Figure 7-1. Key Facts on Cleaning and Finishing Operations
71

The potential exists for generating hazardous air pollutants during shakeout. Although specific species depend on the binder used, the most common include all the following:
• benzene • cresole/cresylic acid • formaldehyde • methylene diphenyl diisocyanate • naphthalene • phenol • toluene • polycyclic organic matter • cyanide compounds
A survey of eight iron and steel foundries located in Wisconsin yielded estimated emission rates of benzene and formaldehyde from shakeout, shown in Table 7-1. These data were included in the NCMS study discussed in Section 6.4. Tables 72 through 7-4 present the findings of this study for average emission factors of aldehyde/ketone, metal, and volatile/semi-volatile HAPs, respectively, for shakeout.
Dry sand reclamation creates fines and dust. Thermal sand reclamation creates air exhaust contaminated by combustion byproducts, as well as fines, VOCs, and organic compounds.
7.5 Effluents
Most Cleaning Systems Are Closed, Minimizing Discharges
Some cleaning and finishing processes use water. Water is also used in quenching, although this is usually a closed system with little discharge.
Other operations that may require water include painting, heat treating, and machining.
Wastewater may contain phenols, oil and grease, and solids. Effluent limitations for cleaning operations are depicted in Tables 7-5 to 7-7 for ferrous, aluminum, and copper foundries, respectively.
Effluent limitations for dust collection systems for particulates from sand casting were provided in Section 2 (Tables 2-5 to 2-7). Other effluents can include scrubber water for chemical binder systems and metal-bearing sludges when quench tanks are cleaned.
Wet sand reclamation creates an aqueous waste stream with high pH, which has specific effluent limitations when discharged from ferrous foundries, as recorded in Table 7-8.
Wet reclamation systems, which rely on the principle of scrubbing in water, have high water requirements (on the order of 2,000 gallons per ton of sand processed). The water must be treated and clarified before it is recirculated or discharged.
Table 7-1. Average Emissions Factors for Benzene and Formaldehyde from Shakeout in Iron/Steel Foundriesa
(lbs/ton of metal throughput)
Mold Binder Process Benzene
Benzene Std Dev. Formaldehyde
Formaldehyde Std. Dev.
Green Sandb 0.0083 0.0027 0.0039 0.0024
No-bakec 0.0053 0.0027 0.008 0.003
a Data from eight facilities casting carbon steel and malleable, ductile, and gray iron, using a variety of automatic and manual pouring equipment.
b Clay-bonded seacoal green sand. c Organic resin no-bake. Source: Lindem 1996.
72

Table 7-2. Average Emission Factors for Aldehyde and Ketone HAPs During Shakeouta
(kg/metric ton of metal)
HAP Emission Factor
[lb/ton]
Acetaldehyde 8.0 10-4 [1.6 10-3]
Acrolein 1.05 10-3 [2.1 10-3]
Methyl ethyl ketone 1.6 10-3 [3.2 10-3]
Formaldehyde 1.4 10-3 [2.8 10-3]
a Data mainly for gray iron foundries; some ductile iron and steel foundries represented in the formaldehyde figure.
Source: National Center for Manufacturing Sciences 1999.
Table 7-3. Average Emission Factors for Metal HAPs During Shakeouta
(kg/metric ton of metal)
HAP Emission Factor
[lb/ton]
Antimony < 3.0 10-3 [<6.0 10-3]
Arsenic < 3.0 10-4 [<6.0 10-4]
Beryllium 1.55 10-4 [3.1 10-4]
Cadmium <1.0 10-3 [<2.1 10-3]
Chromium <2.6 10-4 [<5.2 10-4]
Cobalt 3.6 10-5 [7.2 10-5]
Lead < 5.0 10-4 [<1.0 10-3]
Manganese < 1.7 10-3 [<3.4 10-3]
Mercury <2.15 10-4 [<4.3 10-4]
Nickel < 3.0 10-4 [<6.0 10-4]
Selenium <8.5 10-5 [<1.7 10-4]
Trivalent Chromium 6.0 10-4 [1.1 10-3]
a Data mainly for gray iron foundries and some ductile iron foundries. Source: National Center for Manufacturing Sciences 1999.
73

Table 7-4. Average Emission Factors for Volatile and Semi-Volatile HAPs During Shakeouta
(kg/metric ton of metal)
HAP Emission Factor
[lb/ton]
1,2 -Dimethylnaphthalene 7.5 10-4 [1.5 10-3]
1,3-Dimethylnaphthalene 1.5 10-3 [3.0 10-3]
1,4-Dimethylnaphthalene 1.55 10-3 [3.1 10-3]
1,5-Dimethylnaphthalene 1.8 10-4 [3.6 10-4]
1,6-Dimethylnaphthalene 2.3 10-4 [4.6 10-4]
1,8-Dimethylnaphthalene 5.5 10-4 [1.1 10-3]
1-Methylnaphthalene 6.5 10-3 [0.013]
2,3-Dimethylnaphthalene 0.0
2,6-Dimethylnaphthalene 7.0 10-4 [1.4 10-3]
2-Methylnaphthalene 0.01 [0.02]
Acenaphthalene 1.7 10-4 [3.4 10-4]
Anthracene 0.0
Biphenyl 6.5 10-4 [1.3 10-3]
Cumene 3.85 10-5 [7.7 10-5]
m,p-Cresol 1.15 10-3 [2.3 10-3]
Naphthalene 3.0 10-3 [6.0 10-3]
Nitrobenzene 0.0
o-Cresol 2.6 10-3 [5.2 10-3]
Phenol 8.0 10-3 [0.016]
Polycyclic organic matter (POM) 0.021 [0.042]
Benzene 9.0 10-3 [0.018]
Ethylbenzene 2.05 10-4 [4.1 10-4]
Hexane 1.35 10-3 [2.7 10-3]
m,p-Xylene 1.3 10-3 [2.6 10-3]
o-Xylene 1.3 10-3 [2.5 10-3]
Styrene 2.0 10-4 [4.0 10-4]
Toluene 4.55 10-3 [9.1 10-3]
ND Not determined a Data mainly for gray iron foundries and a very small number of ductile iron and
steel foundries. Source: National Center for Manufacturing Sciences 1999.
74

Table 7-5. Effluent Limitations for Cleaning Operations (Ferrous Casting) - Average of Daily Values for 30 Consecutive Days
(kg/106 kg or lbs per 106 lbs of metal poured)
Pollutant BPTa BATb NSPSc
Copper 0.0071 0.0071 0.0071
Lead 0.0174 0.0116d/0.0174e 0.0116d/0.0174e
Zinc 0.025 0.0165d/0.025e 0.0105d/0.025e
Oil & Grease 0.446 -- 0.446d/0.44e
TSSf 0.67 -- 0.536d/0.67e
pH g -- g
a Best Practicable Control Technology Currently Available. b Best Available Technology Economically Achievable. c New Source Performance Standards. d Applicable to plants casting primarily ductile or gray iron and to plants casting primarily
malleable iron (>3,557 tons of metal/year). e Applicable to plants casting primarily steel and to plants casting primarily malleable iron
(<3,557 tons of metal/year). f Total Suspended Solids. g Within the range of 7.0 to 10.0 at all times. Source: Bureau of National Affairs 1996.
Table 7-6. Effluent Limitations for Cleaning Operations (Aluminum Casting) - Average of Daily Values
for 30 Consecutive Days (kg/106 kg or lbs per 106 lbs of metal poured)
Pollutant BPTa BATb NSPSc
Copper 0.0421 0.0421 0.0421
Lead 0.039 0.039 0.039
Zinc 0.0431 0.0431 0.0431
Oil & Grease 1.0 -- 1.0
TSSd 1.5 -- 1.5
pH e -- e
a-c Same as Table 7-5.d Total Suspended Solids.e Within the range of 7.0 to 10.0 at all times.Source: Bureau of National Affairs 1996.
75
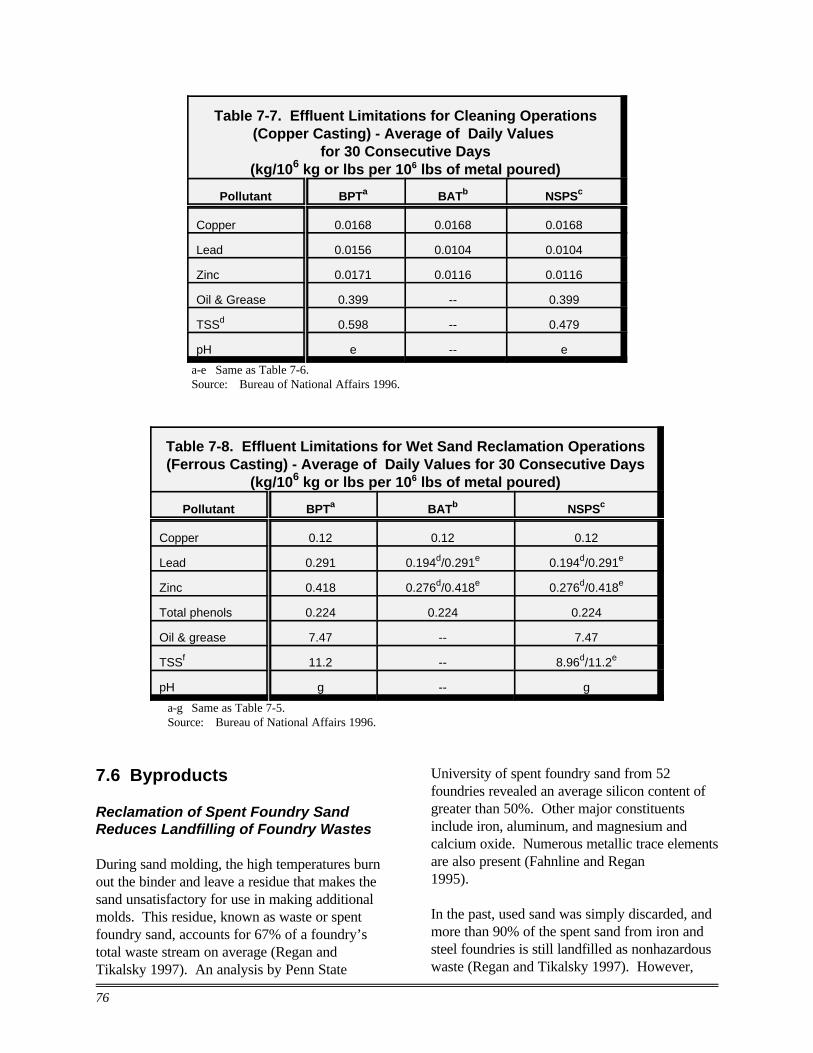
Table 7-7. Effluent Limitations for Cleaning Operations (Copper Casting) - Average of Daily Values
for 30 Consecutive Days (kg/106 kg or lbs per 106 lbs of metal poured)
Pollutant BPTa BATb NSPSc
Copper 0.0168 0.0168 0.0168
Lead 0.0156 0.0104 0.0104
Zinc 0.0171 0.0116 0.0116
Oil & Grease 0.399 -- 0.399
TSSd 0.598 -- 0.479
pH e -- e
a-e Same as Table 7-6.Source: Bureau of National Affairs 1996.
Table 7-8. Effluent Limitations for Wet Sand Reclamation Operations (Ferrous Casting) - Average of Daily Values for 30 Consecutive Days
(kg/106 kg or lbs per 106 lbs of metal poured)
Pollutant BPTa BATb NSPSc
Copper 0.12 0.12 0.12
Lead 0.291 0.194d/0.291e 0.194d/0.291e
Zinc 0.418 0.276d/0.418e 0.276d/0.418e
Total phenols 0.224 0.224 0.224
Oil & grease 7.47 -- 7.47
TSSf 11.2 -- 8.96d/11.2e
pH g -- g
a-g Same as Table 7-5.Source: Bureau of National Affairs 1996.
7.6 Byproducts
Reclamation of Spent Foundry Sand Reduces Landfilling of Foundry Wastes
During sand molding, the high temperatures burn out the binder and leave a residue that makes the sand unsatisfactory for use in making additional molds. This residue, known as waste or spent foundry sand, accounts for 67% of a foundry’s total waste stream on average (Regan and Tikalsky 1997). An analysis by Penn State
University of spent foundry sand from 52 foundries revealed an average silicon content of greater than 50%. Other major constituents include iron, aluminum, and magnesium and calcium oxide. Numerous metallic trace elements are also present (Fahnline and Regan 1995).
In the past, used sand was simply discarded, and more than 90% of the spent sand from iron and steel foundries is still landfilled as nonhazardous waste (Regan and Tikalsky 1997). However,
76
economic and environmental concerns make it desirable to process the sand in a manner that makes it suitable for reuse in the foundry. These considerations include the increasing cost of new sand, the need to conserve available sources of high-quality sand, the increasing cost of used sand disposal, stricter environmental controls that make disposal of foundry waste more difficult and expensive, and high consumption of new sand with the use of chemically bonded sands.
The processing of waste sand for reuse is known as reclamation. Three methods of sand reclamation are commonly used:
• thermal • dry • wet
Thermal Reclamation Is the Most Commonly Used Process
Thermal reclamation burns away and removes all organic binders and other organic and carbonaceous materials in the sand. This process also is used to calcine any clay present to make subsequent removal more efficient.
Compared with mechanical attrition, it is a more expensive process because, in addition to the usual pre-crushing and metal-removal treatment, the sand is heated to approximately 930oF to 1,475oF (500oC to 800oC) and then cooled for reuse. Various types of equipment are used for thermal reclamation such as rotary kilns, fluidized beds, and shaft furnaces. Fluidized-bed systems are now very popular because they have no moving parts, are efficient, and can achieve some cooling.
Two types of electric thermal sand reclamation systems presently are in operation. The first utilizes a high-intensity, high-temperature electric infrared heating system combined with fluidized-bed technology. These units can operate at temperatures of up to 1,500oF and are therefore suitable for the processing of both clay-bonded and organically bonded sands. The second type of electric thermal unit utilizes indirect radiant
heating and is more suitable for organically bonded systems.
The preferred system in the U.S. foundry industry is the combination of calcining in a thermal unit followed by processing through a simple pneumatic scrubber.
Dry Reclamation Uses Abrasion Techniques
Dry reclamation processes first crush lumps to grain size. Mechanical abrasion is used to separate the binder from the sand grains. Released fines are separated and removed by dry classification.
With dry pneumatic systems, relatively dry sand (of less than 1% moisture) is prepared by crushing the lumps of grains and removing metal particles. The used sand is then propelled by air against a metal target plate. The impact of the sand on the plate scrubs off the clay coating from the sand grains, and the resulting fines are removed to a dust collector. A typical reclamation plant consists of several scrubbing cells arranged sequentially, and the degree of cleaning is regulated by the feed rate through the reclaimer.
Wet Reclamation Is Being Phased Out by Industry
Wet reclamation relies on the principle of scrubbing in water. A large demand for water and the need to treat and clarify the water before recirculation and disposal are major operating problems with wet reclamation systems. In addition, capital cost of the equipment is high and it requires a large amount of floor space. For these reasons, wet systems are no longer being produced, although a few old units are still operating.
77

Waste Sand May Also Be “Beneficially Reused”
In some locales, waste sand is used as a raw material for manufacturing cement and asphalt (bituminous concrete) for the construction industry and for landfill cover. This practice is often called “beneficial reuse” and occurs when certain conditions have been met. In addition to having specific physical and chemical characteristics, the sand must comply with applicable regulations relating to its handling, storage, and disposal.
Although many foundries currently recycle waste sand for construction, much more could be used in applications such as
• feedstock for cement production, • fine aggregate for concrete, • fine construction aggregate for fill, and • bituminous concrete fine aggregate (EPA
1997).
Other Byproducts Include Waste Metal
Waste metal byproducts from casting operations may be recovered for reuse. The amount of waste metal reclaimed from the risers and gating system plays a significant factor in the overall yield, as defined by the total amount of metal melted and poured compared to final casting weight. Typical yields from green sand foundries are approximately 60%. Metal losses from cleaning and finishing operations can be on the order of 10% to 20%. Using computer simulations to optimize riser size can maximize yield, thereby reducing waste and maximizing profit.
7.7 Hazardous Wastes
Approximately 2% of all spent foundry sand is hazardous (EPA 1997). For example, casting sands used in the production of brass or bronze castings may exhibit toxicity characteristic for lead or cadmium. The hazardous sand may be reclaimed in a thermal treatment unit, which may be subject to RCRA requirements for hazardous waste incinerators.
Foundry shot blast dust may also be considered a hazardous waste if its metal content is sufficiently high.
78

8 Investment Casting
8.1 Process Overview
In investment casting, heat-disposable wax or plastic patterns are made for each type of unique casting that will be produced. Replicas of patterns are usually mass-produced by injecting a die with wax or plastic that is in a liquid or semiliquid state. Usually, there are multiple patterns that are then assembled onto a single gating system.
The pattern assembly is covered sequentially with layers of a specially formulated refractory slurry and a ceramic granular material that surrounds the pattern assembly to produce the mold. Each layer of the mold is usually allowed to dry for six to eight hours; the mold is then turned upside down and the wax or plastic is removed to leave a precise mold cavity. Wax patterns are generally removed in a steam autoclave or in a fuel-fired furnace. A new dewaxing process using microwaves is energy efficient and environmentally friendly.
The mold is fired to remove any remaining traces of pattern material, to bond the mold, and to preheat the mold for casting. A heating rate of 100oF to160oF per hour is typically used until the mold reaches the pouring temperature, where it is held until pouring (Swaney and Cignetti 1990).
Some foundries are able to recover the melted wax and reuse a portion in the patternmaking process. Cores used in investment casting are typically collapsible metal assemblies or soluble salt materials that can be leached out with water, a dilute hydrochloric acid solution, or a molten caustic (EPA 1997).
Refractory slurries are composed of binder materials and refractory materials. Refractory materials include silica, aluminum silicates, zircon, and alumina. Binders include silica sols (very small silica particles suspended in water), hydrolyzed ethyl silicate, sodium and potassium silicate, and gypsum type plasters (EPA 1997).
79

Key Energy and Environmental Facts - Investment Casting
Energy Emissions Effluents Byproducts
7.0 x 10⁶ Btu/ton of good casting shipped
Particulates, metallic oxide fumes
Wastewater with low pH and high in dissolved salts if soluble salt cores are used
Waste refractory, waxes, and plastics
Typical Melt Losses - 1% to 5%
The most common version of the process consists of dipping the pattern assembly into a rapidly setting refractory slurry followed by a fluidized bed of refractory. This is repeated six to eight times to get a thin ceramic shell about a quarter-inch thick to surround the pattern assembly, which is then used as the mold.
Wax Sprue
Wax Patterns
Liquid Ceramic
Slurry
Furnace
Alternately, solid molds are sometimes made by pouring a ceramic slurry around a pattern. After the mold is fired, it is forwarded to the pouring area for pouring and cleaning operations similar to those described in Sections 6 and 7.
Figure 8-1 illustrates the investment casting process.
Dry Refractory
Sand
Molten Metal
One-piece Ceramic
Shell Mold
Figure 8-1. Diagram of Investment Casting
80
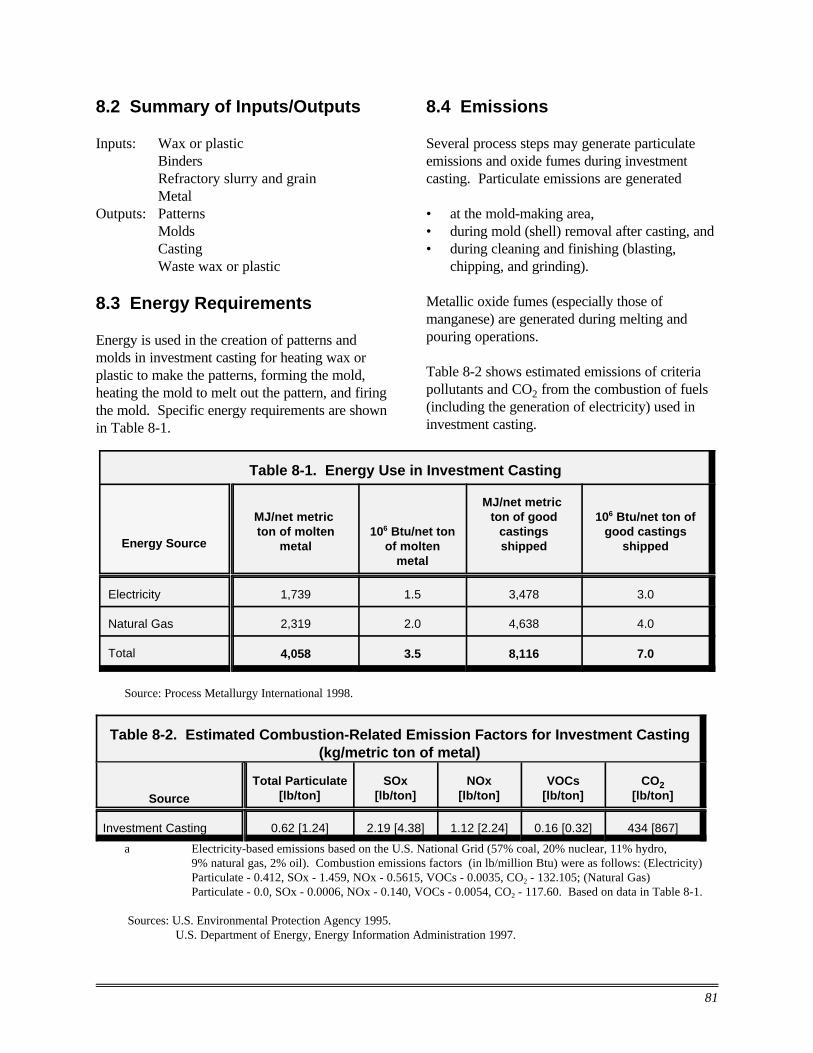
8.2 Summary of Inputs/Outputs
Inputs: Wax or plastic Binders Refractory slurry and grain Metal
Outputs: Patterns Molds Casting Waste wax or plastic
8.3 Energy Requirements
Energy is used in the creation of patterns and molds in investment casting for heating wax or plastic to make the patterns, forming the mold, heating the mold to melt out the pattern, and firing the mold. Specific energy requirements are shown in Table 8-1.
Source: Process Metallurgy International 1998.
8.4 Emissions
Several process steps may generate particulate emissions and oxide fumes during investment casting. Particulate emissions are generated
• at the mold-making area, • during mold (shell) removal after casting, and • during cleaning and finishing (blasting,
chipping, and grinding).
Metallic oxide fumes (especially those of manganese) are generated during melting and pouring operations.
Table 8-2 shows estimated emissions of criteria pollutants and CO2 from the combustion of fuels (including the generation of electricity) used in investment casting.
Table 8-1. Energy Use in Investment Casting
Energy Source
MJ/net metric ton of molten
metal 106 Btu/net ton
of molten metal
MJ/net metric ton of good
castings shipped
106 Btu/net ton of good castings
shipped
Electricity 1,739 1.5 3,478 3.0
Natural Gas 2,319 2.0 4,638 4.0
Total 4,058 3.5 8,116 7.0
Table 8-2. Estimated Combustion-Related Emission Factors for Investment Casting (kg/metric ton of metal)
Source Total Particulate
[lb/ton] SOx
[lb/ton] NOx
[lb/ton] VOCs
[lb/ton] CO2
[lb/ton]
Investment Casting 0.62 [1.24] 2.19 [4.38] 1.12 [2.24] 0.16 [0.32] 434 [867]
a Electricity-based emissions based on the U.S. National Grid (57% coal, 20% nuclear, 11% hydro, 9% natural gas, 2% oil). Combustion emissions factors (in lb/million Btu) were as follows: (Electricity) Particulate - 0.412, SOx - 1.459, NOx - 0.5615, VOCs - 0.0035, CO2 - 132.105; (Natural Gas) Particulate - 0.0, SOx - 0.0006, NOx - 0.140, VOCs - 0.0054, CO2 - 117.60. Based on data in Table 8-1.
Sources: U.S. Environmental Protection Agency 1995. U.S. Department of Energy, Energy Information Administration 1997.
81

8.5 Effluents Waste slurry may also be considered an effluent in some localities. Tables 8-3 to 8-5 depict
Effluents from investment casting consist of effluent limitations for investment casting, using
process water used in any wet cleaning and various metals.
finishing operations that are water-based.
Table 8-3. Effluent Limitations for Investment Casting (Aluminum) - Average of Daily Values
for 30 Consecutive Days (kg/106 kg or lbs per 106 lbs of metal poured)
Pollutant BPTa BATb NSPSc
Copper 4.63 4.63 4.63
Lead 4.3 4.3 4.3
Zinc 4.74 4.74 4.74
Oil & Grease 110 -- 110
TSSd 165 -- 165
pH e -- e
a Best Practicable Control Technology Currently Available. b Best Available Technology Economically Achievable. c New Source Performance Standards. d Total Suspended Solids. e Within the range of 7.0 to 10.0 at all times.
Source: Bureau of National Affairs 1996.
Table 8-4. Effluent Limitations for Investment Casting (Copper Casting) - Average of Daily Values
for 30 Consecutive Days (kg/106 kg or lbs per 106 lbs of metal poured)
Pollutant BPTa BATb NSPSc
Copper 4.63 4.63 4.63
Lead 4.3 2.86 2.65
Zinc 4.74 3.19 3.19
Oil & Grease 110 -- 110
TSSd 165 -- 132
pH e -- e
a-e Same as Table 8-3.
Source: Bureau of National Affairs 1996.
82

Table 8-5. Effluent Limitations for Investment Casting (Ferrous Casting) - Average of Daily Values
for 30 Consecutive Days (kg/106 kg or lbs per 106 lbs of metal poured)
Pollutant BPTa BATb NSPSc
Copper 1.76 1.76 1.76
Lead 4.3 2.86d/4.3e 2.86d/4.3e
Zinc 6.17 4.07d/6.17e 4.07d/6.17e
Oil & Grease 110 -- 110
TSSf 165 -- 132d/165e
pH g -- g
a Best Practicable Control Technology Currently Available. b Best Available Technology Economically Achievable. c New Source Performance Standards. d Applicable to plants casting primarily ductile or gray iron and to plants casting primarily
malleable iron (>3,557 tons of metal/year). e Applicable to plants casting primarily steel and to plants casting primarily malleable iron
(<3,557 tons of metal/year). f Total Suspended Solids. g Within the range of 7.0 to 10.0 at all times.
Source: Bureau of National Affairs 1996.
The use of investment casting can result in as a nonhazardous waste unless condensateswastewater from cleaning operations with low from heavy metal alloy constituents are present inpH and high levels of dissolved salts if soluble the shells (EPA 1997).salt cores are used (EPA 1997).
The issue of waste sand, which is often reclaimed 8.6 Byproducts and reused, was described in
Section 7.
Some byproducts are reclaimed following investment casting. These byproducts include Melt losses for investment casting are typically in
the range of 1% to 5%.
• waste refractory, • wax, and 8.7 Hazardous Wastes • plastic.
As in other casting processes, waste refractory Waste wax from the patternmaking process may materials may contain heavy metals and are be reclaimed; waste wax from pattern removal considered hazardous. Waste caustic materials may also be reclaimed, although not very from core-removal operations may also be efficiently. Investment casting shells can be used considered hazardous in some cases. only once and are disposed of in landfills
83

84
9 Lost Foam Casting
9.1 Process Overview
The lost foam casting (LFC) technique has been known by a variety of names, including evaporative pattern casting (EPC).
Foam Patterns Are Used
The lost foam casting process is a relatively new method of producing castings developed around 1960. The process is primarily used for aluminum, gray iron, and ductile iron castings, although it is envisioned that the process will be used by other segments of the casting industry as the technology matures (carbon pick-up is still a problem with steel).
Lost foam casting uses patterns made from polystyrene (the same material that is used in foam coffee cups) or polymethylmethacrylate (PMMA), placed in either unbonded or bonded sand.
The use of foam patterns can help improve both the casting process and the final cast product by eliminating the need for cores and improving the accuracy of the casting. Cores can be eliminated because unbonded sand fills internal spaces of the foam pattern, forming the cavity in the casting. By eliminating cores, foam patterns can be used to cast complex internal geometries, including multiple passages and curved walls of variable thicknesses.
Unlike most other casting methods, the pattern does not need to be withdrawn from the mold prior to casting. The foam pattern must be coated to obtain a high-quality casting.
The patterns are made from expandable polystyrene or PMMA beads which evaporate from the heat of the molten metal during pouring. The use of low-density, pre-expanded beads minimizes the amount of vapors to be vented. If vapors are generated faster than can be vented, casting defects can result.
85

A single pattern may be made of several sections or multiple patterns may be combined into a cluster and glued together to allow complex or multiple castings per mold. For high production, PMMA beads can be injected into a die and bonded together through heat.
Once the pattern is made, it is coated with a permeable ceramic or other refractory wash by dipping, spraying, or pouring. As with other casting methods, gating and risering systems are included, but in lost foam casting, the gating and risering systems are glued to the pattern. The assembly is suspended in a flask with side vents, and unbonded sand is poured around the pattern while the flask is being vibrated, which allows the sand to pack tightly around the pattern.
During melting and pouring operations, the vapors from the polystyrene escape through the coating, into the mold, and out of the flask. The coating and the rigidity of the sand allow the mold to stay in place. If the rate of metal input (in pounds per second) matches the rate of burn-out of the polystyrene pattern, the chances of mold collapse are minimized.
After the casting has solidified, it is transferred to the shakeout area and proceeds through cleaning and finishing operations like other casting processes (see Section 7). The shakeout process is easy with unbonded sand.
The foam pattern can also be used with bonded sand, a method used with large castings. After the sand sets around the pattern, the foam is removed, the mold is closed, and the casting is poured. A third method is to use Replicast CS to build up a ceramic shell around the foam. The foam is burned away when the ceramic shell is fired. This method is for steel castings and others too large for investment casting (Monroe 1992).
9.2 Summary of Inputs/Outputs
Inputs: Polystyrene or PMMA Metal Refractory coating or paint Sand Glue
Outputs: Casting Waste sand Emissions Waste foam
Figure 9-1 is a flow chart of the steps in the lost foam casting process and the potential waste streams at each step. This figure also lists key energy and environmental facts associated with lost foam casting.
9.3 Energy Requirements
Lost foam casting is relatively energy-efficient compared to other sand casting processes (see Table 9-1, which excludes melting energy). Depending on the casting produced, it is estimated that lost foam casting can reduce energy consumption by about 27% when compared to green sand or resin bonded sand processes (Bates 1997).
There are a number of reasons for this reduced energy use. Elimination of the cores in the molds results in smaller energy requirements. The lost foam casting process allows gating systems with less volume than green sand or resin bonded sand processes. This increases the yield of metal cast to metal melted significantly (80% to 90%, compared to 50% to 60% for green sand castings) and thereby reduces the energy required for melting. Energy is also saved in cleaning and finishing operations because of reduced sand treatment, easier shakeout, and inherent improvement of the casting due to the full-mold production process (Bates 1997).
86
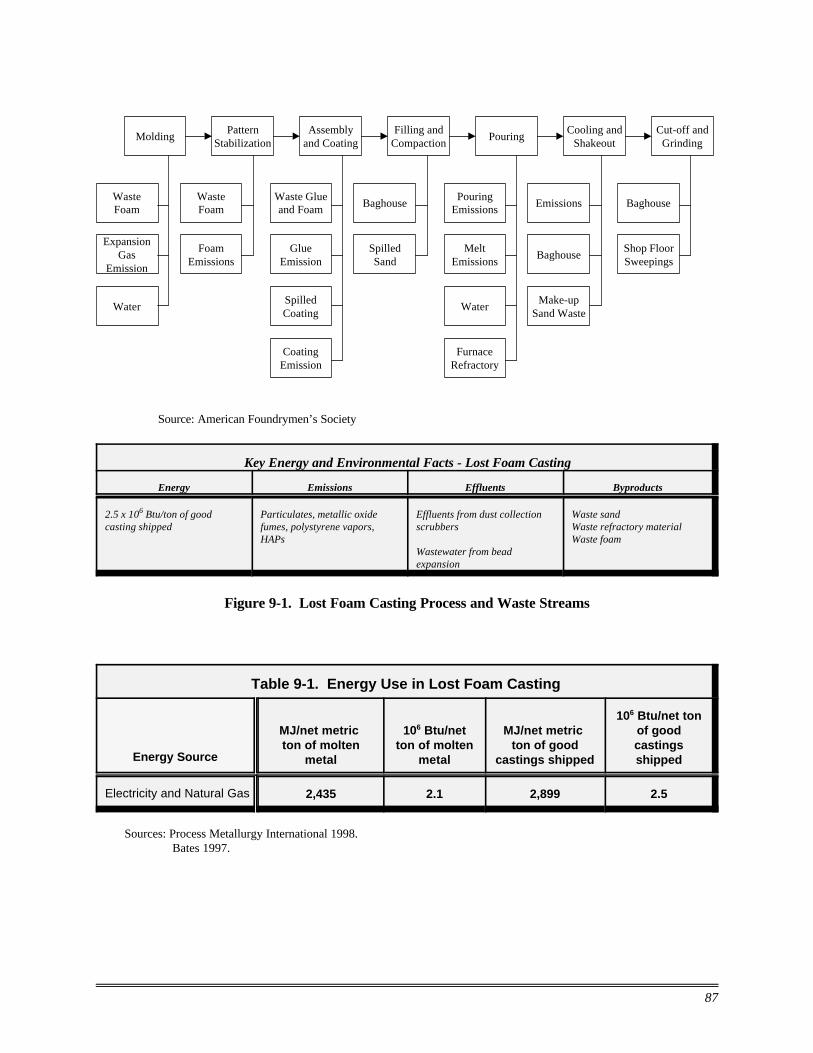
Molding Pattern
Stabilization
Expansion Gas
Emission
Waste Foam
Assembly and Coating
Filling and Compaction
Pouring Cooling and
Shakeout Cut-off and
Grinding
Waste Glue and Foam
Pouring Emissions
Melt Emissions
Spilled Sand
Baghouse
Make-up Sand Waste
Baghouse
Emissions
Shop Floor Sweepings
BaghouseWaste Foam
Glue Emission
Coating Emission
Foam Emissions
Water Spilled Coating
Furnace Refractory
Water
Source: American Foundrymen’s Society
Key Energy and Environmental Facts - Lost Foam Casting
Energy Emissions Effluents Byproducts
2.5 x 10⁶ Btu/ton of good casting shipped
Particulates, metallic oxide fumes, polystyrene vapors, HAPs
Effluents from dust collection scrubbers
Wastewater from bead expansion
Waste sand Waste refractory material Waste foam
Figure 9-1. Lost Foam Casting Process and Waste Streams
Table 9-1. Energy Use in Lost Foam Casting
Energy Source
MJ/net metric ton of molten
metal
106 Btu/net ton of molten
metal
MJ/net metric ton of good
castings shipped
106 Btu/net ton of good castings shipped
Electricity and Natural Gas 2,435 2.1 2,899 2.5
Sources: Process Metallurgy International 1998. Bates 1997.
87

9.4 Emissions
Foam Vaporization in Products May Emit Organic Compounds
As with other casting processes, emissions of particulates, metallic oxide fumes, and hazardous air pollutants are a concern in lost foam casting. In addition, because of the foam patterns, there may be large amounts of polystyrene vapors that are flammable and contain hazardous air pollutants.
Polystyrene decomposes into benzene, ethyl benzene, styrene and toluene, and other light hydrocarbon species (Table 9-2). PMMA decomposes into light carbon components. To capture these emissions, most installations use a forced air or vacuum fume collection system, which leads into filters or baghouses.
There is also considerable debate regarding the production of certain polynuclear aromatic compounds from lost foam casting, some of which have been found to be carcinogenic, including the polynuclear aromatic compounds anthracene, naphthalene, phenanthrene, benzofluoranthene, and benzopyrene. Although the precursors for their production are present, not all studies show these emissions (AFS 1991).
Most coatings are water-based and do not generate emissions. Solvents from glue are not a problem if the facility is adequately ventilated.
9.5 Effluents
Little or no wastewater is generated from the lost foam casting process, except the effluents from dust collection scrubber and from bead expansion. Effluent limitations for the scrubbers are provided in Tables 2-5 to 2-7. During general foundry cleaning operations, spilled coating and spilled sand may be collected and treated. See Section 7.6 for a further discussion on treating waste sand.
9.6 Byproducts
As with other casting processes, waste sand and refractory material are generated that potentially contain metals (and styrene). Since no binders are necessary for lost foam casting, most of the sand can be reused without treatment, although the sand is occasionally cleaned to remove high concentrations of pattern-related vapors. Other byproducts include waste glue and waste foam. Waste polystyrene foam can be recycled.
Table 9-2. Sample Organic Compound Emission Factors for Lost Foam Casting (lb/ton of molten metal) -- Polystyrene
Compound
Aluminum Pouring (1984 tests) Iron Pouring (1982 tests)
Pour Shakeout Total Pour Shakeout Total
Styrene 0.037 10.6 10.6 0.175 0.406 0.58
Benzene - 0.128 0.13 0.094 0.236 0.33
Toluene - 0.917 0.92 0.025 0.089 0.11
Ethylbenzene - 1.65 1.7 - - -
X-Methylstyrene - 0.183 0.06 - - -
Cumene - 0.055 0.06 - - -
Source: American Foundrymen’s Society 1991.
88

9.7 Hazardous Wastes
There are no hazardous wastes associated with the lost foam casting process itself; some RCRA-listed hazardous wastes may be generated during the melting process (see Sections 3 through 5).
89

90

10
10.1 Process Overview
Die casting involves forcing molten metal into the cavity of a reusable steel mold (die) under high pressures. The dies are used to produce tens of thousands of castings in rapid succession. They are constructed of at least two sections to facilitate removal of the castings.
One section of the mold (the fixed die half) is stationary while the other is moveable (the ejector die half). The fixed die half contains the sprue opening through which molten metal enters the die. The ejector die half, to which the die casting adheres and from which it is ejected, is mounted on the moveable platen of the machine.
To begin the casting cycle, the two die halves are clamped tightly together by the die-casting machine. Molten metal is injected into the die cavity, where it solidifies quickly. The die halves are drawn apart and the casting is ejected. Die-casting dies can be simple or complex, with moveable slides, cores, or other sections depending on the complexity of the casting (North
Die Casting
American Die Casting Association [NADCA] 1998).
Die Casting Can Use Hot- or Cold-Chamber Machines
The two types of die-casting machines used by the industry are
• hot-chamber machines, and • cold-chamber machines.
In a hot-chamber machine, the injection mechanism is immersed in molten metal in a furnace to which the machine is attached. The metal is forced by a plunger into the die cavity. After the metal has solidified, the plunger is withdrawn, the die opens, and the casting is ejected.
Cycle times for hot-chamber machines range from less than a second for small components to 30 seconds for a casting of several pounds. Typical operating pressures are between 1,500 and 4,500 pounds per square inch (psi).
91

In a cold-chamber machine, the injection plunger and cylinder are not submerged in the molten metal. Instead, excess molten metal is poured through a port or pouring slot into the “cold chamber” under sufficient pressure to fill the cavity solidly with casting alloy. A hydraulically operated plunger seals the port and a piston forces metal into the locked die.
In high-pressure die casting, injection pressures range from 3,000 psi to more than 10,000 psi for aluminum and magnesium alloys and from 6,000 psi to over 15,000 psi for copper-based alloys (NADCA 1997). After solidification, the die opens and the casting and any excess metal are ejected.
An alternative to the high-pressure die casting process described above is low-pressure die casting, which uses much lower pressures to force the metal into the die. While the equipment is much less expensive than the high-pressure alternative, the process is slower.
Gravity die casting is similar to low-pressure die casting except that the metal is poured in under the pressure of gravity. This is also known as semi-permanent mold casting (see Section 11).
Vacuum die casting is a variation of the die casting process in which a vacuum is applied to the closed die before making the shot, theoretically removing any atmosphere in the cavity that could react or become mixed with the metal. In practice, this is a form of low-pressure die casting because the molten metal is forced into the die by atmospheric pressure.
Several Metals Are Typically Die Cast
Aluminum and zinc alloys are the most widely used metals to make die castings. Magnesium, zinc-aluminum alloys, copper, tin, and lead are also used. These metals can be classified by their melting point as follows:
• low (melt at less than 725oF) — zinc, lead, and tin-based alloys
• moderate (melt at 1,150oF to 1,300oF) — aluminum and magnesium alloys
• high (melt at over 1,650oF) — copper alloys
Low-melting-point alloys are generally cast in hot-chamber machines, while moderate- and high-melting-point metals are cast in cold-chamber machines.
Die-Casting Dies Come in Several Configurations
Die-casting dies are made of alloy steels in at least two sections, as explained above. The fixed die half is designed to contain the sprue opening through which molten metal enters the die. The ejector half usually contains the runners (passage ways) and gates (inlets) that route molten metal to the die cavity(ies) (NADCA 1998).
Fixed and moveable cores are frequently used in dies. If moveable, they are often attached to core slides.
Dies can be classified as follows:
• single cavity • multiple cavity • combination • unit
Multiple-cavity dies have several cavities that are all identical. Combination or family dies have cavities; this type of die is used to produce several parts for an assembly. Unit dies consist of an assembly of dies connected by runners to a common opening or sprue hole. This type of configuration is used to cast several parts either for an assembly or for different customers.
Die Preheating Is Widely Practiced
About 75% of the time, dies are preheated before casting is carried out. The most widely used preheating method is by applying a gas torch, followed by hot oil heating and infrared heating.
92

10.2 Summary of Inputs/Outputs
Inputs: Molten metal Lubricants Electricity Natural gas and fuel oil Compressed air Hydraulic fluid
Secondary process water Cooling water
Outputs: Die cast component Metal scrap Waste hydraulic fluid Waste lubricants Floor absorbent waste Spent plunger tips Gaseous and fume emissions of
metallic oxides Emissions of volatile organic
compounds Effluents
Figure 10-1 illustrates the hot-chamber and cold-chamber die-casting machines with their major inputs and outputs.
10.3 Energy Requirements
Motors, Die Preheating Account for Majority of Energy Use
The natural gas and/or fuel oil and electricity required to preheat the dies represent a significant portion of die casting energy use. Typically, about 5 million Btu/hour of natural gas is required per ton of metal casted. Electricity requirements for electric-resistance die heating are on the order of 4 million Btu/ton of metal.
The primary source of energy to operate die casting machines is electricity. Typical motor horsepowers of 30 to 50 are used per machine.
Table 10-1 shows the estimated amount of energy from various sources used to carry out die casting, including die preheating.
10.4 Emissions
Emissions Originate from Pouring, Lubricants
Some gaseous and fume emissions occur during injection of the molten metal into the die; for example, metal oxide fumes are released as some of the metal vaporizes and condenses. Gaseous emissions can originate from the molten metal itself, the evolution of chemicals from a die lubricant as it is sprayed onto the hot metal die to facilitate filling and ejection, and from contact between the molten metal and the lubricant (NADCA 1996, EPA 1997).
Die and plunger tip lubricants are the most significant source of air releases from die-casting facilities. Both oil- and water-based die lubricants can generate emissions of VOCs, particulate matter, and possibly HAPs. Oil-based lubricants typically contain naphtha and generate much higher emissions of volatile organic compounds than water-based lubricants. The types of emissions will depend on the specific formulation of the lubricant product (NADCA 1996, EPA 1997).
VOC emissions from die lubricants can be reduced by the use of water-based or solid lubricants. Eliminating the volatile components of petroleum-based lubricants will also reduce VOC emissions when wet milling finishing techniques are used. However, lubricants with fewer VOC emissions may not necessarily reduce the total volume of emissions. In addition, HAP emissions may be greater from water-based die lubricants because of the additives used to replace solvents. Alternative lubricants can also be used to reduce particulate emissions from the application of die lubricants (NADCA 1996, EPA 1997).
93

Hot Chamber Die Casting
Cold Chamber Die Casting
Key Energy and Environmental Facts - Die Casting
Energy Emissions Effluents Byproducts
Hot Chamber (fuel-fired) - 0.4 106
Btu/ton plus 4.8 106 Btu/hr per ton of metal Cold Chamber (fuel-fired) - 5.2 106
Btu/ton plus 5.5 106Btu/hr per ton of metal Die Heating (Elec Resistance) Hot chamber - 3.8 106 Btu/ton Cold chamber - 4.4 106 Btu/ton
Gaseous and fume emissions of metallic oxides
VOCs (if solvent-based lubricants are used)
Process wastewater, sometimes contaminated with oils and phenols
Non-contact cooling water
Scrap (typically 5% to 8%) Metallic fines Spent lubricants, oils, and hydraulic fluid Used floor absorbent Used plunger tips
Figure 10-1. Hot- and Cold-Chamber Die Casting
94

Table 10-1. Energy Use in Die Casting
Energy Source
Casting Method
Hot Chamber (fuel-fired)
Die Heating Hot Chamber
(electric resistance)
Cold Chamber (fuel-fired)
Die Heating Cold Chamber
(electric resistance)
Electricity kWh/metric ton metal 106 Btu/ton metal
5 - 10 <0.1
400 3.8
5 - 10 <0.1
460 4.4
Natural Gas 103 CFHa/metric ton metal
106 Btu/hour per ton metal 5.3 4.8
-- 6.1 5.5
--
Fuel Oil lb/metric ton metal
Btu/ton metal 28 0.4
-- 320 5.2
--
a Cubic feet/hour.
Sources: Process Metallurgy International 1998. Dorsau 1996.
10.5 Effluents
Wastewater May Be Contaminated with Die Lubricants
In order to maintain constant operating temperatures, most dies are water-cooled by water circulating through channels in the dies. Because this is a non-contact cooling process, the cooling water may have little or no chemical contamination.
Dies are typically lubricated with oil- or water-based lubricants that include mineral oils and waxes in water emulsions, although silicone oils and synthetic waxes are also being used (EPA 1997).
Process wastewater from die-casting operations can be contaminated with these spent lubricants as well as coolants. Contaminants in such wastewater are typically oil and phenols, with phenols being the regulated pollutant in most wastewater discharge situations. Other sources of phenol contamination include phosphate ester-
based hydraulic oil, cast salts, degreasers, and heat transfer oils.
Die casters may also generate wastewater in certain finishing operations such as in-process cleaning, quenching, and deburring. Such wastewater can have a high concentration of oil and suspended solids (NADCA 1996, EPA 1997).
Typical wastewater treatment at die-casting facilities consists of oil/water separation and/or filtration before discharge to a publically owned treatment works. Facilities generating large volumes of wastewater may also utilize biological treatment (NADCA 1996, EPA 1997). Table 10-2 shows the EPA’s guidelines for effluents from die-casting operations. The guidelines shown include the BPT (Best Practicable Control Technology Currently Available), BAT (Best Available Technology Economically Achievable), and NSPS (New Source Performance Standards).
95

c
Table 10-2. Effluent Limitations for Die-Casting Operations - Average of Daily Values for 30 Consecutive Days
(mg/kg or lbs/106 lbs of metal poured)
Pollutant BPTa BATb NSPSc
Aluminu m
Zinc Aluminum Zinc Aluminum Zinc
Copper 0.0036 0.0036 0.0036 0.0036 0.0036 0.0036
Lead 0.0034 0.0034 0.0034 0.0022 0.0034 0.0022
Zinc 0.0037 0.0037 0.0037 0.0025 0.0037 0.0025
Total Phenols 0.0026 0.0026 0.0026 0.0026 0.0026 0.0026
Oil & Grease 0.0664 0.0864 -- -- 0.0664 0.0864
TSSd 0.13 0.13 -- -- 0.13 0.104
a Best Practicable Control Technology Currently Available. b Best Available Technology Economically Achievable.
New Source Performance Standards. d Total Suspended Solids.
Source: Bureau of National Affairs 1996.
In addition to the guidelines shown, the pH of the effluents must be in the range of 7.0 to 10.0 at all times.
10.6 Byproducts
Residual Wastes Include Fines, Used Absorbents
Relatively little waste is generated in the actual die-casting process compared to other metalcasting processes (particularly sand casting). In addition to the wastes associated with metal melting, holding, and pouring, die-casting wastes can include the following:
• metallic fines • spent shot (plunger tips) • tools • heating coils • hydraulic fluid • floor absorbent • abrasive cutting belts and wheels • quench sludge • steel shot (NADCA 1996, EPA 1997)
Most residual wastes from die-casting facilities are sent off site for disposal as nonhazardous waste. Waste oils, lubricants, and hydraulic fluids may be sent off-site for recycling or energy recovery (NADCA 1996, EPA 1997).
The scrap rate for die-casting operations, including the castings used to achieve stabilized die operating temperatures, is about 8%. The scrap rate is about 5% if the castings used to achieve stabilization are excluded (NADCA 1998). These percentages can be reduced through optimization with computer process simulation.
The Handling of Wastes Varies
Most residual wastes from die casting facilities are sent off-site for disposal as nonhazardous waste. The shot-tip turnings from die casting can be resized on site and reused in the original process.
Hydraulic fluid leaking from die-casting machines can be segregated from other die-casting fluids using drip pans and/or containment curbing. Leaking and spent hydraulic fluids may
96

be collected and recycled as used oil, although they may also be landfilled. Waste oils and lubricants may be sent off-site for recycling or energy recovery. Other fluids, including die release agents and waste lubricants, are typically landfilled (NADCA 1996, EPA 1997).
Used floor absorbents from die casting facilities are also landfilled. The generation of floor-absorbent solid waste at die-casting machines
can be minimized through the use of drip pans and containment berming. Reusable, launderable floor absorbents are increasingly being used, reducing the landfilling of these wastes.
10.7 Hazardous Wastes
There are no RCRA-listed hazardous wastes specifically associated with die casting.
97

98

11
11.1 Process Overview
Casting processes fall within five general categories (Schleg 1994):
• Conventional processes • Precision processes • Semi-precision processes • Special processes • Innovative casting processes
Sand Molding Is a Conventional Process
Conventional casting processes include a variety of sand molding techniques used by the metal casting industry. A thorough discussion of sand casting molds may be found in Section 2.
Precision Processes Include Permanent Mold Casting
Investment and lost foam casting (discussed in Sections 8 and 9, respectively) fall within the
Other Casting Methods
category of precision processes, along with permanent mold casting and the Cosworth process (discussed next).
Permanent Mold Casting
Metal molds and cores are used in permanent mold casting. Molten metal is introduced into the preheated mold either under gravity or with a low-pressure assist. In the latter case, the process is referred to as “low-pressure permanent molding.”
Most permanent molds are of cast iron or steel; graphite molds are used for limited production runs. A simple steel mold may be serviceable for more than 120,000 castings. Iron molds are less durable, with service lives of about 50,000 castings. Aluminum is the principal alloy cast with this method; magnesium, copper-based alloys, zinc, lead, and cast irons may also be cast in permanent molds.
Mold cavities are generally machined from solid blocks of mold material. A metal insert or a sand
99
core may be used to ensure the accuracy of the cavity; if the latter is used, the process is known as “semi-permanent molding.” A variation of semi-permanent molding is the Advanced Casting Technique (ACT), which combines graphite molds with refractory inserts of silica sand.
Refractory coatings are used on the mold to protect it, allow an easy release, control heat flow from the liquid metal to the mold, and provide good surface finish.
A variation of this process, the REC process, allows the casting of steel into coated aluminum molds. Other variations of permanent mold casting use bottom filling to avoid turbulence during mold filling, which can cause porosity in the casting. One of these variations is tilt permanent mold casting.
In tilt permanent mold casting, a closed mold is oriented with the parting in the horizontal plane. The metal is gently poured into the mold, which is then tilted vertically to allow the metal to fill the cavity with minimum turbulence.
Low-pressure permanent mold casting also minimizes turbulence during mold filling. In this process, the mold is positioned over a hermetically sealed furnace and is connected with the molten metal bath via a tube known as a “stalk.” Air pressure (less than one atmosphere) applied to the surface of the melt forces metal up the stalk and into the mold cavity. Pressure is maintained until the part solidifies.
The Vacuum Riserless Casting (VRC)/Pressure Riserless Casting (PRC) process is a variation on low-pressure permanent mold casting, but one that has several distinct refinements specific to high-integrity aluminum parts. In VRC/PRC, the molten metal is drawn into the mold cavity by a vacuum, which also removes air or other contaminating atmosphere from the cavity ahead of the rising metal. Multiple fill tubes distribute the metal evenly in the mold.
Cosworth Process
The Cosworth process, which is used to produce aluminum alloy castings, is another precision-casting method. This process was developed to overcome the problem of inaccuracies that may occur in conventional sand casting when silica sand undergoes a phase change near the melting temperature of aluminum, resulting in a sudden expansion (Hartley 1993).
The molds and cores are made of a refractory material such as zircon sand and use a furan-based binder system. The aluminum alloy is melted under an inert atmosphere using a resistance-rod-type electric furnace and is pumped into the mold.
There Are Four Semi-Precision Processes
Semi-precision processes include the shell process, expendable pattern/lost foam casting (see Section 9), plaster molding, and ceramic molding.
Shell Mold Casting
In this process, the mold cavity is formed by a shell of resin-bonded sand only 0.4 to 0.8 of an inch thick, much thinner and lighter than the molds commonly used in sand foundries.
In the shell process, also referred to as the Croning process, the sand grains are coated with phenolic novolac resins and hexamethylenetetramine. In warm coating, dissolved or liquid resins are used, but in hot coating, solid novolac resins are used. The coated, dry, free-flowing sand is compressed and cured in a heated mold at 300oF to 535oF (150oC to 280oC) for 10 to 30 seconds.
The advantages of the shell process include better blowability and superior flowability of the sand (containing lubricant), which permits intricate cores to be blown and offers excellent surface reproduction. A variety of sands are usable with the process, and nearly all metals and alloys have
100

been successfully cast using shell sand for cores and molds.
Plaster Mold Casting
Casting in plaster molds has been developed principally for use with aluminum alloys. For both the plaster mold and ceramic mold process (discussed next), tooling consists of metal patterns or matchplates. Plaster patterns also can be coated for forming plaster molds.
Plasters used for molding are mixtures of gypsum or plaster of Paris and talc or silica flour, the latter being used to control the contraction of the mold. The mold materials are mixed with water to a creamy consistency, poured over the pattern, and allowed to set.
Ceramic Mold Casting
The ceramic mold process is used to produce cope and drag (split) molds from a quick-setting ceramic investment. The method is also used to produce ceramic cores from standard foundry coreboxes.
Blended ceramic particles are mixed rapidly with liquid binder to form a free-flowing slurry that is poured quickly over a pattern or matchplate. After setting, molds and cores are stripped and fast-cured to 1,800oF for casting.
Typical foundry applications of this type of casting are for producing
• large, complex impellers; • valve bodies; • military hardware; • near-net-shape cast tooling for the plastics and
rubber industry; • forging dies; • glass molds; and • cast patterns and coreboxes.
Special Casting Processes Produce Unique Shapes or Sizes
Several casting processes are placed in a special category because of their ability to produce engineered castings of unique shapes and sizes. The three groups of special casting processes are:
• centrifugal casting, • floor and pit molding, and • the V-process.
Centrifugal Casting
Centrifugal force is used to introduce molten metal into a mold cavity that is spinning around its axis. Cylinders and tubes, including cast iron pipe and copper-base alloy bearings, are commonly produced by centrifugal casting.
In this process, the mold revolves at very high speeds as the molten metal is being poured. Centrifugal force keeps the casting hollow, eliminating the need for cores. Solid metal is centrifuged to the outside surface of the casting, forcing impurities to the center and allowing easy removal.
Molds for centrifugal castings include
• permanent molds made of steel, cast iron, or graphite;
• rammed molds (a metal flask lined with a layer of refractory molding mix); and
• spun or centrifugally cast molds (a metal flask into which slurried refractory is poured).
Floor and Pit Molding
Floor and pit molding techniques are variations of sand casting used when the casting is too large to be made in a conventional jolt-squeeze or automatic molding machine. Floor molding is done with flasks that sit directly on the foundry floor. The molds can be made of green or no-bake sand or an assembly of cores.
101

Pit molding is used when the castings are too large to be made in flasks. An assembly of mold sections is made of dry sand or no-bake binder systems.
The V-Process
In the V-process, a thin polyethylene film is heated to its deformation point and vacuum-formed over a pattern on a hollow carrier plate. A dry, free-flowing unbonded sand is then used to fill the special flask set over the film-coated pattern. The sand contains no water or organic binders and is kept under a vacuum during the molding process.
After the sand is compacted through gentle vibration, the flask is covered with a second sheet of plastic film. The vacuum is drawn and the sand becomes rigid. Releasing the vacuum originally applied to the pattern permits easy stripping.
As molten metal is poured into the film-lined mold cavity, the plastic melts and is replaced by the metal. After the metal solidifies and cools, the vacuum is released and the sand falls away.
Several Innovative Casting Processes Have Been Developed
Manufacturers such as automakers are demanding lightweight castings that provide increased performance at a reduced cost. To help meet these requirements, metal casters are focusing on casting to net- or near-net-shape and on reducing the need for finishing operations. Several unique casting processes have been developed, including
• squeeze casting, • semi-solid metal casting, • the FM process, and • rheocasting and thixomolding.
Squeeze Casting
Squeeze casting is a process that is often thought of simply as a variation of die casting because the equipment is usually a modification of a typical die casting machine. The process, however, stands apart from die casting in terms of both the
processing parameters and end-product characteristics.
In squeeze casting, fully liquid metal is injected through relatively massive runners and gates into the die cavity of a permanent metallic mold. Squeeze casting requires slow filling rates, due to the low viscosity of the fully liquid alloys, minimum turbulence during the filling of the die to avoid gas entrapment, and high pressure during solidification (of at least 8,000 psi) to minimize shrinkage porosity.
Closed systems rather than ladles are becoming common for transferring the liquid alloy from the holding furnace to the die casting machine. This allows clean metal to be drawn from below the melt surface, avoiding oxides and other surface impurities. To overcome premature solidification, the process uses high casting temperatures of up to 1380o F (750o C) and a minimum wall thickness of 0.16 inches to 0.24 inches in the casting.
Multicavity dies are commonly used. A full cycle for a (shot-to-shot) squeeze casting takes one to two minutes, about 40% longer than for a semisolid metal casting (see below), but still relatively productive (Midson 1997). Squeeze casting is typically used for high-production runs in aluminum alloys.
Semi-Solid Metal (SSM) Casting
Squeeze casting and semi-solid metal (SSM) casting have recently been designated as “High Integrity High Pressure” casting processes because they involve re-usable metal molds, high injection pressures, and structural-quality castings. SSM, however, uses metal feedstock that is half liquid and half solid, creating a different flow behavior from the feedstock for squeeze casting.
SSM feedstock is typically continuously cast into billets during which electromagnetic stirring is used to fracture dendrites as they form during solidification (a process known as rheocasting). When the SSM billets are then heated to the semisolid casting temperature (about 580oC for the most commonly used alloys), their microstructure
102

coarsens and spherodizes, producing a globular structure (solid alpha aluminum cells surrounded by liquid eutectic). Reheated billets have enough strength and integrity to be transferred by a robot into a casting machine, yet the mass is “thixotropic” and readily flows into a die as a viscous liquid when sufficient shear force is applied (Midson 1997, Jorstad 1998).
FM Process
The FM process was developed specifically to produce thin-walled iron and steel castings. In this process, molds are bottom-filled with high-melting alloys (including superalloys) under controlled differential pressure. Low pressure is exerted on the liquid metal, while negative pressure is exerted on the mold. Any type of mold (e.g., sand, metal, no-bake) can be used.
Rheocasting and Thixomolding
Rheocasting uses a phenomenon called thixo-tropy that involves the vigorous agitation of a semisolid metal to produce a highly fluid, die-castable alloy. The principles of this process are also used in thixomolding. The processes differ in that in rheocasting the metal alloy is turned to a liquid and then cooled. In thixomolding, the metal alloy is heated only to its mushy state between the liquidus and solidus states.
11.2 Summary of Inputs/Outputs
Inputs: Molten metal Sand or refractory molding media Refractory coatings Sand cores Electricity Fuel (natural gas, oil) Process water Die lubricants
Outputs: Casting Effluents Waste sand or refractory Metal scrap
Figure 11-1 summarizes some key energy and environmental facts for some of these other casting processes.
11.3 Energy Requirements
Melting Requires the Greatest Expenditure of Energy
Table 11-1 shows the estimated energy requirements for some of the casting processes just described. These requirements reflect the energy used in casting and molding and exclude the use of energy for preheating and melting (melting energy use is discussed in Sections 3 through 5).
11.4 Emissions
Emissions from Other Casting Processes Are Process-Dependent
Gas can be evolved from molds, coatings, adhesives, and filler materials. Molds are typically vented to allow the gases to escape from core vents.
Permanent mold, centrifugal, and floor and pit casting processes can generate metallic oxide fumes. Floor and pit casting can also generate emissions of particulates, as can the V-process. Odors may be produced during shell mold casting. Polyethylene film emissions may result from V-process casting, although these emissions are minimal and are handled with proper ventilation systems.
11.5 Effluents
Of all the casting processes described in this section, only the permanent mold process generates a significant quantity of wastewater. This waste is generated when the old coatings on permanent molds are removed when they wear away or become “dead” and need to be reapplied. Coating-removal processes include blasting and newer, less harsh cleaning technologies such as dry ice cleaning.
103
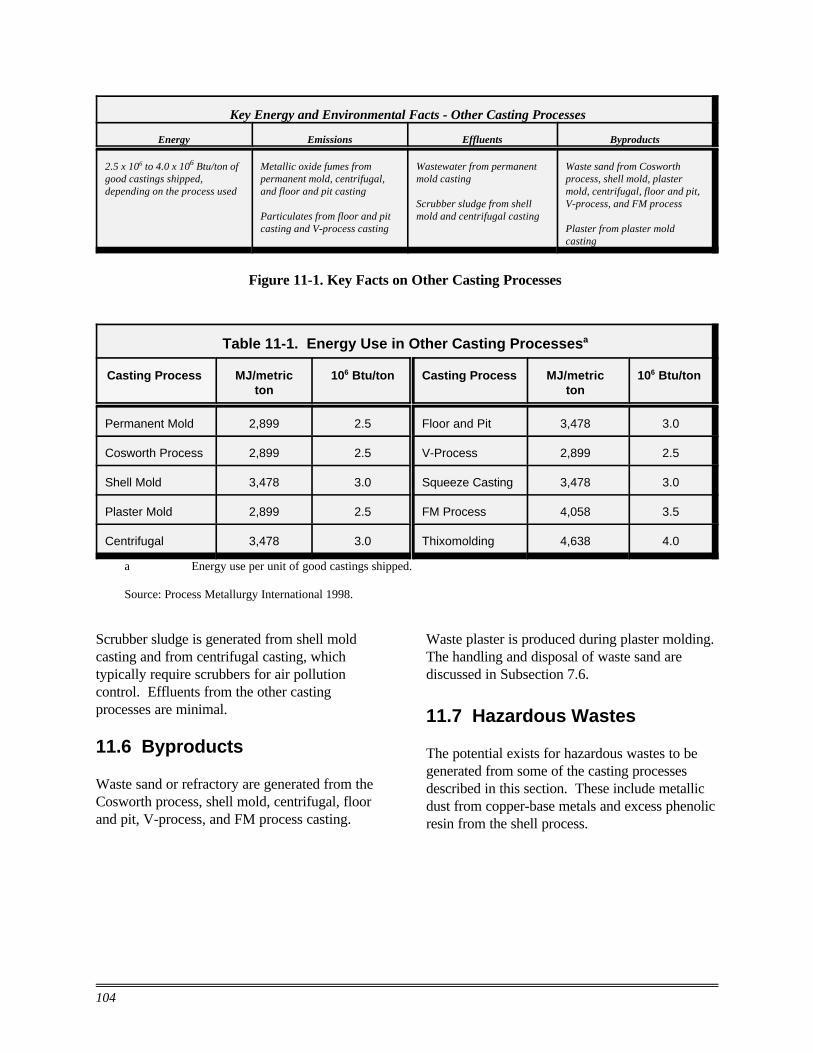
Key Energy and Environmental Facts - Other Casting Processes
Energy Emissions Effluents Byproducts
2.5 x 10⁶ to 4.0 x 10⁶ Btu/ton of good castings shipped, depending on the process used
Metallic oxide fumes from permanent mold, centrifugal, and floor and pit casting
Particulates from floor and pit casting and V-process casting
Wastewater from permanent mold casting
Scrubber sludge from shell mold and centrifugal casting
Waste sand from Cosworth process, shell mold, plaster mold, centrifugal, floor and pit, V-process, and FM process
Plaster from plaster mold casting
Figure 11-1. Key Facts on Other Casting Processes
Table 11-1. Energy Use in Other Casting Processesa
Casting Process MJ/metric ton
106 Btu/ton Casting Process MJ/metric ton
106 Btu/ton
Permanent Mold 2,899 2.5 Floor and Pit 3,478 3.0
Cosworth Process 2,899 2.5 V-Process 2,899 2.5
Shell Mold 3,478 3.0 Squeeze Casting 3,478 3.0
Plaster Mold 2,899 2.5 FM Process 4,058 3.5
Centrifugal 3,478 3.0 Thixomolding 4,638 4.0
a Energy use per unit of good castings shipped.
Source: Process Metallurgy International 1998.
Scrubber sludge is generated from shell mold casting and from centrifugal casting, which typically require scrubbers for air pollution control. Effluents from the other casting processes are minimal.
11.6 Byproducts
Waste sand or refractory are generated from the Cosworth process, shell mold, centrifugal, floor and pit, V-process, and FM process casting.
Waste plaster is produced during plaster molding. The handling and disposal of waste sand are discussed in Subsection 7.6.
11.7 Hazardous Wastes
The potential exists for hazardous wastes to be generated from some of the casting processes described in this section. These include metallic dust from copper-base metals and excess phenolic resin from the shell process.
104
References
A.D. Little. 1992. Alternative Melting Technologies in Scrap-Based Steelmaking. EPRI Center for Materials Production.
American Cast Metals Association et al. 1990. Foundry Energy Conservation Workbook.
American Foundrymen’s Society, Inc. 1998(a). 1999 Metalcasting Forecast and Trends.
American Foundrymen’s Society, Inc., Steel Founders’ Society of America, North American Die Casting Association, and Cast Metal Coalition. 1998(b). Metalcasting Industry Technology Roadmap.
American Foundrymen’s Society. 1997(a). Cleaning Castings. Cast Metal Series.
American Foundrymen’s Society, Inc. 1997(b). AFS MACT task force in place. American Foundrymen’s Society Web Site. <http://www.afsinc.org/mact.html> (July 31).
American Foundrymen’s Society, Inc. 1997(c). New internet tool to diagnose casting defects. Modern Casting 87(9):78 (September).
American Foundrymen’s Society, Inc. 1997(d). Industry News: EPA changes scrap metal classification. Modern Casting 87(6):16 (June).
American Foundrymen’s Society, Inc. 1991. Literature Review and Analysis of EPC Emissions and Solid Waste Generation.
American Foundrymen’s Society, Inc. 1982. Foundry Energy Management.
Andrews, J. 1996. Controlling and Reducing Utility Costs. National Utility Services Ltd.
Apelian, D. et al. 1997. Advanced Casting Technologies in Japan and Europe. American Foundrymen’s Society.
Ballacchino, J. 1993. Market profile of EPC foundries. In Proceedings of the Expendable Pattern Casting Conference (September).
105

Bates, C. 1997. Personal communication.
Beckwith, C. 1994. Cupola emission control. Ductile Iron News.
Bobart, G. 1996. Solving environmental problems utilizing induction heating processes. Industrial Heating (June).
Booth, M. 1996. Developments in electric ferrous technology. Foundryman (March).
Bradley, E. 1989. High-Performance Castings: A Technical Guide. ASM International.
Buntrock, K. 1994. A Common Sense Method for Autoclave Design. Buntrock Industries, Inc. (March).
Bureau of National Affairs. 1996. EPA Effluent Guidelines and Standards for Metal Molding and Casting. 40 CFR Part 464.
Chester, D. and J. Coburn. 1996. Revised Summary of SIR Response Information and Recommendations for Iron & Steel Foundry Industry Disaggregation. Memo to U.S. EPA Office of Air Quality Planning and Standards. Research Triangle Institute. May 3.
Christensen, H. 1995. Injection technology for the ‘90s. Foundry Management (December).
Clark, R. et al. 1996. Foundry Waste Management Alternatives to Disposal (March).
Curtis, L. 1997. Do universal treatment standards affect my waste? Case study. Urick Foundry, Erie, PA. IX. Universal Treatment Standards (UTS). In Proceedings, 9th AFS Environmental, Health & Safety Conference. American Foundrymen’s Society, Inc. August 17-20. Indianapolis, IN. 175.
Dorsau, H. 1996. Casting Plant and Technology International (February).
Fahnline, D. and R. Regan. 1995. Leaching of Metals from Beneficially Used Foundry Residuals into Soils. Presented at the 7th
AFS Environmental Conference (June).
Flemings, M. et al. 1996(a). 30th census of world casting production - 1995. Modern Casting (December).
Flemings, M. et al. 1996(b). How does the U.S. measure up to foundries in Japan and Europe? Modern Casting (December).
Foundry Management & Technology. 1996a. ADI gains against aluminum as material of choice. (January).
Foundry Management & Technology. 1996b. Melting/refractories. (January).
Foundry Management & Technology. 1996c. Metal pouring/filtering. (January).
Foundry Management & Technology. 1996d. Molding. (January).
Foundry Management & Technology. 1996e. Sand/binders/sand reparation/mold & coremaking. (January).
Foundry Management & Technology. 1996f. Shakeout/cleaning/finishing. (January).
Franke, R. 1993. Thermal reclamation of used foundry sands and dust inter-vison. Casting Plant & Technology (April).
Fuller, R. et al. 1996. Water Treatment in Foundries That Melt and Process Steel. American Foundrymen’s Society.
Fuller, R. et al. 1995. Water Treatment In Foundries With Induction Furnaces. AFS International Channel and Coreless Induction Melting of Iron Conference (October).
Gwyn, M. 1998. Framework for designing. SCRA Home Page. <http://www.scra.org/amc/...1/dsgconcp.html #concpl.1>.
106

Hartley, J. 1993. The Materials Revolution in the Motor Industry. The Economist Intelligence Unit.
Hesse, C. 1996. The Redefinition of Solid Waste. Mc Dermott, Will & Emery.
Horwath, J. et al. 1994. Coreless Induction Melting Optimization Study. Prepared for the EPRI Center for Materials Production.
Hoyt, D. 1996. Beneficial reuse of foundry sand. In Proceedings of the 8th AFS Evironmental, Health & Safety Conference. August 18-20. Milwaukee, WI. 155.
Jackson, M. et al. 1992. Emission Testing for Air Toxics [sic] and Other Contaminants. Presented at the 7th International Aluminum Sheet & Plate Conference (June).
Jorstad, J. 1998. Personal communication.
Joshi, P. 1995. Energy conservation and air pollution control in grey-iron foundries with emphasis on cupola melting. Indian Foundry Journal (November).
Kaiser, F. 1994. Why Melt Cupola? Modern Equipment Company, Inc.
Kanicki, D. 1998. Review comments.
Kanicki, D. 1994. Metalcasting’s versatility offer [sic] users a competitive edge. Designers’ & Buyers’ Guide to Selecting Casting Processes I(1):5-10. Casting World/Modern Casting Publication.
Kirgin, K.H. 1999. Casting shipments remain strong. Modern Casting (89)6:56-57 (June).
Kirgin, K.H. 1998. Solid economy continues to fuel casting growth: 1998 AFS metalcasting forecast and trends report. Modern Casting 88(1):30-33 (January).
Kirgin, K.H. 1997. Solid casting markets fuel 1997 expansion: 1997 metalcasting forecast and trends. Modern Casting 87(1):29-32 (January).
Korba, R. 1993. Infrared-Assisted Drying of Foundry Mold Wash Coatings. EPRI Center for Materials Production (February).
Kotzin, E. et al. 1982. Foundry Energy Management. American Foundrymen’s Society.
Krymsky, D. 1995. Increasing cupola melting effectiveness. Foundry Management and Technology.
Kunsman, C.D. and C.C. Carlson. 1985. Nonferrous metals. Mark’s Standard Handbook for Mechanical Engineers. 8th ed. McGraw Hill.
Laitar, R. and M. Geoffrey. 1997. Core/mold binder systems: an environmental/ productivity update. Modern Casting 88(10):33-35 (October).
Lanham, G. and T. Martin. 1993. Air Pollution Control: The Basics. Environmental Conference Transcript.
Lessiter, M. 1997. Aluminum crucible melting: small foundry “models.” Modern Casting (December).
Lewensky, J. et al. 1997. AFS Inernational Molten and Coreless Induction Melting of Iron Conference (October).
Lindem, S. 1996. Wisconsin’s hazardous air emissions program. In Proceedings, 8th AFS Environmental, Health & Safety Conference. American Foundrymen’s Society, Inc. (August).
Loper, C.R., Jr. 1985. Foundry practice and equipment. Mark’s Standard Handbook for Mechanical Engineers. 8th ed. McGraw Hill.
107

Lucas, A. 1997. Proposed air quality standards: a threat to the foundry industry. Modern Casting (June).
Maysilles, J. MACT Standards-Status of EPA’s Industry Survey. U.S. EPA Research Triangle Park.
McKenna, J.P. and A. Wisdom. 1998. Boost the efficiency of your gas-fired reverbertory furnace. Modern Casting 8(7): 56-9 (July).
McKinley et al. 1993. Air emissions from foundries: a current survey of literature, suppliers and foundrymen. In Transactions of the American Foundrymen’s Society: Proceedings of the 97th Annual Meeting. April 24-27.
McMahon, J. 1990. Dross Cooling and Energy Savings. Presented at the Aluminum Industry Energy Conservation Workshop XI (November).
Midson, S.P. 1997. The squeeze casting and semisolid metal casting of lightweight components. In Proceedings of the 4th
International Conference on Permanent Mold Casting of Aluminum. November 9-11. Anaheim, CA.
Mikelonis, P. Charge Materials for Coreless Induction Furnace Melting. Berlin, WI.
Modern Casting. Census of world casting production - 1996. (December).
Monroe, R.W. 1996. View of the casting process. SCRA Home Page. <http://www.scra.org/amc/steel/cstintcp.html >.
Monroe, R.W. 1992. Expendable Pattern Casting. American Foundrymen’s Society.
Morency, M. 1997. Clearing the air on emission estimates. Modern Casting 87(10): 41-43 (October).
Mortimer, J. 1994. Automating the Melting Process: A Key to Competing (June).
Mosher, G. 1994. Calculating Emission Factors for Pouring, Cooling and Shakeout. Americans Foundrymen’s Society (October).
Mullins, J. 1993. Controlling melt components can lower good casting costs. Modern Casting (June).
National Center for Manufacturing Sciences. 1999. Ferrous Foundry Air Emissions Study. Performed by the University of Alabama at Birmingham.
North American Die Casting Association. 1998. North American Die Casting Association (NADCA) Home Page. <http://www.diecasting.org>
North American Die Casting Association. 1996. Pollution Prevention Practices & Energy Assessment Procedure Manuals.
Oman, D. 1995. Innovative Solutions for Closure of a Foundry Waste Superfund Site. Prepared for 7th AFS Environmental Affairs Conference (July).
Paterson, T. 1993. Efficient melting and holding of aluminum alloys. The Foundryman (June).
Penton Publishing. 1996. 1996 databook for metalcasters. Foundry Management & Technology 124(1) (January).
Philbin, M. 1995. Is it time for your foundry? Modern Casting (August).
Piwonka, T.S. 1993. The role of EPC in meeting today’s metalcasting technology needs. In Proceedings of the Expendable Pattern Casting Conference (September).
Planson, R. 1993. Planning Ferrous Metal Melting Systems. Global Consulting Inc. (March).
108

Process Metallurgy International. 1998. Personal communication.
Radia, J., C. French, and T. Slavin. 1996. Current Industry Environmental Concerns. Panel discussion at 8th American Foundrymen’s Society Environmental, Health, & Safety Conference. August 18-20. Milwaukee, WI.
Ramsay, C. 1995. The basics of selecting permanent mold tooling materials. Modern Casting (July).
Regan, R., and P. Tikalsky. VII. 1997. Beneficial reuse - preparing foundry solid wastes for commercial markets - what needs to be done. In Proceedings of 9th AFS Environmental, Health & Safety Conference. American Foundrymen’s Society, Inc. August 17-20. Indianapolis, IN. 157.
Reuland, W., E. Wabiszewski, and F. Gusten. 1997. Beneficial reuse of foundry by-products: marketing and customer education is the key to making it happen. Foundry Recycling Workshop: Marketing 101; Marketing Partners: The Role of Brokers/Processors. In Proceedings of 9th
AFS Environmental, Health & Safety Conference. American Foundrymen’s Society, Inc. August 17-20. Indianapolis, IN. 51.
Rickun, J. 1993. Air permits, Title III, VOCs and foundries. In Environmental Affairs Conference Proceedings. August 22-24. Milwaukee, WI.
Rizzo, J. Special Emphasis Program (SEP) for Silica, U.S. Department of Labor.
Roberts, R. 1990. In-Plant Processing of Aluminum Melting Furnace Dross. Presented at the Aluminum Industry Energy Conservation Workshop XI (November).
Robinson, S. 1998. Review comments.
Rogers. J. et al. Casting Emission Reduction Program: An Update. McClellan Air Force Base.
Schifo, J. and J. Stone. XI. 1997. Casting Emissions Reduction Program (CERP) update of McClellan AFB/USCAR foundry project. In Proceedings of 9th AFS Environmental, Health & Safety Conference. American Foundrymen’s Society, Inc. August 17-20. Indianapolis, IN. 205.
Schleg, F. 1994. Guide to selecting casting and molding processes. Casting World/Modern Casting 1(1): 13-41 (Summer).
Schmidt, L. 1994. Dry dust collection systems. In Proceedings of the AFS International Cupola Conference. March 1-3. Rosemont, IL.
Schuhmann, R. 1952. Metallurgical Engineering, Vol. 1. Addison-Wesley Press.
Scrimshire, D. 1996. What’s Involved in Implementing ISO 14001? TEC Transnational Ltd. (December).
Sittig, M. 1997. Practical Techniques for Saving Energy in the Chemical, Petroleum and Metals Industries. Noyes Data Corporation.
Sheth et al. 1995. Recycling of Salt Cake and Black Dross Material. Presented at Pollution Prevention in the Aluminum Industry (November).
Smith and Bullard. 1995. Best melting practices in medium frequency coreless induction furnaces. The Foundryman (July).
Stepano S. 1993. Analysis of Energy Efficiency of Industrial Processes. Berlin, New York (June).
Stevenson, J.P. 1995. Scrap and yield: an overview. The Foundryman (May). 178-81.
Svoboda, J. 1998. Personal communication.
109
Swaney and Cignetti. 1990. Cast Metals Technology. American Foundryman’s Society.
Sylvia J. Cast Metals Technology. American Foundrymen’s Society.
Takao, H. 1995. Development of the gas shaft furnace for cast iron melting. Foundry Trade Journal (January).
Thomas, S. 1993. Environmental Affairs Conference Proceedings. American Foundrymen’s Society (August).
Tordoff, B. 1996. The Benefits of Good Environmental Performance. Ashland Chemical (August).
Tricia, M. 1997. Pollution Prevention Practices & Energy Assessment Procedure Manuals, 1997.
U.S. Department of Energy, Office of Industrial Technologies. 1997. OIT Technology Partnerships.
U.S. Department of Energy, Energy Information Administration. 1997. Manufacturing Consumption of Energy - 1994.
U.S. Environmental Protection Agency. 1998. 1996 Toxic Release Inventory Public Data Release Report.
U.S. Environmental Protection Agency. 1997. EPA Office of Compliance Sector Notebook Project: Profile of the Metal Casting Industry. EPA/310-R-97-004 (October).
U.S. Department of Commerce. 1996. 1995 Annual Survey of Manufactures, Statistics for Industry Groups and Industries, M95(AS)-1.
U.S. Environmental Protection Agency. 1995. Compilation of Air Pollutant Emission Factors, Vol. I: Stationary Point and Area Sources. AP-42, Fifth Ed. (January).
U.S. Environmental Protection Agency. 1990. AIRS/Facility Subsystem Source Classification Codes and Emission Factor Listing for Criteria Air Pollutants. EPA 450/4-90-003 (March).
Wechsler, T. and G. Gitman. 1990. Use of the Pyretron Variable Ratio Air/Oxygen/ Fuel Burner System for Aluminum Melting. Presented at the Aluminum Industry Energy Conservation Workshop XI (November).
Williams, J. 1994. Oxygen Use Technologies. Praxair Inc. Chicago IL.
Zayko, R. Environmental Concerns for Steel Melting. Soil & Materials Engineers, Inc.
110