ITK 3 - The Kitware Blog · PDF fileVTK developers and users to quickly prototype algorithms,...
20
SOFTWARE DEVELOPER’S QUARTERLY Editor’s Note ........................................................................... 1 Recent Releases ..................................................................... 1 MATLAB ® and GNU R Integration With VTK ....................... 2 Python Trace .......................................................................... 6 How ACFR Uses Kitware Products ........................................ 7 Representation Plugins in Paraview ................................... 10 Paraview Used in a Mining Research Environment ........... 12 Building External Projects with CMake 2.8 ........................ 14 Kitware News ...................................................................... 18 The Kitware Software Developer’s Quarterly Newsletter contains articles related to the development of Kitware projects in addition to a myriad of software updates, news and other content relevant to the open source community. In this issue, Thomas Otahal, of Sandia National Labs, dis- cusses the integration of MatLab and GnuR with Kitware’s Visualization Toolkit. Pat Marion introduces a new extension to the ParaView Python interface, called Python trace which generates human readable Python scripts that mimic user actions in the GUI. Andrew Maclean, from the Australian Centre for Field Robotics (ACFR), discusses ACFR’s use of Kitware’s open-source toolkits in order to manage a devel- opment environment that is cross-platform, supports code reuse, and is responsive to change. Utkarsh Ayachit provides a brief tutorial on adding representation plugins in ParaView. Andrew Maclean, from ACFR, discusses the use of ParaView in a mining research environment. And David Cole provides a tutorial on building external projects with CMake 2.8. The Kitware Source is just one of a suite of products and services that Kitware offers to assist developers in getting the most out of its open-source products. Each project’s website contains links to free resources including mailing lists, documentation, FAQs and Wikis. In addition, Kitware supports its open-source projects with technical books, user’s guides, consulting services, support contracts and training courses. For more information on Kitware’s suite of products and services, please visit our website at www.kitware.com. Issue 11 • Oct 2009 ITK 3.16 ITK 3.16 was released on September 15, 2009. The main changes in this release include the addition of classes for managing labeled images, contributed to the Insight Journal by G. Lehmann. These classes were the remaining compo- nents of a 70+ class label map morphology module. They provide efficient label map representation and enable con- version from current ITK label images to an efficient format. Details are available from “Label Object Representation and Manipulation with ITK”, which can be read in the January Source or on the Insight Journal (hdl.handle.net/1926/584). These new classes can be found in the Code/Review Directory and can be enabled by setting the CMake variable ITK_USE_ REVIEW to ON during the configuration process. Thanks to Gaetan Lehmann and Sophie Chen for their dedication on bringing these valuable new functionalities into ITK. This release offers a fix to a long standing issue in ITK regard- ing the computation of physical coordinates associated with pixels. This fix is enabled by default, but if you need to revert it to the previous behavior for backward compatibility reasons, you can disable it by turning off the CMake flag: ITK_USE_CENTERED_PIXEL_COORDINATES_CONSISTENTLY. Thanks to Tom Vercauteren and Michel Audette for their hard work on getting this difficult issue fixed. Many improvements and fixes in the I/O infrastructure were contributed by Brad Lowekamp, which made it possible to manage large image files through the streaming infrastruc- ture of the data pipeline. In particular, Brad contributed examples illustrating how to process the entire Visible Human dataset via an ITK pipeline. For more details about this release, please visit the ITK Wiki and search for “Release 3.16”. PARAVIEW 3.6.2 Kitware, Sandia National Laboratories and Los Alamos National Laboratory will be releasing ParaView 3.6.2 in early November. This is a minor patch release which includes a few critical bug fixes and two exciting new features. ParaView’s Python interface was revamped, an exciting new extension to the interface is Python trace. The goal is to gen- erate human readable, not overly verbose, Python scripts that mimic a user’s actions in the GUI. The “Python Trace” article on page 6, discusses this functionality in greater detail. ParaView 3.6.2 also includes a collection of statisti- cal algorithms to compute: descriptive statistics (mean, variance, min, max, skewness, kurtosis); compute contin-
Transcript of ITK 3 - The Kitware Blog · PDF fileVTK developers and users to quickly prototype algorithms,...

S O F T W A R E D E V E L O P E R ’ S Q U A R T E R L Y
Editor’s Note ........................................................................... 1
Recent Releases ..................................................................... 1
MATLAB® and GNU R Integration With VTK ....................... 2
Python Trace .......................................................................... 6
How ACFR Uses Kitware Products ........................................ 7
Representation Plugins in Paraview ................................... 10
Paraview Used in a Mining Research Environment ........... 12
Building External Projects with CMake 2.8 ........................ 14
Kitware News ...................................................................... 18
The Kitware Software Developer’s Quarterly Newsletter contains articles related to the development of Kitware projects in addition to a myriad of software updates, news and other content relevant to the open source community. In this issue, Thomas Otahal, of Sandia National Labs, dis-cusses the integration of MatLab and GnuR with Kitware’s Visualization Toolkit. Pat Marion introduces a new extension to the ParaView Python interface, called Python trace which generates human readable Python scripts that mimic user actions in the GUI. Andrew Maclean, from the Australian Centre for Field Robotics (ACFR), discusses ACFR’s use of Kitware’s open-source toolkits in order to manage a devel-opment environment that is cross-platform, supports code reuse, and is responsive to change. Utkarsh Ayachit provides a brief tutorial on adding representation plugins in ParaView. Andrew Maclean, from ACFR, discusses the use of ParaView in a mining research environment. And David Cole provides a tutorial on building external projects with CMake 2.8.
The Kitware Source is just one of a suite of products and services that Kitware offers to assist developers in getting the most out of its open-source products. Each project’s website contains links to free resources including mailing lists, documentation, FAQs and Wikis. In addition, Kitware supports its open-source projects with technical books, user’s guides, consulting services, support contracts and training courses. For more information on Kitware’s suite of products and services, please visit our website at www.kitware.com.
Issue 11 • Oct 2009
ITK 3.16 ITK 3.16 was released on September 15, 2009. The main changes in this release include the addition of classes for managing labeled images, contributed to the Insight Journal by G. Lehmann. These classes were the remaining compo-nents of a 70+ class label map morphology module. They provide efficient label map representation and enable con-version from current ITK label images to an efficient format. Details are available from “Label Object Representation and Manipulation with ITK”, which can be read in the January Source or on the Insight Journal (hdl.handle.net/1926/584).
These new classes can be found in the Code/Review Directory and can be enabled by setting the CMake variable ITK_USE_REVIEW to ON during the configuration process. Thanks to Gaetan Lehmann and Sophie Chen for their dedication on bringing these valuable new functionalities into ITK.
This release offers a fix to a long standing issue in ITK regard-ing the computation of physical coordinates associated with pixels. This fix is enabled by default, but if you need to revert it to the previous behavior for backward compatibility reasons, you can disable it by turning off the CMake flag:
ITK_USE_CENTERED_PIXEL_COORDINATES_CONSISTENTLY. Thanks to Tom Vercauteren and Michel Audette for their hard work on getting this difficult issue fixed.
Many improvements and fixes in the I/O infrastructure were contributed by Brad Lowekamp, which made it possible to manage large image files through the streaming infrastruc-ture of the data pipeline. In particular, Brad contributed examples illustrating how to process the entire Visible Human dataset via an ITK pipeline.
For more details about this release, please visit the ITK Wiki and search for “Release 3.16”.
PARAVIEW 3.6.2Kitware, Sandia National Laboratories and Los Alamos National Laboratory will be releasing ParaView 3.6.2 in early November. This is a minor patch release which includes a few critical bug fixes and two exciting new features.
ParaView’s Python interface was revamped, an exciting new extension to the interface is Python trace. The goal is to gen-erate human readable, not overly verbose, Python scripts that mimic a user’s actions in the GUI. The “Python Trace” article on page 6, discusses this functionality in greater detail.
ParaView 3.6.2 also includes a collection of statisti-cal algorithms to compute: descriptive statistics (mean, variance, min, max, skewness, kurtosis); compute contin-

2
MATLAB® AND GNU R INTEGRATION WITH VTK
MATLAB and GNU R are widely used software environments for technical and scientific computing. Each program envi-ronment contains large collections of existing software for many common technical computing tasks, such as: singular value decomposition, maximum likelihood estimation, linear system solving, and data plotting. The goal of the work described in this article is to enable VTK-based applications to leverage the computing resources available in MATLAB and GNU R, and to allow the 3D visualization power of VTK to be accessed from MATLAB and GNU R.
MATLAB (MATrix LABoratory) is a commercial software product developed and sold by The MathWorks, Inc. MATLAB programs are written in a scripting language called m, which can be used interactively in a command line mode, or can be stored in script files as m-file functions for repeated runs. MATLAB can also be extended by purchasing The Mathworks produced add-ons called toolboxes, which are typically large collections of m-file scripts for a specific domain of technical interest, such as: control systems, signal processing, and sta-tistics. MATLAB also provides interfaces to access resources from external programs.
GNU R is an open source program developed under the GNU Project. GNU R is primarily used for statistics and graphing of scientific data. GNU R uses a powerful object oriented script-ing language based on the S language for writing programs. GNU R can also be extended through user contributed add-ons called packages. In a similar fashion to MATLAB, GNU R also defines interfaces for accessing external programs.
Integrating VTK with large program environments such as GNU R and MATLAB involve trade-offs in terms of increased memory usage and slower program execution speed. The need to copy and convert data between the different envi-ronments, and the need to run interpreted script code instead of only compiled C++, all increase memory size and reduce the compute speed of integrated applications. This trade-off is acceptable from the point of view of making the large repository of technical computing code in MATLAB and GNU R accessible from VTK and vice-versa. This integration allows VTK developers and users to quickly prototype algorithms, analyze data, and visualize results without investing large amounts of time implementing code in C++ that is already available in MATLAB and GNU R.
MATLAB® INTEGRATION WITH VTKMATLAB defines two primary interfaces for integration with external programs. The first interface is called MEX (MATLAB Executable). The MEX interface allows C/C++ code compiled as a dynamic library to be called from the MATLAB m script language as a function, thus providing improved perfor-mance for a particular algorithm implementation (compiled code instead of m script code). The MEX interface also pro-vides access to external libraries and software frameworks.
The second interface is the MATLAB Engine API. The MATLAB Engine API starts an instance of the MATLAB command inter-preter as a separate operating system process. This separate operating system can then be accessed through the Engine API to pass data and m script commands.
gency tables; perform k-means analysis; examine correlations between arrays; and perform principal component analysis on arrays.
For more information about these filters, please visit the ParaView Wiki and search for “Statistical Analysis”.
CMAKE 2.8.0 CMake 2.8.0 was released in September 2009. This version of CMake fixes many open issues and provides some exciting new features.
The official CMake GUI is now Qt-based, and is distributed with CMake on Windows, Linux, and Mac OSX. The GUI pro-vides for quick searching of CMake options, and the ability to have options with lists of defined options. The ccmake executable will still be available for command line use on supported systems.
There is a “--build” option for the cmake executable that can be used to build any CMake build tree from the command line, regardless of the generator used. A new External project module can be used to create custom targets to drive down-load, update/patch, configure, build, install and test steps of an external project.
The new CMake has support for Visual Studio 2010. It also has significant improvements for the Eclipse project gen-erator. All targets are now available in Eclipse and system include directories and predefined macros are now detected for improved syntax highlighting.
CTest now runs many tests in parallel with a –j N command line option. A new CTest option, CTEST_USE_LAUNCHERS, can be used to improve error and warning reports on CDash dashboards. CTest will determine the return value for each process launched during the build and “log scrapping” is not required to figure out errors and warnings. CTest can also work with the new CDash sub-project feature and create hierarchical dashboards. Support for modern version control systems Git, Mercurial, and Bazaar were added.
CPack now has the option to use DESTDIR for any CMake based projects giving more flexibility on final path names for installers. The Deb generator now computes the arch instead of hard coding it.
Creating Fortran/C mixed language projects is easier. CMake automatically computes the runtime libraries for a compiler and adds them to the link line. In addition, a FortranCInterface module determines the required name mangling.
Other enhancements include a faster makefile depen-dency scanner, improved find modules, and support for manifests when using Intel compilers on Windows. The xmlrpc dependency has been removed, and a CMAKE_OSX_DEPLOYMENT_TARGET cache variable has been created to set the deployment OS for a build on OSX. We also added a new FindCUDA module that includes the ability to compile cross-platform GPU Cuda code from CMake projects.
Several new policies were added to the release. For specific information regarding these policies, and a full list of fea-tures and bug fixes, check the News on the CMake website.

3
Both the MEX and MATLAB Engine API interfaces pass input and output data in a data structure called MXARRAY. The MXARRAY format is the fundamental data structure used by MATLAB to represent scalars, vectors, matrices, and multi-dimensional matrices.
The C++ class structure for the MATLAB integration with VTK is shown in Figure 1. The fundamental class in the integra-tion is vtkMatlabMexAdapter, which defines static methods for converting data between vtkDataArray, vtkArray, and vtkTable to equivalent MATLAB MXARRAY data structures. The vtkMatlabMexAdapter class is a non-VTK pipeline class and can be used to implement MATLAB MEX functions that use VTK resources. The vtkMatlabEngineInterface class is also a non-VTK pipeline class, which manages a singleton instance of a MATLAB Engine process through the MATLAB Engine API. This class defines methods that are similar to the MATLAB Engine API, to permit data to be passed to and from the MATLAB Engine process, and to allow MATLAB m script commands to be executed on the MATLAB Engine process. The vtkMatlabEngineInterface class also manages an instance of vtkMatlabMexAdapter to perform data struc-ture conversions.
file is a shared library that can called from MATLAB m script like any other MATLAB function.
[X,Y] = meshgrid(-8:.5:8);R = sqrt(X.^2 + Y.^2) + eps;Z = 8*sin(R)./R; X = reshape(X,1,size(X,1)*size(X,2))’;Y = reshape(Y,1,size(Y,1)*size(Y,2))’;Z = reshape(Z,1,size(Z,1)*size(Z,2))’;P = [X Y Z]; vtkpointsurf(P);
The code shown above is a MATLAB m script file which creates a 3D datapoint representation of the SINC function (in variables X,Y,Z). The data is then formatted into a 3-com-ponent vector of XYZ components (via the MATLAB reshape() command) that the MEX function vtkpointsurf expects as input. The vtkpointsurf MEX function uses VTK to display a 3D plot of the SINC function data, shown in Figure 2.
INCLUDE(${MATLAB_MEX_USE_FILE})ADD_MATLAB_MEX_FILE(vtkpointsurf SHARED vtkpointsurf.cxx)
TARGET_LINK_LIBRARIES(vtkpointsurf vtkCommon vtkIO vtkImaging)
The listing above is the CMake file used to compile the MEX function vtkpointsurf. The INCLUDE(${MATLAB_MEX_USE_FILE}) command provides all necessary macros and definitions to compile MEX and MATLAB Engine-based code. The ADD_MATLAB_MEX_FILE macro creates a dynamic library MATLAB MEX file for the vtkpointsurf function.
void mexFunction(int nlhs, mxArray *plhs[], int nrhs, const mxArray *prhs[]){vtkDataArray* pointdata = (vtkDataArray*) vtkMatlabMexAdapter::mxArrayTovtkDataArray(prhs[0]);
vtkPoints* points = vtkPoints::New();
points->SetData(pointdata); pointdata->Delete(); vtkPolyData* pointCloud = vtkPolyData::New(); pointCloud->SetPoints(points); points->Delete(); vtkDelaunay2D* d2d = vtkDelaunay2D::New(); d2d->SetInput(pointCloud);}
The above code is an excerpt from the vtkpointsurf MATLAB MEX function implementation. The standard mexFunction argument signature specifies the arguments passed into the MEX function from MATLAB (prhs), and the arguments passed out of the function to MATLAB (plhs). The 3D point data for the SINC function is passed in from MATLAB via prhs[0], and converted to a vtkDataArray with the vtkMat-labMexAdapter class. The 3D point data is then triangulated as a surface and rendered on screen using VTK, Figure 2.
The second MATLAB integration example uses the MATLAB Engine filter to perform a calculation on a VTK input dataset. The example then places the result of the calculation on the output VTK dataset.
The vtkMatlabEngineFilter class (Figure 1) is a VTK pipeline object that operates in a similar manner to the vtkCalcu-latorFilter. It allows data arrays on the filter input to be passed to the MATLAB Engine for processing, and places the resulting arrays returned from the MATLAB Engine on the filter output. Other similar custom pipeline filters can be developed with this design, using an instance of the vtkMat-labEngineInterface as a convenient interface to MATLAB. The vtkMatlabEngineFilter can also be accessed through the Paraview GUI when loaded as a ParaView plugin.
MATLAB® INTEGRATION EXAMPLESA licensed MATLAB software installation must be present in order to compile and run any MATLAB dependent code in VTK. The MATLAB integration code can be activated by turning on the VTK CMake build option. The CMake system will then attempt to locate the root directory of your MATLAB installation to find the necessary libraries and header files for compilation of MATLAB related code in VTK.
The first example is a MATLAB MEX dynamic library built using the MATLAB integration CMake commands. The example is implemented with the data conversion methods defined on the vtkMatlabMexAdapter class. Recall that a MATLAB MEX
Figure 1: Class diagram for MATLAB integration with VTK.

4
INCLUDE(${MATLAB_MEX_USE_FILE})ADD_EXECUTABLE(bumpmap bumpmap.cxx)
TARGET_LINK_LIBRARIES(bumpmap vtksnlInfovisMatlabEngine)
The above listing is the CMake file used to compile the second example (bumpmap), and again the CMake INCLUDE(${MATLAB_MEX_USE_FILE}) statement is used to make all necessary MATLAB library and include files avail-able to the build system.
#include “vtkMatlabEngineFilter.h”#include “vtkSphereSource.h”#include “vtkWarpVector.h”
int main(){
vtkSphereSource* ss = vtkSphereSource::New(); vtkMatlabEngineFilter* ef = vkMatlabEngineFilter::New(); vtkWarpVector* wv = vtkWarpVector::New();
ss->SetThetaResolution(100); ss->SetPhiResolution(100);
ef->SetInputConnection(ss->GetOutputPort());
ef->PutArray(“Normals”, “N”);
ef->SetMatlabScript( “rv = randi([-1,1],size(N,1),1);\ N(:,1) = N(:,1).*rv;\ N(:,2) = N(:,2).*rv;\ N(:,3) = N(:,3).*rv;”);
ef->GetArray(“N”, “N”);
wv->SetInput(ef->GetOutput());}
GNU R INTEGRATION WITH VTKGNU R has several options for interfacing to external pro-grams. The first interface is the R API, which exposes a C callable API for fundamental mathematical and statistical operations such as integration, probability distributions, and numerical derivatives. The second interface is the .Call interface for calling C/C++ code from GNU R. This interface is similar to the MATLAB MEX interface described previously. GNU R also permits an instance of the R script interpreter engine to be embedded in a C/C++ program, allowing the R compute engine to be driven by another program in a manner similar to the MATLAB Engine. The basic data type defined by R for interfacing with C/C++ program code is the SEXP (S expression). SEXPs are used to represent vectors, matrices, lists, and frames.
The class structure for the GNU R integration with VTK is shown in Figure 4. The design is identical to the MATLAB integration shown in Figure 1, primarily due to the similarity in the external interface definitions of MATLAB and GNU R.
The class vtkRAdapter defines static methods for converting vtkDataArray, vtkArray, and vtkTable data structures into equivalent R SEXP data structures. This class can be used to write C/C++ functions using the GNU R .Call external inter-face to make VTK code accessible from GNU R.
The vtkRAdapter class is a non-VTK pipeline class. The vtkRInterface is also a non-VTK pipeline class that manages a singleton instance of an embedded R interpreter, and creates a vtkRAdapter class for data conversion between GNU R and VTK. The R API of callable C functions can also be accessed through an instance of the vtkRInterface class.
The vtkRCalculatorFilter class is a VTK-pipeline object that operates like the vtkMatlabEngineFilter class. It allows filter input array data to be passed to GNU R for computations, and places the resulting array on the filter output. The vtkRCal-culatorFilter can also be accessed through the Paraview GUI when loaded as a ParaView plugin.
Figure 2: VTK rendering of the SINC function.
Figure 3: VTK rendering of the bumpy sphere.
The program listing excerpt shown below is from the bumpmap example implementation. The program creates a sphere using vtkSphereSource, and passes it as input to an instance of a vtkMatlabEngineFilter. The vtkMatlabEngine-Filter passes the Normals data array from the sphere input to MATLAB via the PutArray() method. The Normals data array is copied to the MATLAB Engine and appears in the MATLAB Engine as the variable N. The SetMatlabScript method defines a MATLAB m file script that randomly reflects the direction of each normal vector in the array variable N. The GetArray() method places the result array N on the filter output. The remainder of the program (not shown) uses VTK to display the sphere after the application of vtkWarpVector filter (warped by the new vector data in the array N) to give the sphere a “bumpy” appearance, as shown in Figure 3.

5
The GNU R integration example shown below uses an instance of the embedded R interpreter to run a k-means clustering algorithm on a set of 3D points, and each point is assigned to one of three possible clusters.
INCLUDE(${R_USE_FILE})ADD_EXECUTABLE(kmeans kmeans.cxx)
TARGET_LINK_LIBRARIES(kmeans vtksnlRintegration)
The CMake file used to build the GNU R example (called kmeans) is shown above. The INCLUDE(${R_USE_FILE}) CMake statement makes the necessary libraries and include files for compiling GNU R related code available.
A section of the kmeans program implementation is shown below. The program creates three clusters of points (each cluster has 50 normally distributed random 3D data points) using vtkRrandomTableSource, which is a data source that uses the R C callable API to create vtkTable data with particu-lar statistical distributions (Normal, Chi-Square, Exponential, etc). The three clusters of normally distributed points (cluster centers are located at 1.0 along the X, Y, Z axes) are then gath-ered into one large table and passed as input to an instance of the vtkRCalculatorFilter. The input table is passed to GNU R via the PutTable() method, and a variable is created inside GNU R called x which contains the table data. The SetRscript() method specifies an R command script that runs a k-means algorithm on the input data points, and classifies each point to one of three possible clusters. The resulting classification data is added as a column to the table data inside GNU R via the cbind() function. The table is then assigned to the variable m. The result table m is passed back to VTK with the GetTable() method. The set of 3D points are given classifica-tion colors by the k-means algorithm, the rendered result is shown in Figure 5 (display related code omitted for brevity).
#include “vtkRCalculatorFilter.h”#include “vtkRrandomTableSource.h”#include “vtkMergeTables.h”#include “vtkTable.h”
int main(){
vtkRCalculatorFilter* rcf = vtkRCalculatorFilter::New(); vtkRrandomTableSource* rts1= vtkRrandomTableSource::New(); vtkRrandomTableSource* rts2= vtkRrandomTableSource::New(); vtkRrandomTableSource* rts3= vtkRrandomTableSource::New(); vtkTableToPolyData* tpd = vtkTableToPolyData::New();
vtkMergeTables* mt1 = vtkMergeTables::New(); vtkMergeTables* mt2 = vtkMergeTables::New();
rts1->SetNumberOfRows(50); rts1->SetStatisticalDis(NORMAL,1.0,0.5,0.0,”X”,0); rts1->SetStatisticalDis(NORMAL,0.0,0.5,0.0,”Y”,1); rts1->SetStatisticalDis(NORMAL,0.0,0.5,0.0,”Z”,2);
rts2->SetNumberOfRows(50); rts2->SetStatisticalDis(NORMAL,0.0,0.5,0.0,”X”,0); rts2->SetStatisticalDis(NORMAL,1.0,0.5,0.0,”Y”,1); rts2->SetStatisticalDis(NORMAL,0.0,0.5,0.0,”Z”,2);
rts3->SetNumberOfRows(50); rts3->SetStatisticalDis(NORMAL,0.0,0.5,0.0,”X”,0); rts3->SetStatisticalDis(NORMAL,0.0,0.5,0.0,”Y”,1); rts3->SetStatisticalDis(NORMAL,1.0,0.5,0.0,”Z”,2);
mt1->SetInput(0,rts1->GetOutput()); mt1->SetInput(1,rts2->GetOutput()); mt2->SetInput(0,mt1->GetOutput()); mt2->SetInput(1,rts3->GetOutput());
rcf->SetInput(mt2->GetOutput()); rcf->PutTable(“x”);
rcf->SetRscript(“m = do.call(cbind,x)\n \ cl <- kmeans(m,3)\n \ m = cbind(m,cl$cluster)\n \ colnames(m)[4] = \”cluster\”\n”);
rcf->GetTable(“m”);
tpd->SetInput(rcf->GetOutput()); tpd->SetXColumn(“X”); tpd->SetYColumn(“Y”); tpd->SetZColumn(“Z”);
}
Figure 4: Class diagram for Gnu R integration with VTK.
Figure 5: VTK rendering of k-means classified input points.
GNU R INTEGRATION EXAMPLEAn installation of the GNU R software (downloaded and compiled from source code) must be present in order to compile and use the GNU R integration code in VTK. The GNU R integration code can be activated by turning on the VTK CMake build option. The CMake system will then try to locate the root directory of your GNU R installation.
CONCLUSION AND FUTURE WORKThe goal of this integration work is to provide VTK users and developers with a convenient way to leverage the power of MATLAB and GNU R. Developers can quickly create new filters and sources whose computations primarily use script

6
PyTHON TRACE
code developed in these external software environments. ParaView users can access program scripts in MATLAB and GNU R through the ParaView GUI, thus reducing the need to create equivalent code inside of VTK.
Integration between distinct software environments requires trade-offs in terms of memory size and compute performance. Future work in creating reliable shallow copy data reuse between VTK, MATLAB, and GNU R will help to mitigate some performance issues. There is also interest in creating VTK wrappers (similar to Python) for the GNU R and MATLAB script languages. This would allow VTK to be scripted from the command line of MATLAB or GNU R, and would facilitate the creation of a programmable VTK filter that uses script programs from either MATLAB or GNU R.
The source code for this integration work currently resides in the Sandia National Laboratories private VTK repository. The author anticipates the source code will be made publicly available in VTK shortly after this article is published.
ACKNOWLEDGMENTSThis work was done in part at Sandia National Laboratories. Sandia is a multi-program laboratory operated by Sandia Corporation, a Lockheed Martin Company, for the United States Department of Energy’s National Nuclear Security Administration under Contract DE-AC04-94AL85000.
Thomas Otahal is a software developer working under contract at Sandia National Laboratories. He works with the Sandia Data Analysis and Visualization department on a variety of projects using the Titan/VTK Informatics toolkit and ParaView.
ParaView is a scientific visualization application offering a variety of data processing and rendering algorithms. The cli-ent-server architecture enables data-parallel processing in a distributed memory environment. Users don’t need a cluster to run ParaView. Perhaps the most common use of ParaView is a built-in mode where the client and server co-exist in a single process running on a desktop. Whether operating on a supercomputer or on a MacBook, the ParaView power-user can always take advantage of the Python scripting language to streamline his or her work. The ParaView Python inter-face allows efficient control over most tasks that can be performed through the GUI including: opening data files, constructing visualization pipelines, adjusting the camera, and exporting post-processed data or animations.
An exciting new extension to the ParaView Python interface is Python trace. This feature will be available in the 3.6.2 release. The goal of trace is to generate human readable, and not overly verbose, Python scripts that mimic a user’s actions in the GUI. The scripts can be used for a variety of purposes, but there was one particular use case considered for driving development of Trace—rapid prototyping of scripts for batch or in-situ/co-processing and visualization.
The idea is that a user could open a small representative piece of their data in the ParaView GUI, interactively build
a visualization pipeline, and then save a trace script to be used in batch mode on full-size data. Alternatively, the script could be called from a co-processing module enabling data to be post-processed and visualized as it is produced by simulation codes without the need for writing the data to a disk to be collected and processed elsewhere. The script should be more or less ready to go, although it may have to be modified slightly to account for different pathnames or to replace a reader with a bridge to a co-processing library.
Now we’ll take a brief look at how trace is implemented in order to understand what we can expect from trace, then we’ll get started with a tutorial. First a quick word about the ParaView architecture and its Python interface.
In ParaView, the data and C++ objects that filter, process, and render the data reside on the server. There is a proxy object on the client for each object on the server. Proxies have states which are represented by properties. Changing a proxy property on the client means the property value is streamed to the server where an appropriate C++ function is called to set the value on the proxy’s server-side object. So how does this work in the Python interface? Take the follow-ing Python code:
s = Sphere() s.Center = [1, 0, 0]
The call to Sphere() creates a client-side proxy object which, in turn, creates a server-side object—vtkSphereSource. Setting the proxy property Center to the list [1, 0, 0] streams the values to the server where vtkSphereSource::SetCenter(1, 0, 0) is called. So what does this mean for trace? It means you can mimic most actions the user performs when clicking around in the GUI by creating proxies and setting their prop-erty values. Unfortunately, not all actions in the GUI can be represented with such proxy manipulations, so trace won’t work for all cases.
LET’S WALK THROUGH AN EXAMPLEYou can try this at home if you download the 3.6.2 release of Paraview. Fire up the ParaView client and then go to the Tools menu and select Python Shell. The Python dialog will open, showing an interactive interpreter on the left and some tools on the right in tabbed panels. Switch to the tab labeled Trace and click the button Start Trace. For this example we will use generated data, but you could also use a reader to load a dataset from disk. Go to the Sources menu, select Octree Fractal, and then click Apply in the Properties tab of the Object Inspector panel. Now click the Show Trace button in the Python dialog.
The Trace tab in the Python Dialog
7
Already we have accumulated quite a bit of Python code with only two clicks of the mouse. Let’s look at what we have so far. You’ll see Python code that: creates the octree fractal source; creates a color lookup table for the source’s point data; creates a display representation for the fractal source; sets the ColorArrayName property of the display to ‘FractalIterations’; assigns the lookup table using the LookupTable property; and finally sets the camera position and orientation properties to render the current scene.
Now let’s see how trace reacts to a simple property change. Go to the Properties tab of the Object Inspector and change the Dimension property from 2 to 3, then click Apply. Click Show Trace again in the Python dialog.
You’ll see the same output that was printed before and then some new code for our latest changes. The Dimension property has been modified and the lookup table has also been modified to account for the new scalar range of the FractalIterations array.
Now we will build a simple pipeline. Go to the Filters menu and choose Contour, click Apply. In the Pipeline Browser change the selected source back to the fractal source and then apply a Clip filter from the Filters menu. Adjust the clipping plane if you want, and then click Apply. Now go to the View menu and choose Show Color Legend. Adjust the camera angle to something a little more interesting and we’re done! Click Stop Trace.
Now there is just one final thing to do before we’re ready to send our script to a 1024 node cluster. Click Edit Trace and enter this line at the end of the script:
WriteImage(‘output.png’)
Happy tracing! For more information on Python trace, please visit the ParaView Wiki and search for “ParaView/Python Scripting”, “IEEE Vis09 ParaView Tutorial”, “Python GUI Tools”, or “ParaView#Python Scripting”.
ACKNOWLEDGMENTS This work was funded in part by EDF (www.edf.fr).
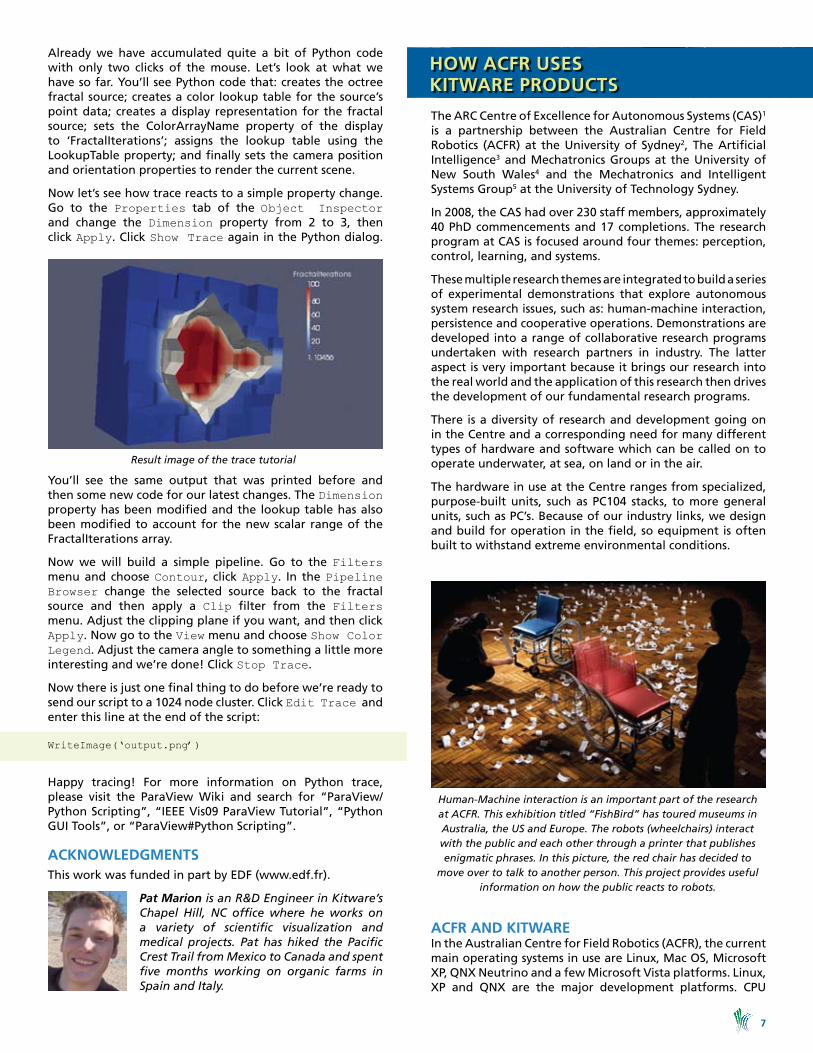
Pat Marion is an R&D Engineer in Kitware’s Chapel Hill, NC office where he works on a variety of scientific visualization and medical projects. Pat has hiked the Pacific Crest Trail from Mexico to Canada and spent five months working on organic farms in Spain and Italy.
The ARC Centre of Excellence for Autonomous Systems (CAS)1 is a partnership between the Australian Centre for Field Robotics (ACFR) at the University of Sydney2, The Artificial Intelligence3 and Mechatronics Groups at the University of New South Wales4 and the Mechatronics and Intelligent Systems Group5 at the University of Technology Sydney.
In 2008, the CAS had over 230 staff members, approximately 40 PhD commencements and 17 completions. The research program at CAS is focused around four themes: perception, control, learning, and systems.
These multiple research themes are integrated to build a series of experimental demonstrations that explore autonomous system research issues, such as: human-machine interaction, persistence and cooperative operations. Demonstrations are developed into a range of collaborative research programs undertaken with research partners in industry. The latter aspect is very important because it brings our research into the real world and the application of this research then drives the development of our fundamental research programs.
There is a diversity of research and development going on in the Centre and a corresponding need for many different types of hardware and software which can be called on to operate underwater, at sea, on land or in the air.
The hardware in use at the Centre ranges from specialized, purpose-built units, such as PC104 stacks, to more general units, such as PC’s. Because of our industry links, we design and build for operation in the field, so equipment is often built to withstand extreme environmental conditions.
ACFR AND KITWAREIn the Australian Centre for Field Robotics (ACFR), the current main operating systems in use are Linux, Mac OS, Microsoft XP, QNX Neutrino and a few Microsoft Vista platforms. Linux, XP and QNX are the major development platforms. CPU
HOW ACFR USES KITWARE PRODUCTS
Result image of the trace tutorial
Human-Machine interaction is an important part of the research at ACFR. This exhibition titled “FishBird” has toured museums in Australia, the US and Europe. The robots (wheelchairs) interact with the public and each other through a printer that publishes enigmatic phrases. In this picture, the red chair has decided to
move over to talk to another person. This project provides useful information on how the public reacts to robots.

8
speeds range from 200MHz upwards. RAM memory require-ments range from the very small to several GB with disk sizes ranging from as low as 20GB to some hundreds of TB.
Currently, most software is developed in C++ and C utiliz-ing gcc, Visual Studio, Borland C++ and Eclipse. With respect to GUI’s, Qt and WxWidgets are the main ones in use with some development done using OpenGL directly. Code reus-ability and modular development is a big factor with several common in-house libraries in use.
A wide range of hardware, multiple operating systems and compilers are now in use. Interoperability of platforms and software is the driving concern. We do not restrict develop-ment to one platform, language or compiler. This contributes to the robustness and strength of our solutions.
ACFR allows its developers to build and implement systems using tools they are most familiar with or the tools which are best-suited for a given task. Our systems are built for utilization on many different platforms and they are tested on many different platforms. Whenever possible we reuse code. And we pride ourselves on our ability to foster innova-tion and collaboration.
most shared development work at the time was that people had different setups on their machines. You could not just copy the Visual Studio build from machine to machine and expect it to work. We quickly realized that CMake removed this limitation and its usage became more widespread. The big attraction of CMake was the fact it generated the IDE!
Simultaneously, the need for cross-platform development was beginning to arise but it was not seen as a major requirement. Development was still mainly in a Windows environment, with QNX applications being largely distinct.
However, with the appearance of more and more Linux platforms and applications there was a need for good cross-platform development. VTK provided a good model in that it was using CMake, and it was built on many platforms. We began to develop in-house libraries that utilized CMake and went through a fairly steep learning curve in relation to the challenges of cross-platform development.
One open source project that was converted to use CMake by the project maintainers in ACFR was Orca6, which is used to build component-based robotic systems. It took signifi-cant effort to move it from a Linux-based automake system to a cross-platform system.
We also realized that our libraries needed testing on the many platforms we use. So we dedicated test platforms for QNX, Windows, Linux and Mac OS both 64-bit and 32-bit. Once again the Kitware model of “write on one platform, compile on many platforms” was used.
At the same time, we migrated from using Visual Source Safe as a code repository to CVS. This was driven primarily by the need to work in a cross-platform environment. Eventually we replaced CVS with Subversion.
One consequence of having libraries used by many people on different platforms was the need to have some automated way of running compiles on many platforms once code was checked in. This is where Dart played a role as a dashboard. While it generally worked, it was difficult to configure and we had a lot of unexplained failures which seemed to be related to the Java virtual machine. When Kitware released a beta version of CDash, we moved our applications to it and everything has worked well since.
So, within ACFR, we now use Subversion for our code reposi-tory, CDash for our dashboards, Mantis for bug reporting, CMake, VTK, ParaView, and Boost.
At this point, I must emphasize that our interactions with Kitware have been a two-way process. In the case of VTK, I provided a set of non-parametric surface generators that Will Schroeder and I incorporated into VTK1. This was an excellent learning exercise and it gave me a good apprecia-tion for problems related to cross-platform development and code standards. We also worked with Bill Hoffman to port CMake to QNX. We provide nightly and experimental testing on this platform for Kitware. The latter port was critically important, as it simplified our cross-platform development.
With respect to development Kitware’s CMake and CDash, along with other open source products like Subversion and Mantis, are critical. They have enabled us to manage cross-platform development using a variety of compilers and platforms. Subversion also plays a key role. Since we are a research and teaching organization, we have students who
While it may be initially thought that the management of such a system is like herding cats, this is not so. There are many good tools around to manage this type of environ-ment. In particular, the open source software developed by Kitware has been a major contributor to our success.
Our relationship with Kitware began in 2000 with the use of VTK. We were looking for off-the-shelf graphics programs and VTK perfectly fitted this requirement. Its initial use was in surface building for laser scans. With time, other people began to use it for their applications. I spent a consider-able amount of time developing a visualizer using VTK for general use in ACFR. This was called Topological Zoo. At that time ParaView was in a very early stage of development, so it was not considered.
CMake had made its appearance in VTK so some of us began to use it in our development process. One impediment to
The interior of a stope in a mine. The stope is about 80m deep and 20m across. This was visualized using radar and the surface constructed using TopologicalZoo. The arrow points to infalling
material from the roof of the stope. In this case, because of multipathing and other spurious returns from the radar, surface
reconstruction is a fine art, lots of filtering needs to happen.

9
The Orca framework was used to develop the software components running on each robot’s host computer. Orca uses ZeroC’s Ice for inter-component communication - both within and between the hosts. These robots communicate with each other to negotiate plans when they are close by,
and they also communicate to a base station.
work on projects and then graduate and leave. All of their project code is stored in the Subversion repository so future students can work on it and enhance it. Subversion is sup-porting code reuse and enhancement along with its primary role of being a repository. Mantis is a good communication tool among the developers and users.
These tools provide us with the ability to manage a devel-opment environment that is cross-platform, supports code reuse, and is responsive to change.
Another aspect that is often overlooked is user induction. When our graduate students begin their PhD or Master’s courses we run short courses to familiarize them with: coding standards, including testing; CMake; Boost, and the Standard Template Library; template usage and exception handling; and the available libraries in ACFR.
A further aspect of these tools is that we have world-wide collaborative activities and these tools have been instrumen-tal in their success.
In my particular area, we develop systems for semi-auton-omous mine operations that are deployed in Australia and Chile. These systems provide situational awareness to opera-tors of vehicles, such as mining trucks, that are very large, have limited visibility or are under adverse working condi-tions such as dust, fog and high altitude operations (e.g., at or above 4000 meters). To provide information to users, a peer-to-peer communication system operates over a mesh network using rules which can be customized. We commer-cialize this through Acumine Pty Ltd. (www.acumine.com).
This is a transcontinental project. The software is developed in the ACFR at the University of Sydney in Australia and the hardware is developed in the Universidad Nacional del Sur in Argentina. Our two research groups are separated in time, space and (sometimes) language. We circumvent these prob-lems by utilizing Skype for video or phone conversations; a Subversion repository for code; Mantis for bug reporting; and, of course, CMake is used routinely.
One particular advantage is that if a software problem is noted in Argentina we generally fix it while they are sleep-ing. So by the time they wake up the next morning they have a fix. Of course we utilize the same procedure if there are problems with the hardware. Australia and the US are also well placed for this type of work (early morning in Australia is afternoon in the US - of the previous day).
THE FUTUREAs we look forward, we plan to further utilize VTK and ParaView and hope to work with ITK as well. ParaView has already become the rapid visualization of choice for many researchers. VTK and the use of TCL are also seen as useful tools for rapid visualization. ITK has a lot of potential for image analysis, particularly in the area of perception; however it is not used at present. To increase awareness of VTK and ITK we’re considering adding short courses on each to the existing short courses we provide graduate students.
Our testing of libraries also needs to become more through, CMake and CDash are a big help here. We achieve around 60% coverage for our libraries on all platforms tested.
Overall, the open source tools that are developed and pro-vided by Kitware and Kitware’s Quality Software Process
have provided us with a model that allows us to be innova-tive and flexible in our development process. This innovation and flexibility has significantly contributed to our success.
ACKNOWLEDGEMENTSThis work has been supported by the CRC Mining Australia, the Australian Centre for Field Robotics and the ARC Centre of Excellence Program, funded by the Australian Research Council (ARC) and the New South Wales State Government.
FURTHER READINGParametric Surfaces vtk.org/VTK/help/documentation.html
REFERENCES1. ARC Centre of Excellence for Autonomous Systems,
www.cas.edu.au
2. Australian Centre for Field Robotics at the University of Sydney, www.acfr.usyd.edu.au
3. The Artificial Intelligence Group at the University of New South Wales, http://ai.cse.unsw.edu.au/index.html
4. The Mechatronics Group at the University of New South Wales, www.mech.unsw.edu.au/content/plans/mecha-tronic/Mechatronics_Home.cfm?ss=12
5. Mechatronics and Intelligent Systems Group at the University of Technology Sydney, www.eng.uts.edu.au/Research/areas_EMMS.htm
6 . Orca, http://orca-robotics.sourceforge.net/orca/index.html
Andrew Maclean is a Technical Officer who has been working at the Australian Centre for Field Robotics, University of Sydney. His main interests include: visualization of data-sets, database design and the development of good, efficient and well tested code.

In ParaView, representations are the entities that control how data from a source is shown in a view. For a 3D view, the representation is typically comprised of a geometry filter that extracts the polygonal surface from the dataset, a mapper that maps the geometry to OpenGL calls, and an actor that controls other appearance parameters of the dataset in the rendered scene.
Support for adding representations from plugins for new view types from was introduced in ParaView 3.4. Since then there has been an increase in the number of requests for support to be added to representations for the regular 3D view from the user community. ParaView’s 3D view is the most commonly used view for showing polygonal or volu-metric data. This support is useful if you want to incorporate a new mapper into ParaView that uses hardware shaders, for example.
By default, ParaView provides representation-types for showing the dataset as surface, wireframe, points and pos-sibly slice and volume (depending on the data type). This article explains how to add representations using plugins that extend this set of available representation-types that can be shown in ParaView’s 3D View. Note that this is a very recent addition to ParaView and is not yet supported by the 3.6 releases. If you want to try the examples discussed in this article, you will have to use the CVS repository.
Representation plugins are meant for advanced developers since representations and views can get pretty complex, pretty quickly. This article assumes that the reader is familiar with the ParaView Server Manager and the plugin framework.
STANDARD REPRESENTATIONS IN 3D VIEWBefore we start looking at how to write such a plugin, we need to gain some understanding of the 3D view and its rep-resentations. The 3D view uses 3 basic representation proxies for rendering all types of data:• (representations, UnstructuredGridRepresentation) – for
vtkUnstructuredGrid or a composite dataset consisting of vtkUnstructuredGrid.
• (representations, UniformGridRepresentation) – for vtkImageData or a composite dataset consisting of vtkIm-ageData
• (representations, GeometryRepresentation) – for all other data types.
Each of these representation proxies are basically composite-representation proxies that use other repre-sentation proxies to do the actual rendering. For example, GeometryRepresentation uses SurfaceRepresentation for rendering the data as wireframe, points, surface and surface-with-edges and OutlineRepresentation for rendering an outline for the data. Subsequently, the 3 composite-represen-tation proxies provide a property named “Representation” that allows the user to pick a representation type for viewing the data. The composite-representation proxy has logic to enable one of its internal representations based on the type chosen by the user.
These 3-composite representation types are fixed and cannot be changed by plugins. What plugins can do is add more
internal representations to any of these 3 composite repre-sentations to support new representation types that the user can choose from the representation type combo box on the display tab or in the toolbar.
10
REPRESENTATION PLUGINS IN PARAVIEW
Next, we will discuss a couple of examples that illustrate how such plugins can be coded. The source code for these exam-ples is available under ParaViewSource/Examples/Plugins in the ParaView CVS repository.
REPRESENTATIONS TO ADD A NEW MAPPERFirst let’s consider a simple yet a common example where we want to add a new mapper to ParaView. The source code for this example is available under ParaViewSource/Examples/Plugins/Representation.
Let’s say the mapper is called vtkMySpecialPolyDataMapper which is simply a subclass of vtkPainterPolyDataMapper. In practice, vtkMySpecialPolyDataMapper can internally use different painters to do perform special rendering tasks.
To integrate this mapper into ParaView, first we need to create a vtkSMRepresentationProxy subclass that uses this mapper. In this example, since the mapper is a simple replace-ment for the standard vtkPainterPolyDataMapper, we can define our representation proxy as a specialization of the “SurfaceRepresentation” by merely overriding the proxies it uses for creating the mappers as follows:
<ServerManaerConfiguration> <ProxyGroup name=”mappers”> <SourceProxy name=”MySpecialPolyDataMapper” class=”vtkMySpecialPolyDataMapper” base_proxygroup=”mappers” base_proxyname=”PolyDataMapper”> <!-- And any extra properties for this mapper --> </SourceProxy> </ProxyGroup>
<ProxyGroup name=”representations”> <SurfaceRepresentationProxy name=”MySpecialRepresentation” base_proxygroup=”representations” base_proxyname=”SurfaceRepresentation”> <Documentation> This is the new representation type we are adding. This is identical to the SurfaceRepresentation except that we are overriding the mapper with our mapper. </Documentation> <InputProperty name=”Input” command=”NotUsed”> <InputArrayDomain name=”input_array_any” attribute_type=”any”>
Figure 1: Representation type combo box allows users to choose a sub-representation to use.

<SubProxy> <Proxy name=”MySpecialRepresentation” proxygroup=”representations” proxyname=”MySpecialRepresentation”> </Proxy> <ShareProperties subproxy=”SurfaceRepresentation”> <Exception name=”Input” /> <Exception name=”Visibility” /> <Exception name=”Representation” /> </ShareProperties> </SubProxy> </Extension> </ProxyGroup></ServerManagerConfiguration>
The CMakeLists.txt file is not much different from what it would be like for adding a simple filter or a reader.
ADD_PARAVIEW_PLUGIN(Representation “1.0” SERVER_MANAGER_XML Representation.xml SERVER_MANAGER_SOURCES vtkMySpecialPolyDataMapper.cxx)
Once this plugin is successfully loaded into ParaView, “Special Mapper” will show up as a representation type that the user can choose. Note that a representation plugin does not affect any representations already created. Hence, it’s a good idea to load the representation plugins first, before creating any sources or filters.
HARDWARE SHADERS IN A REPRESENTATIONOne common use-case for adding new representations is to employ specialized hardware shaders written using shading languages such as GLSL or Cg to perform specialized render-ing. Such special rendering algorithms can be encapsulated in a special mapper or a vtkPainter subclass. If the special ren-dering algorithm is encapsulated in a vtkPainter subclass you will need to make a special mapper that uses the painter.
In this example, we have a new vtkPainter subclasses vtkVisibleLinePainter that uses shaders to prune hidden lines from a wireframe rendering. The source for this example is available under ParaViewSource/Example/Plugins/HiddenLinesRemoval.
Following is the CMakeLists.txt
# Compile-in all GLSL files are strings.# const char* with the names same as that of the# file then become available for use.encode_files_as_strings(ENCODED_STRING_FILES vtkPVLightingHelper_s.glsl vtkPVColorMaterialHelper_vs.glsl vtkVisibleLinesPainter_fs.glsl vtkVisibleLinesPainter_vs.glsl )
add_paraview_plugin( HiddenLinesRemoval “1.0” SERVER_MANAGER_XML HiddenLinesRemovalPlugin.xml
SERVER_MANAGER_SOURCES vtkVisibleLinesPolyDataMapper.cxx
SOURCES vtkPVColorMaterialHelper.cxx vtkPVLightingHelper.cxx vtkVisibleLinesPainter.cxx ${ENCODED_STRING_FILES})
</InputArrayDomain> </InputProperty>
<SubProxy> <Proxy name=”Mapper” proxygroup=”mappers” proxyname=”MySpecialPolyDataMapper” override=”1” /> <ExposedProperties> <Property name=”LookupTable” /> …. </ExposedProperties> </SubProxy>
<SubProxy> <Proxy name=”LODMapper” proxygroup=”mappers” proxyname=”MySpecialPolyDataMapper” override=”1”/>
<ShareProperties subproxy=”Mapper” > <Exception name=”Input” /> </ShareProperties> </SubProxy>
<!-- End of SurfaceRepresentation --> </SurfaceRepresentationProxy></ServerManaerConfiguration>
Note the use of the “override” attribute since the “SurfaceRepresentation” proxy already defines a Mapper as well as a LODMapper subproxy.
Next we need to register this new type with the any (or all) of the 3 standard composite representations so that it will become available for user selection in the representation type combo box.
To decide which of the 3 composite representations we want to add our representation to, we must first consider the input data types our representation supports. If it can support any type of dataset, then we can add our represen-tation to all the 3 representations (as is the case with this example). However, if we are adding a representation for volume rendering of vtkUnstructuredGrid then we will only add it to the UnstructuredGridRepresentation. This is done by using the Extension xml tag. It simply means that we are extending the original XML for the proxy definition with the specified additions.
To make this representation available as a type to the user, we use the <RepresentationType /> element, with “text” attribute used as the text shown for the type in the combo box, “subproxy” attribute used to identify the name of the representation subproxy to be activated when the user chooses the specified type. Optionally, one can also specify the “subtype” attribute which, if present, is the value set on a property named “Representation” for the subproxy when the type is chosen. This allows for the subproxy to provide more than one representation type.
<ServerManagerConfiguration> <Extension name=”GeometryRepresentation”> <Documentation> Extends standard GeometryRepresentation by adding MySpecialRepresentation as a new type of representation. </Documentation>
<!-- this adds to what is already defined in GeometryRepresentation --> <RepresentationType subproxy=”MySpecialRepresentation” text=”Special Mapper” subtype=”1” />
11

12
PARAVIEW USED IN A MINING RESEARCH ENVIRONMENT
Within the Australian Centre for Field Robotics (http://www.acfr.usyd.edu.au/) many Kitware Open Source toolkits are used. VTK is often used for visualization. While open source tools have their advantages, there are times when we want to manipulate and visualize data received from various sources without going through the process of developing software to do so. One product that has become increasingly useful to us is ParaView.
An oft used technique is the conversion of data from various sensors into particles with associated scalar properties which can be visualized and manipulated. For example, laser and radar data in their raw form consist of range, bearing and often other data such as intensity. The data is manipulated though the use of special purpose software to produce Cartesian coordinates along with the associated properties of each particle. Associated properties can be scalars, such as color or intensity. Once the data is manipulated, it is a simple matter to convert the particle data to something that ParaView can use. Within ParaView, the user can build sur-faces and or apply other filters as desired. The final results can then be saved as a new data file.
In ParaView it is possible to produce animations, for example an animation of the progress of surface mining. Examples of ParaView and VTK use can be found in (1),(2).
Since we often deal with particle data, it is necessary to provide ParaView with a format it can easily use. Another consideration is that we need to utilize the results from ParaView e.g., clipped or smoothed data. Often outliers or noise must be eliminated. To do this we need to take the
ParaView data and convert it back to particles that are used in other applications.
In order to do this, a program was developed that reads the point data and creates a file of type VTP that can be used in ParaView. This program, called ReadXYZ, uses VTK to provide a view of the data in its GUI. It also reads files of type VTP and converts the points into the file to a text of x,y,z values and a scalar. There is minimal information in the GUI as it is essentially a filter. Its interface looks like this:
It has a relatively simple and clean interface, with a help screen and an information screen giving the dimensions of the image and the number of points.
One example of the utility of software like this is a reader that reads the dxf formatted mapping files from a mine. From this we can create a three dimensional map of the mine that can then be rendered in ParaView. Of course, a big advantage here is that you can selectively switch off selected parts of the pipeline to emphasise features like roads or buildings. In this illustration the lines comprising the roads and buildings have been thickened.
Once this is done we can superimpose tracks of vehicles and display properties such as GPS satellite visibility. There are many possibilities here.
As an example of quite sophisticated work using ParaView, one of us (Shrihari) (3),( 4) addressed the issue of large scale terrain modelling for a mobile robot. In this process, the two products, ReadXYZ and ParaView, played an important role.
The Rio Tinto Centre for Mining Automation (RTCMA) uses ParaView as the default data visualization and manipulation
vtkVisibleLinesPolyDataMapper is simply a vtkPainterPoly-DataMapper subclass, like the previous example, which inserts the vtkVisibleLinesPainter at the appropriate location in the painter chain. The server manager configuration xml doesn’t look much different from the “Using a new Mapper” example, except that we replace the mapper with vtkVisible-LinesPolyDataMapper.
CONCLUSIONSWe recently added support for adding representations for the standard 3D view in ParaView using plugins. Representation plugins make it possible to extend ParaView by adding new mappers that use hardware shaders using GLSL or other shading languages. Although representation plugins are not for casual ParaView developers, given their complexity, it will allow power developers to try new rendering techniques in ParaView. This functionality is available in ParaView CVS and is still evolving. It will be included in the next major release of ParaView.
ACKNOWLEDGMENTS This work was funded by EDF (www.edf.fr).
Utkarsh Ayachit is a Technical Leader in Kitware’s Clifton Park, NY office. He is one of the leading developers on ParaView. Currently, Utkarsh is leading the effort to add collaboration support to ParaView.

13
engine for some of their projects, in particular the large scale terrain modelling project. Data sources for this project typically include plain text files (consisting of lines of x,y,z, data) or VRML/WRL files containing coordinates and color data. ReadXYZ is used to handle the text files but ParaView is used to directly handle the VRML files.
We have found that the interface of Paraview is superb in comparison to other software. Most of the buttons, options, and menus are tailor-made for rapid visualization and con-tribute to rapid development in any application. The tools that ParaView provides (i.e. the filters) are extremely useful as well.
The figures below show some of the visualization and manipulation work for a large-scale terrain modelling project which employed ParaView. A visualization tool for such proj-ects will need to provide at least the following capabilities:
• The software needs to load and handle large datasets (upwards of 1-2 million points per dataset).
• Tools for filtering out noise and clipping out chunks of the data for specific purposes.
• Visualization tools including coloring the points in differ-ent ways (by depth, distance from one end, etc.).
• Triangulation methods to generate surface maps from point clouds.
• Methods to overlay datasets / surfaces to enable a com-parison.
• Convenient methods/interfaces for taking snapshots of the data in various views.
ParaView provided a single, complete and convenient visu-alization platform for doing all of these tasks. Hence it has been adopted as the data visualization and manipulation standard for this project. With each new attempt at using ParaView in our project, we discover new exciting features that enhance our work. Some examples of the terrain visual-ized using ParaView are found in the following illustrations:
modelling of a mine pit, see (3),(4) for more details. This map was generated from a dense elevation map of about 1 million points.
The second image above shows the result of modelling a mine pit about 1.8 x 0.5 sq km in area. The significant aspects of this dataset are the characteristic features on the sides and the resulting complexity. Thus, ParaView provided a quick and convenient means of visualizing complex terrain data and a means for manipulating such datasets. In addition, the tools provided by ParaView are very useful for visually vali-dating our experimental results – for instance, by a simple triangulation of point data one can easily verify, at least on a preliminary basis, if the data captures certain features.
We acknowledge that there have been major improve-ments in ParaView particularly in respect to the GUI and the inclusion of Python as a programming language within it. However one of the key uses of ParaView its ability to quickly visualize and manipulate data without the need to write filters, etc. Enhancements in this area will always be appreciated.
ACKNOWLEDGEMENTSThis work has been supported by the Rio Tinto Centre for Mine Automation and the ARC Centre of Excellence Program, funded by the Australian Research Council (ARC) and the New South Wales State Government.
FURTHER READING 1. Widzyk-Capehart E., Brooker G.M., Scheding S.J.,
Maclean A.J., Hennessy R.C., Lobsey C.R., Sivadorai M., Millimetre Wave Radar Visualisation System: Practical Approach to Transforming Mining Operations Mechatronics and Machine Vision in Practice, Springer-Verlag Berlin Heidelberg, 2008, p. 139-165, ISSN. 978-3-540-74026-1.
2. Brooker G.M., Hennessy R.C., Bishop M.V., Lobsey C.R. and Maclean, A.J. Millimetre Wave 3D Imaging for Industrial Applications Proceedings of the 2nd International Conference on Wireless Broadband and Ultra Wideband Communications 2007. Presented at the 2nd International Conference on Wireless Broadband and Ultra Wideband Communications, Sydney, Australia, August 27 - 30, 2007.
3. Vasudevan. S. Ramos, F. Nettleton, E. Hugh Durrant-Whyte, H., & Blair, A. Gaussian. Process Modeling of Large Scale Terrain, ICRA 2009.
4. Shrihari Vasudevan, Fabio Ramos, Eric Nettleton and Hugh Durrant-Whyte, Gaussian Process Modeling of Large Scale Terrain. To appear in Journal of Field Robotics.
Andrew Maclean is a Technical Officer who has been working at the Australian Centre for Field Robotics, University of Sydney. His main interests include: visualization of data-sets, database design and the development of good, efficient and well tested code.
Shrihari Vasudevan is a Research Fellow at the Australian Centre for Field Robotics, University of Sydney. His research interests span Robotics, Sensor fusion, Machine Learning, Computer Vision and related fields. His current work is with the Rio Tinto Centre for Mine Automation and addresses issues pertaining to modelling large scale and complex terrain.
Each of these datasets spans several kilometers squared in area and typically contains anywhere between 500K and 2 million points per dataset. We typically deal with several such datasets at any time in our project.
The first image above shows the output of a triangulation performed on the output of the research component for

14
BUILDING EXTERNAL PROjECTS WITH CMAKE 2.8The ExternalProject module in CMake 2.8 makes it easier to build projects dependent upon external software com-ponents. An “external project” is one that you can get the source code for, but does not readily build with a simple ADD_SUBDIRECTORY call in your CMakeLists.txt file. The ExternalProject_Add function makes it possible to say “down-load this project from the internet, run its configure step, build it and install it” with just a few lines of code added to your CMakeLists.txt file. The time intensive processing for each step is deferred until build time, making the CMake configuration of an ExternalProject_Add lightning fast.
The basic concept of ExternalProject is simple: given an exter-nal source of software (url to a .tar.gz file, cvs repository, svn repository, local directory), execute the sequence of com-mands necessary to build and install that software so that you can refer to it (include, link, run) from your project.
ExternalProject_Add is presently implemented in terms of a CMake custom target and several CMake custom commands. The custom target represents the external project itself, and each custom command is an “external project build step”. Some of the custom commands execute the important steps and some are just for housekeeping details. The following image illustrates custom command dependencies and the order of execution for one ExternalProject_Add call:
After each step is successfully executed, a stamp file is pro-duced indicating that the step is up-to-date with respect to its input. If an upstream step re-executes because its input changed, then all downstream steps will also re-execute. Steps that are always out of date will always re-execute when built. For example, the update step of a cvs or svn checkout is always considered out of date.
Whenever you build, the update step will execute and retrieve the latest copy of the source from the repository.
Since an external project is a CMake custom target, you can set up dependencies among multiple external projects and between your own CMake targets and the external projects. When a step in an external project re-executes, the down-stream targets that depend on that project will also rebuild.
A call to ExternalProject_Add that downloads, configures, builds and installs CMake 2.6.4 looks like this:
include(ExternalProject)ExternalProject_Add( CMake-2-6-4 CVS_REPOSITORY :pserver:anonymous:cmake@ www.cmake.org:/cvsroot/CMake CVS_MODULE CMake CVS_TAG -r CMake-2-6-4 CMAKE_ARGS -DCMAKE_INSTALL_PREFIX: PATH=<INSTALL_DIR> UPDATE_COMMAND “”)
Network connectivity is assumed if external project sources are downloaded via a URL to a remote computer or from a remote cvs or svn repository.
EXTERNALPROjECT BUILD STEPSThe first step to execute at build time is the download step. The download step could be a file download from an internet site, a checkout from a cvs or svn repository, or a reference to a pre-existing local file or directory. CMake supports local or downloaded *.tar/*.tar.gz/*.tgz files and cvs and svn repositories. For other download types, override the built-in download step with a custom DOWNLOAD_COMMAND.
The next step is either update or patch. By default, if the download step is a checkout from cvs or svn, then the update step is the appropriate cvs or svn update call. Otherwise, the update step is omitted. There is no default patch command. To patch a source tree, provide a custom PATCH_COMMAND.
After that, the configure step executes. By default, the con-figure command is used to run the same CMake command used to configure the calling project. To use a specific version of CMake, provide a CMAKE_COMMAND value. To use a configure script or some other custom configuring program, provide a custom CONFIGURE_COMMAND.
After configure, the build step executes. If CMake was used to configure the project, then ‘cmake--build’ is used to build the project. If a configure script was used, then ‘make’ is used to build the project. If a custom configure command was given, provide a custom BUILD_COMMAND, too.
The test step is omitted based on the assumption that ExternalProject_Add calls will be made to build stable snap-shots of the target software. If TEST_BEFORE_INSTALL 1 or TEST_AFTER_INSTALL 1 is specified, the test step is executed before or after the install step. CMake configured projects run CTest. Configure script projects are tested with ‘make test’. Override by providing a custom TEST_COMMAND.
The grayed out nodes are the housekeeping steps, the bold ones are the important steps that actually execute commands. An arrow between steps points to a “step that I depend on” or a “step that runs before I run.” All steps are shown in the above diagram: some steps are optional; all have reasonable default commands; each may be omitted or overridden.

15
The final step in an external project build sequence is the install step. CMake configured projects use cmake--build with the install target to execute the install step. Configure script projects use ‘make install’. Override by providing a custom INSTALL_COMMAND.
EXTERNALPROjECT_ADD ARGUMENTSRelative paths are interpreted with respect to the build directory corresponding to the source directory in which ExternalProject_Add is invoked in the calling project.
The first argument to ExternalProject_Add is the name for the custom target representing the external project. It should be a valid CMake target name and it must be unique across the set of all target names in your CMakeLists.txt files. This follows the same rule as other CMake targets: library, execut-able and custom target names must be globally unique.
The DEPENDS argument takes the names of other CMake targets that must build first before the current external project will build successfully. These could be library, exe-cutable target, external project, or CMake custom target names. If you need to make your own CMake target depend on an external project use the CMake ADD_DEPENDENCIES command. The target name will be the first argument and the external project <name> will be the second argument.
# [PREFIX dir]
The *_DIR options specify directories for the project, with default directories computed as follows. If the PREFIX option is given to ExternalProject_Add() or the EP_PREFIX directory property is set, then an external project is built and installed under the specified prefix:
TMP_DIR = <prefix>/tmpSTAMP_DIR = <prefix>/src/<name>-stampDOWNLOAD_DIR = <prefix>/srcSOURCE_DIR = <prefix>/src/<name>BINARY_DIR = <prefix>/src/<name>-buildINSTALL_DIR = <prefix>
If the EP_BASE directory property is set then components of an external project are stored under the specified base:
TMP_DIR = <base>/tmp/<name>STAMP_DIR = <base>/Stamp/<name>DOWNLOAD_DIR = <base>/Download/<name>SOURCE_DIR = <base>/Source/<name>BINARY_DIR = <base>/Build/<name>INSTALL_DIR = <base>/Install/<name>
If no PREFIX, EP_PREFIX, or EP_BASE is specified then the default is to set PREFIX to “<name>-prefix”. Relative paths are interpreted with respect to the build directory corresponding to the source directory that invokes ExternalProject_Add.
# [LIST_SEPARATOR sep] # Sep to be replaced by ; in cmd lines
Sometimes it’s necessary to pass a semi-colon delimited string through to CMake as a -D argument. It’s impossible to pass a semicolon in a string and then re-extract it later. So, if you need to pass a list, use some other string (that isn’t used else-where in your ExternalProject_Add arguments) to separate items. Then pass that other string as the LIST_SEPARATOR. For example, to pass:
CMAKE_ARGS -Dmylist:STRING=item1;item2;item3;item4
Use something like:
CMAKE_ARGS -Dmylist: STRING=item1^^item2^^item3^^item4 LIST_SEPARATOR ^^
# [TMP_DIR dir]
The temp directory is used as a place to extract *.tar.gz files, for other custom steps, or during configure and build of the calling project.
# [STAMP_DIR dir]
The stamp files that indicate the last time each external project build step ran are stored in this directory. For multi-configuration build systems like Visual Studio and Xcode, the stamp files are stored in per-configuration subdirectories.
DOWNLOAD STEPFor the download step specify a URL; CVS_REPOSITORY and CVS_MODULE; SVN_REPOSITORY; or DOWNLOAD_COMMAND. If all of these and SOURCE_DIR are omitted, it is an error. If there is no download step, then use an empty string for DOWNLOAD_COMMAND “”.
# [DOWNLOAD_DIR dir]
If URL points to a file to download from the internet then the downloaded file will be stored in this directory.
# [DOWNLOAD_COMMAND cmd...]
DOWNLOAD_COMMAND provides a custom download command. For example, to extract from a different archive format than the .tar.gz files that CMake can handle.
The download command should ensure that there is a source directory at <SOURCE_DIR> when it is done; it executes with the working directory set to <DOWNLOAD_DIR>.
# [CVS_REPOSITORY cvsroot]
“:pserver:” or “:ext:” (or other) protocol string to the root of the CVS repository.
# [CVS_MODULE mod]
Name of the module to checkout relative to the root of CVS_REPOSITORY.
# [CVS_TAG tag]
-r tagname or -r branchname or -D 2009-09-10. If omitted, the checkout gets no sticky tag or date, so you sync with the HEAD of the CVS repository.
# [SVN_REPOSITORY url]
URL to an svn repository. Usually includes “trunk”, a branch, or a tag and the source directory.
# [SVN_REVISION rev]
-r revisionNumber or -r {2009-09-10} date stamp. If omitted, you sync with the latest revision from the SVN repository.
# [URL /.../src.tgz]

16
URL to an internet-based file or name of a local file or pre-existing already extracted source directory. Examples:
URL ${CMAKE_CURRENT_SOURCE_DIR}/Externals/Proj1 URL ${CMAKE_CURRENT_SOURCE_DIR}/tarballs/proj2.tgz URL http://www.cmake.org/.../cmake-2.6.4.tar.gz
The download step will copy the local dir or the extracted contents of the archive file to <SOURCE_DIR>. To support other archive types, or avoid the copy, provide a custom DOWNLOAD_COMMAND instead of using URL.
UPDATE/PATCH STEPIf the download step is based on a CVS_REPOSITORY or SVN_REPOSITORY then the default value for the update command will be a call to cvs or svn to update the source tree. In this case, the update command will always re-run at build time. To avoid the update step use UPDATE_COMMAND “”.
# [UPDATE_COMMAND cmd...]
The default UPDATE_COMMAND for non-repository down-load steps is “”. The update command executes with the working directory set to <SOURCE_DIR>.
# [PATCH_COMMAND cmd...]
By default, there is no patch step. If you have a patch file to apply on top of a download or cvs checkout, use PATCH_COMMAND. For example:
PATCH_COMMAND patch -p2 -t -N < ${dir}/proj1.patch
The patch command executes with the working directory set to <SOURCE_DIR>.
CONFIGURE STEPIf SOURCE_DIR is explicitly set to an existing directory, the project will be built from it.
# [SOURCE_DIR dir]
Otherwise a download step must be specified using one of the DOWNLOAD_COMMAND, CVS_*, SVN_*, or URL options. The URL option may refer to a local directory or source tarball, or to a remote tarball (e.g., http://.../src.tgz).
# [CONFIGURE_COMMAND cmd...]
Command used to configure the project before building it. If a project uses a configure script to achieve this then use:
CONFIGURE_COMMAND <SOURCE_DIR>/configure --prefix=<INSTALL_DIR>
The configure command executes with the working direc-tory set to <BINARY_DIR>.
# [CMAKE_COMMAND /.../cmake]
If project uses CMake to configure, and it uses a different CMake than the one being used to configure the calling project, use:
CMAKE_COMMAND ${full_path_to_other_cmake}
A project that configures with CMake uses the same CMake as the calling project. The CMake command executes with the working directory set to <BINARY_DIR>.
# [CMAKE_GENERATOR gen]
If project requires a different CMAKE_GENERATOR than the one used for the calling project, use:
CMAKE_GENERATOR “Visual Studio 8 2005”
# [CMAKE_ARGS args...]
To make builds consistent, specify all of the configuration settings used to build the project using CMAKE_ARGS.
CMAKE_ARGS -DCMAKE_BUILD_TYPE:STRING=Release -DPROJ_OPTION1:BOOL=ON -DPROJ_OPTION2:BOOL=OFF
You do not need to specify the “-G generator” part or the source directory part of the CMake command line in CMAKE_ARGS. The source directory is always automatically appended as the last argument to the CMake configure command line, and the generator defaults to the same as the calling project unless you use the CMAKE_GENERATOR arg.
If you need to pass a list of items through a CMAKE_ARGS -D argument, see the LIST_SEPARATOR documentation.
BUILD STEPThere is a reasonable location for the binary tree for the external project, underneath ${CMAKE_BINARY_DIR} for the calling project.
# [BINARY_DIR dir]
If you would like to specify a different binary directory, use:
BINARY_DIR ${CMAKE_CURRENT_BINARY_DIR}/MyBinaryDir
# [BUILD_COMMAND cmd...]
CMake-based projects build with ‘cmake--build’. Others build using ‘make’. Use BUILD_COMMAND to customize the build step. The build command executes with the working directory set to <BINARY_DIR>.
# [BUILD_IN_SOURCE 1]
For projects that do not build properly in a separate binary dir, or that want to build in the source tree, BUILD_IN_SOURCE 1 means set BINARY_DIR to be the same as <SOURCE_DIR>.
INSTALL STEPThe INSTALL_DIR is underneath the calling project’s binary directory. Use INSTALL_DIR to specify a different location. Note that in addition to setting INSTALL_DIR, you also have to pass -DCMAKE_INSTALL_PREFIX or --prefix to the CMake or configure command. It is not used automatically in the configure step since not all projects follow this convention.
# [INSTALL_DIR dir]
You can refer to the install directory in your configure command, for example:

17
CONFIGURE_COMMAND <SOURCE_DIR>/configure --prefix=<INSTALL_DIR>
# [INSTALL_COMMAND cmd...]
CMake-based projects use ‘cmake--build’ to build the install target. Other projects use ‘make install’. Use INSTALL_COMMAND to customize the install step. Use INSTALL_COMMAND “” to omit the install step. The install command executes with the working directory set to <BINARY_DIR>.
TEST STEPThe test step is omitted to save time based on the assump-tion that external projects are stable and well-tested. The code you depend on will ultimately be tested by your own project’s tests, anyway, right? It’s easy to activate the test step, however. Simply add TEST_BEFORE_INSTALL 1 or TEST_AFTER_INSTALL 1 to execute the test command either before or after the install step. Or add a custom TEST_COMMAND if the default one isn’t sufficient.
# [TEST_BEFORE_INSTALL 1] # [TEST_AFTER_INSTALL 1] # [TEST_COMMAND cmd...]
By default, cmake based projects use ‘ctest’ to test the build tree. Other projects use ‘make test’. Use TEST_COMMAND to customize the test step.
ADDING CUSTOM STEPSPerhaps you still have a build step that the standard sequence does not account for.
For even finer grained control than ExternalProject_Add already gives you, you can add your own custom build steps in lieu of, or in addition to, the steps already provided. To add your own custom build step, use the function ExternalProject_Add_Step after a call to ExternalProject_Add.
The ‘ExternalProject_Add_Step’ function adds a custom step to an external project. The signature looks like this:
ExternalProject_Add_Step(<name> <step> [COMMAND cmd...] [COMMENT “text...”] [DEPENDEES steps...] [DEPENDERS steps...] [DEPENDS files...] [ALWAYS 1] [WORKING_DIRECTORY dir] )
“Silly example” calls that just echo some strings to the build output stream after the standard build and install steps for the external project “proj1” look like this:
ExternalProject_Add_Step(proj1 e1 COMMAND ${CMAKE_COMMAND} -E echo e1 DEPENDEES build DEPENDERS install)ExternalProject_Add_Step(proj1 e2 COMMAND ${CMAKE_COMMAND} -E echo e2 DEPENDEES install)
These silly example calls would result in two additional build steps. Step e1 executes after the build step and before the install step, while step e2 executes after the install step.
The command line, comment, and working directory of every standard and custom step is processed to replace tokens <SOURCE_DIR>, <BINARY_DIR>, <INSTALL_DIR>, and <TMP_DIR> with corresponding property values.
The following names are reserved step names used for the standard external project build steps. Do not use these as step names in calls to ExternalProject_Add_Step. These are mine: mkdir, download, update, patch, configure, build, test, install, complete, done. Use your own.
PROPERTIESAfter an ExternalProject_Add call, you can call ExternalProject_Get_Property to retrieve the properties of that project. For example, if you need to use its install location in another project’s configuration command…
ExternalProject_Get_Property(proj1 install_dir)
…puts the value of the INSTALL_DIR property for proj1 into the CMake variable “install_dir”. You may then refer to it in a subsequent configure command for proj2. For example:
CMAKE_ARGS -Dproj1_DIR:PATH=${install_dir}
The names of the variables used in an ExternalProject_Get_Property call must match the names of the corresponding properties that you retrieve.
CONCLUSIONThe “external project” approach allows for consistent builds across many machines because it is dependent upon a call to ExternalProject_Add in your CMakeLists.txt file. Whereas, relying on several people to set different variables to the same set of values may not always yield consistent results.
In addition to consistency, automatically building external projects saves developers time because they don’t have to spend time manually configuring and building project dependent components. Developers can configure a project, crank up the build and voila: all those components are built for them by ExternalProject’s automagic goodness.
One drawback, however, is ExternalProject’s lack of full dependency analysis. Changes in header files of an external project may not cause an incremental rebuild of the affected sources that depend on those headers. This is because the build step might not re-run. A complete list of header files is not given as input to the build step, so there is nothing to indicate that the build step should re-run. This problem can be circumvented by touching or deleting a build step’s corresponding stamp file which will force it to run.
For more information on ExternalProject, please visit the CMake mailing list.
David Cole is an R&D Engineer in Kitware’s Clifton Park, NY office. David has con-tributed code to the VTK, CMake, ITK, ParaView, KWWidgets and gccxml open-source projects. He has also contributed to Kitware’s proprietary products including ActiViz and VolView.

18
KITWARE NEWS
Kitware held its 2nd Biomedical Visualization Contest to find the best visualization made using VTK and ITK. Judging for this contest was completed in a secure online environment and the winners were announced at MICCAI 2009.
This years’ submissions employed the following software applications in creating their contest submissions: caBIG-XIP, 3D Slicer, Osirix, MedINRIA, IRCAD’s VR-Render, and MITK. Each of these applications was built on top of Kitware’s VTK and/or ITK open source toolkits.
To create the first place image, ITK features (morphological mathematics, topological, geometrical and textural opera-tors) included in IRCAD’s 3DVPM software were used to complete the image segmentation. VTK is used by IRCAD VR-Render software for direct volume rendering. VTK and
Second Place Winner, Stephan Gerhard and Patric Hagmann from Ecole Polytechnique Fédérale de Lausanne
Brain Connectivity as Network Visualization
To create the second place image, ConnectomeViewer was used to render the image. The ConnectomeViewer applica-tion’s framework was built using Enthought Envisage, with Mayavi2 using TVTK as plugin. TVTK wraps VTK to trait-enable Python.
Kitware would like to thank the following community members for helping to make this contest possible:
• Nicholas Ayache, INRIA, Sophia-Antipolis
• Stephen Aylward, Kitware
• J. Michael Fitzpatrick, Vanderbilt University
• Alejandro Frangi, Pompeu Fabra University
• Henkjan Huisman, Radboud University Nijmegen Medical Centre
• Julien Jomier, Kitware
• Nico Karssemeijer, Radboud University Nijmegen Medical Centre
• Dean Inglis, McMaster University
• Marc Niethammer, The University of North Carolina
• Steve Pieper, Isomics, Inc.
• Patrick Reynolds, Kitware
• Daniel Rueckert, Imperial College London
• Julia Schnabel, University of Oxford
• Martin Styner, The University of North Carolina
• Debora Testi, BioComputing Compentence Centre
• Marco Viceconti, Istituto Ortopedico Rizzoli
• Betty Yue, Imperial College London
KITWARE IS AWARDED NAMIC QT SUPPLEMENT FOR BIOMEDICAL COMPUTINGKitware has been awarded a two year, approximately $350K, supplement to the NAMIC National Center for Biomedical Computing project. The goal of the project is to rewrite the Slicer KWWidgets-based GUI with Qt. Jean-Christophe Fillion-Robin, Julien Finet and Sébastien Barré will be the primary implementers of this technology.
KITWARE WINS PHASE I ARL SBIR FOR MOBILE AD-HOC NETWORK ANALySISIn this Phase I SBIR awarded by the Army Research Lab, Kitware will develop a mobile ad hoc network platform for ingestion, processing, and visualization of network simula-tion and scenario data. This platform will be based on an open-source, extensible system. The proposed technology will integrate statistics algorithms; use graph algorithms from the Boost Graph Library; and will make use of the open-source Visualization Toolkit (VTK) and OverView, an application designed to support informatics analysis and visualization methods.
KITWARE WINS PHASE II NIH STTR FOR WEB-BASED IMAGE ANALySISThis National Institutes of Health award “High Throughput Web-based Image Analysis of Mouse Brain MR Imaging Studies” will focus on developing a server-side processing infrastructure to the MIDAS system for the analysis of mor-phometry and connectivity for neuro-developmental and neuro-degenerative diseases.
KITWARE WINS PHASE I DOE SBIR FOR VISUAL WORKFLOWKitware has been awarded a Phase I SBIR by the Department of Energy to develop an integrated visual workflow environ-ment which supports increasingly data intensive scientific processes. The work will focus on the data management,
ITK also work with other Open Source systems like wxWid-gets (for GUI), gdcm/dcmtk (for loading DICOM), vtkinria3d, vgSDK or Boost which were also employed.
First Place Winner, Luc Soler and Jacques Marescaux from IRCAD Computer Assisted Surgery of Pancreas Using Augmented Reality

19
comparison and evaluation of extremely large datasets. The open source visualization systems ParaView and VisIt, as well as other emerging data management tools such as MIDAS and the Globus Metadata Catalog Service will be used. Kitware plans to develop a flexible architecture so that other computational tools may be used in place of these in the future.
KITWARE WINS PHASE II DOE SBIR FOR COLLABORATIVE VISUALIzATIONKitware and the Stanford Linear Accelerator Center (SLAC) were awarded a Phase II SBIR by the Department of Energy to develop collaborative visualization tools for large-scale data. The proposed work will address the typical problems faced by geographically and organizationally separated research and engineering teams, who produce large data and wish to work together to analyze and understand that data.
require a much smaller cluster than is currently needed to load and view entire AMR volumes.
LATE FALL/WINTER CONFERENCESIf you’re interested in meeting with a Kitware representative at one of these events, email us at [email protected].
Qt Developer Days 2009November 2 - 4, in San Francisco, CA. Bill Hoffman will be presenting a Qt in Use Session entitled “Case Study Open Source Showcase: Open Source in a Commercial Setting”on Tuesday, November 2. https://edit.qt.troll.no/qtdevdays2009
Business of Software ConferenceNovember 9-11, in San Francisco, CA. The Business of Software Conference aims to bring together entrepreneurs and developers interested in building long-term, sustainable and profitable software businesses. David Cole will be in attendance. www.businessofsoftware.org
OpenCFD ConferenceNovember 11 - 12, Barcelona, Spain. Dr. Will Schroeder, President and CEO of Kitware, will present an invited keynote presentation at the OpenCFD conference. The talk entitled “Scientific Computing with Open-Source Software” will describe the business model and approach used to develop successful open-source projects, with particular focus on the ParaView parallel visualization system. Dr. Schroeder will also lay out future development plans for ParaView and the underlying VTK visualization system. http://www.open-sourcecfd.com/conference2009
Supercomputing 2009November 14 - 20, 2009, in Portland, OR. Kitware, along with Sandia National Labs, will be presenting a half-day tutorial on “Large Scale Visualization with ParaView” on Sunday, November 15. http://sc09.supercomputing.org
RSNA’s 95th Scientific Assembly and Annual Meeting November 29 - December 4, 2009, at the McCormick Place Convention Center in Chicago, IL. Rick Avila will be presenting a paper on the “Quantitative Estimation of Individual Lung Cancer Risk” on Wednesday December 2. Kitware will also be providing a showcase exhibit at the “Toward Quantitative Imaging: Reading Room of the Future” on quantitative mea-surement of lung cancer response to therapy. The Reading Room of the Future will be located in Hall E of the Lakeside Learning Center. http://rsna2009.rsna.org
IEEE Winter Vision Meetings 2009December 7 - 10, 2009 in Snowbird, Utah. Anthony Hoogs, Director of Computer Vision, and Eran Swears are present-ing a paper at the IEEE Workshop on Motion and Video Computing entitled “Functional Scene Element Recognition for Video Scene Analysis”. Dr. Hoogs is also the Program Co-Chair for the IEEE Workshop on Applications of Computer Vision. http://vision.cs.byu.edu/wvm2009/wvm.php
Symposium on Interactive 3D Graphics and GamesFebruary 18 - 21, 2010, at the Hyatt Regency in Bethesda, MD. I3D is the leading-edge conference for real-time 3D com-puter graphics and human interaction, and 2010 marks the 24th year since the first conference gathering. Dr. Stephen Aylward, Kitware’s Director of Medical Imaging, will be in attendance. http://www.i3dsymposium.org
KITWARE WINS PHASE I NLM SBIR FOR BIOMEDICAL RESEARCHKitware has been awarded a Phase I SBIR by the National Library of Medicine to develop a flexible information visu-alization and analysis platform for biomedical research. This contracted effort will develop tools in support of ‘omics (genomics, proteomics, metabalomics) research by enabling the visualization of interrelated data in publicly available databases. Kitware is teamed with Michelle Williams from the University of Washington and Thomas O’Connell from the University of North Carolina.
KITWARE WINS PHASE I NCRR SBIR FOR DECT ANGIOGRAPHy BONE REMOVALThis Phase I SBIR awarded by the National Center for Research Resources will develop tools for dual energy segmentation and removal of bone from the vicinity of the carotid arteries. This technology will enable contrast enhanced angiography studies where the bone and vasculature anatomy can be confounded for a single energy CT scan. Kitware is teamed with Sandy Napel of Stanford University on this effort.
KITWARE WINS PHASE I DOE SBIR FOR AMR STREAMINGIn this Phase I Department of Energy award, Kitware plans to extend its open source parallel visualization application, ParaView, to process Applied Mathematical Research (AMR) datasets by “streaming” them. Only the data that is being viewed will be loaded, processed and displayed. This will
The interaction between genes and miRNA sequences in Drosophila, using the TargetScanFly dataset showing
the full set of genes and miRNA sequences.

20
Kitware’s Software Developer’s Quarterly is published by Kitware, Inc., Clifton Park, New York.
Contributors: Lisa Avila, Utkarsh Ayachit, Stephen Aylward, Jeff Baumes, David Cole, Katie Cronen, Berk Geveci, Bill Hoffman, Luis Ibàñez, Julien Jomier, Steve Jordan, Charles Law, Andrew Maclean, Pat Marion, Thomas Otahal, Patrick Reynolds, Niki Russell, Will Schroeder, Wes Turner and Shrihari Vasuderan.
Design: Melissa Kingman, www.elevationda.com
Editor: Niki Russell
Copyright 2009 by Kitware, Inc. or original authors.
No part of this newsletter may be reproduced, in any form, without express written permission from the copyright holder. Kitware, ParaView, and VolView are all registered trademarks of Kitware, Inc.
To contribute to Kitware’s open source dialogue in future editions, or for more information on contributing to specific projects, please contact the editor at [email protected].
In addition to providing readers with updates on Kitware product development and news pertinent to the open source community, the Kitware Source delivers basic infor-mation on recent releases, upcoming changes and detailed technical articles related to Kitware’s open-source projects. These include:
• The Visualization Toolkit (www.vtk.org)• The Insight Segmentation and Registration Toolkit
(www.itk.org)• ParaView (www.paraview.org)• The Image Guided Surgery Toolkit (www.igstk.org)• CMake (www.cmake.org)• CDash (www.cdash.org)• BatchMake (www.batchmake.org)• VTKEdge (www.vtkedge.org)
Kitware would like to encourage our active developer community to contribute to the Source. Contributions may include a technical article describing an enhancement you’ve made to a Kitware open-source project or successes/lessons learned via developing a product built upon one or more of Kitware’s open-source projects. Authors of any accepted article will receive a free, five volume set of Kitware books.
NEW HIRES
Casey GoodlettCasey joined Kitware's North Carolina office in August 2009 as an R&D Engineer for the Biomedical Imaging team. Prior to joining Kitware, Casey was a member of the Scientific Computing and Imaging (SCI) Institute at the University of Utah where he completed his PhD in Computing.
Marcus HanwellMarcus Hanwell joined Kitware in October 2009 as an R&D Engineer for the Scientific Computing team. Marcus is one of the core developers of Avogadro and an active member of the Gentoo and KDE communities. He completed his BS and PhD in Physics from the University of Sheffield. His PhD and post-doctoral research involved both experimental and com-putational research, concerned primarily with the electrical and structural characteristics of nanomaterials.
Matt LeottaMatt joined Kitware in September 2009 as an R&D Engineer for the Computer Vision team. Matt completed a dual BS in Computer Science and Computer Systems Engineering from RPI and his MS in Applied Mathematics from Brown University. He is currently in the final stages of his PhD in Engineering at Brown University.
zach MullenZach joined Kitware in August 2009 as an R&D Engineer and is currently working as a developer on CMake. Prior to joining Kitware, Zach worked as a co-op at IBM where he devel-oped the Common Launchpad, a framework for abstracting cross-platform development issues. Matt received his BS in Computer Science from The University of North Carolina at Chapel Hill.
Sangmin OhSangmin joined Kitware in September 2009 as an R&D Engineer for the Computer Vision team. Dr. Oh received his BS in Computer Science from Seoul National University, and
his MS and PhD in Computer Science from Georgia Tech. While at Georgia Tech his research focused on applying temporal models such as switching linear dynamic systems to learn and recognize patterns that occur in multi-channel time-stream data.
David StoupDavid joined Kitware in August 2009 as an R&D Engineer for the Computer Vision team. Prior to joining Kitware, David built large Java applications as a consultant for the State of New York. He received his BS in Computer Science from the University of Massachusetts in Amherst.
NEW INTERNS
Steve jordanSteve joined Kitware in September 2009 as a graphic design intern. Steve is a graduate of the College of Saint Rose where he completed a BFA in Graphic Design.
RPI CAREER FAIRKitware will be attending the RPI Career Fair on February 3, 2010, to recruit top engineering talent for full-time and internship positions.
EMPLOyMENT OPPORTUNITIESKitware is always looking for talented candidates, passion-ate about software development, to work with leaders in the fields of computer vision, medical imaging, visualization, 3D data publishing and technical software development.
Kitware team members enjoy our small company environ-ment, flexibility in work assignments and high levels of independence and responsibility. We offer comprehensive benefits including: flexible work hours; six weeks paid time off; a computer hardware budget; 401(k); health insurance; life insurance; short-and long-term disability; visa process-ing; and free drinks and snacks.
Qualified candidates, especially those with experience in computer vision and scientific computing, are encouraged to send their cover letter and resume to [email protected].