Ithaca Area Wastewater Facility Treatment Engineering ...using available capital and operating cost...
60
Ithaca Area Wastewater Facility Treatment Engineering Management Project Team as part of the CEE 5910 Engineering Management Project Course A Feasibility Study of Energy Production Robert Ainslie, Nitesh Donti, Jacqueline Maloney, Ruju Mehta, Yeswanth Subramanian, Yilin Wang under the guidance of advisor Francis Vanek, Civil and Environmental Engineering Cornell University Graduate School, College of Engineering
Transcript of Ithaca Area Wastewater Facility Treatment Engineering ...using available capital and operating cost...

Ithaca Area Wastewater Facility Treatment
Engineering Management Project Team as part of the CEE 5910 Engineering Management Project Course
A Feasibility Study of Energy Production
Robert Ainslie, Nitesh Donti, Jacqueline Maloney, Ruju Mehta,
Yeswanth Subramanian, Yilin Wang under the guidance of advisor Francis Vanek, Civil and Environmental Engineering
Cornell University Graduate School, College of Engineering

2
Table of Contents
Advisor Introduction ....................................................................................................... 4
Executive Summary ........................................................................................................ 5
Introduction .................................................................................................................... 6
Mission Statement.................................................................................................................. 6
Project Motivation .................................................................................................................. 6
Project Goals .......................................................................................................................... 6
Team Members....................................................................................................................... 7
Assignment of Team Members to Topic Areas of Project ....................................................... 9
List of Project Assumptions .................................................................................................. 10
List of Project Boundaries and Project Scope ........................................................................ 11
Inside Scope: ..................................................................................................................... 11
Outside Scope: .................................................................................................................. 11
Literature Review ......................................................................................................... 12
Waste-to-Energy Systems ..................................................................................................... 12
Small Scale Waste-to-Energy Applications ............................................................................ 12
Possible Fuel from Chicken Feathers .................................................................................... 13
Solar Energy and Regulations in Ithaca ................................................................................. 13
What is Solar Power? ......................................................................................................... 13
Types of Solar panels and their Merits/Demerits: .............................................................. 14
Drawbacks of Investing in Solar Technology ....................................................................... 15
Recently Established Snyder Road Solar Farm in Tompkins County .................................... 17
Alternative Energy Sources ................................................................................................... 18
Hybrid system – Solar PV and Wind Turbine ......................................................................... 18
Low-head Turbines ............................................................................................................... 19
Transportation Fuel Technologies......................................................................................... 20
Natural Gas and Bio-SNG ................................................................................................... 20
Hydrogen Fuel Cells ........................................................................................................... 21
Plugging Into Electric Vehicles ........................................................................................... 21
Fleet Managers Save Millions with CNG ............................................................................. 22
Microgrids ............................................................................................................................ 22
District Energy ...................................................................................................................... 25
Grants ................................................................................................................................... 26
Energy Usage in a WWTF ...................................................................................................... 26
Information and Initial Data ......................................................................................... 28
Ithaca Wastewater Treatment plant ..................................................................................... 28
Major Source of Waste ......................................................................................................... 29
Waste Processing .................................................................................................................. 30
CHP Initiative of IAWWTF ..................................................................................................... 31

3
District Energy ...................................................................................................................... 32
Key parameters considered for model .................................................................................. 33
Optimization and Modeling .......................................................................................... 34
Current Status ............................................................................................................... 36
Scenario Analysis .......................................................................................................... 38
Scenario 1: ............................................................................................................................ 38
Scenario 2: ............................................................................................................................ 39
Scenario 3: ............................................................................................................................ 40
Scenario 4 ............................................................................................................................. 41
Scenario Comparisons .......................................................................................................... 42
Final Recommendations ............................................................................................... 43
Future Projects ............................................................................................................. 43
Appendix A: Calculations .............................................................................................. 46
Current Status:...................................................................................................................... 46
Scenario 1: ............................................................................................................................ 48
Scenario 2A: .......................................................................................................................... 49
Scenario 2B: .......................................................................................................................... 51
Scenario 3: ............................................................................................................................ 53
Net revenue comparison of electricity and biodiesel produced by the same amount of
grease ................................................................................................................................... 55
How much biogas required to produce energy ..................................................................... 55
Solar Capacity ....................................................................................................................... 56
Appendix B: References ................................................................................................ 57

4
Advisor Introduction
This report summarizes the findings of a one-semester project analyzing the proposed expansion of energy conversion of biological waste materials (food scraps, food industry by-
products, sewage, septage, and the like) at the Ithaca Area Wastewater Treatment Facility, or
IAWWTF. The research in the project was carried out by a team of Master of Engineering students from the Engineering Management, Environmental Engineering, and Transportation
Engineering programs.
As advisor, it has been my responsibility to create the foundation for the launch of the project,
mostly during the summer of 2014, by working with partners who also have an interest in it. Dan Ramer, Jose Lozano, and Jim Goodreau at the IAWWTF plant have been interested for some time
in the subject of increasing the self-reliance of the plant for electricity, and provided much of the
initial information. Kushan Dave, student of City and Regional Planning, and his advisor George Frantz, also provided an input into the project with their planning concept for the development of
the area around the plant, as well as some of the initial figures for the dimensions of the
development. Finally, the Energy group of IAWWTF (a committee of interested individuals from outside the plant staff), including members Wade Wykstra, Tom Hanna, Anna Kelles, and John
Bozack, as well as Bruce Abbott and John Graves with whom we previously worked on the
Emerson Plant repurposing project, provided input into the project. This project also benefitted
from information gathered from several previous M.Eng. projects advised by me and focused on local issues, including TCAT fleet operations, repurposing of the AES Cayuga power plant,
Ithaca energy-efficient neighborhoods, Black Oak wind farm, and the aforementioned Emerson
plant. Interested readers may wish to download project reports similar to this one at www.lightlink.com/francis/.
One of the challenges with the project format is that the students must carry out a project that
they did not design within the space of a single semester. Not only must they create from the framework that I provide a coherent scope of work, but they must also self-organize the team and
execute the project during the course of the semester. No previous background in wastewater
treatment systems is required to join the team, so students joining have varying degrees of
familiarity with the technologies and systems. They must therefore dedicate a substantial fraction of the time in the project researching the state of the technology, especially near the beginning.
As advisor, I can report that the team successfully overcame these challenges and met their
research objectives, and I am pleased share the results of their work with a wider audience. In closing, I wish to thank all of the above individuals for their input into the project. While
this support is gratefully acknowledged, the findings and opinions in this report do not represent
official positions of the IAWWTF or Cornell University, and responsibility for any and all errors
rests with myself as advisor and with the team.
Respectfully submitted,
Francis M Vanek, PhD
Senior Lecturer and Research Associate
December 18, 2014
5
Executive Summary This report presents the opportunity for the Ithaca Area Wastewater Treatment Facility
(IAWWTF) to maximize its revenue by utilizing the potential of existing Combined Heat and
Power (CHP) turbines and exploring other energy sources and their possible implementations.
The report also analyzes four different scenarios to maximize revenues for the plant by increasing
the capacity of CHP turbines and adding other alternative sources of energy, such as biodiesel,
solar photovoltaic and hydro-turbines. This feasibility study is intended for the use of the
IAWWTF and professionals interested in producing electricity and heat in a more
environmentally friendly way. We hope that our study will help the IAWWTF and the Ithaca
communities to reduce their CO2 footprints.
CHP is a reliable, cost effective option for the IAWWTF to meet their current energy demand of
334,200 kWh per month using the two existing bio-digesters. The IAWWTF currently has the
capacity to produce approximately 120,000 to 150,000 cubic feet of biogas per day, which is used
as a fuel for the four CHP turbines, each with 65 kilowatts (kW) of capacity, to produce
200,520 kWh of electricity per month. The thermal energy produced by the CHP system is then
used to heat the bio-digesters, which need to be maintained at a temperature of 98°F for 28 days
to produce methane.
Every one million gallons of wastewater flow per day can produce enough biogas in an anaerobic
digester to support 26 kW of electric capacity and 2.4 million Btu per day (MMBtu/day) of
thermal energy in a CHP system1.
The IAWWTF has been exploring various means of producing electricity, and as part of the
initiative, they have already implemented a 7.5 kW solar system inside their facility. This array is
capable of producing 9,210 kWh of electricity per year.
Additional electricity produced by the CHP turbines can be used to power the plant and make the
plant self-reliant. By doing this, the plant avoids a cost of 10.5 cents per kWh, which is currently
the cost paid to utility companies.
Maximizing the intake of waste can help produce additional kW of electricity, which can be sold
to the new proposed development at 14 cents per kWh.
The IAWWTF currently receives an average of four percent grease as part of its trucked waste.
The cost of producing bio-diesel is considered to be $3.11 per gallon, but it can be sold to the
nearby TCAT facility at a price of $3.50 per gallon. Alternatively, if 80-gallon biodiesel
1 Opportunities for Combined Heat and Power at Wastewater Treatment Facilities: Market
Analysis and Lessons from the Field (n.d.): n. pag.Environmental Protection Agency. Combined
Heat and Power Partnership, Oct. 2011. Web. 7 Oct. 2014.
<http://www.epa.gov/chp/documents/wwtf_opportunities.pdf>.

6
processors can be used, the price per gallon for production could be reduced to $2.18 per gallon,
using available capital and operating cost figures, making biodiesel more economically attractive.
Introduction
Mission Statement The Engineering Management Project Team works to determine how much energy,
whether biogas or alternative, the Ithaca Area Wastewater Treatment Facility (IAWWTF)
can produce and at what price, and explore possible uses for this energy. We have
estimated the energy consumption of the proposed Inlet Energy Improvement District and
analyzed the needs of the community compared to the output capabilities of the
IAWWTF. We have also taken into consideration the implementation cost and revenue
gained from each of the scenarios considered.
Project Motivation
As graduate students in engineering we gave back to the Ithaca community that has
educated us over the past four years. We gained the experience of working within an
interdisciplinary team to face the challenges of a large engineering project. We were
interested in learning about wastewater treatment and creating an optimal system that
allows the IAWWTF to not only have increased revenues but also decrease greenhouse
emissions. By focusing on an economic analysis of Kushan Dave’s original proposal, we
aimed to prove or disprove its feasibility.
Sustainable energy is an up and coming field with a great deal of applications. As a result
of the negative effects of pollution on climate change, finding sustainable solutions has
become increasingly important. Waste management systems that can convert harmful or
discarded materials into useful forms of energy are just one way that we can make a
positive impact on society. We want to help create a reliable energy source in Ithaca by
utilizing a variety of waste streams that would have otherwise ended up in a landfill. Not
only does this plan decrease the amount of waste sent to landfills, within which waste
cannot decompose quickly, but it can produce usable energy for the community,
decreasing dependency on non-renewable energy sources.
Project Goals Firstly, our team analyzes the output potential of the IAWWTF in terms of biogas capacity,
hydro-turbine feasibility and significant solar energy production increases. We also analyze the
needs proposed by the Ithaca Energy Initiative Development using Ecovillage data as a baseline
for calculations. Using both of these analyses, our team proposes useful possibilities, such as
selling biogas to TCAT buses, selling electricity back to the grid or reselling repurposed enriched
waste.

7
Team Members
Nitesh Donti
Undergraduate Education: Cornell University, B.S. Computer Science
Graduate Education: Cornell University, M.Eng. Engineering Management
My background is in computer science and business. I have extensive internship
experience in software engineering within a variety of industries. In addition, I have
significant business development and entrepreneurship experience within the education
space.
Jacqueline Maloney
Undergraduate Education: Cornell University, B.S. Civil Engineering
Graduate Education: Cornell University, M.Eng. Engineering Management
My background is in structural engineering and project management. Two internships in
construction management and extensive Concrete Canoe project team experience have
given me many relevant management and interpersonal skills.

8
Ruju Mehta
Undergraduate Education: Cornell University, B.S. Environmental Engineering
Graduate Education: Cornell University, M.Eng. Engineering Management
My background is in civil and environmental engineering. Through different internships
in the energy utility and engineering management/consulting sectors, I have gained
experience in CAD drafting, water systems, and enhancing client interactions.
Yilin Wang
Undergraduate Education: B.S. Civil Engineering, University of Washington
Graduate Education: Cornell University, M.Eng. Transportation Engineering
My background is civil engineering, with a concentration in transportation. Internships
and student organization experience have strengthened my data analysis, system
optimization, and communication skills.

9
Rob Ainslie
Undergraduate Education: Cornell University, B.S. Environmental Engineering
Graduate Education: Cornell University, M.Eng. Environmental Engineering
My background is in environmental engineering and business management. Through my
coursework and work experience I have developed a unique combination of technical and
analytical skills that allows me to effectively and creatively solve problems.
Yeswanth Subramanian
Undergraduate Education: Anna University, Chennai, India. B.E. Electronics and
Communication
Humber College, Toronto. Postgraduate Diploma in Wireless Telecommunication.
Graduate Education: Cornell University, M.Eng. Engineering Management
My background is in telecommunications and program management. I am a
professionally qualified engineer and program manager with seven years of experience in
delivering complex telecommunication projects within the oil, gas and utility sectors and
for major telecommunication operators.
Assignment of Team Members to Topic Areas of Project We have divided the project into three distinct parts, each of which is detailed below
along with according team member assignments. Since each of the teams is dependent
upon the others, there was significantly more overlap among groups than is outlined here.
Continuous communication and feedback were expected to be shared among all three
groups throughout the duration of the project, especially after all options had been
considered and analyses had been conducted. Final recommendations have been based
upon input from all team members.

10
1. Optimization and Modeling: Nitesh and Jacqueline
Using the data and information provided by the IAWWTF and Prof. Vanek
and gathered from the research team, this group is responsible for creating the
analysis tool. This includes synthesizing all of the information and
developing a tool that is easy to manipulate.
2. Environmental Analysis: Ruju and Rob
This group provides a feasibility study on the sources that can be used in the
plant. This includes an optimization on energy creation and profits. Any
options that poorly use the resources can be eliminated along with solutions
that do not yield adequate benefit or profit. A simple economic analysis will
be considered here to determine the most profitable options, assuming there is
demand in the market for sellable energy.
3. Research and Recommendations: Yilin and Yeswanth
This final group will make suggestions about the types of energy that should
be used and for what purposes. Taking into account cost, environmental
impact and feasibility, this team explores the possibilities encapsulated in each
scenario and analyzes energy and other byproduct production. A harder look
at the economic analysis will be considered here to determine whether it is in
fact feasible to sell energy products produced to external users.
List of Project Assumptions
In order to make progress, we made numerous assumptions about the project. To begin,
we assumed that there are no social and political barriers to our efforts in this energy
initiative. We assume that we can get all of the necessary permits and approvals from the
government and will not face any opposition from the Ithaca community.
Also, we assume that the smell and noise of the plant do not deter residential
construction, and that any smell or noise produced from waste processing or energy
production processes is within a tolerable range. However, it would be the responsibility
of any residential or commercial developer to make sure that this requirement is met,
since failure to meet it could jeopardize the viability of the whole project.
We assume that the entire redevelopment project from Kushan Dave’s plan is completed,
or if not, we assume that the resulting electricity demand is proportional to the fraction
completed. We assume that the grid will include the demand from the proposed
redevelopment project so that a microgrid can be established. We also assume that the
redevelopment project will be finished (as opposed to partial completion), so that we can
establish an approximate demand.

11
Capital investments assume an investment lifetime of 20 years, and a discount rate of 7%.
The discount rate is a standard U.S. government figure.
Finally we assume that whatever energy we create at the facility can be easily and readily
transmitted to its final location. We assume that transportation infrastructure changes (for
transporting steam, hot water, electricity, etc.) are feasible and at a negligible cost.
List of Project Boundaries and Project Scope
Inside Scope:
Our project scope encapsulates the maximization of energy production to increased
demand, feasibility of meeting increased demand of microgrid conditions, and proposing
areas that the IAWWTF can improve to increase to increase its profit. Renewable energy
sources that we consider are solar, biogas, micro-turbines and hydro-turbines.
Outside Scope:
Any renewable energy production method not listed in the scope above is considered to
be outside the scope. A detailed operational exploration of the technologies (biogas,
solar, hydro-turbine, etc.) suggested from an engineering perspective will not be
performed. In conducting a feasibility study, understanding and assessing the big picture
implementation, rather than operation, is more beneficial for the facility itself. We will
not explore implementation of energy or fuel distribution systems, microgrid details, or
plans to store energy. We are not responsible for identifying additional sources of waste
to meet increased waste demand of certain scenarios or potential buyers of the enriched
dry biocakes. Carbon dioxide emissions are also outside the scope of this project.

12
Literature Review
Waste-to-Energy Systems
All objects, no matter the form, contain energy. Waste-to-energy systems reconstruct the
energy in trash into usable forms while consolidating trash in the process. However,
waste-to-energy processes have the potential to release toxins into the ambient
environment. For example, incineration is a common form of converting waste-to-energy
through heat production but it also produces airborne pollutants and unfavorable odors.
Environmental Protection Agency (EPA) regulations make it nearly impossible to burn
trash in the open.
A number of technological advancements have been made in order to produce energy
from our trash. A Tactical Garbage to Energy Refinery (TGER) has been successfully
implemented in military applications to power a 60-kilowatt generator. It converts waste
into fuel pellets, which are then gasified and turned into synthetic gas resembling
propane. Organic waste (liquids and food) is processed into a hydrous ethanol. The
synthetic gas and hydrous ethanol are then combined to produce fuel. TGER systems do
not process glass, metals or hazardous waste.
Pyrolytic gasification is another form of energy production from waste. In this process,
waste is cooked in batches under indirect heat and low oxygen. The final product of this
process is an inert ash that can be used in building materials. This ash comprises 20% of
the previous volume of waste. The process produces 80% of the energy it uses. In other
words, the process does not produce excess energy; rather, it uses the energy it produces
so that it can degrade waste safely with little energy used.
Many of these systems have been converted into modular units for military use. The
systems usually are comprised of solid waste management, water purification and power
generation systems.2
Small Scale Waste-to-Energy Applications
Heat is a product of most waste to energy plants, but it is often underutilized because of
great distance between the plant and the consumer. This heat can be sold at steam or as
part of a combined heat and power system. According to Small Scale Community Plants
Way Forward for Waste Gasification, facilities that gain full utilization of heat potential
can increase their efficiency up to 85%. Smaller plants also minimize traffic and can be
2 Wingfield, Rebecca C. "Waste-to-Energy Systems." ProQuest. Superintendent of Documents,
United States Army, Jan.-Feb. 2009. Web. 8 Oct. 2014. <http://search.proquest.com/docview/196441952?accountid=10267>.

13
combined with other facilities (such as recycling and wastewater treatment) to decrease
energy costs and carbon emissions for the local community. They also reduce the
amount of heat energy lost in the process.3
The article Review of Small Scale Waste to Energy Conversion Systems takes a very close
look at several international implementations of small scale Waste to Energy systems.4
Possible Fuel from Chicken Feathers This article opens up the doors to possible fuel sources that are currently underutilized.
Chicken feathers, currently used as an additive in low-grade animal foods, can be
converted into usable energy. Feather meal contains 12% fat, which can be easily
converted into biofuel. The 11 billion pounds of chicken waste can be converted into 153
million gallons of biodiesel each year. While that may not even come close to covering
the diesel demand in the US (According to Vanek et al (2014, p.479) in the year 2000
passenger cars consumed 73 billion gallons of motor fuel and light trucks including
pickups, vans, and SUVs consumed another 53 billion gallons), it does make scientists
and environmentalists think about what alternate sources of fuel exist.
Extracting fat from the feathers not only provides an alternate source of energy, but
increases the quality of the animal feed and provides a better nitrogen source in
fertilizers. Additionally, there are also applications for feathers to be used in fuel storage
systems.5
Solar Energy and Regulations in Ithaca
What is Solar Power?
Solar power is the conversion of sunlight into electricity and the mechanism in which the
energy is obtained is classified into two types:
Concentrated solar power (focus a large area of sunlight into narrow beam using
mirrors)
Photovoltaic (converts light into electricity)
3 "Small Scale Community Plants Way Forward for Waste Gasification." Waste Management
World. N.p., 25 June 2012. Web. 04 Oct. 2014. <http://www.waste-management-world.com/articles/2012/06/small-scale-community-plants-way-forward-for-waste-gasification.html>. 4 Stein, Wes, and Lasse Tobiasen. "Review of Small Scale Waste to Energy Conversion
Systems." IEA Bioenergy Agreement - Task 36 (2004): n. pag. IEA Bioenergy. 2004. Web. 5 Oct. 2014. <http://www.ieabioenergytask36.org/Publications/2001-2003/Publications/Review_of_Small_Scale_Waste_Conversion_Systems.pdf>. 5 "Fuel from Chicken Feathers." Alternative Energy News. Biodiesel, Biofuels, Waste Energy, 22
Mar. 2010. Web. 04 Oct. 2014. <http://www.alternative-energy-news.info/fuel-from-chicken-feathers/#.VCg55MmbALs.gmail>.

14
Solar or Photovoltaic panels produce DC current, which fluctuates with the sunlight’s
intensity. For commercial applications, DC is converted into AC current using inverters.
Types of Solar panels and their Merits/Demerits:
1. Mono Crystalline
These type of panels are made from silicon ingots which are cut into cylindrical
shapes to be embedded into panels
Advantages
Highest efficiency as they are made out of high-grade silicon
15 to 20% efficiency. Sun power has produced X series with 21.5%
efficiency
Requires less space, and produces four times yield as thin films
Usually manufacturers provide 25 years warranty and have longest
lifetime
Tend to perform better even in low-light conditions
Disadvantages
Expensive
If the solar panel is partially covered with shade, dirt or snow, the entire
circuit can break down
Tend to be more efficient in warm weather
2. Poly Crystalline
Melting raw silicon and pouring it into a square mold, which is cooled and cut
into perfectly square wafers, manufacture these types of panels.
Advantages
Process used to make polycrystalline silicon is simpler and cost less
Tend to have slightly lower heat tolerance than monocrystalline solar
panels
They perform slightly worse than monocrystalline solar panels in high
temperatures
Disadvantages
Efficiency of polycrystalline-based solar panels is typically 13-16%
Generally need to cover a larger surface to output the same electrical
power as monocrystalline silicon
3. Thinfilm Solar Panels
The panels get their name from the one or several thin layers of photovoltaic
material, which are deposited onto a substrate. These panels are known for their
importance in harsh environments, where they are susceptible to dust and snow.
Advantages
Various types including Amorphous silicon (a-Si), Cadmium telluride
(CdTe), Copper indium gallium selenite (CIS/CIGS), Organic
photovoltaic cells (OPC)

15
Mass-production is simple and can be made flexible
High temperatures and shading have less impact on solar panel
performance
Disadvantages
Low space-efficiency and generally not very useful for residential
applications
Thin-film solar panels tend to degrade faster than mono- and
polycrystalline solar panels
Efficiencies between 7–13%
Drawbacks of Investing in Solar Technology
Solar is considered to be one of the key technologies for energy production in the future,
but the major limitation is the capital expenditure involved with the deployment. The
below chart6 provides a comparison of the levelized cost of various renewable and other
potential technologies:
Figure 1: Total Cost per Renewable Energy
6 Barton, Charles. "IER: Total 2016 Nuclear Levelized Costs Lower." Nuclear Green Blogspot, 22 June 2009. Web. 10 Oct. 2014. <http://nucleargreen.blogspot.com/2009/06/ia-total-2016-nuclear-levelized-costs.html>.

16
Figure 2: Estimated Levelized Costs of New Electricity Generation Technologies in 2016, including both full figure with 16 options and highlight with five options. *Note that natural gas price assumes combined cycle generation.
But the major variation in the cost can be accounted to the nature of production of
energy. Wind and Solar require no operator intervention but they require additional
equipment to store energy, as the production capacity varies with the amount of sunshine
and wind availability. The table below provides the cost of producing energy from
various sources, which can be compared against solar. As mentioned earlier, direct
comparison of the cost is not possible but comparison based on the annual capacity factor
for each technology may provide a better overview.
Table 1: Cost of Producing Energy from Various Sources
Plant Type Capacity
Factor (%)
Levelized
Capital Cost
Fixed
O&M
Variable
O&M
(including
fuel)
Transmission
Investment
Total System
Levelized Cost
Advanced Nuclear 90 84.2 11.4 8.7 3 107.3
Wind 35.1 122.7 10.3 0 8.5 141.5
Wind-Offshore 33.4 193.6 27.5 0 8.6 229.6
Solar PV 21.7 376.6 6.2 0 12.9 395.7
Solar Thermal 31.2 232.1 21.3 0 10.3 263.7
Geothermal 90 86 20.7 0 4.8 111.5
Biomass 83 71.7 8.9 23 3.9 107.4
Hydro 52 97.2 3.3 6.1 5.6 114.1

17
The chart concludes that nuclear is best source of energy and the returns are much higher.
But for the purpose of study and this document, we are limiting our discussion to Solar,
Wind and Biomass. The energy options we are advising for Ithaca wastewater treatment
plant is to maximize the intake of waste, increase existing solar capacity and introduce
hydro turbines.
Recently Established Snyder Road Solar Farm in Tompkins County
Snyder Road Solar Farm is Cornell University’s first large-scale solar energy project.
This solar farm went live Friday, September 19th. The farm consists of a two-megawatt
array of solar panels sprawled across 11 acres of Cornell property in the town of Lansing
(near the Ithaca Airport). The 8,000+ panel solar system will produce about one percent
of Cornell’s electricity and reduce university carbon emissions by 0.5 percent.
There are restrictions regarding how large an organization can build a solar energy
project that uses remote net metering. The solar farm will thus produce the maximum
amount of electricity allowed by the Public Service Commission. Remote net metering is
a monitoring system — measuring the inputs and outputs of a solar energy source — that
enables Cornell to build the solar farm several miles off campus and get credit for
electricity production against electricity it purchases from the grid. Thus, the limitations
here include the small amount of energy one location can produce and that Cornell can
only collect credit from one renewable energy project at a time.
Cornell’s solar efforts here reduce our reliance on fossil fuels and will set a high example
for other local governments in the state.7 Additionally, a 2.4 megawatt solar array, spread
over 10 acres, is planned on Tompkins County-owned land near the airport. This solar
power system is expected to produce enough power to supply the City of Ithaca
government with a third of its annual energy demand. The project is funded through a
$100 million state grant as New York quickly works to become a national leader in the
space.8
7 Ferguson, Zoe. "Cornell Flips the Switch at Snyder Road Solar Farm." The Cornell Daily Sun.
N.p., 23 Sept. 2014. Web. 05 Oct. 2014. <http://cornellsun.com/blog/2014/09/23/cornell-flips-the-switch-at-snyder-road-solar-farm/>. 8 Casier, Andrew. "Tompkins, Ithaca Plan 2.4MW Solar Array." Ithaca Journal. Gannett Company,
26 Sept. 2014. Web. 04 Oct. 2014. <http://www.ithacajournal.com/story/news/local/2014/09/26/tompkins-ithaca-plan-mw-solar-array/16285521/>.

18
Alternative Energy Sources The energy potential contained in the wastewater side is not fully known but research has
proved that it has 10 times more energy 9contained in it than the energy expensed to treat
it. Some wastewater treatment facilities are 100% energy neutral, where they are able to
produce the complete amount of energy required to treat the waste and reduce their
dependency on the national grid.
Drinking water and wastewater systems account for approximately 3 percent of energy
use in the United States; however, for municipal governments, drinking water and
wastewater plants are typically the largest energy consumers, accounting for 30 percent
of total energy consumed. The main challenge is to make wastewater treatment plants to
be energy neutral, and thus able to operate solely on the energy embedded in the water
and wastes they treat.
Hybrid system – Solar PV and Wind Turbine Photovoltaic is a great source of energy for countries with year round of sunshine. But in
United States, wind speeds are low in the summer when the sunshine is brightest and
strongest. A small "hybrid" electric system that combines home wind electric and home
solar electric (photovoltaic or PV) technologies offers several advantages over either
single system.
This source of power will be much lower when compared to commercial wind turbines or
solar farms installed at large scale. One of the strongest benefits of this solution is their
complete autonomy from the grid, as they generate energy at different intervals and
during different seasons.
This technology has so far been tested only in remote residence, where the cost of
extending grid power would cost anywhere between $15,000 to $50,000 US dollars. But,
these installations have the capability to produce sufficient electricity to power lightings
and other small appliances in residence and commercial units. This can reduce the load of
residence on the electricity generated from Wastewater treatment and can help the plant
become energy neutral.
One of the main constraints of the Hybrid system is their battery life, but this can be
managed by using "deep-cycle" (generally lead-acid) batteries, which has a lifetime of 5
to 10 years and reclaim about 80% of the energy channeled into them. In addition, these
9 Scott, Leelon, “Capturing Energy In Waste Treatment Plants.” WaterWorld. Web Aug.2011
<http://www.waterworld.com/articles/print/volume-28/issue-9/departments/wwema/capturing-energy-in-wastewater-treatment-plants.html>

19
batteries are designed to provide electricity over long periods, and can repeatedly charge
and discharge up to 80% of their capacity.
Low-head Turbines The main objective of looking at Alternate Energy sources if to make the plants energy
neutral. One of the other technologies, which have the potential to increase the electricity
production of wastewater plants, is by using low-head turbines. Even though, the
installation is considered to have high capital expenditure, it reduces the operational
expense and other overheads, such as buying electricity from the grid. Some of the other
plants with low-head turbines were able to increase their energy production by 15% and
able to supply 1.35 megawatts of electricity to the grid.
This increase in production capacity has made the low-head turbines an ideal choice as an
alternate energy source. There are two types of turbines, impulsive and reaction type and
both has its own advantages. Impulsive type system requires jet propulsion of water
stream, which requires additional energy to produce, that flows and pressure. So, reaction
type turbines have been an ideal choice for wastewater plants, which makes use of the
natural water flow and eliminates the need for energy source to increase the water speed.
Reaction type turbines have been installed and tested at various locations such as Point
Loma, San Diego and Deer Island, Massachusetts.
Many models of low-head turbines are available in market today and it is chosen based
on two main criteria; the flow rate (f) and the head height (h). Low-head turbines can
operate through range of flow rates, but the size of that range varies with turbine type
IAWWTF approximately process 6 million gallons of sewage every day and the volume
increases at time of rainfall and snow melt to approximately 30-35 million gallons a
day10
.
The power produced by a low-head turbine can be calculated using the below formula,
Power (kW) = H*F*efficiency / 11.811
Where H is the head in feet and F is the flow in cubic feet per second (cfs), efficiency is
the overall system efficiency as a fraction and 11.8 is the constant that converts the
equation to kilowatts.
10 "Wastewater Treatment." City of Ithaca NY. N.p., n.d. Web. 4 Oct. 2014.
<http%3A%2F%2Fwww.cityofithaca.org%2F331%2FWastewater-Treatment>.
11
Environmental Protection Agency. “Renewable Energy Fact Sheet:Low-Head Hydropower from Wastewater” Web, Aug 2013. < http://water.epa.gov/scitech/wastetech/upload/Low-Head-Hydropower-from-Wastewater.pdf>.

20
In wastewater treatment plants, treated effluent is diverted through one or more turbine-
generator units before flowing into the receiving stream. Treated effluent can also flow
through a shunted section of the outfall pipeline to bypass during shutdown. Generated
electricity is diverted to wastewater treatment through an independent transmission line.
Ithaca Wastewater treatment (IAWWTF) plant has the potential for installing low-head
turbines, where we can make use of the 4 feet head height and water flow, before the
potable water exits the facility to the lake.
Some of the different models of Low-head turbines and their characteristics along with
cost is given in the below table:
Table 2: Comparison between Different Low-head Turbines
Manufacturer Model Type Flow rate
(cfs)
Head
(feet)
Electricity
generation
(kW)
Cost ($)
Energy systems and
design
LH 1000 Small
propeller
type
2 10 1 3000
Power pal MHG 1000LH Small
propeller
type
5 5 1 4000
Canyon Kaplan turbine Varying
head and
flow
100-400 3-50 (-) 30-500 K
Toshiba
International
Hydro eKIDs Propeller
type
(-) (-) 5-200 7-30 K
VLH turbine Site specific Site
specific
0.16–0.48 M 4.2–10.5 100-500 575 K – 1.1 M
Transportation Fuel Technologies
Natural Gas and Bio-SNG
Bio-SNG, the abbreviation of synthetic natural gas, is produced by gasification of
cellulosic materials, such as forestry residues, crops, etc.; whereas natural gas is a fossil
fuel formed when layers of plants, gases, and animals are exposed to intense heat and
pressure over thousands of years. The natural gas and bio-SNG we used can be a clean

21
burning transportation fuel when compressed or liquefied. Its chemical formula is CH4.12
The current infrastructure for natural gas and bio-SNG is more developed than before, but
still less developed than it is for transportation fuels. Using natural gas as transportation
fuel has many limitations under current technology. Natural gas is usually placed in the
pressurized tanks; even compressed to 2400-2600 psi, the energy released is only one
third of energy released by same amount of gasoline. There are about 770 natural gas
refueling stations nationwide located in large cities and major highways. However,
natural gas vehicles are well suited to business and public agencies that have their own
refueling stations. CNG vehicles emit 85%-90% less CO, 10%-20% less CO2 and 90%
fewer reactive non-methane hydrocarbons than gasoline-powered vehicles, which is a
very environmental-friendly characteristic for natural gas and bio-SNG.13
Hydrogen Fuel Cells
The spaceship use hydrogen as fuel, so in the future, hydrogen may play an important
role as transportation fuel. Fuel cells use hydrogen and oxygen to produce electricity
without harmful emissions, and water is the main by-product. The predominant method
for producing large quantities of hydrogen fuel is steam reforming of natural gas. High
production costs and hydrogen storage are the current limitations. However, the huge
environmental benefits may make hydrogen fuel cell vehicles a common sight on the
roadways of America.14
Plugging Into Electric Vehicles
There are two main infrastructure requirements for EV: Transmitting electricity from
generation facility to the vehicle recharging location and equipment and systems to
control, monitor and safely transfer electricity to the vehicle. The battery limitation is the
biggest obstacle of the development of EV. To have enough power, the vehicle has to
carry as many batteries as possible, which can cause the vehicle too heavy. Furthermore,
the batteries have to be charged rapidly, so they must be replaced every 3 to 6 years. The
dedicated vehicles produce no pipeline emissions, and the emissions for producing
electricity at power plant can be controlled easily. Therefore, electricity is also an ideal
transportation fuel for the future. Researches keep working on the efficient batteries that
will increase the electric vehicle range.15
12 "Bio-SNG (Synthetic Natural Gas) and Gasification Technologies." European Biofuels
Technology Platform. N.p., 25 Mar. 2013. Web. 5 Oct. 2014. <http://www.biofuelstp.eu/bio-
sng.html>. 13
NEED, “Transportation Fuels: The Future is Today” 2006-2007 Page 16<http://www.formula-hybrid.org/wp-content/uploads/DOE-Alternative-Fuels-Teacher-Guide.pdf > 14
International Energy Agency “Production Costs of Alternative Transportation Fuels” http://www.iea.org/publications/freepublications/publication/FeaturedInsights_AlternativeFuel_FINAL.pdf 15
NEED, “Transportation Fuels: The Future is Today” 2006-2007 Page 15<http://www.formula- hybrid.org/wp-content/uploads/DOE-Alternative-Fuels-Teacher-Guide.pdf >

22
Fleet Managers Save Millions with CNG
This article presented success examples of Central Ohio Transit Authority (COTA),
Culver City, Calif., and Houston that converting the fleet of buses to run on compressed
natural gas (CNG) can save millions of dollars a year. Based on studies, natural gas costs
from $1.50 to $2 less per gasoline gallon equivalent (GGE). Compared to diesel, CNG
reduces greater than 90% in particulate matter emissions and 50% decrease in nitrogen
oxides. Consisting mostly of methane, CNG is an inherently safe fuel that odorless,
colorless, tasteless, nontoxic and no threat to land or water. It is reported that as many as
half of new transit buses are powered by natural gas. CNG buses have some key features:
they are quieter, no matter interior or exterior; can save about 145 barrels of petroleum
annually at average operating conditions; the buses can reduce output of, in particular,
visible particulate emissions considerably.
Driven by economics and the environmental benefits, COTA decided to make the switch
of more than 300 buses’ fuel from diesel to CNG in 2011 after a comparative study. It is
estimated that fuel savings will be around $7 million a year. In 2004, Culver City
converted 100% of its transit fleet to CNG. In 2013, it saved about $1.4 million in fuel
costs, paying the gasoline equivalent of 77 cents a gallon for CNG. Before the switch, the
city used 850,000 gallons of diesel a year. Now it uses only 77,000 gallons at a cost of
more than $4 per gallon16
.
Microgrids Microgrids are “integrated energy system(s) intelligently managing interconnected loads
and distributed energy resources capable of operating in parallel with, or independently,
from the existing utility’s grid” (Sanchez). The article Why the Microgrid Could Be the
Answer to Our Energy Crisis, created an analogy in which an individual goes to a local
hardware store and purchases a solar appliance that is as easy to install as a home
appliance. This solar setup produces the electricity needed to power your home and while
your home is still connected to the existing grid, the connection is now a two way street.17
This analogy can be expanded to multiple homes or commercial properties and after a
time, there will be a community of interconnected buildings, a microgrid.
16 F. Alan Shirk “Half of New Transit Buses are Powered by Natural Gas”
<http://www.sustainablecitynetwork.com/topic_channels/transportation/article_42adb76e-
2340-11e4-bcdf-001a4bcf6878.html?utm_source=SCN+InBox+e-
Newsletter&utm_campaign=e1ce2a21fd-Newsletter_8-13-
2014_Muni&utm_medium=email&utm_term=0_11e7ac761c-e1ce2a21fd-188591733> 17
Kamenetz, Anya. "Why the Microgrid Could Be the Answer to Our Energy Crisis." Fast
Company. N.p., n.d. Web. 05 Oct. 2014.

23
In 2007 Ansonia, CT Mayor James Della Volpe announced plans for the implementation
of an Energy Improvement District.18
The main goals of this project, and microgrids in
general, were to allow local residents and businesses to save money, while
simultaneously reducing strain on the local grid. 19
During heat waves or massive storms,
such as Superstorm Sandy, many grids are subject to overloads and/or blackouts.
Widespread interest in renewable energies, irregularities in supply and potential for
extreme loss of power have jump-started the microgrid movement.
While microgrids can be powered with traditional fossil fuels, there is a general
preference to incorporate renewable and more environmentally friendly energy sources.
Solar, wind, hydro, and combined heat and power (CHP) are the most environmentally
conscious energy sources.20
However, these energy sources also tend to have the most
power quality issues. Voltage sags and swells, current harmonics and flickers are the
most prominent quality issues. Variations in wind strength and direction, combined with
the ever-changing cloud cover and solar intensity are the main contributors to power
quality issues. The renewable energy systems have the benefit of being pollution free, but
traditional sources, such as diesel, have fewer power quality issues. Variations in quality
necessitate a safeguard, which is typically a traditional generator. CHP units are also very
reliable and can have efficiencies as high as 80%.21
Compared to a traditional power
plant, which is around 35% efficient, CHP offers a cleaner option to traditional fuels.
An important aspect of a microgrid’s ability to be off-grid is its ability to store energy.
Storage balances the short term power and energy demand with generation capabilities.
Storage options are batteries, flywheels and supercapacitors. While they have relatively
similar charging efficiencies, a range from 80-90%, cost, service life and environmental
impact can vary greatly. The most efficient and environmentally clean options, flywheels
and supercapacitors, are also twenty to thirty times more expensive than batteries.22
Improvements in storage capabilities will allow microgrids to be more independent and in
the case of a massive blackout, to stockpile energy until it is needed.
Microgrids are a costly enterprise requiring large upfront payments for planning of the
grid, construction of the site and all the required equipment and transmission lines. In
2013, Connecticut announced plans to build nine small microgrids at a total cost of $18 18
Warner, Chet. “U.S. Mayor Article | Ansonia (CT) to Implement Energy Improvement
(July 30, 2007). “U.S. Mayor Article | Ansonia (CT) to Implement Energy Improvement
District (July 30, 2007). N.p., n.d. Web. 05 Oct. 2014. 19
Warner,Chet 20 Lubna Mariam, Malabika Basu, and Michael F. Conlon, “A Review of Existing Microgrid
Architectures,” Journal of Engineering, vol. 2013, Article ID 937614, 8 pages, 2013.
doi:10.1155/2013/937614 21
Lubna Mariam, Malabika Basu, and Michael F. Conlon. 22 Lubna Mariam, Malabika Basu, and Michael F. Conlon,

24
million.23
Using that value as a starting point, it is reasonable to assume that a microgrid,
large enough to supply power to an entire county or state, would cost many millions
more. To offset the high initial investment needed, there are financial incentives
available. The Self-Generation Incentive Program (SGIP) awarded $3 million to the
University of California at San Diego for their 42-megawatt microgrid.24
There are also
numerous feed-in tariffs and energy investment tax credits that can be applied to a
microgrid to reduce the initial capital needed. There are also numerous ways to earn
revenue once the system has been built. Over time, reduced utility costs and the potential
to sell excess energy back to the grid help offset the system cost. However, the reduced
emissions of CO2 and other greenhouse gases could prove to be the most beneficial
aspect of a microgrid.
Along with their complexity, microgrids are facing large opposition from investor-funded
utilities. The concept of a microgrid pits local producers against large utilities and as said
by Ed Legge, a member of the Edison Electric Institute, the lobbying organization for
utilities, “We’re probably not going to be in favor of anything that shrinks our
business.”25
Attitudes like this, that favor profits over progress, are a reason that
microgrids and other ideas like it, often fail. Utilities are going ahead with massive
investments in current grid infrastructure that do not accommodate a move to microgrid
technology, which limits the potential for a combined and intelligent grid.26
Pike
Research sees microgrids as a kind of Lego, a building block that will lead the way to an
interactive, two-way and sustainable grid.27
As mentioned before, the University of California at San Diego received $3 million for
their microgrid project. The microgrid is operated in parallel with San Diego Gas &
Power and serves 11 million square feet of buildings. Their 42-megawatt system has a
30-megawatt natural gas CHP plant, 2.8-megwatts of fuel cells and 1.2-megawatts of
solar photovoltaics.28
Even though the energy density of their buildings is twice that of a
typical commercial space, they still manage to produce 92% of their annual energy loads
and 95% of heating and cooling loads.29
This model proves that a microgrid can be
integrated with a utility company and both can prosper, while creating green energy.
23 Ferris, David. “Microgrids: Very Expensive, Seriously Necessary.” Forbes. Forbes Magazine.
N.d. Web. 05 Oct. 2014. 24 Microgrids. Welcome to CSE. N.p., n.d. Web. 05 Oct. 2014. 25
Kamenetz, Anya. 26 Asmus, Peter. “Why Microgrids Are Inevitable | Articles | Business Energy.” Why Microgrids
Are Inevitable | Articles | Business Energy. N.p., n.d. Web 05 Oct. 2014. 27
Kamenetz, Anya. 28 Sanchez, Ivette. “Microgrid Technology.” Bio Tribune Magazine 18.1 (2006): 8.2003. Web. 29
Microgrids.

25
District Energy District Energy systems are a highly efficient way to heat and cool buildings in a given
region. Systems can include networks of underground pipes to pump steam, hot water or
chilled water to provide heating or cooling for an area. Different sources of thermal
energy vary from system to system. Often plants have cogeneration plants; CHP
(Combined Heat and Power) plants generate electricity power in addition to heating and
cooling. Although constructing a new district energy system for an area is a huge
endeavor, achieving a high energy efficiency of at least 80% is worth it.30
There are many examples of district energy systems in the United States ranging from
systems powering universities, to hospitals, and to portions of cities. One example is right
here at Cornell University. The university has a heating plant with a cogeneration system
that cuts at least 20% of greenhouse gas emissions which amounts to about 89,300 tons
per year. Cold lake water is pumped through a district energy system to cool its building
which leads to decreasing the universities’ cooling need by 86 percent.31
The Netherlands is also a huge proponent of district energy and utilizing efficient energy
systems. Since 2008, the Dutch Foundation for Applied Water Research teamed with
MWH to produce a report indicating how sewage works could generate a surplus of
energy by 2030. 13 of the 26 existing water authorities in the Netherlands are trying to
maximize energy production via enhanced digestion and minimizing all other energy
consumption areas. The key to energy neutrality, as detailed in the report, is via enhanced
primary sedimentation by the addition of chemicals or the addition measure of thermal
hydrolysis of waste activated sludge. Until the year 2030, they would like to achieve a
two percent reduction in energy usage per year; this has created an entire rebranding
effort that is pushing innovation to increase power generation. Currently, Holland wants
to push for “NEWater factories” which can produce its own nutrients, energy and water
from wastes. “The energy factory aims to maximize energy recovery from sewage
sludge; the nutrient factory aims to recover valuable resources (phosphorus) from
wastewater; and the water factory aims to reuse wastewater for different purposes, such
as process water, boiler feed water, recreation water and agricultural water.”32
If the
IAWWTF could use these kinds of technologies to enhance their energy production, they
could easily reach their goal.
30 "What Is District Energy." Environmental and Energy Study Institute. Sept. 2011. Web. 2 Oct.
2014. <http://www.districtenergy.org/assets/pdfs/White-Papers/What-
IsDistrictEnergyEESI092311.pdf>. 31
“What Is District Energy.” 32 Ratcliff, Richard. "The Netherlands Energy Factories." Utility Week.8 Oct. 2011. Web. 2 Oct.
2014. <http%3A%2F%2Fwww.utilityweek.co.uk%2Fnews%2FThe-Netherlands-energy-
factories%2F791632%23.VCWonvldV15>.

26
Grants While briefly going through the NYSERDA funding opportunities, there are a few
relating to the installation of Combined Heat and Power systems in New York State.
Funding ranges from incentives on installation of clean and efficient CHP systems and
other renewable energies to feasibility studies, and to process improvement. The PON
1746 – FlexTech Program has a few criteria for eligible study areas such as detailing
through a report regarding “cost shared studies of energy efficiently technical analysis,
process improvement analyses, energy master plans and demand responses opportunities
of existing facilities for eligible customers.”33
For most studies, NYSERDA can
contribute 50% of the costs up to the lesser of either 1,000,000 or 10% of the annual
energy cost per year.34
More information and paperwork is detailed on the NYSERDA
website. There are also energy generation programs, which includes an Anaerobic
Digester Gas to Electricity, program which offers funding for the purchase, installation
and operation. They are also classified into Capacity incentives and performance
incentives. Another program is the PON 2722; this details proposals for demonstrating
projects that can move a Waste Water Treatment plant to zero net energy.35
Getting
funding through NYSERDA and obtaining one of these grants may be a huge time
investment, however the support provided is invaluable.
Energy Usage in a WWTF
Most wastewater treatment plants in the United States have varied load sizes and
electricity consumption, however the breakdown of energy usage in the plant is similar.
As seen in Figure 1, pumping water accounts for 12% of overall energy demand. This
could mean that the majority of low points in the treatment facility are not that low in
comparison to the plant itself. The highest energy usage is aeration, which means that the
energy required to continually create air bubbles is significant.36
33 "FlexTech Program." NYSERDA. 11 Sept. 2014. Web. 06 Oct. 2014.
<http://www.nyserda.ny.gov/Energy-Efficiency-and-Renewable-Programs/Commercial-
and-Industrial/CI-Programs/FlexTech-Program.aspx>. 34 Gilroy, Tim, and Venice Forbes. "FlexTech Program." NYSERDA. N.p., July 2014. Web. 2 Oct.
2014.<http://www.nyserda.ny.gov//media/Files/FO/Current%20Funding%20Opportunities/PON%
201746/1746summary.pdf.>. 35 Marpicati, Silvia. "NYSERDA: Energy Program Funding Opportunities." New York Water
Association Environment, Summer 2013. Web. 2 Oct. 2014. <http://nywea.org/clearwaters/13-2-
summer/6.pdf>.

27
Figure 2: Percentage Breakdown of Typical Wastewater System Energy Consumption in the U.S.
Energy consumptions do vary depending on size of the plant, efficiency of the
technologies inside the plant, and types and age of technology in the plant. Regarding
efficiencies in California, there are almost 140 wastewater treatment facilities that utilize
anaerobic digesters. However each of these digesters are oversized by at least 15 to 30
percent.37
This could easily be utilized to create more energy for the plant. As another
example of a technologies changes in a treatment facility in North Carolina, which is a
10MGD Activated Sludge WWTP, the total electricity consumed is 8,532 kWh/d. if this
same plant were to add Advanced Treatment with Nitrification, the energy consumption
increases to about 14,412 kWh/d. This is a 69% increase.38
A large-scale facility in the San Francisco Bay Area, East Bay Municipal Utility District,
not only produces electric power but also has a wastewater treatment plant that is a net
energy producer. The plant produces 55,000 MWh/year through its Biogas Production. It
turns food waste collected from restaurants, wineries and many other locations into
renewable energy.39
From an ASCE article regarding the WWTF, the plant has an
average power consumption of 4.5 MW on a daily basis and it can save 3 million dollars
a year by powering itself. In the year of 2012, the utility district will generate up to
$400,000 in excess electricity that will be sold back to the grid. The plant also has around
100 trucks pull in per day, which results in 200 tons of organic waste that will then be
37 "Turning Food Waste into Energy at the East Bay Municipal Utility District (EBMUD)." US EPA.
Environmental Protection Agency, 23 Aug. 2013. Web. 05 Oct. 2014.
<http://www.epa.gov/region9/waste/features/foodtoenergy/wastewater.html>. 38 Menendez,Marco 39 Coate, Alexander. "EBMUD Energy: A Commitment to the Environment." EBMUD.com. Mar.
2012. Web. 6 Oct. 2014. <http://www.ebmud.com/sites/default/files/pdfs/energy-fact-sheet-03-
12_1.pdf>.

28
converted to electricity. The waste goes through the digester and is then pumped to the
Facilities power generation station that has three internal combustion engines which
produce 11 MW in total. In 2012 the plant treats 70 million of wastewater daily which
yields about 7MW of renewable energy.40
Another great example of a WWTF that creates its own energy is the Newtown Creek
Plant in Brooklyn, New York. It has eight anaerobic digester eggs. They process as much
as 1.5 million gallons of sludge every day.41
They currently take in 250 tons per day from
different schools around the area and foresee and increase to 500 tons per day of organic
food waste. The biogas produced from here and from the wastewater treatment process
will hopefully be 100 % reused with help from National Grid. The Department of
Environmental Protection is reusing currently only 40%. National Grid Plans on
converting the biogas into a pipeline quality renewable gas, which is projected to reduce
greenhouse gas emissions by 30% by 2017, compared to an equal quantity of gas from
conventional sources.42
Information and Initial Data
Ithaca Wastewater Treatment plant Ithaca Area Wastewater Treatment Facility (IAWWTF) went to service 1987, and they
currently treat an average of 6.5 MGD of waste. Major portion of the waste is received
from City of Ithaca, and other communities include Town of Ithaca and Town of Dryden.
Most of the waste gets trucked in and the remaining flows through distribution pipes
connected to septic tanks and storm drains. The treated wastewater flows through a 6 inch
pipe to Cayuga Lake.
The primary goal of IAWWTF is to remove Phosphorous, Biological Oxygen Demands
and Solids, which is currently being done at an efficiency of approximately 90%.
40 Boranyak, Sharon. "Wastewater Plant Turns Food Into Electricity." Wastewater Plant Turns
Food Into Electricity. American Society of Civil Engineers, 1 May 2012. Web. 05 Oct. 2014.
<http://www.asce.org/CEMagazine/Article.aspx?id=25769808234#.VDKqy_ldXEt>. 41 "The Newtown Creek Digester Eggs." Newtown Creek Digester Eggs. NYC Environmental
Protection, 2014. Web. 03 Oct. 2014.
<http://www.nyc.gov/html/dep/html/environmental_education/newtown_digesters.shtml>. 42 "New York City Converts Waste to Biogas and Improves Emissions." Energy Digital. N.p., 14
Apr. 2014. Web. 02 Oct. 2014. <http://www.energydigital.com/renewables/3408/New-York-City-
converts-waste-to-biogas-and-improves-emissions>.

29
Major Source of Waste IAWWTF receives waste primarily from three different sources; Septage from residence,
Food waste from large institutions and industrial waste from the local community.
Septage – Currently, Septage constitutes to 80% of the waste that flows into the
facility. IAWWTF has a piping capacity 100,000 people mainly from City of
Ithaca, town of Ithaca Dryden. The above capacity of Septage is in addition to the
waste that’s gets trucked into the facility.
Food Waste – Large institution in the community like Cornell University and
Ithaca College contribute to the major part of the food waste that’s gets trucked in
to the facility. There is lot of additional capacity available, and the plant owners
are trying to negotiate with the community to increase the flow of food waste.
Information about available food waste from Ithaca and Tompkins County was
provided by Dr. Jose Lozano at IAWWTF, and was originally obtained from local
studies by Jean Bonhotal and Joe Usack.
Other Sources – To maximize the flow, the plant owners are trying to bring in
more waste from industries in the community, which also includes animal carcass
from veterinary college.
From these sources of waste, we can understand the flow of energy and waste into the
plant and out via biogas and landfill waste. The biogas in then converted to energy, and
heat though the combined heat and power turbines. With the information given to us from
CHP efficiencies and amount of waste coming in and energy conversion factors, we were
able to create a working flow diagram for the plant.

30
Figure 3: Flow Diagram for IAWWTF, showing material, financial, and energy flows through the system.
Waste Processing IAWWTF processes waste in three different stages, primary, secondary and tertiary.
Major input to the facility is the waste, which flows through pipeline or trucked into the
facility. The primary stage includes gravity settling, where the heavy sludge gets
separated from the wastewater. The wastewater moves to the second stage of Activated
Sludge Process. This is the stage where most of the energy produced/purchased is used.
In this process, aerobic microorganisms are introduced to the clarified wastewater under
constant aeration. The microorganisms assimilate organics in the wastewater, and the
heavy sludge with organisms gets separated.
The tertiary process is where chemicals such as ferric chloride and polymers are
introduced to separate phosphorous from wastewater. The waste is chlorinated for
disinfection and de-chlorinated before entering the pipeline to Cayuga Lake. The waste
sludge that’s gets separated at the three different stages is dewatered and sent to the Bio-
digesters. The anaerobic digestion occurs to reduce the total biomass. The waste is
digested for 28 days at 98°F, to produce Biogas. The waste sludge is again dewatered and
made into a dry cake, which is transported to landfill.

31
CHP Initiative of IAWWTF The biogas produced from the bio-digesters is run through the Combined Heat and Power
(CHP) system. In early 2000, the government realized that 3% of the nation’s produced
electricity was being consumed in treating water and waste. They requested the
Environmental Protection Agency (EPA) to come up with an initiative for wastewater
treatment plants to implement alternate sources of energy such as solar energy systems,
wind turbines, hydro turbines and CHP systems. The EPA has also promoted the
Pumped Energy Recovery Program (PERP) as a way to make plants, such as the Point
Loma plant near San Diego, CA, more efficient.
Wastewater Treatment Facilities (WWTF’s) nationwide responded to this initiative and
they tried to adopt technology, which is more suitable for them, depending on the
infrastructure available. For example, one of the country’s largest waste treatment
facilities, Point Loma in San Diego, implemented hydro turbines, considering the fact
that they have a 90 feet waterfall when the effluent flows into ocean. Similarly, other
plants started implementing alternate energy sources, which were more suitable and met
their energy demand. Two other potential sources of energy, which were being widely
deployed, were Solar Photovoltaic systems and Combined Heat and Power (CHP)
systems.
In 2007, the EPA released its report identifying opportunities for CHP systems at
wastewater treatment plants. The report considered that this new technology is beneficial
for facilities with more than 5 MGD of flow, but later trials were conducted to include
facilities with flow rates of 1 to 5 MGD. Based on this initiative and with an influent flow
rate of 6 MGD on average, the IAWWTF adopted the CHP system in 2008. The CHP
system has many benefits such as 80% efficiency, reduction of capital and operational
costs, and production of clean energy with limited CO2 emissions. Table 3: Number of U.S. Wastewater Treatment Facilities with Anaerobic Digestion and without CHP
WWTFs Flow Rate Range (MGD)
Total WWTFs
WWTFs with Anaerobic Digestion
Percentage of WWTFs with Anaerobic Digestion
>200 10 7 70%
100-200 18 13 72%
75-100 25 17 68%
50-75 24 17 71%
20-50 137 82 60%
10-20 244 140 57%
5-10 451 230 51%
1-5 2262 845 37%
Total 3171 1351 43%43
43 Clean Watersheds Needs Survey 2004 Report to Congress. Washington, D.C.: United States
Environmental Protection Agency, Office of Water, 2008.Environmental Protection Agency. Jan.

32
The CHP system takes in variety of fuel sources such as natural gas, biomass, biogas and
coal, to produce both heat and electricity. The current consumption of the IAWWTF is
334,200 kWh a month; with an increase in the flow of waste in the future, this demand
will increase. With the current rate of production of biogas, the IAWWTF is able to
manage 60% of its energy demand using the electricity produced from the CHP system.
The heat produced from the CHP turbines is currently being used to heat the bio-
digesters.
District Energy In 2006, Ithaca Common Council approved a plan to reduce the energy consumption in
the community by 20%. Based on this initiative, a project to create District Energy –
Combined Heat and Power Microgrid was proposed in Ithaca. The projects will create a
12 mW grid to power residences and other commercial developments, built on a land area
of 3.5 million sq.ft. The plan was to produce excess electricity using the existing CHP
turbines and at the same time install solar panels on the rooftop of the buildings. The
aerial view of the proposed development can be seen in the picture below.
Figure 4: Ithaca Energy District
This initiative will produce clean energy, which will eventually reduce the CO2 emission
in the community. There are over 100 wastewater treatment plants in the country and
every plant has an influent capacity ranging from 1 to 400 MGD of waste. The combined
potential of these plants have been ignored for a long time until EPA released a report
with the benefits of producing energy using WWTF. The below table provides a
2008. Web. 7 Oct. 2014. <http://water.epa.gov/scitech/datait/databases/cwns/upload/cwns2008rtc.pdf>.

33
comparison on the electricity potential of the WWTF in U.S and the amount of CO2
emission which can be reduced. The estimate of 411 MW provided in the table and the
potential savings of 3 million metric tons of Co2 is based on the assumption that the plant
uses all the produced electricity and excess power is not exported to the grid. But, for
economic reasons, part of this produced electricity is being sold to the grid to generate
revenue and meet the operational expenses.
Table 4: Potential Carbon Dioxide Emissions Displaced with CHP at Wastewater Treatment Facilities
Input/output Value
Electrical potential at WWTFs with anaerobic digesters
411 MW
Total annual electricity production (Assumes year round production)
3,600,000 MWh
Adjusted all fossil average CO2 emissions factor
1860 CO2 / MWh
Total displace CO2 emission 3,000,000 metric tons CO2 / year
Equivalent number of passenger vehicles 600,000
44
Key parameters considered for model 1. The design capacity of the plant is 13.1 MGD and the average flow of sewage
daily is 6.5 MGD.
2. The average BOD of the treated water released into Cayuga Lake is
approximately 11 mg/L.45
3. Energy demand of the plant at the current capacity is 334,200 kWh/month.
4. Expenditure:
Unit cost of electricity purchased from the grid is $0.105 per kWh.
The avoided cost of selling electricity back to the grid is $0.08 per kWh.
Solar panels for the new development will be installed at the rooftop.
5. For the purpose of optimization, the land area considered in IED is 170,000 sq.ft
and the number of residences expected in this area is 300.
6. The solar system installed on the rooftop has an ability to produce 4.33 W per
sq.ft
44 Opportunities for Combined Heat and Power at Wastewater Treatment Facilities: Market
Analysis and Lessons from the Field 45 "Wastewater Treatment." City of Ithaca NY. N.p., n.d. Web. 4 Oct. 2014.
<http%3A%2F%2Fwww.cityofithaca.org%2F331%2FWastewater-Treatment>.

34
7. NSERDA has come up with a program to provide subsidy for industries
producing over 200 kW of electricity using solar system. To account for the
subsidy, the model uses $120 per kW per year as the annual capital expenditure
for solar against the $179, which is the actual capital cost for solar. This is based
on the assumption that the plant as subsidy will receive $59 per kW per year.
Table 5: Cost per Energy Source
Source: Annual Capital Subsidy Total annual cost
$/kW/yr. $/kW/yr $/kW/yr
Solar 179 59 120
Biomass 363 - 363
Source: Operational Cost
$/mWh
Solar 4
Biomass 25
Optimization and Modeling In order to calculate profit estimates for the four scenarios that we considered, we utilized
the Solver functionality through Excel. By exploring information unique to the IAWWTF
and specific to each constraint, we were able to set constraints on our variables and find
decision values for maximizing capacities for our solar and biogas infrastructures.
The variables we solved over were the following:
We constrained the model using plant and residential energy demand, as well as
capacities of solar and biomass.
The overall goal for each of the scenarios was to increase total revenue, a sum of the
revenue gained from selling and buying energy, and tipping profit, a sum of profit earned
from collecting tipping fees, paying tipping fees, and selling bio-cakes to various farms.

35
Costs consist of operating costs, dependent on energy usage, and a capital cost over 20
years, for each of the two energy resources.

36
Current Status The Ithaca Area Wastewater Treatment Plant currently uses 4 microturbines that have a
total rated capacity of 260 kW of electricity. The turbines have around 92% capacity
factor so the plant actually has a capacity of 234 kW. Over the year, biomass capacity
amounts to 2,049,840 kWh. In addition, the plant has 7.5 kW of Solar Panels already
installed which also generate electricity for them.46
These solar panels can produce about
9,195 kWh during the year based solar capacities per month. This value is similar to the
National Renewable energy Labs (NREL) figure of 1,228 kWh per kW which amounts to
9,210 kWh/yr. Currently, this solar production is less than 0.28 percent of total plant
demand, and it ranges from 0.33 to 0.54 percent of total energy produced.
After assuming annual capital costs and annualized operational costs per kW per year,
our total capital cost from Solar and Biomass are $1,343 and $94,380 respectively which
totals to $95,723. The total operational costs for each are $37 and $51,246, which amount
to $51,283 per year. With this initial investment per year, the 260 kW of turbine capacity
and 7.5 kW of solar capacity can produce 2,049,840 kWh per year and 9,195 per year
respectively. The plant requires 334,200 kWh per month and the combined kWh from
solar and biomass usage yields about 47% to 52% of the plant’s total electricity.
By producing some energy from the microturbines and solar panels, the plant can avoid
some electricity costs, but there is still a net cost of $125,668 because energy still needs
to be bought from the grid. The unit cost of electricity used in our analysis is $0.0644 per
kWh. In addition, the plant can gain revenue from trucking fees; in 2013, there was a
revenue of $20,413 from tipping fees. The landfill fee per day is $687 per day. On
average the tipping fee was $0.03 per gallon, but the price varied according to different
waste types. As discussed previously, the different waste steams entering the plant from
trucked waste are Septage, Grease, Portable Toilet waste, Water, Whey, Lechate,
Industrial sludge from factory sites and Municipal Sludge. Septage, Grease, Portable
Toilet Waste and both Industrial and Municipal sludge have a tipping fee of five cents.
Water and leachate have a fee for one cent and Whey has a fee for three cents. For the
year 2013, total revenue from trucking in waste is about $271,167 and the avoided
landfill fee is negative $250,755. Therefore the overall revenue from quantity of gallons
tipped was greater than the price of sending wastes to the landfill.
Figure 5 below indicates the number of gallons that arrived at the plant from a specific
waste stream in the year 2013. It is clearly visible that septage is the largest contributor to
46
Note that the contribution of the 7.5 kW array to this industrial-size electric load is quite small. The 7.5 kW array produces, at a local to Ithaca figure from the National Renewable Energy Laboratories of 1,228 kWh per kW per year, about 9,200 kWh per year.

37
the waste. We used these yearly quantities to help us solve for an accurate revenue value
from trucking waste.
Figure 5: Gallons of Waste in 2013
From the combined annualized investment of $147,005, negative revenue of $125,668
from buying electricity, and positive revenue from tipping fees of $20,413, the net
revenue of the plant right now is negative $252,260. The Ithaca Area Wastewater
Treatment Facility is currently in a deficit and codependent on the grid, and should look
into a way to make more money. The scenarios that follow show different ways for the
plant to make money and energy.

38
Scenario Analysis Understanding the current situation and the different energy sources IAWWTF wanted to
utilize the team created four different scenarios which would take advantage of the
IAWWTF’s technology, the areas resources, and producing as much energy as possible.
The first scenario emphasizes self-sufficiency by increasing biomass intake for just the
combined heat and power system to be just enough to power the facility. The second
scenario deals with using both biomass and solar where biomass is capped at 800 kW due
to limitations in the Tompkins County area and solar energy was capped at 3,000 kW.
With the latter constraint, the team noticed that no solar was being allocated therefore we
placed a minimum constraint on solar dependent on the number of residences being built
in the new development. This scenario also details how solar grants can positively affect
the solution. Scenario three deals with using some trucked waste (like grease) and the
energy produced from biomass and solar energy to create biodiesel. The premise behind
scenario four is to reinvest any revenue produced by the model into hydro-turbines to
harness some of the hydraulic energy in the plant.
Scenario 1:
The premise behind this first scenario is for our optimization model to produce just
enough energy (from just biomass) for the plant so that it becomes self-sufficient. This
means that every month about 334200 kWh must be produced. This can be achieved by
adding 5 more microturbines which yields about 585 kW of maximum capacity. In order
to achieve 334,200 kWh per month, only 553 kW of biomass needs to be harvested but
since adding 4 more turbines (a total of 8 microturbines) only yields a maximum capacity
of 520 kW, this was not a feasible solution. By adding 5 more turbines, capital costs and
operational costs increase but since we are not including the existing turbines, the total
new annualized capital investment is $106,206. Since the operational costs will always be
incurred it increases to $100,260, which yields a final sum of $206,466.
One major difference in this scenario is that since all the energy the plant needs is
produced in-house, the avoided cost is higher and no energy needs to be purchased from
the grid. This creates a net revenue of $421,092 dollars. The avoided cost of purchasing
energy is about $0.105 per kWh.
Initially, trucking fees and landfill fees were included but since we could not accurately
assess how to expand our current calculations, we assumed that tipping fees would equal
landfill fees. We are assuming that this process is revenue neutral because tipping fees
coming in minus the cost for sending out waste includes the cost of transporting the waste
from the plant to the landfill, therefore it is truly revenue neutral. Since we are expanding
our biomass intake from 260 kW to 553 kW the amount of biogas generation needs to
increase from 135,000 cubic feet per day to 286,000 cubic feet per day. This is a 2.12

39
times increase in biogas requirement which does mean that more trucked waste will need
to come in, but just as much waste will need to be sent to landfill. In the future, if a
market can be found for waste products leaving the IAWWTF that are currently being
landfilled, then the combination of tipping and landfilling fees might become a net
positive revenue stream. In addition, other modes of transportation, like trains, can be
investigated to cut down costs to the landfill and create a net profit from the tipping fees.
With an initial investment of $206,466 and revenue of $421,092 from avoided electricity
costs which yields net revenue of positive $214,626 per year.
Scenario 2: The goal of the second scenario is to use the CHP system and solar photovoltaics to
produce enough energy to make the IAWWTF self-sufficient, and to produce adequate
energy for 300 homes in the proposed Inlet Energy District. These 300 homes have an
estimated footprint (roof space) of 170,000 square feet and a demand of 1,503,880 kWh
per year. In addition to the IAWWTF’s demand of 334,200 kWh per year, it is found that
the total demand for Scenario 2 is 1,838,080 kWh per year.
Under Scenario 2, there are two possible ways to meet the desired demand. Option A is to
use only the CHP system and biomass. This was the outcome from the optimization
model with no constraint on the minimum amount of solar capacity. In this case, the
optimal turbine capacity is approximately 800 kW, which results in an annualized capital
cost of $196,000. In addition to the capital costs, there is also an annualized operational
cost component that totals $157,000. Assuming a sellback price of $0.08 per kWh, after
producing enough energy for the plant and the surrounding 300 residences, the excess
electricity can be sold to the grid for annual revenue of $694,000. This results in net
revenue of $341,000 per year for the plant.
It should be noted that Scenario 2A assumes that there is enough food waste and other
material to adequately power the 800 kW turbine system. Based on initial findings, total
food waste biogas production in Tompkins County is enough to meet that demand.
While the above scenario is adequate to produce the needed energy, there is a strong
desire to consider not only financial impacts, but also social and environmental. These
three considerations, known as the triple bottom line, are why Scenario 2B, which
includes solar power, has been included in this analysis. The demand is as stated above,
1,838,080 kWh per year, but there is now a solar array in addition to the 800 kW turbine
systems. To encourage further development of the Inlet Energy District, the solar panels
will be mounted on rooftops to minimize land use. The solar array for Scenario 2B will
be built on the proposed 170,000 square foot Inlet Energy District residential
development.

40
For a typical solar system, a capacity of 4.33 kW/sq ft is reasonable47
, which allows for
the installation of a 737 kW solar system. The annualized capital cost of this solar system
and the turbine buildup, to reach 800 kW, is $284,000. This capital cost includes an
estimated subsidy of one-third of total costs, for the installation and purchasing of the
solar panels. These subsidies are from both the United States government and state-wide
subsidies offered by New York State. The operational costs for the solar and turbine
combination is only $4,000 more per year than the turbine system on its own, but the
plant can now generate yearly revenues of $767,000. When considering the increased
annualized capital and operational costs, the option to use solar may seem unappealing,
but with the conservatively estimated subsidies, the combination of systems results in a
yearly net revenue of $321,000.
While Scenario 2B has lower yearly net revenue, when considering the triple bottom line,
it is still a favorable option. A diversified renewable energy portfolio not only decreases
volatility in production based on weather or incoming materials, but also decreases
environmental impact. Therefore, Scenario 2B is preferred to Scenario 2A.
Scenario 3: Along with using the CHP system and solar photovoltaics to produce enough energy to
IAWWTF and to produce adequate energy for 300 homes in the proposed Inlet Energy
District, we also want to use the grease from the food waste to produce biodiesel to
supply moderate amount of fuel for TCAT. In 2012, there were 54 TCAT buses operating
and 48 of them were using diesel as their fuel. The annual diesel usage of TCAT was
410,000 gallons. If we produce an adequate amount of biodiesel and sell it to TCAT, not
only does IAWWTF generate more revenue, but the project is good for the environment.
TCAT buses will emit much less pollutant by using biodiesel than by using the same
amount of petroleum diesel.
The annual grease coming into IAWWTF is 294,350 gallons worth. On average, there are
approximately 800 gallons coming in per day, so we use 10 80-gal biodiesel processors
with 40 kWh per batch to produce biodiesel. Assume 100% of the grease can be used to
produce biodiesel, and the conversion factor is 0.75 (1 gallon of grease can produce 0.75
gallon of biodiesel), the annual biodiesel production is 220,763 gallons. With the price of
$3.50 per gallon, the annual revenue generated from biodiesel is $772,668.75. The total
equipment cost of biodiesel production system is $175,950. The annualized equipment
cost is $16,608.44 with 7% discount rate during a 20 years period. The system also
requires methanol and potassium as the additives. So the annual processing cost is
$463,601.25. We do not include the electricity in the model because the electricity
needed is relatively small (no more than 13 MWh per month). The electricity produced
47
This figure is obtained from the Ecovillage at Ithaca 54 kW array.

41
from the CHP system can cover the electricity usage of biodiesel production system.
With $772,668.75 as revenue and $480,209.69 as cost, the net revenue per year for
producing biodiesel is $292,459.06.
Another option for producing biodiesel is to first make bio-methane in the biodigester,
and then instead of combusting this methane in the CHP, react it to make biodiesel. This
approach was avoided for two reasons. First, the data available to the extent that we
could find it in the literature give only a total cost per gallon, and it is not transparent how
the cost is derived, so that it is difficult to work with such a figure whose components are
not known. Second, the figure is $3.11/gallon for production cost, which is so close to
the sale cost of $3.50/gallon. The price of biodiesel is decreasing in recent years, so the
production cost of converting biodiesel from biogas is not attractive.
We also compare the production of electricity versus the production of biodiesel with the
same amount of grease. The electricity production is 1,196,975 kWh per year. With the
unit price of $0.105 per kWh and buying the capacity from the grid, the net revenue is
$71,682. If we do not consider buying the capacity, the net revenue is $125,682, which is
still lower than the net revenue of the biodiesel.
As grease contains more energy than the other food waste, we lower the biomass
maximum capacity to 710 kW and add 13 MWh more per month in the monthly demand
constraint in our model. The revenue from selling electricity to the grid is $719,876.96,
and the revenue from biodiesel is $292,459.06. With the total cost of $875,555 per year,
the net revenue of the system is $616,991 per year, which is the most profitable of the
three scenarios.
Scenario 4
In the fourth scenario, we use the revenue as the funds for the hydropower investment
and power the plant and residences. There are three types of hydro turbines available for
IAWWTF: vertical turbine, horizontal turbine, and VLH turbine. Head range required of
the turbines varies from 4.2 feet to 10.5 feet and flow changes from 0.16 million
gallons/day to 0.48 million gallons/day.
Vertical turbine, just as the name implies, lets the effluent flow from the top of the
turbine to the bottom of the turbine. The horizontal turbine lets the effluent go through it
without any head changes. Both of the turbines require high construction cost, and they
require diversion systems to protect them when large volume of the effluent comes such
as storm and flood. The third type of turbine, VLH turbine generating set is double
regulated with both adjustable blades and variable speed. This allows operation on sites
where the head drops with variations in flow. The VLH turbine is able to work under 1/3

42
of the normal head while maintaining normal efficiency, and does not require diversion
system. It can be lifted when flood comes. However, the equipment cost of VLH turbine
is huge. For example, model DN 3150 (10.3 feet diameter), operating at 5.9 of head, and
a flow of 0.14 million gallons per day (MGD) can produce 118 kW, but the equipment
cost is approximately $575,000. All of the three types of turbines have too many
complexities, and the costs are huge. Therefore, scenario 4 is infeasible for the plant now,
but it is a good alternative to be considered in the future.
For future hydropower investment, Dan Ramer, from IAWWTF, did an initial analysis
and suggested that a 7.5 kW turbine might possible for the plant. As the treated water
leaves the plant continuously, assume 5% downtime for maintenance, the turbine can run
95% of the time at full power. With 8,760 hours per year, the turbine can produce
approximately 62,000 kWh per year, which is about 1.5% of the annual demand. Even
though the amount of electricity is small, the turbine is very cost effective and worth
doing.
Scenario Comparisons Table 6: Scenario Comparison
SCENARIOS PROS CONS
Scenario 1: Use only
CHP to power the
entire plant
• Self-reliant for
electricity.
• No need to buy
electricity from the
grid.
• Difficult to sustain
the surrounding
development
Scenario 2: Use all
additional food waste
to produce biogas
• Uses CHP and Solar to
power the facility and
its surroundings to
become self-reliant
• Reduce impact on
landfill
• May need to buy
from the grid/invest
more money into
technology if energy
produced isn’t
sufficient
Scenario 3: Use
additional food waste
to produce biogas and
biodiesel for TCAT
• IAWWTF could
generate more revenue
in the long run
• Start creating a
microgrid
• High capital cost to
invest in technologies
to convert biogas to
biodiesel
Scenario 4: Use all
additional food waste
to produce biogas and
invest funds into
Hydro-turbine
• Generate more energy
for plant
• High Capital Cost
• Unrealistic supply of
biomass is necessary

43
Final Recommendations Based on our analysis, we recommend Scenario 3 to IAWWTF. Use the grease from the
food waste to produce biodiesel and sell it to the TCAT, and use the rest of the biomass to
produce the biogas as the fuel for CHP system accompany with solar photovoltaics to
produce enough energy IAWWTF and to produce adequate energy for 300 homes in the
proposed Inlet Energy District.
The advantage of Scenario 3 is that it generates the most profit, which is $616,991 per
year, and it is self-sustaining. It not only does not need to buy electricity from the grid,
but it can also sell the excess energy back to the grid. It is also very important that it
reduces much pollution from the bus emissions if TCAT replaces diesel to biodiesel, and
TCAT does not need to pay extra money to change the current bus diesel engine.
However, there are also some disadvantages: it requires more supply of food waste and
the operating cost of biodiesel processors is high. Based on the current food supply, we
can supply half amount of biodiesel needed from the TCAT, but the system needs much
more food waste to reach the 710 kW maximum capacity of biomass. Moreover, the price
of additives for biodiesel production is high. If we produce more biodiesel to reach the
TCAT demand, the operating cost of biodiesel can be twice as much as current cost,
which is approximately $927,000.
Future Projects While this study had a wide ranging scope, in particular regard to CHP energy production
and the incorporation of solar energy to power the IAWWTF and the proposed Inlet
Energy District, there are future projects that will not only benefit the IAWWTF but also
the surrounding area. As future projects, these can contribute valuable insights to the
further expansion of alternate energy and the positive environmental impact that the
IAWWTF can have on Ithaca and its surrounding communities.
The first future project is to explore Scenario 4, which, as previously outlined, involves
the installation of a hydro-turbine. This proposed addition to the IAWWTF would
increase electrical energy production with no additional waste streams needed. If feasible,
this is an extremely clean form of energy production and provided proper safety features
for overflow, very safe and reliable as well. Key parameters that would impact the
feasibility of a hydro-turbine is head height of the water leaving the treatment facility,
flow rate needed to produce significant energy, and the time required to divert the
outflow and install the turbine. As an initial exploration into this technology the
following table summarizes different turbine types, required flow rate and head height,
potential electricity generation and estimated cost. With a wide range of costs and energy

44
production, this future project would require an investigation into which turbine best fits
the IAWWTF outflow pipe and how the project can be completed with as disruption to
the plant as possible. Some information about possible turbine models and manufacturers
is given in Table 2: Comparison between Different Low-Head Turbines.
According to Dan Ramer from IAWWTF, an initial analysis suggested that the rate of
flow might support a 7.5 kW turbine. Assuming water leaves the plant continuously, it
could reasonably be assumed that this turbine could run 95% of the time at full power
(allowing 5% downtime for maintenance or other requirements). With operations for 95%
of the year, or 8,322 hours, the hydro-turbine can produce roughly 62,000kWh/yr. (this
value is obtained by multiplying 7.5kW by 8,322h/yr. This is about 1.5% of annual
demand. Thus the contribution is small compared to the CHP systems or large solar PV
arrays, but it may be very cost-effective and therefore worth doing. If a more detailed
analysis shows that the flow can support a larger turbine capacity, the annual savings
from avoided electricity cost would be larger.
As a separate future project the IAWWTF could expand its influence to more
communities. This would be in terms of energy production and wastewater processing as
well as the gathering of food waste. With an increase in food waste from other
communities, the IAWWTF would be able to further grow their CHP system and produce
more electricity. Assuming the proposed Inlet Energy District is built, the IAWWTF
would then have thousands of more residents to collect waste from and produce energy
for. In an ideal situation this would assist in the creation of a micro-grid in Ithaca and
lead to the production of cleaner and more affordable energy.
For this feasibility study, tipping fees, a revenue, and transportation fees, a cost, were
assumed to be approximately equal, thus resulting in a zero net revenue for tipping fees.
As more waste is brought to the plan, tipping fees will increase which, along with the
energy production, will increase revenue for the IAWWTF. But this will also result in
higher costs for transporting waste from the plant due to its increased inflow. There is an
opportunity to sell the IAWWTF output, bio-cakes, to agricultural sites, which can
decrease costs and increase revenues. A study looking at the potential for bio-cakes and
ways to decrease landfill costs is essential so that further expansions to the IAWWTF can
be accurately projected. Delivery of waste food by train instead of truck might provide a
way to reduce transportation cost, since the plant is adjacent to a train line.
While it is known that CHP systems and solar energy are cleaner compared to fossil
fuels, this study did not quantify the true environmental impact of using these
technologies. By creating green energy, the IAWWTF is reducing its CO2 load, but the
increase in trucking to get the waste to the facility and to transport their end product to a

45
landfill, increases the CO2 load. On the other hand, this waste is probably being moved
by truck at present, with the likely destination of a landfill, so that this CO2 burden would
need to be considered as well. The net impact of the CHP system, digesters, potential
production of biodiesel and other plant activities would also contribute the overall CO2
produced by the plant. Comparing past emissions, estimated future emissions and
determining a net CO2 savings would provide an additional criterion to judge proposed
plant expansions.
Another extension would be to evaluate the economic benefits of green electricity. The
analysis considers only the avoided cost of buying electricity, and does not consider the
benefit of producing green electricity from bio-waste. Bio-waste that is converted to an
economically useful fuel such as biological natural gas or biodiesel is eligible for
Renewable Identification Numbers, or RINs. When electricity is created with these
feedstocks, the RINs are transferred to the electricity, which then becomes eligible for a
premium price.
An additional research topic is the thermal content of the water leaving the plant as a heat
source for district heating. The temperature of the water leaving the plant is 50-70F year
round, so in the future this might be used to help heat buildings. One way to use the heat
is to preheat water before it is heated to the appropriate temperature for hydronic heating
of residential space. Another way to use it is with a heat pump system. Like a home heat
pump that uses compression and expansion of the working fluid to transfer heat from
under the earth at 50 degrees F into a heated space at 65-75 degrees F, compression and
expansion would allow heat transfer from the effluent water to the heated space, even
though the latter is at a higher temperature than the former.
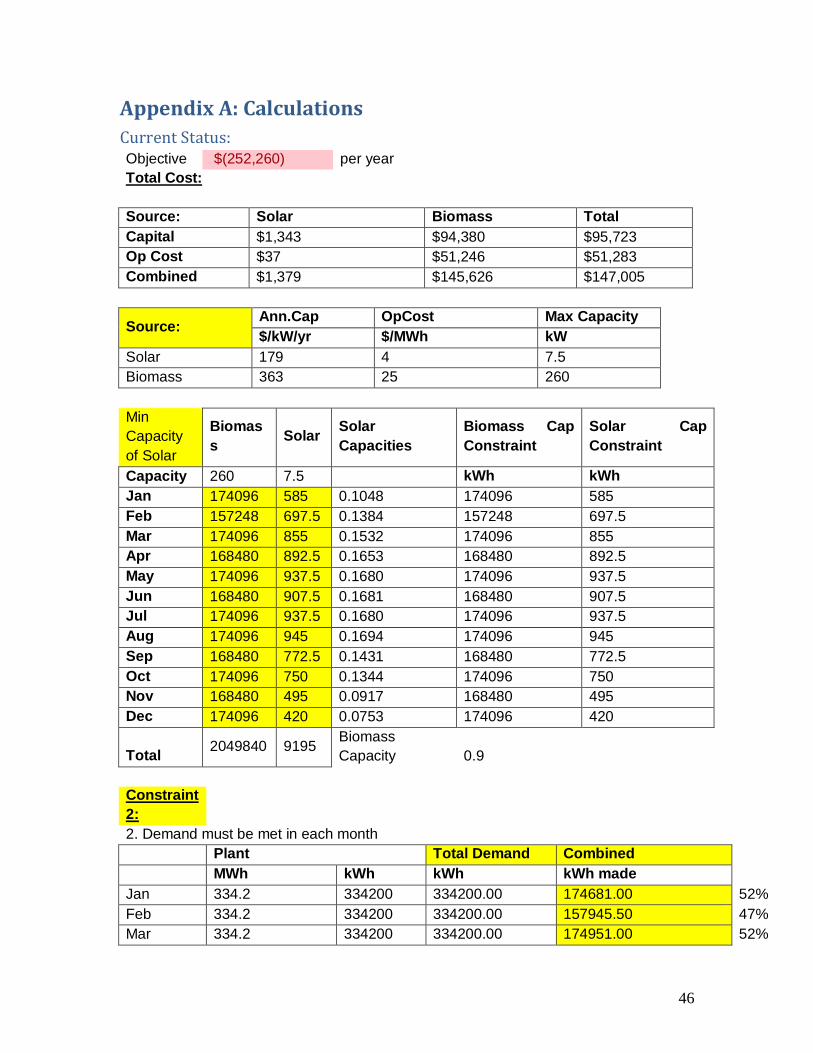
46
Appendix A: Calculations
Current Status: Objective $(252,260) per year
Total Cost:
Source: Solar Biomass Total
Capital $1,343 $94,380 $95,723
Op Cost $37 $51,246 $51,283
Combined $1,379 $145,626 $147,005
Source: Ann.Cap OpCost Max Capacity
$/kW/yr $/MWh kW
Solar 179 4 7.5
Biomass 363 25 260
Min
Capacity
of Solar
Biomas
s Solar
Solar
Capacities
Biomass Cap
Constraint
Solar Cap
Constraint
Capacity 260 7.5 kWh kWh
Jan 174096 585 0.1048 174096 585
Feb 157248 697.5 0.1384 157248 697.5
Mar 174096 855 0.1532 174096 855
Apr 168480 892.5 0.1653 168480 892.5
May 174096 937.5 0.1680 174096 937.5
Jun 168480 907.5 0.1681 168480 907.5
Jul 174096 937.5 0.1680 174096 937.5
Aug 174096 945 0.1694 174096 945
Sep 168480 772.5 0.1431 168480 772.5
Oct 174096 750 0.1344 174096 750
Nov 168480 495 0.0917 168480 495
Dec 174096 420 0.0753 174096 420
Total 2049840 9195
Biomass
Capacity 0.9
Constraint
2:
2. Demand must be met in each month
Plant Total Demand Combined
MWh kWh kWh kWh made
Jan 334.2 334200 334200.00 174681.00 52%
Feb 334.2 334200 334200.00 157945.50 47%
Mar 334.2 334200 334200.00 174951.00 52%

47
Apr 334.2 334200 334200.00 169372.50 51%
May 334.2 334200 334200.00 175033.50 52%
Jun 334.2 334200 334200.00 169387.50 51%
Jul 334.2 334200 334200.00 175033.50 52%
Aug 334.2 334200 334200.00 175041.00 52%
Sep 334.2 334200 334200.00 169252.50 51%
Oct 334.2 334200 334200.00 174846.00 52%
Nov 334.2 334200 334200.00 168975.00 51%
Dec 334.2 334200 334200.00 174516.00 52%
4010400 4010400.00
Revenue From Selling Energy
Total Produced Net kWh
Excess kWh
Produced Total Revenue
(kWh) (minus plant)
174096.00 -160104.00 -159519.00 $(10,273)
157248.00 -176952.00 -176254.50 $(11,351)
174096.00 -160104.00 -159249.00 $(10,256)
168480.00 -165720.00 -164827.50 $(10,615)
174096.00 -160104.00 -159166.50 $(10,250)
168480.00 -165720.00 -164812.50 $(10,614)
174096.00 -160104.00 -159166.50 $(10,250)
174096.00 -160104.00 -159159.00 $(10,250)
168480.00 -165720.00 -164947.50 $(10,623)
174096.00 -160104.00 -159354.00 $(10,262)
168480.00 -165720.00 -165225.00 $(10,640)
174096.00 -160104.00 -159684.00 $(10,284)
2049840.00 -1960560.00 $(125,668)
Revenue from Tipping Fees
Quantity Tipped Total Revenue Avoided Landfill Fee Net Revenue
(gallons) ($) ($) ($)
701349 19077.07 $(21,297.00) $(2,219.93)
739146 20700.86 $(19,236.00) $1,464.86
851704 24775.3 $(21,297.00) $3,478.30
883621 30080.13 $(20,610.00) $9,470.13
810208 33301.02 $(21,297.00) $12,004.02
567424 24872.5 $(20,610.00) $4,262.50
483618 21666.1 $(21,297.00) $369.10
514906 23613.3 $(21,297.00) $2,316.30
441701 20757.05 $(20,610.00) $147.05
485576 22150.8 $(21,297.00) $853.80
394805 18072.25 $(20,610.00) $(2,537.75)

48
291556 12101.8 $(21,297.00) $(9,195.20)
Net revenue from tipping fees $20,413.18
Scenario 1: Objective $214,626 per year
Total Cost:
Source: Solar Biomass Existing infra Total
Capital $0 $200,586 $94,380 $106,206
Op Cost $0 $100,260 $51,246 $100,260
Combined $0 $300,846 $145,626 $206,466
Source: Ann.Cap OpCost Max Capacity
$/kW/yr $/MWh kW
Solar 120 4 0
Biomass 363 25 565
Biomass Solar
Solar
Capacities
Biomass Cap
Constraint
Solar Cap
Constraint
Capacity
552.579365
1 0 kWh kWh
Jan 334200 0 0.1048 370007.14 0
Feb 334200 0 0.1384 334200.00 0
Mar 334200 0 0.1532 370007.14 0
Apr
334200.138
4 0 0.1653 358071.43 0
May 334200 0 0.1680 370007.14 0
Jun
334200.138
4 0 0.1681 358071.43 0
Jul 334200 0 0.1680 370007.14 0
Aug 334200 0 0.1694 370007.14 0
Sep
334200.138
4 0 0.1431 358071.43 0
Oct 334200 0 0.1344 370007.14 0
Nov
334200.138
4 0 0.0917 358071.43 0
Dec 334200 0 0.0753 370007.14 0
Constraint 2:
2. Demand must be met in each month
Plant Total Demand Combined

49
MWh kWh kWh kWh made
Jan 334.2 334200 334200.00 334200.00
Feb 334.2 334200 334200.00 334200.00
Mar 334.2 334200 334200.00 334200.00
Apr 334.2 334200 334200.00 334200.14
May 334.2 334200 334200.00 334200.00
Jun 334.2 334200 334200.00 334200.14
Jul 334.2 334200 334200.00 334200.00
Aug 334.2 334200 334200.00 334200.00
Sep 334.2 334200 334200.00 334200.14
Oct 334.2 334200 334200.00 334200.00
Nov 334.2 334200 334200.00 334200.14
Dec 334.2 334200 334200.00 334200.00
4010400 #DIV/0! 4010400.00
Revenue From Selling Energy
Total
Produced Net kWh Excess kWh Produced Total Revenue
(kWh) (minus plant)
334200.00 0.00 0.00 $35,091
334200.00 0.00 0.00 $35,091
334200.00 0.00 0.00 $35,091
334200.14 0.14 0.14 $35,091
334200.00 0.00 0.00 $35,091
334200.14 0.14 0.14 $35,091
334200.00 0.00 0.00 $35,091
334200.00 0.00 0.00 $35,091
334200.14 0.14 0.14 $35,091
334200.00 0.00 0.00 $35,091
334200.14 0.14 0.14 $35,091
334200.00 0.00 0.00 $35,091
4010400.55 0.55 -4010400.00 $421,092
Scenario 2A: Objective $341,297 per year
Total Cost:
Source: Solar Biomass Existing infra Total
Capital $0 $290,400 $94,380 $196,020
Op Cost $0 $157,680 $51,246 $157,680
Combined $0 $448,080 $145,626 $353,700

50
Source: Ann.Cap OpCost Max Capacity
$/kW/yr $/MWh kW
Solar 120 4 3000
Biomass 363 25 800
Biomas
s Solar
Solar
Capacities
Biomass Cap
Constraint
Solar Cap
Constraint
Capacity 800 0 kWh kWh
Jan 535680 0 0.10483871 535680 0
Feb 483840 0 0.138392857 483840 0
Mar 535680 0 0.153225806 535680 0
Apr 518400 0 0.165277778 518400 0
May 535680 0 0.168010753 535680 0
Jun 518400 0 0.168055556 518400 0
Jul 535680 0 0.168010753 535680 0
Aug 535680 0 0.169354839 535680 0
Sep 518400 0 0.143055556 518400 0
Oct 535680 0 0.134408602 535680 0
Nov 518400 0 0.091666667 518400 0
Dec 535680 0 0.075268817 535680 0
Total 6307200 0
Constraint 2:
2. Demand must be met in each month
Residential + Plant Total Demand Combined
MWh kWh kWh kWh made
Jan 484.49 484490 484490.00 535680.00
Feb 466.69 466690 466690.00 483840.00
Mar 448.49 448490 448490.00 535680.00
Apr 443.69 443690 443690.00 518400.00
May 454.79 454790 454790.00 535680.00
Jun 449.79 449790 449790.00 518400.00
Jul 461.09 461090 461090.00 535680.00
Aug 461.09 461090 461090.00 535680.00
Sep 454.49 454490 454490.00 518400.00
Oct 459.59 459590 459590.00 535680.00
Nov 461.79 461790 461790.00 518400.00
Dec 467.09 467090 467090.00 535680.00
Total 5513080 5513080.00
Revenue From Selling Energy
Total Produced Net kWh
Excess kWh
Produced Total Revenue

51
(kWh) (minus plant)
535680.00 201480.00 51190.00 $60,227
483840.00 149640.00 17150.00 $55,012
535680.00 201480.00 87190.00 $58,067
518400.00 184200.00 74710.00 $56,396
535680.00 201480.00 80890.00 $58,445
518400.00 184200.00 68610.00 $56,762
535680.00 201480.00 74590.00 $58,823
535680.00 201480.00 74590.00 $58,823
518400.00 184200.00 63910.00 $57,044
535680.00 201480.00 76090.00 $58,733
518400.00 184200.00 56610.00 $57,482
535680.00 201480.00 68590.00 $59,183
6307200.00 2296800.00 $694,997
Scenario 2B: Objective $321,528 per year
Total Cost:
Source: Solar Biomass Existing infra Total
Capital $88,440 $290,400 $94,380 $284,460
Op Cost $3,614 $157,680 $51,246 $161,294
Combined $92,054 $448,080 $145,626 $445,754
Source: Ann.Cap OpCost Max Capacity
$/kW/yr $/MWh kW
Solar 120 4 3000
Biomass 363 25 800
Min cap for solar (kW) 737
Biomass Solar
Solar
Capacities
Biomass Cap
Constraint
Solar Cap
Constraint
Capacit
y 800 737 kWh kWh
Jan 535680 57486 0.10483871 535680 57486
Feb 483840 68541 0.138392857 483840 68541
Mar 535680 84018 0.153225806 535680 84018
Apr 518400 87703 0.165277778 518400 87703
May 535680 92125 0.168010753 535680 92125
Jun 518400 89177 0.168055556 518400 89177
Jul 535680 92125 0.168010753 535680 92125

52
Aug 535680 92862 0.169354839 535680 92862
Sep 518400 75911 0.143055556 518400 75911
Oct 535680 73700 0.134408602 535680 73700
Nov 518400 48642 0.091666667 518400 48642
Dec 535680 41272 0.075268817 535680 41272
Total 6307200 903562
Constraint 2:
2. Demand must be met in each month
Residential + Plant Total Demand Combined
MWh kWh kWh kWh made
Jan 484.49 484490 484490.00 593166.00
Feb 466.69 466690 466690.00 552381.00
Mar 448.49 448490 448490.00 619698.00
Apr 443.69 443690 443690.00 606103.00
May 454.79 454790 454790.00 627805.00
Jun 449.79 449790 449790.00 607577.00
Jul 461.09 461090 461090.00 627805.00
Aug 461.09 461090 461090.00 628542.00
Sep 454.49 454490 454490.00 594311.00
Oct 459.59 459590 459590.00 609380.00
Nov 461.79 461790 461790.00 567042.00
Dec 467.09 467090 467090.00 576952.00
Total 5513080 5513080.00
Revenue From Selling Energy
Total Produced Net kWh
Excess kWh
Produced Total Revenue
(kWh) (minus plant)
593166.00 258966.00 108676.00 $64,826
552381.00 218181.00 85691.00 $60,495
619698.00 285498.00 171208.00 $64,788
606103.00 271903.00 162413.00 $63,413
627805.00 293605.00 173015.00 $65,815
607577.00 273377.00 157787.00 $63,897
627805.00 293605.00 166715.00 $66,193
628542.00 294342.00 167452.00 $66,252
594311.00 260111.00 139821.00 $63,117
609380.00 275180.00 149790.00 $64,629
567042.00 232842.00 105252.00 $61,374
576952.00 242752.00 109862.00 $62,485
7210762.00 3200362.00 $767,282

53
Scenario 3:
Objective $616,991
per
year
Total Cost:
Source: Solar Biomass
Existing
infra Biodiesel Total
Capital $88,440 $257,730 $94,380 $16,608 $268,398
Op Cost $3,614 $139,941 $51,246 $463,601 $607,156
Combined $92,054 $397,671 $145,626 $480,210 $875,555
Source: Ann.Cap OpCost Max Capacity
$/kW/yr $/MWh kW
Solar 120 4 3000
Biomass 363 25 710
Min cap for solar (kW) 737
Biomass Solar
Solar
Capacities
Biomass Cap
Constraint
Solar Cap
Constraint
Capacity 710 737 kWh kWh
Jan 475416 57486 0.10483871 475416 57486
Feb 429408 68541 0.138392857 429408 68541
Mar 475416 84018 0.153225806 475416 84018
Apr 460080 87703 0.165277778 460080 87703
May 475416 92125 0.168010753 475416 92125
Jun 460080 89177 0.168055556 460080 89177
Jul 475416 92125 0.168010753 475416 92125
Aug 475416 92862 0.169354839 475416 92862
Sep 460080 75911 0.143055556 460080 75911
Oct 475416 73700 0.134408602 475416 73700
Nov 460080 48642 0.091666667 460080 48642
Dec 475416 41272 0.075268817 475416 41272
Total 5597640 903562
Constraint
2:
2. Demand must be met in each month
Residential + Plant+ Biodiesel Total Demand Combined
MWh kWh kWh kWh made
Jan 497.49 497490 497490.00 532902.00
Feb 479.69 479690 479690.00 497949.00

54
Mar 461.49 461490 461490.00 559434.00
Apr 456.69 456690 456690.00 547783.00
May 467.79 467790 467790.00 567541.00
Jun 462.79 462790 462790.00 549257.00
Jul 474.09 474090 474090.00 567541.00
Aug 474.09 474090 474090.00 568278.00
Sep 467.49 467490 467490.00 535991.00
Oct 472.59 472590 472590.00 549116.00
Nov 474.79 474790 474790.00 508722.00
Dec 480.09 480090 480090.00 516688.00
Revenue From Selling
Energy
Total
Produced Net kWh Excess kWh Produced Total Revenue
(kWh) (minus
plant)
532902.00 198702.00 35412.00 $60,784.56
497949.00 163749.00 18259.00 $56,920.32
559434.00 225234.00 97944.00 $60,747.12
547783.00 213583.00 91093.00 $59,527.04
567541.00 233341.00 99751.00 $61,773.68
549257.00 215057.00 86467.00 $60,010.96
567541.00 233341.00 93451.00 $62,151.68
568278.00 234078.00 94188.00 $62,210.64
535991.00 201791.00 68501.00 $59,231.68
549116.00 214916.00 76526.00 $60,587.68
508722.00 174522.00 33932.00 $57,488.16
516688.00 182488.00 36598.00 $58,443.44
6501202.00 2490802.00 832122.00 $719,876.96
Revenue from biodiesel
Grease Biodiesel Revenue
Jan 17590 13192.5 $46,173.75
Feb 16370 12277.5 $42,971.25
Mar 42594 31945.5 $111,809.25
Apr 22000 16500 $57,750.00
May 26830 20122.5 $70,428.75
Jun 16440 12330 $43,155.00
Jul 23875 17906.25 $62,671.88
Aug 20882 15661.5 $54,815.25
Sep 17527 13145.25 $46,008.38
Oct 24832 18624 $65,184.00

55
Nov 37600 28200 $98,700.00
Dec 27810 20857.5 $73,001.25
Total 294350 220763 $772,668.75
Average/day 806.44 604.83 $2,116.90
Biodiesel Costs
Equipment
Processing
$/gal $ /year
80 gallon processor $40,000.00 Methanol $0.36 $278,160.75
Oil press unit $80,000.00 Potassium $0.24 $185,440.50
Installation $21,000.00 Total $463,601.25
Methanol recovery system $34,950.00
Total $175,950.00
Annualized capital cost $16,608.44
Total Cost/yr $480,209.69
Net revenue comparison of electricity and biodiesel produced by the same
amount of grease Electricity Biodiesel
Production 1,196,975 220,763
Unit Price $0.105 $3.50
Total
Revenue $125,682 $772,669
Total Cost $54,000 $480,210
Net Revenue $71,682 $292,459
How much biogas required to produce energy Capacity 800 710 553 kW
Cap factor 0.92 0.92 0.92
(based on current conditions at
IAWWTF)
Energy/yr 6447360 5722032 4456737.6 kWh/yr
6447.36 5722.032 4456.7376 MWh/yr
17.664 15.6768 12.21024 MWh per day
Conversion 3412 3412 3412 btu/kWh
60.27 53.49 41.66 Mmbtu/day
Current 5.76 5.76 5.76 MWh per day
Proposed 17.664 15.6768 12.21024 MWh per day
Ratio: 3.07 2.72 2.12
times increase in biogas
requirement

56
Current 135000 135000 135000 ft3 biogas per day
Proposed 286000 286000 2.86E+05 ft3 biogas per day
Solar Capacity Ground Coverage 170000 sqft
Number of floors 3
Buildup Area 510000 sqft
Average Unit Area 1700 sqft
Total # Units 300
Solar Capacity 736100 watts

57
Appendix B: References Asmus, Peter. “Why Microgrids Are Inevitable | Articles | Business Energy.” Why Microgrids
Are Inevitable | Articles | Business Energy. N.p., n.d. Web 05 Oct. 2014.
"Bio-SNG (Synthetic Natural Gas) and Gasification Technologies." European Biofuels
Technology Platform. N.p., 25 Mar. 2013. Web. 5 Oct. 2014.
<http://www.biofuelstp.eu/bio-sng.html>.
Barton, Charles. "IER: Total 2016 Nuclear Levelized Costs Lower." Nuclear Green Blogspot, 22
June 2009. Web. 10 Oct. 2014. <http://nucleargreen.blogspot.com/2009/06/ia-total-2016-
nuclear-levelized-costs.html>.
Boranyak, Sharon. "Wastewater Plant Turns Food Into Electricity." Wastewater Plant Turns
Food Into Electricity. American Society of Civil Engineers, 1 May 2012. Web. 05 Oct.
2014.
<http://www.asce.org/CEMagazine/Article.aspx?id=25769808234#.VDKqy_ldXEt>.
Clean Watersheds Needs Survey 2004 Report to Congress. Washington, D.C.: United States
Environmental Protection Agency, Office of Water, 2008.Environmental Protection
Agency. Jan. 2008. Web. 7 Oct. 2014.
<http://water.epa.gov/scitech/datait/databases/cwns/upload/cwns2008rtc.pdf>.
Coate, Alexander. "EBMUD Energy: A Commitment to the Environment." EBMUD.com. Mar.
2012. Web. 6 Oct. 2014. <http://www.ebmud.com/sites/default/files/pdfs/energy-fact-
sheet-03-12_1.pdf>.
Casier, Andrew. "Tompkins, Ithaca Plan 2.4MW Solar Array." Ithaca Journal. Gannett
Company, 26 Sept. 2014. Web. 04 Oct. 2014.
<http://www.ithacajournal.com/story/news/local/2014/09/26/tompkins-
ithaca-plan-mw-solar-array/16285521/>.
Deines, Allison “Energy Production and Efficiency at Wastewater Treatment Plants”
Water
environment Research Foundation, January 2013.
Ferguson, Zoe. "Cornell Flips the Switch at Snyder Road Solar Farm." The Cornell Daily Sun.
N.p., 23 Sept. 2014. Web. 05 Oct. 2014. <http://cornellsun.com/blog/2014/09/23/cornell-
flips-the-switch-at-snyder-road-solar-farm/>.
Shirk, F. Alan. "Fleet Managers Save Millions with CNG." Sustainability City Netowrk. N.p., 13
Aug. 2014. Web. 9 Oct. 2014.
<http://www.sustainablecitynetwork.com/topic_channels/transportation/article_42adb76e
-2340-11e4-bcdf-001a4bcf6878.html?utm_source=SCN+InBox+e-

58
Newsletter&utm_campaign=e1ce2a21fd-Newsletter_8-13-
2014_Muni&utm_medium=email&utm_term=0_11e7ac761c-e1ce2a21fd-188591733>.
Ferris, David. “Microgrids: Very Expensive, Seriously Necessary.” Forbes. Forbes Magazine.
N.d. Web. 05 Oct. 2014.
"FlexTech Program." NYSERDA. 11 Sept. 2014. Web. 06 Oct. 2014.
<http://www.nyserda.ny.gov/Energy-Efficiency-and-Renewable-Programs/Commercial-
and-Industrial/CI-Programs/FlexTech-Program.aspx>.
"Fuel from Chicken Feathers." Alternative Energy News. Biodiesel, Biofuels, Waste Energy, 22
Mar. 2010. Web. 04 Oct. 2014. <http://www.alternative-energy-news.info/fuel-from-
chicken-feathers/#.VCg55MmbALs.gmail>.
Gilroy, Tim, and Venice Forbes. "FlexTech Program." NYSERDA. N.p., July 2014. Web. 2 Oct.
2014.<http://www.nyserda.ny.gov//media/Files/FO/Current%20Funding%20Opportunitie
s/PON%201746/1746summary.pdf.>.
International Energy Agency “Production Costs of Alternative Transportation Fuels”
http://www.iea.org/publications/freepublications/publication/FeaturedInsights_Alternativ
eFuel_FINAL.pdf
Kamenetz, Anya. "Why the Microgrid Could Be the Answer to Our Energy Crisis." Fast
Company. N.p., n.d. Web. 05 Oct. 2014.
Leelon, Scott “Capturing Energy in Wastewater Treatment Plants” Waterworld, 2013.
Lubna Mariam, Malabika Basu, and Michael F. Conlon, “A Review of Existing Microgrid
Architectures,” Journal of Engineering, vol. 2013, Article ID 937614, 8 pages, 2013.
doi:10.1155/2013/937614
Marpicati, Silvia. "NYSERDA: Energy Program Funding Opportunities." New York Water
Association Environment, Summer 2013. Web. 2 Oct. 2014.
<http://nywea.org/clearwaters/13-2-summer/6.pdf>.
Menendez, Marco. "How We Use Energy at Wastewater Plants...and How Do We Use Less."
Web. 2 Oct. 2014.
<http://www.ncsafewater.org/Pics/Training/AnnualConference/AC10TechnicalPapers/
AC10_Wastewater/WW_T.AM_10.30_Menendez.pdf>.
Microgrids. Welcome to CSE. N.p., n.d. Web. 05 Oct. 2014.

59
NEED, “Transportation Fuels: The Future is Today” 2006-2007 Page 15<http://www.formula-
hybrid.org/wp-content/uploads/DOE-Alternative-Fuels-Teacher-Guide.pdf >
NEED, “Transportation Fuels: The Future is Today” 2006-2007 Page 16<http://www.formula-
hybrid.org/wp-content/uploads/DOE-Alternative-Fuels-Teacher-Guide.pdf >
"New York City Converts Waste to Biogas and Improves Emissions." Energy Digital. N.p., 14
Apr. 2014. Web. 02 Oct. 2014. <http://www.energydigital.com/renewables/3408/New-
York-City-converts-waste-to-biogas-and-improves-emissions>.
Opportunities for Combined Heat and Power at Wastewater Treatment Facilities: Market
Analysis and Lessons from the Field (n.d.): n. pag.Environmental Protection Agency.
Combined Heat and Power Partnership, Oct. 2011. Web. 7 Oct. 2014.
<http://www.epa.gov/chp/documents/wwtf_opportunities.pdf>.
Ratcliff, Richard. "The Netherlands Energy Factories." Utility Week.8 Oct. 2011. Web. 2 Oct.
2014. <http%3A%2F%2Fwww.utilityweek.co.uk%2Fnews%2FThe-Netherlands-energy-
factories%2F791632%23.VCWonvldV15>.
Sanchez, Ivette. “Microgrid Technology.” Bio Tribune Magazine 18.1 (2006): 8.2003. Web.
"Small Scale Community Plants Way Forward for Waste Gasification." Waste Management
World. N.p., 25 June 2012. Web. 04 Oct. 2014. <http://www.waste-management-
world.com/articles/2012/06/small-scale-community-plants-way-forward-for-waste-
gasification.html>.
Stein, Wes, and Lasse Tobiasen. "Review of Small Scale Waste to Energy Conversion
Systems." IEA Bioenergy Agreement - Task 36 (2004): n. pag. IEA Bioenergy. 2004.
Web. 5 Oct. 2014. <http://www.ieabioenergytask36.org/Publications/2001-
2003/Publications/Review_of_Small_Scale_Waste_Conversion_Systems.pdf>.
"The Newtown Creek Digester Eggs." Newtown Creek Digester Eggs. NYC Environmental
Protection, 2014. Web. 03 Oct. 2014.
<http://www.nyc.gov/html/dep/html/environmental_education/newtown_digesters.shtml>
"Turning Food Waste into Energy at the East Bay Municipal Utility District (EBMUD)." US
EPA. Environmental Protection Agency, 23 Aug. 2013. Web. 05 Oct. 2014.
<http://www.epa.gov/region9/waste/features/foodtoenergy/wastewater.html>.
United States Environmental Protection Agency, “EPA 832-F-13-018”
http://water.epa.gov/scitech/wastetech/upload/Low-Head-Hydropower-from-
Wastewater.pdf, August 2013.

60
Warner, Chet. “U.S. Mayor Article | Ansonia (CT) to Implement Energy Improvement
(July 30, 2007). “U.S. Mayor Article | Ansonia (CT) to Implement Energy Improvement
District (July 30, 2007). N.p., n.d. Web. 05 Oct. 2014.
"Wastewater Treatment." City of Ithaca NY. N.p., n.d. Web. 4 Oct. 2014.
<http%3A%2F%2Fwww.cityofithaca.org%2F331%2FWastewater-Treatment>.
"What Is District Energy." Environmental and Energy Study Institute. Sept. 2011. Web. 2 Oct.
2014. <http://www.districtenergy.org/assets/pdfs/White-Papers/What
IsDistrictEnergyEESI092311.pdf>.
Wingfield, Rebecca C. "Waste-to-Energy Systems." ProQuest. Superintendent of Documents,
United States Army, Jan.-Feb. 2009. Web. 8 Oct. 2014.
<http://search.proquest.com/docview/196441952?accountid=10267>.