Item Factor Analysis Item Response Theory Beaujean Chapter 6.

ISSN 2029–2236 (print)ISSN 2029–2244 (online)Socialinių mokSlų StudijoSSociEtal StudiES2011, 3(1), p. 77–93.
Socialinių mokslų studijos/Societal StudiesMykolo Romerio universitetas, 2011Mykolas Romeris University, 2011
ISSN 2029–2236 (print), ISSN 2029–2244 (online)http://www.mruni.eu/lt/mokslo_darbai/SMS/http://www.mruni.eu/en/mokslo_darbai/SMS/
IteM ReSpoNSe theoRy applIcatIoNS foR SocIal pheNoMeNa ModelINg
Aleksandras KrylovasMykolas Romeris University, Faculty of Social Informatics,
Department of Mathematical Modelling Ateities 20, LT-08303, Vilnius, Lithuania
Telephone (+370 5) 2714 731 E-mail [email protected]
Natalja KosarevaVilnius Gediminas Technical University, Faculty of Fundamental Sciences,
Department of Mathematical Modelling Saulėtekio 11, LT-10223 Vilnius, Lithuania
Telephone (+370 5) 274 4827 E-mail [email protected]
Received 28 January, 2011; accepted 8 March, 2011
Abstract.ThearticlereviewsItemResponseTheoryfacilitiesinmodelingsocialphe-nomena,itsadvantagesanddisadvantagescomparingwithClassicalTestTheoryandmat-hematicalstatisticsmethods.ItdiscussestheapplicationofIRTinsocialsciencesspecifics.TheextensionofItemResponseTheorymodelwhereitemcharacteristicfunctionshavebeenapproximatednotonlywithlogisticfunctions,butalsowithfunctionsfromotherwideclassesof parametric functions is presented. The procedure of item calibration—choosing of the best fitting item characteristic function and parameter’s estimation—is described in the paper. Whenchoosingtheitemcharacteristicfunctionforthemodelfromwiderclassoffunctionsastheresultweobtainbetteragreementbetweenobserveddataandtheformalmodel.TheexampleofIRTapplication inmeasuring theEnvironmentalPerformanceIndex isexa-mined.Thetechnologyofextendingtheclassoflogisticfunctionsusedforsimulationwas

Aleksandras Krylovas, Natalja Kosareva. ItemResponseTheoryApplicationsforSocialPhenomenaModeling78
applied in this case study. Calculated test information function’s values for the proposed mixedmodelwerehigher comparingwith correspondingvalues for2parameters logisticmodel.TheclusterizationprocedureperformedbyEPIvaluescalculatedasthetotalscoreof9 items test was accomplished. Kendall‘s τ and Spearman’s ρrankcorrelationcoefficientsformeasuringtherelationbetweenestimationsofEPIaccomplishedbythetotaltestscorevalueandtheEPIvaluecalculatedastheweightedsumof25indicatorsarepresentedfordifferentvaluesoftestitemsn.Itwasshownthatthenewmethodologyallowstoperformrather precisenorms-referenced evaluation of objectswith respect to latent featurewhichcouldn’t be measured directly with a significantly less amount information. The proposed methodologycouldbeusedinvariousareasofhumanactivitieswheretheactualproblemisnorms-referencedevaluation.
Keywords:ItemResponseTheory,mathematicalmodeling,testinformationfunction,EnvironmentalPerformanceIndex,latentfeature,norms-referencedevaluation.
Introduction
Methodology for social research is something different from methodology of rese-arch in physical or technological sciences. The researcher meets with difficulties concer-ned with impact of human factor when gathering empirical data.
The first problem arises when we define the object of investigation. Very often it is latent, i.e. not directly observed feature, for example, anxiety, nervousness, intelligence or other mental property. The question is—how one can measure this feature? One other question—is it possible to measure something that we cannot see, hear or feel? It is cle-ar that we must use indirect methods of measuring, i.e. instruments that measure other related, but directly observable features.
The second problem arises when we are choosing a proper measuring instrument—a questionnaire. The construction of a good questionnaire is a rather responsible job. It can’t be too short, because in this case the conclusions will be not reliable and also it can’t be too long, because people cannot concentrate their attention to answer the excess number of questions (test items). Test items cannot be too easy or too difficult for the in-vestigated group of testees, because responses to such items (questions) are predictable and not informative. It is known that the maximum information is received from such item when approximately one half of testees will respond it correctly. For the construc-tion of a proper questionnaire we must be able to choose the most informative subset of items from the whole item bank. As different groups of testees have different levels of the investigated feature the question arises—if we can apply different questionnaires to different groups of persons to measure this feature? Fortunately with Item Response Theory coming we can answer positively to this question.
The third problem is test validity—the test should be constructed particularly for measuring mental feature under investigation.
SocietalStudies.2011,3(1): 77–93. 79
1. Modeling in Social Sciences
Statistical modeling for social sciences solves the tasks of creating the equations which link factors to responses or independent variables to dependent variables1. The aim of statistical modeling is to predict values or levels of dependent variable and eva-luate error of estimation. The well known statistical models which are used in social sciences are the log-linear model for discrete dependent variables2 and the general linear model3 and Item Response Theory models4 for continuous dependent variables. Our field of interest is related to continuous latent dependent variables, so we’ll take a look at the two latter—the general linear model and Item Response Theory models. General linear models could be applied when the normality assumption and some other assump-tions about the data (i.e. homoscedasticity5) are satisfied. Classical statistical procedures for latent variable analysis are—factor analysis, linear discriminant analysis, covariance structure models, etc. But in real life normality assumptions are rarely satisfied, so the more universal tools have been created. When continuous latent variable isn’t normally distributed, Item Response Theory could be applied for the modeling processes.
A very important stage is the creation of the proper questionnaire that allows get-ting maximum information about a measured feature. For the construction of a “good” questionnaire the appropriate technique is choosing items with the biggest absolute va-lue of correlation with the measured feature. Items could be dichotomous with yes/no or agree/disagree responses or polytomous which have limited number of ordered cate-gories. When using a dichotomous model we lose much more information comparing with polytomous case and this results in bigger measurement error. But the advantages of a dichotomous model are that such items very often fit real data and that we avoid the problem of insufficient number of responses in some categories of polytomous items.� So, further we will deal with the dichotomous model.
2. Item Response theory in Social Sciences
In the dichotomous Item Response Theory model, k subjects are responding to n test items. Then test results appear as k x n matrix, where rows represent subjects and co-
1 Clogg, C. The Impact of Sociological Methodology on Statistical Methodology. Statistical Science. 1992, 7(2): 183−207.
2 Christensen, R. Log-Linear Models and Logistic Regression. NY: Springer-Verlag Inc, 1997.3 Friston, K.; Holmes, A.; Worsley K.; Poline, J.-P., Frith, C.; Frackowiak, R. Statistical Parametric Maps in
functional imaging: A general linear approach. Human Brain Mapping. 1995, 2: 189–210.4 Baker, F.; Kim, S.-H. Item response theory: Parameter estimation techniques (2nd ed.). NY: Marcel Dekker,
2004.� Fox, J. Applied Regression Analysis, Linear Models, and Related Methods. California: Sage Publications,
1997.� Molenaar, I. Parametric and nonparametric item response theory models in health related quality of life
measurement. Statistical Methods for Quality of Life Studies: Design, Measurements and Analysis. 2007, p. 143−1�4.

Aleksandras Krylovas, Natalja Kosareva. ItemResponseTheoryApplicationsforSocialPhenomenaModeling80
lumns represent responses to the items—a matrix with 0’s or 1’s in the cells (see Table 1).
Table 1. Dichotomous Item Response Theory Model
Item 1 Item 2 Item 3 Item 4 Item 5 Average person’s ability estimation
Person 1 1 1 1 1 1 1Person 2 0 1 1 1 1 0.8Person 3 0 0 1 1 1 0.�Person 4 0 0 0 1 1 0.4Person � 0 0 0 0 1 0.2Average item’s difficulty 0.8 0.� 0.4 0.2 0
The well known model in latent trait testing theory is the One Parameter Logistic model (1PL) initially described by Rasch7. According to this model we can predict the probability of responding a particular item correctly ki(p) = P(xi = 1|p) given the examinee ability level p by the following equation (1):
, (1)
here bi is the difficulty parameter of item i. The function above, which is called item characteristic function, belongs to the class of logistic functions. Rasch model is taking place if some constraints on the model are satisfied8:
1. Unidimensionality of latent trait p. This means that at a time one mental property is measured, the influence of other latent traits is treated as negligible.
2. Conditional independence of items given person and conditional independence of persons given item. Given the person’s ability p the elements of the response vector are independent. Person’s response to the item is independent of other respondent’s responses to this item.
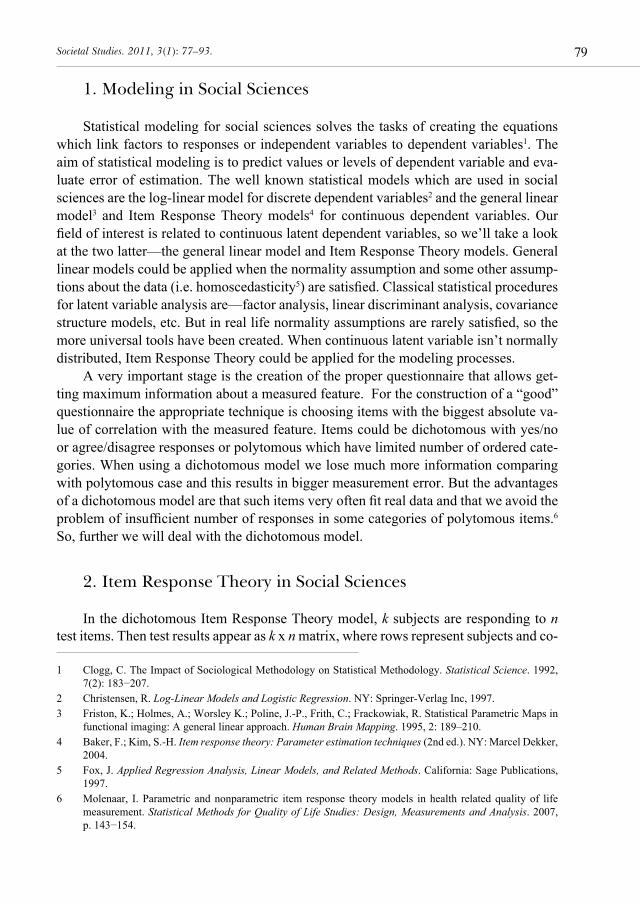
3. The item response function ki(p) = P(xi = 1|p) is non-decreasing function of p.4. The total test score is a sufficient statistic for p.In Fig. 1 graphs of 1PL item characteristic functions ki(p) with various difficulty
parameter bi values are presented.
7 Rasch, G. Probabilistic Models for some intelligence and Attainment Tests. Copenhagen: Danish Institute for Educational Research, 19�0; Expanded edition: Chicago, The University of Chicago Press, 1980.
8 Molenaar, I., supra note �.
SocietalStudies.2011,3(1): 77–93. 81
Figure 1. Graphs of functions k(p) with various difficulty parameter values in 1PL.
Formula (2) presented below is generalization of Rasch model9 where supplemen-tary parameters are discrimination parameter ai (2PL model) and additionally the proba-bility of random guessing ci of the item i (3PL model):
(2)
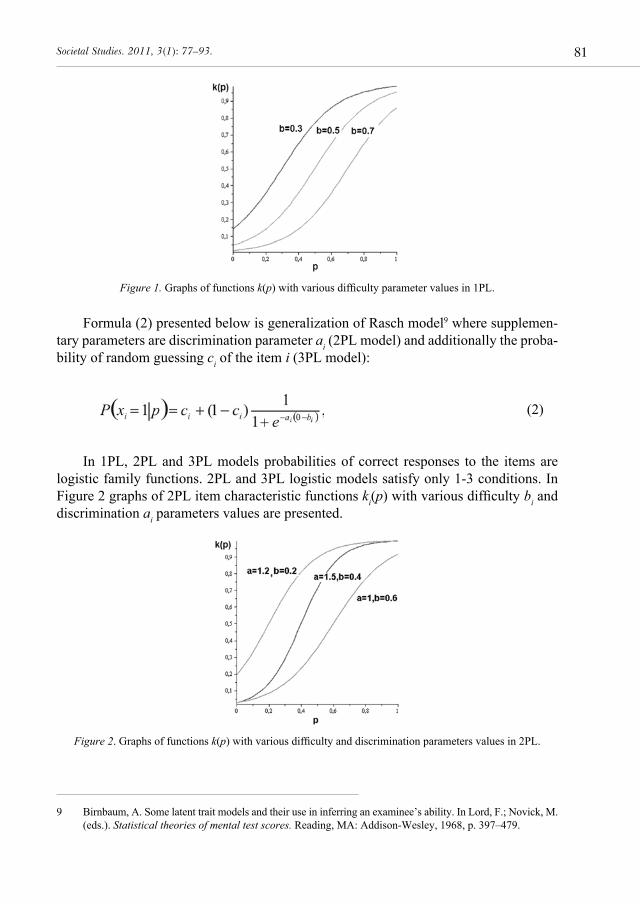
In 1PL, 2PL and 3PL models probabilities of correct responses to the items are logistic family functions. 2PL and 3PL logistic models satisfy only 1-3 conditions. In Figure 2 graphs of 2PL item characteristic functions ki(p) with various difficulty bi and discrimination ai parameters values are presented.
Figure 2. Graphs of functions k(p) with various difficulty and discrimination parameters values in 2PL.
9 Birnbaum, A. Some latent trait models and their use in inferring an examinee’s ability. In Lord, F.; Novick, M. (eds.). Statistical theories of mental test scores. Reading, MA: Addison-Wesley, 19�8, p. 397–479.

Aleksandras Krylovas, Natalja Kosareva. ItemResponseTheoryApplicationsforSocialPhenomenaModeling82
Before the testing process begins it is necessary to estimate the values of parameters ai and bi for each test item. The process of parameters estimation is called item calibration. Parameters are calculated by minimizing the distances between empirical diagnostic functions and item characteristic functions ki(p) = ki(ai;bi;p). When item parameters are estimated the examinees testing stage begins. Each examinee responds all test items. The probability of each possible response vector under the model given the ability level p is a function of latent variable p and item parameters called the likelihood function. This function is used to estimate examinees ability levels. Likelihood function is a function of actually observed responses, latent variables and item parameters. The values of latent variable p which maximize likelihood function are the ability estimates. It is important that it is possible to predict responses of a given respondent to a given set of items. This feature could be used for imputation of missing observations or distinguishing those respondents whose responses were unexpected for various reasons—cheating, misun-derstanding of questions, etc.
IRT has an attractive property—it enables the proposition of different items to dif-ferent respondents and obtaining estimates of ability which are independent from the set of items given to respondent. So, we can apply different questionnaires to different groups of persons and obtain the same result. This possibility is particularly important in social processes modeling because very often questionnaire which is perfectly fitted for one group of persons, countries or areas of human activity is meaningless for other group. This feature is the advantage of IRT comparing with Classical Test Theory10 (CTT). The other advantage is that in IRT the latent variable is not necessarily a normal-ly distributed random variable.
3. the extension of the Item Response theory Model
The first stage is to postulate a formal measurement model, estimate item charac-teristic function’s parameters, and establish whether the observed data are in agreement with the model. The measurement quality heavily depends on the applied model and how precisely we have accomplished the parameters calibration procedure. For incre-asing the accuracy of calibration we have proposed to supplement the class of logistic functions, described by formulas (1) and (2) with other parametric functions classes.11 In the proposed model the best fitting item characteristic function k(p) is selected from one of the 4 classes of parametric functions depending on one or two parameters. These functions are: 2 parameters logistic function when restricted in the interval [0; 1] des-cribed by (3); arc-cotangent function (4); segments of linear functions (�); segments of two parabolas (�):
10 Lord, F.; Novick, M., supra note 9.11 Krylovas, A.; Kosareva, N. Mathematical Modelling of Diagnostic Tests. Knowledge-Based Technologies
and OR Methodologies for Strategic Decisions of Sustainable Development (KORSD-2009): 5th internatio-nal conference, 2009, p. 120−12�.

SocietalStudies.2011,3(1): 77–93. 83
(3)
(4)
(5)
(�)
The interpretation of parameters for models described by equations (�) and (�) se-
ems to be the difficulty for and the discrimination for similarly to the para-
meters a and b for the Rasch model. The interpretation of parameter a in the model (4) isn’t obvious.
Clearly, when choosing the item characteristic function for our model from wider class of functions, as the result we will obtain better agreement between observed data and our formal model. This will enable to improve the estimate of latent ability p. It is notable, that only 3 constraints on the model 1-3 are satisfied, while the fourth—the sufficiency of total test score —has not. As a result, the location of items and res-pondents is determined only at the ordinal level.
Let the test or the questionnaire consist of n items with corresponding item charac-teristic functions k1,k2,...,kn. Total test result S would be the number of correctly respon-ded items. Random variable S is gaining values from 0 to n. The probability distribution of total test result S in the whole population pi = P(S = i), i = 0,1,...,n is received by method of generating functions.12 The test information (entropy) function I is described as follows:
12 Krylovas, A.; Kosareva, N. Mathematical modelling of forecasting the results of knowledge testing. Techno-logical and Economic Development of Economy. 2008, 14(3): 388–401.

Aleksandras Krylovas, Natalja Kosareva. ItemResponseTheoryApplicationsforSocialPhenomenaModeling84
.
The normalized value of the function I is the percentage of the test information
function (7) from the maximum value, which is reached when all probabilities are equal
to . Our purpose is to choose test items from the whole set of items (items bank) that maximize the value of the test information function (7).
4. case Study: evaluation of environmental performance Index
According to the data gathered in 2010 from 1�3 world countries Yale University Center for Environmental Law and Policy performed a research for evaluation of the Environmental Performance Index.13 The 2010 Environmental Performance Index (EPI) ranks 1�3 countries on 2� performance indicators tracked across ten well-established policy categories covering both environmental public health and ecosystem vitality. These indicators provide a gauge at a national government scale of how close countries are to established environmental policy goals.
EPI is a latent, i.e. not directly observed feature depending on a number of various factors, which measures the effectiveness of national environmental protection efforts of the countries. The 2010 EPI is calculated as weighted sum of 2� indicators presented in Figure 3. As a result countries were assigned scores from 32.1 (Sierra Leone) to 93.5 (Iceland).
The goal of our research was to choose the most informative subset from those 2� performance indicators and to fit each item characteristic function with the most appro-priate model 3-� with accomplishing parameters calibration procedure. We have chosen 9 indicators which have the biggest absolute values of correlation coefficient with EPI:
1. Environmental burden of disease, i.e. disability life adjusted years per 1000 population (<40);
2. Percentage of population having access to sanitation (>80);3. Indoor air pollution, i.e. percentage of population using solid fuels (<30.1);4. Outdoor air pollution (urban particulates) (<3�.2�);�. Water quality index (WQI) (>72.73);�. Forest cover change in percents (>-0.0�)7. Agricultural subsidies (>0);8. Pesticide regulation (>17);9. CO2 emissions per electricity generation (g CO2 per kWh) (<394).
13 Environmental Performance Index 2010 [interactive]. [accessed 08-09-2010]. <http://epi.yale.edu>.
(7)

SocietalStudies.2011,3(1): 77–93. 85
Figure 3. Construction of the Environmental Performance Index
Source: <http://epi.yale.edu>
Values in brackets are the thresholds for item dichotomization. These values were selected with the purpose, that approximately one half of countries will positively res-pond the given item. For example, the first item could be formulated as follows: “Is the environmental burden of disease less than 40?” The second item: “Is the percentage of population having access to sanitation greater than 80?” There could be only two res-ponses to these items—“yes” or “no”.
Now we’ll calculate empirical diagnostic functions by application the technique described by Baker.14 Standardized values pj of EPI are calculated for each country:
, (8)
here is the observed EPI value, pmin and pmax are minimum and maximum values of EPI—respectively 32.1 for Sierra Leone and 93.� for Iceland.
14 Baker, F. The Basics of Item Response Theory. ERIC Clearinghouse on Assessment and Evaluation. Univer-sity of Maryland, College Park, MD, 2001.

Aleksandras Krylovas, Natalja Kosareva. ItemResponseTheoryApplicationsforSocialPhenomenaModeling86
After transformation (8) values of EPI are in the interval [0; 1]. Then countries are grouped to the intervals according to the EPI values. The interval [0; 1] was divided to 24 equal length intervals with mj countries in j-th interval. The total number of countries is . Let rj countries from j-th interval responded the item positively. Then the observed proportion of positive responses in this interval where p=p is . Our purpose is to select the function from 4 function classes, which will provide the best accuracy of the approximation to the observed proportions of correct responses to the item.
The distances between empirical diagnostic functions P(pj) and each function from 4 functions classes (3)-(�) are minimized by fitting functions parameters. The distances are calculated by the formula (9):
(9)
The results of fitting 9 empirical item characteristic functions are presented in Table 2.
Table 2. The minimum values of distances d(k1) – d(k4) between diagnostic operators approximations k1 (p) – k4(p) and 9 item‘s characteristic functions and the ratio of minimum distance value dmin
and the distance to the logistic approximation d(k1).
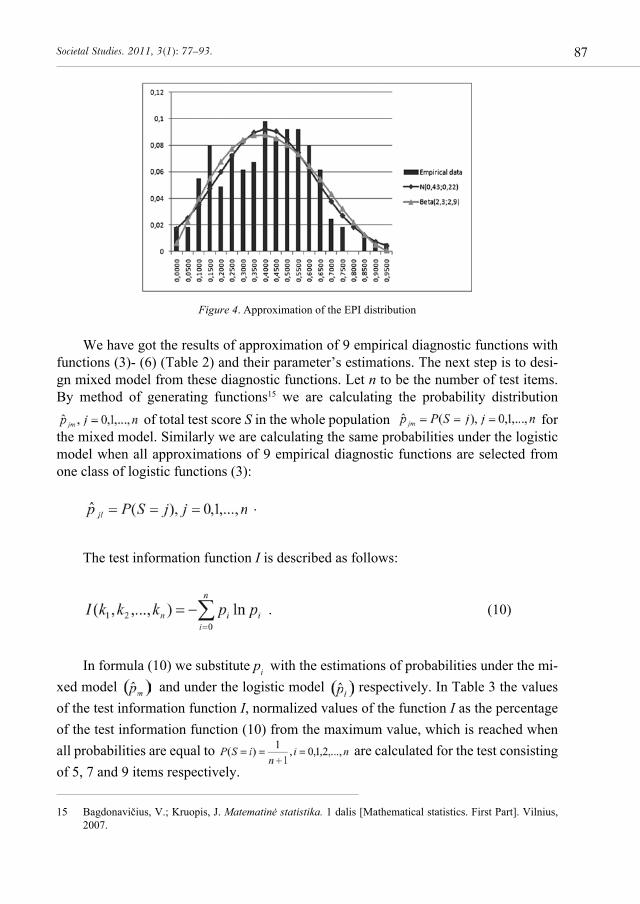
The minimum values of distances are highlighted in bold.Having data about 1�3 countries EPI values we selected the best fitting probability
distribution density function. The best fitting was normal distribution when normalized in the interval [0;1] with average 0.43 and standard deviation 0.22. The best fitting approximations to the empirical data from two probability distribution functions clas-ses—normal distribution and Beta distribution—are presented in Fig. 4.
SocietalStudies.2011,3(1): 77–93. 87
Figure 4. Approximation of the EPI distribution
We have got the results of approximation of 9 empirical diagnostic functions with functions (3)- (�) (Table 2) and their parameter’s estimations. The next step is to desi-gn mixed model from these diagnostic functions. Let n to be the number of test items. By method of generating functions15 we are calculating the probability distribution
of total test score S in the whole population for the mixed model. Similarly we are calculating the same probabilities under the logistic model when all approximations of 9 empirical diagnostic functions are selected from one class of logistic functions (3):
.
The test information function I is described as follows:
. (10)
In formula (10) we substitute pi with the estimations of probabilities under the mi-xed model and under the logistic model respectively. In Table 3 the values of the test information function I, normalized values of the function I as the percentage of the test information function (10) from the maximum value, which is reached when all probabilities are equal to are calculated for the test consisting of 5, 7 and 9 items respectively.
15 Bagdonavičius, V.; Kruopis, J. Matematinė statistika. 1 dalis [Mathematical statistics. First Part]. Vilnius, 2007.

Aleksandras Krylovas, Natalja Kosareva. ItemResponseTheoryApplicationsforSocialPhenomenaModeling88
The values in the brackets describe the proportion of the test information function from its maximum value, given in the last column. We can see from the Table 3 that mixed model gives higher information function’s values for all test length n cases. Na-turally test information function value increases when test length n is increasing.
Table 3. Test information function’s values calculated for different values of test items n for the logistic and mixed models
The next task is to compare the norms-referenced evaluation of Environmental Per-formance Index accomplished a) by the total test score value S for the test consisting of �, 7 and 9 items and b) by EPI values calculated as the weighted sum of 2� indicators1� (represented in Fig. 3). The latter value will be taken as the basic value in our compa-risons because we expect that it is the most precise value of EPI. The accuracy of the norms-referenced evaluation of EPI by the total test score value S could be measured with Kendall’s τ and Spearman’s ρ rank correlation coefficients and are presented in the Table 4.
Table 4. Kendall‘s τ and Spearman’s ρ rank correlation coefficients for measuring the relation between estimations of EPI accomplished by the total test score value S for the test consisting of 5, 7 and 9 items
and the basic EPI value calculated as the weighted sum of 2� indicators
n Kendall’s tau Spearman’s rho579
0,5�40,5840,�08
0,72�0,7520,782
All the values of rank correlations are rather high and the correlation coefficients are significant at α = 0,05 level. It’s clear that the proposed methodology enables to get sufficiently accurate norms-referenced evaluation of Environmental Performance Index having significantly less information—�, 7, or 9 items from the whole bank of 2� indicators.
In the next step the clusterization procedure was accomplished by the total test score value S for the test consisting of 9 items. All 1�3 countries were divided into � clusters. The clusterization method is Euclidean distance for between-groups linkage measuring. The clusterization results are presented in Table �.
1� Environmental Performance Index 2010, supra note 13.

SocietalStudies.2011,3(1): 77–93. 89
Table 5. The resulst of clusterization performed by the total score S of 9 items test.
Cluster 1 Cluster 2 Cluster 3 Cluster 4 Cluster 5 Cluster 6
Sierra Leone Angola Turkmenistan United Arab Emirates Kuwait Belgium
Central African Republic Togo Mali Bahrain Cyprus Greece
Mauritania Chad Benin Oman South Korea USA
Niger Cambodia Iraq Qatar Ukraine Slovenia
Haiti Equatorial Guinea Uzbekistan Libyan Arab Jamahiriya Turkey Netherlands
Nigeria Senegal Burundi South Africa Argentina Canada
Botswana Mongolia Rwanda Tajikistan Russia Ireland
North Korea Ethiopia Indonesia Ghana Bulgaria Luxembourg
Guinea Bangladesh Cameroon Trinidad and Tobago Poland Lithuania
Guinea- Bissau
Papua New Guinea Tanzania Saudi Arabia Brazil Croatia
Pakistan Bolivia Yemen Bosnia and Herzegovina Estonia Hungary
Honduras Zambia India Jordan Malaysia Denmark
Solomon Islands Sudan China Kazakhstan Australia Spain
Eritrea Burkina Faso Uganda Lebanon Romania Czech Republic
Zimbabwe Gambia Moldova Ecuador Japan
Madagascar Mozambique Viet Nam Serbia and Montenegro Portugal
Dem. Rep. Congo Myanmar Uruguay Singapore Italy
Nicaragua Kenya Guyana Latvia GermanySao Tome and
Principe Malawi Kyrgyzstan Chile New Zealand
Namibia Congo Iran Malta UK
Guatemala Armenia Cuba Slovakia
Côte d’Ivoire Tunisia Costa Rica Finland
Swaziland Macedonia Austria
Gabon Brunei Darussalam France
Jamaica Thailand Norway
Azerbaijan Israel Sweden
Laos Venezuela Switzerland
Djibouti Syria Iceland
Egypt Belarus
Paraguay Morocco
Georgia Philippines
Sri Lanka Fiji

Aleksandras Krylovas, Natalja Kosareva. ItemResponseTheoryApplicationsforSocialPhenomenaModeling90
Cluster 1 Cluster 2 Cluster 3 Cluster 4 Cluster 5 Cluster 6
Maldives Mexico
Algeria Bhutan
Nepal Suriname
Peru Dominican Republic
Belize El Salvador
Antigua and Barbuda
Panama
Albania
Colombia
Mauritius
According to the clusterization performed by the total score S of 9 items test in the bottom of EPI rating in Cluster 1 we see some African countries which are among the poorest in the world and other countries with very low economical level.
Countries in Cluster 2 are mostly poor African and Asian countries with low eco-nomical level.
In Cluster 3 there are former southern Soviet Union republics and some developing countries from Europe and Asia. This cluster involves some countries with large popu-lation and rapidly growing industrial base.
Cluster 4 is the biggest one and represents more diverse set of countries. There are many countries of Central and South America, Asia and North Africa.
Cluster � contains countries with high developed economics and some countries of Central Europe —the new members of Europe Union which are middle-income coun-tries with low level of industrial pollution.
Cluster � contains Scandinavian countries and other developed countries with suf-ficient financial resources.
conclusions
The main implications of the research on the Environmental Performance Index evaluation are:
• The values of test information function are higher when probabilities in (10) for-mula are calculated by the proposed mixed model. The essentiality of this model is the extension of item characteristic functions approximation with 3 additional parametric functions classes (4)- (�). This methodology let us to obtain higher test information function‘s values for the mixed model comparing with the lo-gistic model for 5, 7 and 9 items tests.

SocietalStudies.2011,3(1): 77–93. 91
• We have got sufficiently high Kendall’s τ and Spearman’s ρ rank correlation co-eficients between the EPI values obtained from the total test score S for the test consisting of �, 7 and 9 items and EPI values calculated as the weighted sum of 2� indicators. By increasing the number of test items rank correlation coeficients increase.
• With the proposed methodology it is possible to get accurate enough norms-re-ferenced evaluation of latent variable (EPI) having significantly less informati-on—�, 7, or 9 items from the whole bank of 2� indicators.
• Criterion-referenced evaluation of EPI could be made by applying maximum likelihood method.17
• The proposed mathematical model could be applied for solving diagnostic tasks in various fields of human activities—medicine, sports, geology, technical dia-gnostics and others.
References
17 Harris, J.; Stocker, H. Handbook of Mathematics and Computational Science. New York: Springer-Verlag, 1998.
Bagdonavičius, V.; Kruopis, J. Matematinė sta-tistika. 1 dalis [Mathematical Statistics. First Part]. Vilnius, 2007.
Baker, F. The Basics of Item Response Theo-ry. ERIC Clearinghouse on Assessment and Evaluation. University of Maryland, College Park, MD, 2001.
Baker, F.; Kim, S.-H. Item response theory: Parameter estimation techniques (2nd ed.). NY: Marcel Dekker, 2004.
Birnbaum, A. Some latent trait models and their use in inferring an examinee’s ability. In Lord, F.; Novick, M. (eds.). Statistical theories of mental test scores. Reading, MA: Addison-Wesley, 19�8.
Christensen, R. Log-Linear Models and Logis-tic Regression. NY: Springer-Verlag Inc, 1997.
Clogg, C. The Impact of Sociological Methodo-logy on Statistical Methodology. Statistical Science. 1992, 7(2): 183−207.
Environmental Performance Index. 2010 [inte-ractive]. [accessed 08-09-2010]. <http://epi.yale.edu>.
Friston, K.; Holmes, A.; Worsley K.; Poline, J.-P., Frith, C.; Frackowiak, R. Statistical Parame-
tric Maps in functional imaging: A general linear approach. Human Brain Mapping. 1995, 2: 189–210.
Fox, J. Applied Regression Analysis, Linear Models, and Related Methods. California: Sage Publications, 1997.
Harris, J.; Stocker, H. Handbook of Mathema-tics and Computational Science. New York: Springer-Verlag, 1998.
Lord, F.; Novick, M. (eds.). Statistical theories of mental test scores. Reading MA: Addi-son-Wesley Publishing company, 19�8.
Molenaar, I. Parametric and nonparametric item response theory models in health rela-ted quality of life measurement. Statistical Methods for Quality of Life Studies: Design, Measurements and Analysis. 2007.
Krylovas, A.; Kosareva, N. Mathematical mo-delling of forecasting the results of know-ledge testing. Technological and Economic Development of Economy. 2008, 14(3): 388–401.
Krylovas, A.; Kosareva, N. Mathematical Mo-delling of Diagnostic Tests. Knowledge-Ba-sed Technologies and OR Methodologies for Strategic Decisions of Sustainable Deve-

Aleksandras Krylovas, Natalja Kosareva. ItemResponseTheoryApplicationsforSocialPhenomenaModeling92
UždUotIeS SpReNdIMo teoRIjoS taIkyMaI, ModelIUojaNt SocIalINIUS ReIškINIUS
Aleksandras KrylovasMykolo Romerio universitetas, Lietuva
Natalja KosarevaVilniaus Gedimino technikos universitetas, Lietuva
Santrauka. Straipsnyje apžvelgiamos užduoties sprendimo teorijos (IRT – Item Res-ponse Theory) galimybės, modeliuojant socialinius reiškinius, jos privalumai bei trūkumai, palyginti su klasikinės testų teorijos ir matematinės statistikos metodais. Aptariama IRTtaikymosocialiniuosemoksluosespecifika.PristatomasIRTapibendrinimas,kaiklausimocharakteristinėfunkcijaaproksimuojamanevienlogistinėmisfunkcijomis,betirfunkcijo-mis iš kitų plačių parametrinių funkcijų klasių: arkkotangento, atkarpomis tiesinių, dviejų parabolių segmentų funkcijų. Aprašoma klausimo charakteristinės funkcijos kalibravimo – geriausios aproksimuojančios funkcijos parinkimo ir parametrų apskaičiavimo – procedū-ra. Iš platesnių funkcijų klasių parinkus klausimo charakteristinės funkcijos modelį, galima geriau pritaikyti formalų modelį stebimiems duomenims.
Nagrinėjamas IRT taikymo, matuojant aplinkos sveikatingumo indeksą (Environ-mental Performance Index – EPI), pavyzdys. Iš šį indeksą formuojančių 25 indikatorių, išmatuotų 163 pasaulio šalims, buvo pasirinkti 9 informatyviausi. Šiems indikatoriams pri-taikyta autorių pasiūlyta modeliavimo technologija, praplečiant empirinių duomenų aprok-simavimui naudojamų funkcijų klasę. Mišrusis modelis pasirodė informatyvesnis, palyginti su IRT modeliu. Apskaičiuotos testo informacijos funkcijos reikšmės, esant pasiūlytam miš-riam modeliui, buvo aukštesnės nei dviejų parametrų logistinio modelio atveju. Ryšiui tarp dviejų EPI įverčių – bazinio, apskaičiuoto kaip svertinė 25 indikatorių suma, ir bendrojo testo balo – nustatyti buvo apskaičiuoti Kendalo τ irSpearmanoρranginės koreliacijoskoeficientai skirtingoms testo klausimų skaičiaus reikšmėms n .Visaisatvejaisbuvogau-tos gana aukštos koreliacijos koeficientų reikšmės. Koreliacijos koeficientai buvo reikšmingi esant reikšmingumo lygmeniui 0,05. Parodyta, kad, remiantis daug mažesniu informacijos kiekiu, nauja metodika leidžia atlikti pakankamai tikslų objektų norminį vertinimą pagal tiesiogiai neišmatuojamo latentinio kintamojo reikšmes.
Pagal EPI įverčio, apskaičiuoto kaip 9 klausimų testo bendrasis balas, reikšmes buvo atlikta klasterizacijos procedūra, suskirstant šalis į 6 klasterius ir pateiktas trumpas klasterių apibūdinimas. Pasirinktas klasterizavimo metodas – Euklido atstumas ryšiui tarp klasterių
lopment (KORSD-2009): 5th international conference, 2009.
Rasch, G. Probabilistic Models for some intel-ligence and Attainment Tests. Copenhagen:
Danish Institute for Educational Research, 19�0; Expanded edition: Chicago, The Uni-versity of Chicago Press, 1980.

SocietalStudies.2011,3(1): 77–93. 93
išmatuoti. Pasiūlyta metodika gali būti pritaikyta įvairiose žmogaus veiklos srityse, kuriose aktuali problema yra tiesiogiai neišmatuojamų objektų norminis vertinimas.
Reikšminiai žodžiai: užduoties sprendimo teorija,matematinismodeliavimas, testoinformacijos funkcija,aplinkossveikatingumoindeksas, latentinispožymis,norminisver-tinimas.
Aleksandras Krylovas, Mykolo Romerio universiteto Socialinės informatikos fakulteto Matematinio modeliavimo katedros profesorius; Vilniaus Gedimino technikos universiteto Fundamentinių mokslų fakulteto Matematinio modeliavimo katedros profesorius. Mokslinių tyrimų kryptys: matematinis mo-deliavimas, asimptotinė analizė, matematikos didaktika.
Aleksandras Krylovas, Mykolas Romeris University, Faculty of Social Informatics, Department of Mathematical Modelling, professor; Vilnius Gediminas Technical University, Faculty of Fundamental Sciences, Department of Mathematical Modelling, professor. Research interests: mathematical mode-ling, asymptotic analysis, didactics of mathematics.
Natalja Kosareva, Vilniaus Gedimino technikos universiteto Fundamentinių mokslų fakulteto Mate-matinio modeliavimo katedros docentė; Mykolo Romerio universiteto Socialinės informatikos fakul-teto Matematinio modeliavimo katedros docentė. Mokslinių tyrimų kryptys: matematinis modeliavi-mas, matematinė statistika ir jos taikymai, informacinės technologijos.
Natalja Kosareva, Vilnius Gediminas Technical University, Faculty of Fundamental Sciences, De-partment of Mathematical Modeling, associate professor; Mykolas Romeris University, Faculty of Social Informatics, Department of Mathematical Modeling, associate professor. Research interests: mathematical modeling, applications of mathematical statistics, information technologies.