
ITEM 7B - Coachella Valley Association of … · 2016-11-09 · ITEM 7B Staff Report Subject:...
113
ITEM 7B Staff Report Subject: Community Choice Aggregation: Business Plan/Feasibility Study Update Contact: Katie Barrows, Director of Environmental Resources ([email protected]) Recommendation: Information. Background: In April 2016, the Executive Committee authorized staff to proceed with a Community Choice Aggregation (CCA) Feasibility Study, in partnership with Western Riverside Council of Governments (WRCOG) and San Bernardino Associated Governments (SANBAG). At the September meeting of this Committee, a brief staff report was included as an information item. The first draft of the Feasibility Study, titled Inland Choice Power Community Choice Aggregation Business Plan, was still being reviewed by staff. The draft of this feasibility study was presented to the Executive Committee at their September 26 meeting. Gary Saleba from EES Consulting, Inc, part of the consultant team selected to prepare the CCA Feasibility Study, also made a presentation to provide background on community choice aggregation. Since then, several revisions have been made to address questions asked by staff and committee members from CVAG, WRCOG, and SANBAG. The attached 4 th draft of the feasibility study incorporates changes in response to these questions and is provided for your review. The study indicates that formation of a CCA would result in a net savings to consumers and an increased use of renewable energy. The study refers to the “TRICOG” area, including the member cities of CVAG, WRCOG, and SANBAG as well as the unincorporated areas of Riverside and San Bernardino Counties served by Southern California Edison. The study uses energy use data provided by Southern California Edison for jurisdictions from each region. The study estimates power supply costs, administrative costs, electric loads, and future retail rates for a potential CCA and compares rates for the TRICOG region with current SCE rates. These forecast rates are compared to determine if a CCA can offer competitive rates, better products, and superior customer service while also improving the environment and creating local jobs. At their September 26 meeting, based on the preliminary findings that CCA makes sense for our region, the Executive Committee directed staff to move forward with the development and implementation of a Community Choice Aggregation program and to return to the Executive Committee with additional information and recommendations on selection of governance and operational structures. The study analyzes three scenarios for consumer cost savings which vary depending on the percent renewable energy; in all cases the percent savings accounts for all costs to implement a CCA program. The predicted savings compared with SCE rates, are as follows: 1. 4.3% savings with 33% of electricity from renewable sources (based on SCE current renewable portfolio standard (RPS)) 2. 3.7% savings with 50% of electricity from renewable sources (11.2% savings over SCE 50% green power rate) 3. 3.7% additional cost with 100% of electricity from renewable sources (11.3% savings over SCE 100% green power rate)
Transcript of ITEM 7B - Coachella Valley Association of … · 2016-11-09 · ITEM 7B Staff Report Subject:...

ITEM 7B
Staff Report Subject: Community Choice Aggregation: Business Plan/Feasibility Study Update Contact: Katie Barrows, Director of Environmental Resources ([email protected]) Recommendation: Information. Background: In April 2016, the Executive Committee authorized staff to proceed with a Community Choice Aggregation (CCA) Feasibility Study, in partnership with Western Riverside Council of Governments (WRCOG) and San Bernardino Associated Governments (SANBAG). At the September meeting of this Committee, a brief staff report was included as an information item. The first draft of the Feasibility Study, titled Inland Choice Power Community Choice Aggregation Business Plan, was still being reviewed by staff. The draft of this feasibility study was presented to the Executive Committee at their September 26 meeting. Gary Saleba from EES Consulting, Inc, part of the consultant team selected to prepare the CCA Feasibility Study, also made a presentation to provide background on community choice aggregation. Since then, several revisions have been made to address questions asked by staff and committee members from CVAG, WRCOG, and SANBAG. The attached 4th draft of the feasibility study incorporates changes in response to these questions and is provided for your review. The study indicates that formation of a CCA would result in a net savings to consumers and an increased use of renewable energy. The study refers to the “TRICOG” area, including the member cities of CVAG, WRCOG, and SANBAG as well as the unincorporated areas of Riverside and San Bernardino Counties served by Southern California Edison. The study uses energy use data provided by Southern California Edison for jurisdictions from each region. The study estimates power supply costs, administrative costs, electric loads, and future retail rates for a potential CCA and compares rates for the TRICOG region with current SCE rates. These forecast rates are compared to determine if a CCA can offer competitive rates, better products, and superior customer service while also improving the environment and creating local jobs. At their September 26 meeting, based on the preliminary findings that CCA makes sense for our region, the Executive Committee directed staff to move forward with the development and implementation of a Community Choice Aggregation program and to return to the Executive Committee with additional information and recommendations on selection of governance and operational structures. The study analyzes three scenarios for consumer cost savings which vary depending on the percent renewable energy; in all cases the percent savings accounts for all costs to implement a CCA program. The predicted savings compared with SCE rates, are as follows:
1. 4.3% savings with 33% of electricity from renewable sources (based on SCE current renewable portfolio standard (RPS))
2. 3.7% savings with 50% of electricity from renewable sources (11.2% savings over SCE 50% green power rate)
3. 3.7% additional cost with 100% of electricity from renewable sources (11.3% savings over SCE 100% green power rate)
The feasibility study identifies other benefits of Community Choice Aggregation additional to cost savings for consumers. These benefits at full CCA implementation include: 1) local control over selection of energy resources including local renewable projects; 2) job creation with the potential for over 500 jobs to be created in the TRICOG region; 3) economic stimulus resulting from increase in disposable income associated with electricity bill savings; and 4) greenhouse gas emissions reduction equivalent to removing 275,000 to 485,000 cars from the road per year by 2018 assuming a 50% renewable energy target is achieved. With local control, Community Choice Aggregation also provides opportunities to offer programs to promote energy efficiency, renewable distributed generation, energy storage, and other clean energy benefits. These programs would also be expected to spur innovation in energy efficiency and renewable technologies. The development of a CCA could also promote investment in the diverse renewable energy resources in the Coachella Valley. Another aspect of a potential CCA that will need to be determined is the governance structure. Most of the functioning CCAs in California use a Joint Powers Authority governance model. A JPA provides a flexible framework for CCAs and in California, has been the preferred structure for an organization. A JPA also provides financial risk mitigation for its local government members. Outside of California, some CCAs use a third-party “turnkey” governance model. Related to the governance structure is the operational options for how to set up and organize a CCA. The draft report evaluates several options:
1) A joint CCA with WRCOG, SANBAG, and CVAG jurisdictions; 2) A separate CCA for each council of governments, with each agency providing a full
service CCA independently; 3) A “turnkey” option where the entire CCA operation would be outsourced to a third-party.
As part of the services provided, this stand-alone entity would manage and operate the CCA and could provide initial financing.
The feasibility study describes and evaluates these options in more detail. We are also gathering additional information about these options and how they are working in other areas. Staff from CVAG, WRCOG, Riverside County, and SANBAG are working together to explore governance structure options. This item will be presented to the Energy and Environmental Resources Committee at their November 10 meeting. It should be noted that the Energy and Environmental Resources Committee agenda packet included the 3rd draft of the feasibility study/business plan; the 4th draft included with this staff report was received after that agenda had been distributed.
At their meeting on August 23, the Riverside County Board of Supervisors authorized release of a request for proposals for CCA consulting and implementation services; the selection process is still being completed. CVAG staff is coordinating our efforts on CCA with Riverside County. The City of Rancho Mirage is also considering their own CCA and staff is coordinating with city staff as well. As requested at the April Executive Committee meeting, CVAG staff is also looking into options in Imperial Irrigation District (IID) service territory; the consultant team has also offered assistance in this regard. While formation of a CCA within the territory of a public utility such as IID is not allowed under current law, there may be opportunities for collaboration. We also anticipate outreach to various stakeholders as part of the evaluation of a CCA for this region. The consultant team has offered to provide an update to individual member jurisdictions upon request. The feasibility study concludes that the formation of a CCA in the service areas of CVAG, SANBAG, and WRCOG is financially prudent and will yield considerable benefits for residents and businesses in the Inland Empire. With the direction from the Executive Committee to move forward, the next steps for a CCA would include vetting and finalization of the draft business plan, determination of governance and operational structure, and selection of a vendor to provide power supply and data management services. One essential step is filing of an Implementation Plan with the California Public Utilities Commission and a notice of intent with SCE. Other actions include

establishing financing for start-up costs and data testing with SCE. Based on the estimated timeframe, these actions could be completed in 2017. Fiscal Analysis: The Executive Committee authorized expenditure of not to exceed $75,000 for CVAG’s share of the Feasibility Study in April. The joint feasibility study offers cost efficiencies for all agencies involved. The total cost of the Feasibility Study is divided in proportional shares among WRCOG, CVAG and SANBAG. CVAG’s share of the cost of the Feasibility Study is now estimated to be approximately $25,000. CVAG and WRCOG have executed an agreement including a schedule for payment of invoices associated with the CCA study for this partnership. Attachment:
1. Draft Community Choice Aggregation Business Plan (Feasibility Study).

Prepared by:
A registered professional engineering and management consulting firm with offices in Kirkland, WA and Portland, OR
www.eesconsulting.com
570 Kirkland Way, Suite 100 Kirkland, WA 98033
Telephone: (425) 889-2700
In conjunction with
Bevilacqua-Knight, Inc. (BKi)
www.bki.com
800 West Sixth Street, Suite 1250 Los Angeles, CA 90017
Telephone: (213) 213-1960
DRAFT
Inland Choice Power
Community Choice Aggregation Business Plan
November 7, 2016

DRAFT
570 Kirkland Way, Suite 100 Kirkland, Washington 98033 Telephone: 425 889-2700 Facsimile: 425 889-2725 A registered professional engineering corporation with offices in Kirkland, WA and Portland, OR
November 7, 2016
Ms. Katie Barrows Mr. Duane Baker Ms. Barbara Spoonhour CVAG SANBAG WRCOG 73-710 Fred Waring Drive 1170 W. 3rd Street 4080 Lemon Street Suite 200 2nd Floor 3rd Floor, MS 1032 Palm Desert, CA 92260 San Bernardino, CA 92410 Riverside, CA 92501
SUBJECT: Inland Choice Power Community Choice Aggregation Business Plan
Dear Ladies and Gentleman:
Please find attached EES Consulting, Inc.’s (EES) Draft Community Choice Aggregation (CCA) Business Plan (Plan) for Inland Choice Power (ICP). This Plan represents our work product in evaluating the prudency of implementing a CCA organization for Coachella Valley Association of Governments (CVAG), San Bernardino Associated Governments (SANBAG) and Western Riverside Council of Governments (WRCOG).
We want to thank you and your staff for your assistance in preparing this Plan. It has been a pleasure working with all of you on this project.
Please contact us directly if you have questions or if we may be of any further assistance. We will finalize this Plan after it has been reviewed and critiqued by all stakeholders, and meets with your final approval.
Very truly yours,
Gary Saleba President/CEO

DRAFT
INLAND CHOICE POWER— COMMUNITY CHOICE AGGREGATION BUSINESS PLAN i
Contents
CONTENTS ................................................................................................................................................................... I
EXECUTIVE SUMMARY ............................................................................................................................................... 1
BACKGROUND ................................................................................................................................................................... 1 DESCRIPTION OF ICP ........................................................................................................................................................... 1 GOVERNANCE OPTIONS AND BUSINESS STRUCTURE OPTIONS ..................................................................................................... 3 STAFFING LEVELS................................................................................................................................................................ 3 PLAN UNCERTAINTIES/RISKS ................................................................................................................................................ 4 RETAIL RATE CONSTRUCT ..................................................................................................................................................... 5 RETAIL RATE FORECAST OF SCE VERSUS ICP ............................................................................................................................ 5 RENEWABLE ENERGY IMPACTS .............................................................................................................................................. 7 ENERGY EFFICIENCY PROGRAMS ............................................................................................................................................ 8 ECONOMIC DEVELOPMENT .................................................................................................................................................. 8 GREEN HOUSE GAS IMPACTS ................................................................................................................................................ 9 OPERATIONAL OPTIONS ....................................................................................................................................................... 9 SUMMARY ...................................................................................................................................................................... 10
INTRODUCTION ........................................................................................................................................................ 12
BACKGROUND ................................................................................................................................................................. 12 OBJECTIVE ...................................................................................................................................................................... 12 ICP DESCRIPTION ............................................................................................................................................................. 13 CUSTOMER PARTICIPATION SCHEDULE.................................................................................................................................. 14 SUMMARY OF ICP’S PROPOSED GOVERNANCE AND OPERATIONS .............................................................................................. 15 PLAN OUTLINE ................................................................................................................................................................. 17 PLAN ORGANIZATION ........................................................................................................................................................ 18
LOAD REQUIREMENTS ............................................................................................................................................. 19
HISTORICAL CONSUMPTION ............................................................................................................................................... 19 ICP LAUNCH PHASES ........................................................................................................................................................ 22 ICP CUSTOMER PARTICIPATION RATES ................................................................................................................................. 23 FORECAST CONSUMPTION AND CUSTOMERS.......................................................................................................................... 24 RENEWABLE RESOURCE REQUIREMENT ................................................................................................................................ 25 RESOURCE ADEQUACY REQUIREMENTS ................................................................................................................................. 26
POWER SUPPLY STRATEGY AND COSTS .................................................................................................................... 27
RESOURCE STRATEGY ........................................................................................................................................................ 27 RESOURCE COSTS ............................................................................................................................................................. 27 TRANSMISSION ................................................................................................................................................................ 31 POWER MANAGEMENT/SCHEDULING AGENT ........................................................................................................................ 32 RESOURCE PORTFOLIOS ..................................................................................................................................................... 34
ICP COST OF SERVICE................................................................................................................................................ 41
COST OF SERVICE FOR ICP BASE CASE OPERATIONS ................................................................................................................ 41 POWER SUPPLY COSTS ...................................................................................................................................................... 41 NON-POWER SUPPLY COSTS .............................................................................................................................................. 42 UTILITY IMPLEMENTATION AND TRANSACTION CHARGES .......................................................................................................... 45 ESTIMATES OF THIRD PARTY CONTRACTOR COSTS .................................................................................................................. 46 ESTIMATED RESERVES ....................................................................................................................................................... 47 ESTIMATED NEW PROGRAMS FUND ..................................................................................................................................... 47 CASH FLOW ANALYSIS AND WORKING CAPITAL ...................................................................................................................... 47 TOTAL FINANCING REQUIREMENTS ...................................................................................................................................... 48 FINANCING PLAN ............................................................................................................................................................. 49

DRAFT
INLAND CHOICE POWER— COMMUNITY CHOICE AGGREGATION BUSINESS PLAN ii
COST OF SERVICE FOR THREE CCA OPERATIONS ..................................................................................................................... 49 TURNKEY ........................................................................................................................................................................ 52
PRODUCTS, SERVICES, RATES COMPARISON AND ENVIRONMENTAL/ECONOMIC IMPACTS .................................... 54
RATES PAID BY SCE BUNDLED CUSTOMERS ........................................................................................................................... 54 RATES PAID BY ICP CUSTOMERS ......................................................................................................................................... 54 RATE IMPACTS ................................................................................................................................................................. 56 LOCAL RESOURCES/BEHIND THE METER ICP PROGRAMS ......................................................................................................... 58 IMPACT OF RESOURCE PLAN ON GREENHOUSE GAS (GHG) EMISSIONS ......................................................................................... 59 ECONOMIC DEVELOPMENT ................................................................................................................................................ 59
SENSITIVITY ANALYSIS.............................................................................................................................................. 64
LOADS AND CUSTOMER PARTICIPATION RATES ....................................................................................................................... 65 SCE RATES AND SURCHARGES ............................................................................................................................................ 66 SENSITIVITY RESULTS ......................................................................................................................................................... 66 RISKS ............................................................................................................................................................................. 67 OPERATIONAL OPTIONS ..................................................................................................................................................... 68
SUMMARY AND RECOMMENDATIONS .................................................................................................................... 70
RATE IMPACTS AND COMPARISONS ...................................................................................................................................... 70 RENEWABLE ENERGY IMPACTS ............................................................................................................................................ 71 ENERGY EFFICIENCY PROGRAMS .......................................................................................................................................... 71 ECONOMIC DEVELOPMENT IMPACTS .................................................................................................................................... 72 IMPACT OF RESOURCE PLAN ON GREENHOUSE GAS (GHG) EMISSIONS ......................................................................................... 73 SUMMARY ...................................................................................................................................................................... 73
APPENDIX A – CITIES/COUNTIES EVALUATING CCA FEASIBILITY ............................................................................... 75
APPENDIX B – PROFORMA ANALYSES ...................................................................................................................... 76
APPENDIX C – ICP EXCLUDING RIVERSIDE COUNTY .................................................................................................. 77
APPENDIX D – GLOSSARY ......................................................................................................................................... 78

DRAFT
INLAND CHOICE POWER – COMMUNITY CHOICE AGGREGATION BUSINESS PLAN 1
Executive Summary
Background
The California legislature passed AB 117 in 2002 (amended in 2011 by SB 790) allowing all Cities, Counties, or groups of Cities and Counties to provide an electric power supply source to customers within their jurisdictions that are currently served by Southern California Edison, Pacific Gas & Electric or San Diego Gas & Electric (IOUs). Community Choice Aggregation (CCA) or Community Choice Energy (CCE) is a customer opt-out program where the CCA provides power supply and behind the meter services1, and the incumbent IOUs provide transmission and distribution (wires) service.
This Business Plan (Plan) evaluates the prudency of forming a CCA within three government associations: Coachella Valley Association of Governments (CVAG), San Bernardino Associated Governments (SANBAG) and Western Riverside Council of Governments (WRCOG). Collectively, this CCA is referred to in this Plan as Inland Choice Power (ICP). The proposed CCA will provide power supply and behind the meter services, while Southern California Edison (SCE) will continue to provide transmission and distribution services. Customers will be part of the ICP program until they proactively opt-out.
This Plan estimates ICP’s power supply costs, administrative costs, electric loads, and future retail rates and compares ICP’s rates to the incumbent SCE rates. These forecast rates are compared to determine if a CCA can offer competitive rates, better products and superior customer service while also improving the environment and creating local jobs.
Description of ICP
The Plan and structure of ICP are currently being analyzed by CVAG, SANBAG and WRCOG collectively. CVAG is the regional planning agency coordinating government services in the Coachella Valley, and has 10 Cities, Riverside County, the Agua Caliente Band of Cahuilla Indians and the Cabazon Band of Mission Indians as members. SANBAG is the council of governments and transportation planning agency for San Bernardino County. SANBAG’s members include 24 cities and San Bernardino County. WRCOG’s purpose is to unify Western Riverside County so that it can speak with a collective voice on important issues that affect its members and it consists of 17 Cities, Riverside County Board of Supervisors, the Eastern and Western Municipal Water Districts, and the Morongo Band of Mission Indians. The geographic area and customer base covered by CVAG, SANBAG and WRCOG are collectively called ICP. Two organizational scenarios are explored in this Plan. For the Plan’s “base case”, results are provided assuming one organization will operate a CCA for all three entities. This scenario is
1 For example, energy efficiency programs, net energy metering or other programs that promote the deployment of distributed energy resources.

DRAFT
INLAND CHOICE POWER – COMMUNITY CHOICE AGGREGATION BUSINESS PLAN 2
referred to as the “ICP” scenario. In addition, results are provided assuming three separate CCA’s will be formed. This scenario is referred to in the Plan as the “Three CCA” scenario.
For this Plan, it is assumed that service will be offered to customers in two phases. Phase 1 will include the members of ICP’s own municipal facilities in addition to 5 percent of non-municipal commercial facilities. In Phase 2, all customers located in the service area of ICP will be included in ICP. Exhibit ES-1 summarizes this phased approach to forming ICP, including the number of customers and load attendant with each phase. ICP’s total loads will represent roughly 30 percent of SCE’s total current electrical loads.
Exhibit ES-1 CCA Load, Customers, and Revenue by Phase in 2017*
Phase
Assumed Start
Eligibility
Customer Accounts
Peak Load***
(MW)
Average Load*** (aMW)
ICP
Annual Revenues (50% RPS)
ICP
Phase 1** July, 2017 Municipal + 5% Commercial
69,669 73 49 $24 million
Phase 2 January 2018 All Customers 961,139 3,951 1,720 $963 Million
CVAG
Phase 1** July, 2017 Municipal + 5% Commercial
10,116 7 6 $3.2 Million
Phase 2 January 2018 All Customers 108,594 517 209 $125 Million
SANBAG
Phase 1** July, 2017 Municipal + 5% Commercial
41,208 44 29 $13.8 Million
Phase 2 January 2018 All Customers 517,717 2,126 955 $535 Million
WRCOG
Phase 1** July, 2017 Municipal + 5% Commercial
18,346 22 14 $7.0 Million
Phase 2 January 2018 All Customers 334,828 1,343 555 $321 Million
*Estimates assume a 75% participation rate for residential customers, and a 65% participation rate for non-residential customers. **Phase 1 is assumed to run July – December of 2017. Therefore, load and revenue for this phase is estimated annual. ***Loads are expressed as wholesale, including losses of 6%.
This phasing strategy enables ICP to manage any start-up and operational issues before full scale operations are undertaken. In addition, this phasing strategy will allow ICP’s third party electricity suppliers, scheduling agents and data management entities to ramp up power supply procurement and bill processing over several months. It will also minimize the possibility of customers not participating in ICP. Finally, bad debt expense exposure should be minimal in Phase 1.
Within the base case, this Plan explores the prudency of full participation of all three COGs as one operating CCA. The results for the individual COG’s CCA option are also analyzed and provides insight into CCA operations if not all Cities participate. It is anticipated that the results of this Plan are scalable.

DRAFT
INLAND CHOICE POWER – COMMUNITY CHOICE AGGREGATION BUSINESS PLAN 3
The Plan assumed that the County of Riverside unincorporated area is part of ICP’s; however, Appendix C provides the results for ICP if the County of Riverside unincorporated area loads are not included in ICP.
Governance Options and Business Structure Options
To date, CCAs in California have implemented two governance models: Single Jurisdiction and Joint Powers Authority (JPA).
1. Single Jurisdiction Model: A jurisdiction individually establishes and operates a CCA and therefore retains full decision-making on revenues, power mix, and programs. The risk and liability also falls solely on this single jurisdiction. In this model, the jurisdiction will need to develop contractual language to minimize risk to the general fund, maintain adequate operating reserves, and proactively track regulatory activities and manage its energy portfolio. Lancaster Choice Energy and CleanPowerSF are examples of single jurisdiction operational models.
2. Joint Powers Authority (JPA) Model: The JPA functions as an independent public agency, operating on behalf of its member jurisdictions with shared decision-making authority. This shared structure distributes the risks and liability across multiple jurisdictions as well; however, it also dilutes local control. Marin Clean Energy, Sonoma Clean Power, and Peninsula Clean Energy are examples of JPAs.
Within each of these governance models, there are several business configurations that can be utilized. Given that CVAG, SANBAG, and WRCOG are already each a JPA, it is anticipated that a JPA will be the operating model used to govern ICP. In the event that ICP forms as three separate CCAs, the existing JPAs of CVAG, SANBAG, and WRCOG can likely provide governance services. Alternatively, if ICP elects to launch a single unified CCA, a new JPA can be formed or an existing JPA can be modified to run ICP with the other existing JPAs. The governance of a JPA anticipates that a Board of Directors (Board)will be appointed to set policies and procedures for an Executive Director who will be entrusted to manage the day-to-day operations of ICP.
Staffing Levels
For start-up, the Plan assumes an operating team will be employed prior to the Board’s selection of an Executive Director, per the example of other CCAs in California. This operating team includes one assistant Executive Director and one manager of policy and regulatory affairs and one administrative assistant. This team will be supported by consultants to manage and operate the CCA. ICP will have two options for long-term staffing after the initial start-up. The first option involves hiring internal staff incrementally to match workloads involved in forming ICP, managing contracts, and initiating customer outreach/marketing during the pre-operations period (Full Staff Scenario). In the alternative approach, the CCA would hire just three staff internally and contract out the remaining work to consultants (Minimum Staff Scenario). Throughout the rest of this Plan, it is assumed that ICP will transition to the Full Staff Scenario fairly quickly in order to provide

DRAFT
INLAND CHOICE POWER – COMMUNITY CHOICE AGGREGATION BUSINESS PLAN 4
conservative (high) estimates of total operating costs. It is important to note that staffing costs under the full staff scenario makes up less than 0.5 percent of the total ICP annual cost, however, it is expected that ICP will only add staffing as approved by the Board. Both staffing options are discussed further in the Plan.
Plan Uncertainties/Risks
The results of this Plan are subject to uncertainties. These uncertainties are evaluated in the Plan’s sensitivity analysis section. The list below provides a summary discussion of the key uncertainties of this Plan.
Market Price Forecasts – Market prices (and forecasts) are continually changing. The market price forecasts for electricity and natural gas utilized in this Plan are based on the best currently available information regarding future natural gas and electricity prices, and have been confirmed by recent wholesale power transactions in southern California. These types of forecasts vary over time. Thus, a range of market price forecasts are evaluated in the Plan’s sensitivity analysis.
Retail Rate Forecasts – The Plan forecasts both ICP and SCE retail rates. These forecasts are based on current information regarding inflation and other cost drivers. Unexpected impacts on rates are discussed in more detail in the Plan’s sensitivity analysis.
Forecasted Load and Customer Growth – The Plan bases the load forecasts on customer growth. Each of these forecasts includes a level of uncertainty. To illustrate the impacts of load uncertainty, low, medium, and high load forecasts are analyzed in the Plan’s sensitivity analysis.
Regulatory Risks – Unforeseen changes in legislation (California Public Utility Commission, State legislation and Federal legislation) may impact the results of this Plan. Sensitivities on these risks are also provided.
This sensitivity analysis shows that the ICP rates could be greater than SCE rates if: The Power Charge Indifference Adjustment (PCIA) becomes much larger. The PCIA is a charge
assessed by the IOU to cover generation costs acquired prior to CCA formation, sometimes
referred to as stranded costs,
ICP loads are much less than forecast, and
Wholesale market prices drop much lower than current rates after ICP enters power contracts,
allowing SCE a temporary advantage on generation rates.
Each of these three scenarios has a low probability of actually occurring. For example, wholesale market prices for natural gas/electricity are at all-time lows. The probability of any significantly further lowering of these prices is judged to be very small. The PCIA level should be fairly stable going forward as regulatory remedies are in play to stabilize the CCA and because the CCA community has become very vigilant in this area. Finally, this Plan assumes a relatively low customer participation rate of 75 percent for residential customers and 65 percent for non-residential customers, compared to the roughly 95 percent to 85 percent participation rates seen in California’s currently operating CCAs. It is very unlikely ICP loads will not meet or exceed those assumed in the Plan. Thus, the major risks of forming a CCA are manageable and small.

DRAFT
INLAND CHOICE POWER – COMMUNITY CHOICE AGGREGATION BUSINESS PLAN 5
Retail Rate Construct
This Plan evaluates the costs and resulting rates of operating ICP, and compares these rates to a comparable rate forecast for SCE. The analysis begins with a forecast of electrical loads and customers, incorporates several power supply resource portfolio options, and allows for the sensitivity or stress testing of input assumptions. ICP customers will see no obvious changes in electric service other than lower prices and potential increases in renewable resources in their power supply resource mix. Customers will pay the power supply charges set by ICP and no longer pay the costs of SCE power supply.
ICP’s power supply rate consists of power supply costs, ICP start-up costs, ICP staffing and operating costs, consulting support, SCE billing and regulatory charges, financing costs, reserves and SCE pass-through charges, such as the Power Cost Indifference Adjustment (PCIA) Charge, franchise charges, and other non-bypassable charges from SCE.
In addition to paying ICP’s power supply rate, ICP customers will pay the SCE delivery (wires) rate and all other non-power supply related charges on the SCE bill including the Utility User Taxes.
ICP will establish rates sufficient to recover all costs related to operation of the CCA. It is anticipated that ICP’s rate designs initially will mirror the structure of SCE’s rates with an appropriate discount so that rates similar to SCE’s can be provided to ICP's customers. In setting rates, the Plan’s financial analysis assumes the customer phase-in schedule noted above and assumes that the implementation costs are largely financed via a start-up loan. The information above is used to determine the retail rates for ICP. ICP rates are then compared to the SCE projected rates for ICP service area.
Retail Rate Forecast of SCE versus ICP
The first consequence for forming ICP is the retail rate impact as illustrated on ES-2. For this Plan, it has been assumed that the projected rate decrease is applied uniformly across all rate classes. Once established, it will be up to the ICP Board and staff to develop rates for each rate class that reflect cost of service. ES-2 compares SCE’s current total bundled rates (with 28 percent renewable power), SCE’s 50% Green Rate and 100% Green Rate compared to three comparable ICP rate options. For reference, the column headers noted on ES-2 are summarized below. RPS Bundled – ICP rates with the same share (currently 28 percent) of renewables as SCE’s
current power supply.
50% Green Bundled Rate – ICP rates with 50 percent renewable power.
100% Green Bundled Rates – ICP rates with 100 percent renewable power.
A rate schedule comparison of ICP’s rates and SCE’s rates follows.

DRAFT
INLAND CHOICE POWER – COMMUNITY CHOICE AGGREGATION BUSINESS PLAN 6
Exhibit ES-2 Indicative Rate Comparison in ¢/kWh (First Full Year of Service)
Rate Class Customer
Type
2017 Estimated
SCE Bundled
Rate*
ICP RPS Bundled
Rate
SCE 50% Green
Bundled Rate
ICP 50% Green
Bundled Rate
SCE 100% Green
Bundled Rate
ICP 100% Green
Bundled Rate
Residential Domestic 20.55 19.58 22.30 19.81 24.05 21.79
Residential Care Domestic 12.22 11.64 13.97 11.78 15.72 12.96
GS-1 Commercial 17.03 16.23 18.78 16.41 20.53 18.06
GS-2 Commercial 16.57 15.79 18.32 15.97 20.07 17.57
GS-3 Industrial 14.71 14.02 16.46 14.18 18.21 15.60
PA-2 Public
Authority 13.08 12.46 14.83 12.61 16.58 13.87
PA-3 Public
Authority 11.31 10.78 13.06 10.90 14.81 11.99
TOU-8 Secondary Domestic 13.07 12.45 14.82 12.60 16.57 13.86
TOU-8 Primary Commercial 11.84 11.28 13.59 11.41 15.34 12.55
TOU-8 Substation Industrial 7.76 7.39 9.51 7.48 11.26 8.23
Total ICP Rate Savings over Comparable SCE Rates of 50% or 100% Green
4.9% 11.2% 9.4%
Total ICP Rate Savings over SCE’s Standard Bundled Rate
4.9% 3.8% -5.7%
*SCE bundled average rate based on SCE’s ERRA 2017 Draft Filing As can be seen on Exhibit ES-2, the ICP RPS residential rate with an equal amount of renewable power (28 percent) to what SCE currently offers is 0.9/kWh or 4.7 percent lower. The ICP residential rate with 50 percent renewable power (compared to SCE’s 50 percent optional rate) is 2.5¢/kWh or 11.2 percent lower. The ICP residential rate with 100 percent green power (compared to SCE’s 100 percent) is 2.3¢/kWh or 9.4 percent lower. Appendix B contains the final proformas to support Exhibit ES-2.
Exhibit ES-2 shows the initial rate savings associated with the formation of a CCA. By referencing Appendix B, these initial savings increase after ICP becomes fully functional. The savings by rate schedule after ICP is fully functional are presented below in Exhibit ES-3.
Exhibit ES-3 CCA Rate Savings at Fully Functional Operations
Power Supply Scenario Range of Savings*
ICP RPS 4.5% - 5.7%
ICP 50% Renewable 3.1% - 4.5%
ICP 100% Renewable (5.7%) – (5.0%)
*Note Appendix B for detail.
The difference between the ICP bundled rate for residential consumers of 19.66¢/kWh and the ICP 50 percent renewable rate forecast of 19.81¢/kWh is close enough that the base case rate for this
DRAFT
INLAND CHOICE POWER – COMMUNITY CHOICE AGGREGATION BUSINESS PLAN 7
Plan is the ICP 50 percent renewable rate forecast. The difference in retail rates between the ICP RPS and the 50 percent green rate forecast is de minimis, and there is additional greenhouse gas (GHG) and economic development benefits associated with the 50 percent green power option being the Plan’s base case; however, the final decision of the base case rate scenario for ICP will ultimately rest with ICP’s Board. The 50 percent green baseline portfolio results initially in a savings over SCE’s RPS rate of 3.7 percent.
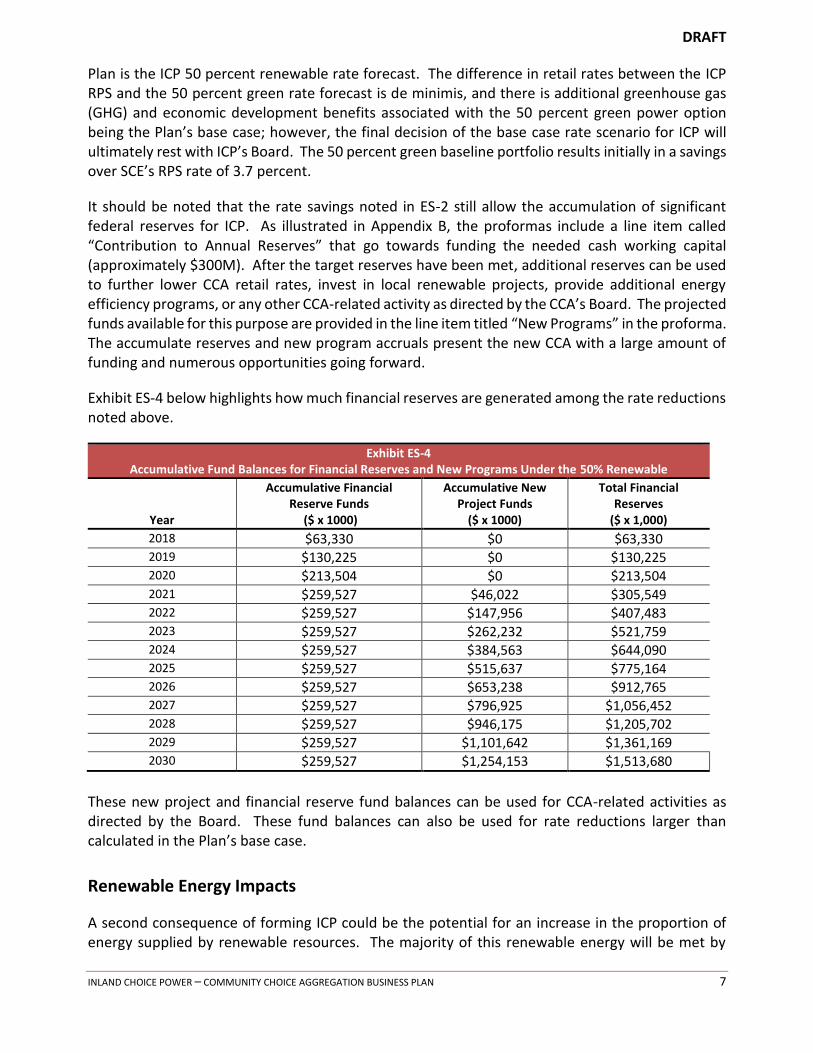
It should be noted that the rate savings noted in ES-2 still allow the accumulation of significant federal reserves for ICP. As illustrated in Appendix B, the proformas include a line item called “Contribution to Annual Reserves” that go towards funding the needed cash working capital (approximately $300M). After the target reserves have been met, additional reserves can be used to further lower CCA retail rates, invest in local renewable projects, provide additional energy efficiency programs, or any other CCA-related activity as directed by the CCA’s Board. The projected funds available for this purpose are provided in the line item titled “New Programs” in the proforma. The accumulate reserves and new program accruals present the new CCA with a large amount of funding and numerous opportunities going forward.
Exhibit ES-4 below highlights how much financial reserves are generated among the rate reductions noted above.
Exhibit ES-4 Accumulative Fund Balances for Financial Reserves and New Programs Under the 50% Renewable
Year
Accumulative Financial Reserve Funds
($ x 1000)
Accumulative New Project Funds
($ x 1000)
Total Financial Reserves
($ x 1,000)
2018 $63,330 $0 $63,330
2019 $130,225 $0 $130,225
2020 $213,504 $0 $213,504
2021 $259,527 $46,022 $305,549
2022 $259,527 $147,956 $407,483
2023 $259,527 $262,232 $521,759
2024 $259,527 $384,563 $644,090
2025 $259,527 $515,637 $775,164
2026 $259,527 $653,238 $912,765
2027 $259,527 $796,925 $1,056,452
2028 $259,527 $946,175 $1,205,702
2029 $259,527 $1,101,642 $1,361,169
2030 $259,527 $1,254,153 $1,513,680
These new project and financial reserve fund balances can be used for CCA-related activities as directed by the Board. These fund balances can also be used for rate reductions larger than calculated in the Plan’s base case.
Renewable Energy Impacts
A second consequence of forming ICP could be the potential for an increase in the proportion of energy supplied by renewable resources. The majority of this renewable energy will be met by

DRAFT
INLAND CHOICE POWER – COMMUNITY CHOICE AGGREGATION BUSINESS PLAN 8
renewable energy contracts or newly constructed renewable resources. By 2020, SCE must procure a minimum of 33 percent of its customers’ annual electricity usage from renewable resources due to the State’s Resource Portfolio Standard (RPS) mandate and the Energy Action Plan requirements of the California Public Utilities Commission (CPUC). In contrast, ICP customers will procure at least 50 percent renewable power from day one of ICP’s operation under the Plan’s base case which will come from new and/or local renewable resources.
Energy Efficiency Programs
A third consequence of the Plan is a potential increase in energy efficiency program investments and activities. The existing energy efficiency programs administered by SCE are not expected to change as a result of forming ICP. ICP customers will continue to pay the Public Goods Charges to SCE which funds energy efficiency programs for all customers, regardless of power supply provider. The energy efficiency programs ultimately planned by ICP will be in addition to the level of energy efficiency investment currently provided by SCE. Thus, ICP has the potential to increase energy savings with an attendant reduction in emissions due to expanded energy efficiency programs once a sufficient reserve fund has been built and initial debt repaid.
Economic Development
The fourth consequence of ICP is increased economic development. So far, the Plan’s analysis focuses on the direct impacts of reduced rates associated with forming ICP. However, in addition to these direct effects, indirect economic effects will also be encountered. The indirect effects of creating ICP include increased local investments, increased disposable income due to bill savings, and improved environmental and health conditions.
Exhibit ES-5 shows the economic impact resulting from $100 million in electric bill savings across the ICP service area. The $100 million rate savings represents an estimated bill savings per year achievable by ICP once Phase 2 operations are at steady state. It is estimated that these savings will create approximately 547 additional jobs in the ICP region and over $24.0 million in labor income. It is also projected that the total value added (revenues less cost of inputs) will be approximately $37.2 million and the total additional revenues and sales in the economy (output) is estimated to be over $54.9 million.
Exhibit ES-5 $100 Million Rate Savings Effects on ICP Economy
Impact Type Employment Labor Income Total Value Added Output
Direct Effect 388.0 $18.2 million $27.7 million $36.5 million
Indirect Effect2 60.3 $2.1 million $3.5 million $6.3 million
Induced Effect3 98.3 $3.8 million $7.0 million $12.1 million
Total Effect 546.6 $24.1 million $37.2 million $54.9 million
2 The Indirect effect describes the business-to-business transactions resulting from the direct effect outcomes. For example, the creation of ICP would directly create 388 additional jobs, and indirectly 60 jobs to support those 388 direct employees through increased demand for products and services in the area. 3 The Induced effect measure the effects of the changes in household income. For example, ICP will save all households and businesses in its service area on energy costs. As a result, households will have more money to spend in the local economy.

DRAFT
INLAND CHOICE POWER – COMMUNITY CHOICE AGGREGATION BUSINESS PLAN 9
In addition to increased economic activity due to electric bill savings, potential local projects can also create job and economic growth within the ICP service territory. As an example of the macroeconomic activity caused by local distributed energy resource (DER) deployment, this Plan analyzes the installation of 50 crystalline silicon, fixed mount solar systems with nameplate capacities of 1 MW each for a total capacity of 50 MW. Overall, the building of a 50 MW solar project is projected to create $87 million in earnings and $188 million in output (GDP) in the local economy along with 1,636 jobs during construction and 14 full-time jobs ongoing. ICP could examine installing a number of larger utility scale solar projects such as the one described.
Green House Gas Impacts
The fifth consequence of forming ICP could be environmental benefits. The amount of renewable power in SCE’s power supply portfolio is currently 28 percent4 and is scheduled to increase to 33 percent by 2020. Assuming ICP achieves a base case 50 percent RPS target at start-up, GHG emissions reductions attributable to ICP operations in 2019 will range from 1.33 to 2.34 million metric tons CO2 equivalent (CO2e) per year. ES-6 details these reductions.
Exhibit ES-6 Baseline Comparison of GHG Reduction by ICP in 2018
ICP CVAG SANBAG WRCOG
Forecast Renewables (50% Renewables) ICP (GWH) – Phase 2
7,533 916 4,184 2,433
ICP RPS (GWH) – Phase 2 4,219 513 2,343 1,362
Additional Green Power 3,315 403 1,841 1,070
CO2 reduction – Low (Million Metric tons CO2e) 1.33 0.16 0.74 0.43
CO2 reduction – High (Million Metric tons CO2e) 2.34 0.28 1.30 0.76
The reduction in GHG emissions associated with ICP operations is significant. This amount of reduced emissions represents a reduction in the emissions from the in-State generation resources of 2.6 to 4.6 percent.
Operational Options
There are several operational options available to ICP. For this Plan, it is assumed that there are three organizational options for ICP. These options are:
One CCA for the Three COGs
This option consolidates workload and maximizes efficiencies by having one CCA perform all “back office” duties, including power procurement and data management. At the same time, this option allows each COG to design locally-targeting branding, programs, and customer outreach.
4 http://www.cpuc.ca.gov/RPS_Homepage/

DRAFT
INLAND CHOICE POWER – COMMUNITY CHOICE AGGREGATION BUSINESS PLAN 10
Three CCAs Working Independently This option entails each of the three COGs providing a full service CCA to include power procurement, data management and local program development/outreach.
Outsource the Entire CCA Operation to a “Turnkey” Operator
Under this option, the COGs would hire a third-party entity to operate the entire CCA through “turnkey” CCA services. This option is different from the “Minimum Staffing” option described earlier in that a stand-alone entity would manage and operate the CCA with limited oversight by the COGs, Cities or Counties. As part of the services provided, this “turn-key” operator would provide initial financing and all cash working capital requirements. This option has not yet been tested in California.
Each option is critiqued and compared below, along with EES’s recommendations in this area.
The CCA operational option of one JPA for back office functions and have the local COGs brand and develop locally-specific programs and outreach results in the following:
Retail rates will be at their lowest.
Local control and choice in programs will be maintained.
A JPA organization provides a liability buffer between the CCA and its members.
This business model is currently being used by three operating CCAs in California with success.
The option to form three CCAs within ICP also has some initial appeal. If each COG formed a CCA, more local control would be achieved and potentially difficult governance issues are avoided; however, the goal of lowest possible rates would not be achieved. The back office functions (i.e., power procurement and data management) are fairly consistent on a per unit basis; however, the internal costs are about the same for a 100,000-meter utility, and a 1,000,000-meter utility. Based on the operating CCAs in California, CCA operation fully-staffed internally requires between 15 and 20 full-time or a small internal CCA with consultants doing all technical work. Total costs for these two options are about the same. As such, forming three CCAs versus one for back office functions costs the CCA customers an additional $7-8 million per year. This is a material amount of economic inefficiency or lost retail rate savings.
The turnkey option is initially attractive given it is zero-cost to the CCA and the ease of administration. The primary issue with a turnkey operation is that rates will likely be higher for customers. The utility industry is highly capital-intensive, so the cost of capital becomes a major driver of utility operating costs. Private third-parties incur roughly twice the cost of capital as would a city, county, or JPA-owned CCA. Therefore, the publicly-operated CCA will almost certainly be able to offer lower rates due to its favorably low borrowing costs. In addition, giving CCA operation to a third-party may somewhat compromise the CCA’s control over its power supply and other policies.
Summary
This Plan concludes that the formation of ICP in the service areas of CVAG, SANBAG and WRCOG is financially prudent and will yield considerable benefits for ICP’s residents and businesses. These

DRAFT
INLAND CHOICE POWER – COMMUNITY CHOICE AGGREGATION BUSINESS PLAN 11
benefits include a 3.7 percent lower rate for electricity (assuming the 50 percent renewable scenario) than is charged by SCE while receiving nearly twice the amount of renewable energy. Rate savings increase once the ICP is fully operational to 4.5 percent. With the achievement of Phase 2 level of operations, ICP will reduce GHG emissions by as much as 2.34 million metric tons of CO2e per year, add over 500 jobs, generate over $54 million in additional GDP, and give residents and businesses local control over their power supply and energy efficiency programs. Even with these stated rate savings, significant funding is still generated to support new programs, local DER and/or additional rate savings to the CCA’s customers.
There are risks associated with a CCA which are manageable. On balance, the formation of a CCA for CVAG, SANBAG and WRCOG is financially feasible and results in beneficial environmental/economic impacts. A joint CCA with common back office functions and local branding is the most economical operational option and is recommended.

DRAFT
INLAND CHOICE POWER – COMMUNITY CHOICE AGGREGATION BUSINESS PLAN 12
Introduction
Background
California’s legislature passed AB 117 in 2002 (amended in 2011 by SB 790) which allows all Cities, Counties, or groups of Cities and Counties to provide electric service to customers currently served by Investor-Owned Utilities (IOUs). Community Choice Aggregation (CCA) is the legislative organization empowered to provide this service. California CCAs are customer opt-out programs that provide power supply, data management and behind the meter services, while the incumbent IOUs continue to provide transmission and distribution (wires) service. This legislation states that CCAs will enable California to experience more competitive electricity rates, a more renewable power supply mix, and growth in local resources and associated economic activity. Currently, there are five CCAs operating in California and these utilities offer competitive rates for power supply that have a higher percentage of renewable resources. CCAs have also proven to promote local economic activity and their associated benefits. Several other California Cities and Counties are currently evaluating the feasibility of CCA formation within their jurisdictions. This information can be found in Appendix A.
There are several potential benefits of the CCA model in addition to competitive rates. Other benefits include local control over energy resources selection including renewable local projects, energy efficiency, a reduction in greenhouse gases (GHG), and more economic development. In addition, CCAs can minimize power supply rates and maximize renewable energy utilization with the attendant local jobs in the local community.
Objective
This Business Plan (Plan) evaluates the feasibility of forming a CCA within the SCE service area of Coachella Valley Association of Governments (CVAG), San Bernardino Associated Governments (SANBAG) and Western Riverside Council of Governments (WRCOG), collectively named Inland Choice Power (ICP). The proposed CCA will continue to provide power supply, data management and behind the meter services5, and Southern California Edison (SCE) will provide transmission and distribution (wires) services. This Plan estimates ICP’s power supply costs, administrative costs, electric loads, and future retail rates for ICP and the incumbent Investor-Owned Utility (IOU), Southern California Edison (SCE). These forecast rates are compared to determine if the proposed CCA can offer competitive rates, better products, and superior customer service. A sound financial and operational foundation for ICP must be achievable before the other desirable attributes of a CCA can be enjoyed.
Regarding the possible membership of ICP, CVAG is the regional planning agency coordinating government services in the Coachella Valley and has 10 Cities, Riverside County, the Agua Caliente
5 For example, energy efficiency programs, net energy metering or other programs that promote the deployment of distributed energy resources.

DRAFT
INLAND CHOICE POWER – COMMUNITY CHOICE AGGREGATION BUSINESS PLAN 13
Band of Cahuilla Indians and the Cabazon Band of Mission Indians as members. SANBAG is the council of government and transportation planning agency for San Bernardino County. SANBAG’s members include 24 cities and San Bernardino County. WRCOG’s purpose is to unify Western Riverside County so that it can speak with a collective voice on important issues that affect its members and it consists of 17 Cities, Riverside County Board of Supervisors, the Eastern and Western Municipal Water Districts, and the Morongo Band of Mission Indians. Combined, these three organizations are referred to in this Plan as ICP. Three governance scenarios are explored in this Plan. This provides information to each of the three COGs on the benefits and costs of implementing a CCA in their individual service area. It also provides information to the reader about the benefit and cost of different sizes of CCA load. For the base case in this Plan, results are provided assuming one organization will provide all back office functions (power supply and data management) for all three entities. This scenario is referred to as the “ICP” scenario. In addition, results will be provided assuming three separate CCA’s will be implemented, which would enable greater local branding and program optionality. This scenario is referred to as the “Separate CCA” scenario. Finally, a “turnkey” CCA operator is explored, wherein a third-party would bear the financial burden of operation in exchange for a share of revenues.
ICP Description
In 2015, before opt-outs, CVAG’s average annual wholesale load is 288 aMW (average Megawatts) with a peak load of 697 MW. SANBAG’s 2015 average annual wholesale load, before opt-outs, is 1,339 aMW with a peak demand of 2,950 MW, while WRCOG’s 2015 average wholesale annual load before opt-outs is 765 aMW with a peak demand of 1,819 MW. Energy consumption for the entire ICP area served by SCE is equal to more than 30 percent of SCE’s total retail load.
For this Plan, it is assumed that service will be offered to customers in two phases. Phase 1 assumes that municipal facilities within each COG in addition to 5 percent of each COG’s commercial accounts will be included into ICP. Phase 2 assumes all customers within ICP’s service area, including unincorporated Riverside County, are included in ICP. Exhibit 1 summarizes this phased approach to starting ICP and the amount of load attendant with each phase.

DRAFT
INLAND CHOICE POWER – COMMUNITY CHOICE AGGREGATION BUSINESS PLAN 14
Exhibit 1 CCA Load, Customers, and Revenue by Phase in 2017*
Phase
Assumed Start
Eligibility
Customer Accounts
Peak Load***
(MW)
Average Load*** (aMW)
ICP
Annual Revenues (50% RPS)
ICP
Phase 1** July, 2017 Municipal + 5% Commercial
69,669 73 49 $24 million
Phase 2 January 2018 All Customers 961,139 3,951 1,720 $963 Million
CVAG
Phase 1** July, 2017 Municipal + 5% Commercial
10,116 7 6 $3.2 Million
Phase 2 January 2018 All Customers 108,594 517 209 $125 Million
SANBAG
Phase 1** July, 2017 Municipal + 5% Commercial
41,208 44 29 $13.8 Million
Phase 2 January 2018 All Customers 517,717 2,126 955 $535 Million
WRCOG
Phase 1** July, 2017 Municipal + 5% Commercial
18,346 22 14 $7.0 Million
Phase 2 January 2018 All Customers 334,828 1,343 555 $321 Million
*Estimates assume a 75% participation rate for residential customers, and a 65% participation rate for non-residential customers. **Phase 1 is assumed to run July – December of 2017. Therefore, load and revenue for this phase is estimated annual. ***Loads are expressed as wholesale, including losses of 6%.
In addition, Appendix C provides the results for ICP if the unincorporated areas within the County of Riverside are not included in the analysis.
Customer Participation Schedule
Because of the number of Cities in ICP and the size of their associated loads, a phasing strategy is assumed for this Plan. This phasing strategy enables ICP to address any start-up and operational issues before full scale operations are undertaken. In addition, this strategy will allow ICP’s outside party electricity suppliers, scheduling agents and data managers to ramp up their activities.
By 2036, ICP is projected to serve almost 1.16 million retail customers after opt-outs with annual electricity sales potential of over 17,392 GWh. Annual ICP revenues at Phase 2 build-out are projected to be $1,500 million. In the same period, CVAG will serve over 132,000 customers with an average annual load of 2,110 GWh and revenues of $300 million. SANBAG will serve over 633,000 customers, a load of 9,677 GWh, and earn revenues of $550 million. WRCOG will serve almost 410,000 customers, a load of 5,605 GWh per year, and $330 million. The breakdown of projected sales in Phase 2 by major customer class is shown in the following Exhibit 2.

DRAFT
INLAND CHOICE POWER – COMMUNITY CHOICE AGGREGATION BUSINESS PLAN 15
Exhibit 2 Retail Energy Share by Rate Class
ICP CVAG
SANBAG WRCOG
Summary of ICP’s Proposed Governance and Operations
ICP will likely be established under the terms of a Joint Powers Authority (JPA), which will promote, develop and conduct electricity-related projects and programs for ICP’s residences and businesses. The JPA agreement will dictate the governance provisions of ICP. ICP activities will be overseen by the new JPA’s Board of Directors (Board). This Board will have primary responsibility for managing all aspects of ICP programs and providing policy guidance. The JPA will adopt an Implementation Plan, as required by the CCA legislation (AB 117), and register with the California Public Utilities Commission (CPUC) as a Community Choice Aggregator (CCA).
45%
30%
20%
4% 1%
53%
29%
11%
7% 1%
39%
32%
24%
4% 1%
51%
28%
15%
4% 1%
Residential Commercial Industrial Agricultural Lighting and Traffic

DRAFT
INLAND CHOICE POWER – COMMUNITY CHOICE AGGREGATION BUSINESS PLAN 16
Operations of ICP programs will be the responsibility of an Executive Director, appointed by ICP's Board. The Executive Director will manage staff, contractors and outside providers, in accordance with the general policies established by the Board. ICP has responsibilities over the functional areas of Finance, Legal/Regulatory, and Operations. This Plan assumes that ICP will utilize a combination of internal staff and consultants. Certain specialized functions are needed within ICP operations, namely those of electric supply procurement and data management. It is assumed that ICP will operate with minimal staff and consultant assistance to start. Under this scenario, the CCA staffing level will consist of an Executive Director and two support staff. During start-up, ICP can continue operating with a minimum staff level and rely on consultants to perform the majority of the tasks required. This option is referred to as the “Minimum Staff Scenario”. Another option available to ICP, would be for ICP to transition its administrative and operational responsibilities to internally staffed positions over time. Additional staffing would need to be approved by the Board. If ICP decides to follow a “Full Staff Scenario”, ICP will likely need a full time staff of approximately 15 – 20 employees to perform its responsibilities, primarily related to program and contract management, legal and regulatory, finance and accounting, energy efficiency, marketing and customer service. Even under the Full Staff Scenario, technical functions associated with managing and scheduling power suppliers and those related to retail customer billings will likely be performed by experienced outside consultants. The costs of a Fully Staffed CCA versus a CCA staffed mostly by consultants are estimated to be roughly equal. The proposed organization chart for ICP at full staff whether staffed with consultants or internal staff is provided below in Exhibit 3.
Exhibit 3 Sample Organization Chart
Executive Director
Assistant Executive
Director
Power Procurement
Consultant
Finance and Rate Manager
Accounting & Billing Analyst
Rates Analyst
Data Management &
Billing Consultant
Sales & Marketing Manager
Energy Efficiency Program Manager
2 Account Representatives
Communication Specialists
IT Manager
IT Specialist
Policy & Regulatory Manager
Regulatory Analyst
Regulatory Consultant
Regulatory Attorney
Human Resources Manager
HR Specialist
Administrative Assistant

DRAFT
INLAND CHOICE POWER – COMMUNITY CHOICE AGGREGATION BUSINESS PLAN 17
In order to develop a conservative financial proforma analysis, this Plan estimates operating costs assuming a Full Staff scenario. The known staffing costs for a CCA are based on staffing the entire organization internally (excluding power supply agents and data management). It is more difficult to estimate the cost of consultants providing all services other than data management and power supply given existing CCAs have transitioned to internal staffing fairly quickly. As such, this Plan used the internal staffing option in the cost analysis. However, it is expected that the Board would require ICP to go out to tender for consulting services and compare the cost-effectiveness of relying on consulting services versus staffing the CCA internally. Any further cost reductions associated with alternative staffing options would serve to make the CCA related rate savings even larger than portrayed in this Plan.
Plan Outline
This Plan evaluates the cost and resulting rates of operating ICP and compares these rates to a SCE rate forecast. This pro forma 20-year feasibility analysis models the following cost components:
Power Supply Costs:
• Wholesale purchase
• Renewable purchases
• Procurement of resource adequacy capacity
• Other power supply and charges
Non-Power Supply Costs:
• Start-up costs
• ICP staffing and administration costs
• Consulting support
• SCE and regulatory charges
• Reserves
• New Program Funding
• Financing costs (Start-up and Working Capital)
Pass-Through Charges from SCE:
• Transmission and distribution charges
• Power Cost Indifference Adjustment (PCIA) Charge
• Franchise Fee
• Other SCE non-bypassable charges
The information above is used to determine the retail rates for ICP. ICP rates are then compared to the SCE projected rates for ICP service area.

DRAFT
INLAND CHOICE POWER – COMMUNITY CHOICE AGGREGATION BUSINESS PLAN 18
Plan Organization
This Plan is organized into the following main sections:
Load Requirements
Power Supply Strategy and Costs
ICP Cost of Service
Products, Services, Rates Comparison and Environmental/Economic Considerations
Sensitivity Analysis
Summary and Recommendations
Each section is discussed in more detail below.

DRAFT
INLAND CHOICE POWER – COMMUNITY CHOICE AGGREGATION BUSINESS PLAN 19
Load Requirements
The viability of ICP depends to various degrees on the number of customers that participate in the CCA and the amount of energy they consume. This section of the Plan provides an overview of these projected values and the methodology used to estimate them.
Historical Consumption
SCE has provided monthly historical data on energy use (kWh), non-coincident peak load (kW), and number of accounts aggregated by rate class for both direct access (DA) and bundled customers for Cities expected to participate in ICP as well as unincorporated areas in the three associations for the 2015 calendar year. These include 7 cities in CVAG, 21 in SANBAG, 16 in WRCOG, as well as both the Riverside and San Bernardino county unincorporated areas. Collectively, CVAG, SANBAG, WRCOG, and the unincorporated counties used almost 20,000 GWh of electricity in 2015. Of this, SANBAG used 56 percent, WRCOG 32 percent, and CVAG 12 percent.
Bundled and Direct Access Customers
Bundled customers (full service) make up over 93 percent of total customer accounts across the three government associations and comprise approximately 85 percent of the total energy use. Direct access customers account for under 7 percent of customers, but use nearly 15 percent of the annual energy. Exhibits 4 and 5 summarize historic energy consumption and number of accounts for bundled and DA customers within the three COGs.
Exhibit 4 Bundled and Direct Access Customer Accounts by COG in 2015
Government Association Bundled Accounts DA Accounts Bundled Accounts
(% of total) DA Accounts (% of total)
CVAG 142,715 1,299 99% 1%
SANBAG 678,524 38,236 95% 5%
WRCOG 438,019 55,235 89% 11%
Total 1,259,258 89,545 93% 7%
Exhibit 5 Bundled and Direct Access Retail Load by COG in 2015
Government Association Bundled Load
(MWh) DA Load (MWh)
Bundled Load (% of total)
DA Load (% of total)
CVAG 2,370,751 79,197 97% 3%
SANBAG 11,085,138 2,043,264 84% 16%
WRCOG 6,312,021 1,285,402 83% 17%
Total 19,767,910 3,407,864 85% 15%

DRAFT
INLAND CHOICE POWER – COMMUNITY CHOICE AGGREGATION BUSINESS PLAN 20
Direct access customers purchase their power supply and other services from an electric service provider (ESP), rather than the incumbent utility. In California, eligibility for DA enrollment is currently limited to retail non-residential customers and enrollment is based on an annual lottery.6 Customers classified as taking service under direct access arrangements are not included in this Plan, as it is assumed that these customers will remain with their current ESPs.
City and Unincorporated Loads
Among bundled customers, approximately 79 percent are located within the 44 cities and account for 81 percent of annual energy usage in the three COGs as shown in Exhibit 6. Potential customers and energy consumption are shown in Exhibit 7 aggregated for each COG including the respective unincorporated load. Exhibit 8 illustrates the distribution of load by sector for each jurisdiction.
Exhibit 6 Bundled Load and Accounts by Jurisdiction Type in 2015
Jurisdiction Customer Accounts
Customer Accounts (% of total)
Annual Wholesale Load (GWh)
Energy Use (% of total)
Cities 994,814 79% 16,975 81%
Unincorporated 264,444 21% 3,982 19%
Total 1,259,258 100% 20,957 100%
Exhibit 7
Bundled Load and Accounts by Sector and COG
6 S.B. 286 (CA, 2015-2016 Reg. Sess.)
-
2,000
4,000
6,000
8,000
10,000
12,000
CVAG SANBAG WRCOG
Ener
gy U
se (
GW
h/y
r)
-
100
200
300
400
500
600
700
800
CVAG SANBAG WRCOG
Tho
usa
nd
s o
f C
ust
om
ers
Lighting
Agricultural
Industrial
Commercial
Residential

DRAFT
INLAND CHOICE POWER – COMMUNITY CHOICE AGGREGATION BUSINESS PLAN 21
Note: Riverside County unincorporated areas were split up between WRCOG and CVAG for the 3-CCA scenarios, but are represented as a single entity in this figure for comparison.
0 500 1000 1500 2000 2500
Blythe
Desert Hot Springs
Indian Wells
Cathedral City
Rancho Mirage
Palm Springs
Palm Desert
Banning
Calimesa
Canyon Lake
Wildomar
Norco
San Jacinto
Eastvale
Elsinore
Menifee
Perris
Hemet
Murrieta
Jurupa Valley
Temecula
Moreno Valley
Corona
Riverside Unincorp
Grand Terrace
Twentynine Palms
Yucca Valley
Adelanto
Loma Linda
Barstow
Montclair
Highland
Yucaipa
Chino Hills
Apple Valley
Hesperia
Upland
Rialto
Redlands
Chino
Victorville
Fontana
San Bernardino
Rancho Cucamonga
Ontario
San Bernardino Unincorp
GWh/year
WR
CO
G
Exhibit 8Bundled Energy Use by Jurisdiction and Sector
Residential Commercial Industrial Agriculture LightingSA
NB
AG
CV
AG

DRAFT
INLAND CHOICE POWER – COMMUNITY CHOICE AGGREGATION BUSINESS PLAN 22
ICP Launch Phases
For the purpose of this Plan, it has been assumed that the development of ICP will occur using a two-phase implementation schedule. Phase 1 will include all municipal facilities as well as 5 percent of private commercial accounts within the three COGs. Phase 1 includes the 5 percent non-municipal accounts to balance out the daily load profile of the municipal accounts, which on their own would not be representative of ICP as a whole. These non-municipal accounts will be recruited for participation in Phase 1 during the start-up of ICP. Phase 2 will enroll all remaining customers in the three COGs.
Municipal facility energy use and number of accounts was provided by CVAG, SANBAG, and WRCOG. That data, in combination with 5 percent of non-municipal commercial accounts, is summarized in Exhibit 9. This data provides the basis for Phase 1 of ICP’s Implementation Plan. Exhibit 10 shows the total number of eligible municipal facilities in the three COGs and their consumption.
Exhibit 9 Phase 1 Accounts and Load, July 2017
Location Customer Accounts
Customer Accounts (% of total)
Annual Wholesale Load (MWh)
Load (% of total)
CVAG 10,121 15% 51,678 13%
SANBAG 41,207 59% 239,845 58%
WRCOG 18,339 26% 119,963 29%
Total 69,667 100% 411,486 100%
Exhibit 10 shows energy consumption and customer distribution by sector for Phase 1 facilities.
Exhibit 10 Phase 1 Load Data by Rate Schedule
-
50,000,000
100,000,000
150,000,000
200,000,000
250,000,000
300,000,000
350,000,000
400,000,000
CVAG SANBAG WRCOG
Energy Use by Sector
-
10,000
20,000
30,000
40,000
50,000
60,000
70,000
CVAG SANBAG WRCOG
Number of Accounts by Sector
Lighting
Agricultural
Industrial
Commercial
Residential
DRAFT
INLAND CHOICE POWER – COMMUNITY CHOICE AGGREGATION BUSINESS PLAN 23
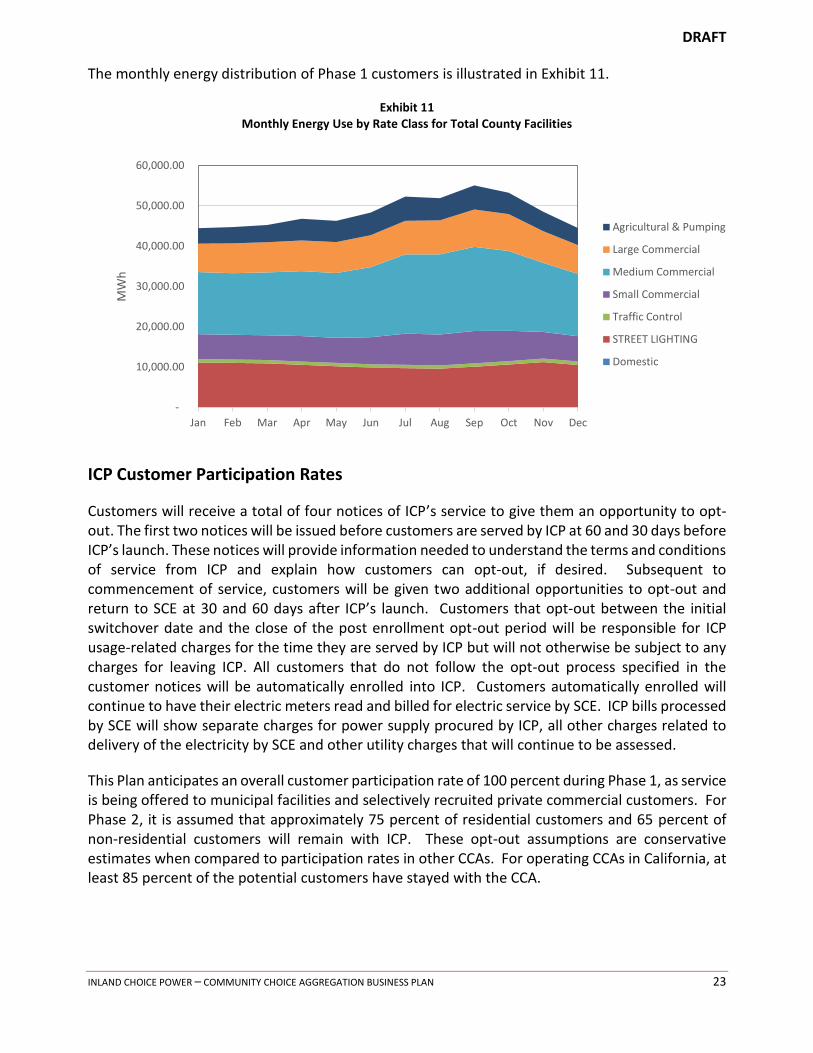
The monthly energy distribution of Phase 1 customers is illustrated in Exhibit 11.
Exhibit 11 Monthly Energy Use by Rate Class for Total County Facilities
ICP Customer Participation Rates
Customers will receive a total of four notices of ICP’s service to give them an opportunity to opt-out. The first two notices will be issued before customers are served by ICP at 60 and 30 days before ICP’s launch. These notices will provide information needed to understand the terms and conditions of service from ICP and explain how customers can opt-out, if desired. Subsequent to commencement of service, customers will be given two additional opportunities to opt-out and return to SCE at 30 and 60 days after ICP’s launch. Customers that opt-out between the initial switchover date and the close of the post enrollment opt-out period will be responsible for ICP usage-related charges for the time they are served by ICP but will not otherwise be subject to any charges for leaving ICP. All customers that do not follow the opt-out process specified in the customer notices will be automatically enrolled into ICP. Customers automatically enrolled will continue to have their electric meters read and billed for electric service by SCE. ICP bills processed by SCE will show separate charges for power supply procured by ICP, all other charges related to delivery of the electricity by SCE and other utility charges that will continue to be assessed.
This Plan anticipates an overall customer participation rate of 100 percent during Phase 1, as service is being offered to municipal facilities and selectively recruited private commercial customers. For Phase 2, it is assumed that approximately 75 percent of residential customers and 65 percent of non-residential customers will remain with ICP. These opt-out assumptions are conservative estimates when compared to participation rates in other CCAs. For operating CCAs in California, at least 85 percent of the potential customers have stayed with the CCA.
-
10,000.00
20,000.00
30,000.00
40,000.00
50,000.00
60,000.00
Jan Feb Mar Apr May Jun Jul Aug Sep Oct Nov Dec
MW
h
Agricultural & Pumping
Large Commercial
Medium Commercial
Small Commercial
Traffic Control
STREET LIGHTING
Domestic

DRAFT
INLAND CHOICE POWER – COMMUNITY CHOICE AGGREGATION BUSINESS PLAN 24
Forecast Consumption and Customers
Going forward, projections for customers enrolled in ICP and retail energy consumption have been forecast to increase at 1.13 percent per year. This forecast is based on the mid-case electricity demand forecasts for the SCE planning area, as reported to the California Energy Commission (CEC).7 Hourly electric consumption and peak demands have been estimated based on SCE’s hourly load profiles for each customer classification. The forecast of load served by ICP over the next 20 years is shown in Exhibit 12. This exhibit reflects an estimated annual growth of 1.13 percent. The ICP forecast of kWh sales reflects the roll-out and customer enrollment schedule shown above. Annual energy requirements are shown below in Exhibit 13.
Exhibit 12 Projected Load by Sector
Exhibit 13 ICP Projected Annual Energy Requirements
2017 2018 2019 2020 2021 2022 2023 2024 2025
Retail Sales (MWh)
386,383
14,207,376
14,367,920
14,530,277
14,694,469
14,860,517
15,028,441
15,198,262
15,370,003
Losses (MWh)
25,103
858,741
868,445
878,258
888,183
898,219
908,369
918,634
929,014 Total Load Requirements (MWh)
411,486
15,066,118
15,236,365
15,408,536
15,582,652
15,758,736
15,936,810
16,116,896
16,299,017
Max Demand (MW)
434
14,208
14,368
14,531
14,695
14,861
15,029
15,199
15,370
7 Southern California Edison. California Energy Demand Forecast, 2015-2025. July 2015. Sacramento, CA: California Energy Commission.
-
2,000,000
4,000,000
6,000,000
8,000,000
10,000,000
12,000,000
14,000,000
16,000,000
18,000,000
20,000,000
MW
h
Lighting
Agriculture
Industrial
Commercial
Residential

DRAFT
INLAND CHOICE POWER – COMMUNITY CHOICE AGGREGATION BUSINESS PLAN 25
Renewable Resource Requirement
In addition to estimating the potential retail loads and customers, current legislation requires that a certain percent of annual retail electric sales be supplied from qualified renewable energy resources.
SBX1 2 passed in April, 2011 established a 33 percent Renewable Portfolio Standard (RPS) requirement by 2020 with certain procurement targets prior to 2020. SBX1 2 also defined three types of renewable categories (or Buckets) that can be used to meet the RPS target.
Bucket 1 – Renewable resources located in California or out-of-state renewable resources that can meet strict scheduling requirement ensuring deliverability into California. According to SBX1 2 there are no limits on Bucket 1 renewable resources.
Bucket 2 – Bucket 2 renewable resources are firmed or shaped renewable resources not necessarily delivered to California, but an equivalent amount of energy is delivered from a different non-renewable resource and then bundled with Renewable Energy Certificates (RECs). Bucket 2 resources are limited to annual maximum of 20 percent of total RPS procurement through 2016 and 15 percent through 2020.
Bucket 3 – Bucket 3 consists of unbundled Renewable Energy Certificates which are separated from the actual electric energy. Bucket 3 resources are limited to an annual maximum of 15 percent of total RPS procurement through 2016 and 10 percent through 2020.
In addition, SB350 increased the RPS requirement to 50 percent by 2030. At this time, the amount of REC’s that can be used to meet the 50 percent RPS requirement has not been finalized.
Exhibit 14 provides an overview of the RPS requirements until 2030.
Exhibit 14 California RPS Requirements as a Percent of Total Power Supply

DRAFT
INLAND CHOICE POWER – COMMUNITY CHOICE AGGREGATION BUSINESS PLAN 26
ICP’s Plan has been developed assuming ICP will meet a 50 percent RPS target as soon as possible through renewable and non-renewable contracts, distributed generation and local resources.
ICP will exceed SCE’s renewable energy percentage from the first day of its operations when it meets its 50 percent goal. ICP will therefore significantly exceed the minimum RPS requirements and significantly exceed the renewable power share provided by SCE.
Resource Adequacy Requirements
In addition to determining the renewable resource requirement, ICP will also need to demonstrate it has sufficient physical power supply capacity to meet its projected peak demand plus a 15 percent planning reserve margin. This requirement is in accordance with resource adequacy regulation administered by the CPUC and the California Energy Commission (CEC).
The CPUC's resource adequacy standards applicable to ICP require a demonstration one year in advance that ICP has secured physical capacity for 90 percent of its projected peak demand for each of the five months May through September, plus a minimum 15 percent reserve margin. On a month-ahead basis, ICP must demonstrate 100 percent of the peak load plus a minimum 15 percent reserve margin.
The Plan’s load forecast estimates capacity needs, including resource capacity requirements, to be used for the power supply cost forecasting.

DRAFT
INLAND CHOICE POWER – COMMUNITY CHOICE AGGREGATION BUSINESS PLAN 27
Power Supply Strategy and Costs
This section of the Plan provides a discussion of the power supply resource cost forecasts, potential power supply strategies that could be implemented by ICP and provides power supply portfolio pricing based on the loads projected for ICP.
ICP will be charged with developing both short (one and two-year) and long-term (five to twenty years) resource plans. ICP will develop the resource plan under the guidance provided by its Joint Power Authority (JPA), in compliance with California law, and other requirements of California regulatory bodies (CPUC and CEC).
Long-term resource planning includes load forecasting and supply planning. ICP’s planners will develop Integrated Resource Plans (IRPs) that meet their supply objectives and balance cost, risk, and environmental considerations. Integrated resource planning considers demand side energy efficiency and demand response programs as well as traditional supply options. ICP will require a planning function even if the day-to-day supply operations are contracted to third parties. This will ensure that local preferences regarding the future composition of supply and demand resources are planned for, developed and implemented.
Resource Strategy
ICP may want to seek to maximize the use of local, cost-effective renewable generation resources in its IRP. The ability to invest capital in power supply and demand-side resources using tax-exempt financing is an important factor in ICP’s ability to increase the use of renewable energy while offering rates that are competitive with SCE. Power purchases from renewable and non-renewable resources will supply the remaining majority of the resource mix. ICP’s power supply portfolio will be managed by a third party electric supplier, at least during the initial implementation period. Through a power services agreement, the Plan assumes that ICP will obtain full service requirements electricity for its customers, including providing for all electric, ancillary services and the scheduling arrangements necessary to provide delivered electricity.
Resource Costs
For this Plan, individual resource costs are estimated and other energy providers based on current market condition, recent power supply contracts for renewable energy as well as a review of the applicable regulatory requirements.
Market Purchases
Natural gas-fired power plants are typically the marginal power supply resource that sets the electricity market price in southern California and elsewhere in the Western Energy Coordinating Council (WECC) footprint. WECC generally guides power supply resources west of the Rocky Mountains. As the market price of electricity is usually set by the cost of the marginal unit, a wholesale market price forecast has been developed using a forecast of natural gas prices and the projected relationship between gas prices and electricity prices (also defined as market-implied

DRAFT
INLAND CHOICE POWER – COMMUNITY CHOICE AGGREGATION BUSINESS PLAN 28
heat rates or spark spreads). The projected market-implied heat rates reflect the average efficiency of gas-fired power plants in California. Projected heat rates are based on historic market-implied heat rates which are calculated by dividing historic southern California (SP15) wholesale market prices by historic southern California natural gas prices. A natural gas price forecast has been developed based on NYMEX forward gas prices for the Henry Hub trading hub and southern California basis differentials. Projected market heat rates have then been applied to the southern California natural gas price forecast to calculate a wholesale electric market price forecast for southern California.
The following steps have been taken to produce the wholesale electric market price forecast:
1. Forward prices for natural gas at Henry Hub are available through June 2025. 2. The southern California basis differential is used to adjust the Henry Hub forward prices to
southern California prices. Southern California forward natural gas prices are equal to NYMEX forward prices (Henry Hub) plus the southern California basis. The southern California basis forward curve is available through December 2020. After December 2020, the monthly southern California basis is assumed to increase at 5 percent.
3. Projected monthly market-implied heat rates are multiplied by forecast southern California natural gas prices to calculate forecast southern California wholesale market prices.
4. Projected heat rates are based on historic heat rates (southern California wholesale electricity prices divided by SoCal natural gas prices).
5. Monthly market-implied heat rates are held constant in all years. 6. Forecast southern California wholesale electric market prices are escalated by a 3.5 percent
annual growth rate after June 2025. 7. Forecast southern California wholesale electric market prices are benchmarked against other
market price forecasts. Based on the methodology detailed above, southern California wholesale market prices are projected to escalate annually at an average rate of 3.7 percent over 2017 through 2036.
Exhibit 15 shows the forecast southern California natural gas prices.

DRAFT
INLAND CHOICE POWER – COMMUNITY CHOICE AGGREGATION BUSINESS PLAN 29
Exhibit 15 Forecast SoCal Natural Gas Price ($/MMBtu)
Exhibit 16 shows the resulting monthly southern California wholesale electric market price forecast. The levelized value of market prices over the study period is $41.6/MWh (2016$).
Exhibit 16 Forecast Southern California Wholesale Market Prices ($/MWh)
Wholesale power prices have been used to calculate balancing market purchases and sales. When ICP’s loads are greater than its resource capabilities, ICP’s scheduling agent will schedule balancing purchases and ICP will incur balancing market purchase costs. When ICP’s loads are less than its resource capabilities, ICP’s scheduling agent will transact balancing sales and ICP will receive market
0.0
0.5
1.0
1.5
2.0
2.5
3.0
3.5
4.0
4.5
5.0
Jan-
17
May
-17
Sep
-17
Jan-
18
Ma
y-1
8
Sep
-18
Jan-
19
Ma
y-1
9
Sep
-19
Jan-
20
May
-20
Sep
-20
Jan-
21
Ma
y-2
1
Sep
-21
Jan-
22
Ma
y-2
2
Sep
-22
Jan-
23
May
-23
Sep
-23
Jan-
24
May
-24
Sep
-24
Jan-
25
Ma
y-2
5
0
10
20
30
40
50
60
70
Jan-
17
No
v-1
7
Sep
-18
Jul-
19
May
-20
Mar
-21
Jan-
22
No
v-2
2
Sep
-23
Jul-
24
May
-25
Mar
-26
Jan-
27
No
v-2
7
Sep
-28
Jul-
29
May
-30
Mar
-31
Jan-
32
No
v-3
2
Sep
-33
Jul-
34
May
-35
Mar
-36

DRAFT
INLAND CHOICE POWER – COMMUNITY CHOICE AGGREGATION BUSINESS PLAN 30
sales revenue. Balancing market purchases and sales can be transacted on a monthly, daily and hourly pre-schedule basis.
Renewable Energy
The wholesale market prices shown above are for “non-renewable” power (i.e., this product does not come with any renewable energy credit (REC) attributes). The cost of renewable resources varies greatly. Wind and solar levelized project costs vary from $35 to $60/MWh. Geothermal project costs can vary from $70 to $100/MWh. The availability of off-shore wind and ocean power in the marketplace is fairly minimal and, as such, these resources were not included in the assessment of renewable energy market prices.
Based on a survey of renewable resources currently in operation and new projects coming on-line, a base case renewable energy market price of $42/MWh has been determined. Renewable energy prices may increase in the future as the demand for renewable energy increases due to California’s RPS. However, renewable prices are being driven down by solar project costs which have declined sharply over the past few years and are expected to continue to decrease over the next 10 to 20 years. Again, the renewable energy prices have been independently confirmed by current market tenders in southern California.
Projected power costs in this Plan are calculated using the base case renewable energy market price of $42/MWh. The amount of renewable energy purchased will be assumed to be equal to the RPS requirements in the base case. A higher case of 50 and 100 percent renewable energy will also be considered later in this Plan. In the “100 percent renewables” case the renewable energy market price was increased to $52/MWh. The $42/MWh price was based on an assumption that renewable purchases would be served almost exclusively with the output from solar projects. In the “100 percent renewables” case a higher price was assumed in recognition that a more diverse, and therefore more expensive, renewable energy portfolio would be needed. As such, the $52/MWh is a blend of projected solar, geothermal and wind project costs. This is a conservative assumption as current solar contracts have a market value of $35 - $40/MWh.
Renewable Energy Credits (RECs)
As noted earlier, California load serving entities must purchase renewable energy or attributes that meet certain eligibility requirements across three categories or buckets. Each of the buckets represents a different type of renewable energy and can be used to meet a specific percent of the total. The shares of each bucket also changes over time. The three buckets and the type of energy included in each bucket can be summarized as follows:
Bucket 1: In-state renewable generation
Bucket 2: Firmed and shaped renewable energy products from a generator that has its first
point of interconnection with a California Balancing Authority (such as the CAISO)
Bucket 3: Energy is not included with the RECs (also known as unbundled RECs)
Under the current guidelines, the amount of RECs procured through Buckets 2 and 3 is limited and decreases over time. Historically, the first bucket has been the most expensive type of energy to purchase and load serving entities were only procuring the minimum they need to meet the RPS

DRAFT
INLAND CHOICE POWER – COMMUNITY CHOICE AGGREGATION BUSINESS PLAN 31
requirement. However, with the decrease in solar project costs, Bucket 1 has become relatively less expensive (compared to Buckets 2 and 3).
RECs are not generally viewed as good for the development of new local renewable projects. In addition, the REC market is not as liquid as it once was. For the Plan’s base case, unbundled REC prices are assumed to increase from $10/REC in 2017 to $20 in 2036 (3.7 percent annual escalation). Due to the decline in solar project costs, the cost of unbundled RECs to meet RPS requirements and wholesale market purchases to meet load are negligible. Due to this shift in market dynamics, Bucket 3 RECs are no longer the least expensive option (as they were historically).
The Plan assumes that ICP will not rely on REC purchases to meet RPS requirements. The REC market can, however, be used to balance RPS requirements with renewable energy acquisitions. If ICP is short of RECs in a given compliance year, RECs could be purchased to meet the requirements. If the CCA is long on RECs in a given compliance year, surplus RECs could be sold.
Transmission
ICP will pay the CAISO for transmission congestion and ancillary services. Transmission congestion occurs when there is insufficient capacity to meet the demands of all transmission customers. Congestion refers to a shortage of transmission capacity to supply a waiting market, and is marked by systems running at full capacity and still being unable to serve the needs of all customers. The transmission system is not allowed to run above its rated capacities. Congestion is managed by the CAISO by charging congestion charges in the day-ahead market. Congestion charges can be managed through the use of Congestion Revenue Rights (CRR). CRRs are financial instruments made available through a CRR allocation, a CRR auction, and a secondary registration system. CRR holders manage variability in congestion costs. The CCA’s congestion charges will depend on the transmission paths used to bring resources to load. As such, the location of generating resources used to serve ICP load will impact these congestion costs.
The Grid Management Charge (GMC) is the vehicle through which the CAISO recovers its administrative and capital costs from the entities that utilize the CAISO’s services. ICP’s Grid Management Charges are expected to near $0.5/MWh.
The CAISO performs annual studies to identify the minimum local resource capacity required in each local area to meet established reliability criteria. Load serving entities receive a proportional allocation of the minimum required local resource capacity by transmission access charge area, and submit resource adequacy plans to show that they have procured the necessary capacity. Depending on these results of the annual studies, there may be costs associated with local capacity requirements for ICP.
Because generation is delivered as it is produced and particularly with respect to renewables can be intermittent, deliveries need to be firmed using ancillary services to meet ICP’s load requirements. Ancillary services will need to be purchased from the CAISO. Regulation and operating reserves are described below.
Regulation Service: Regulation service is necessary to provide for the continuous balancing of resources with load and for maintaining scheduled interconnection frequency at 60 cycles per
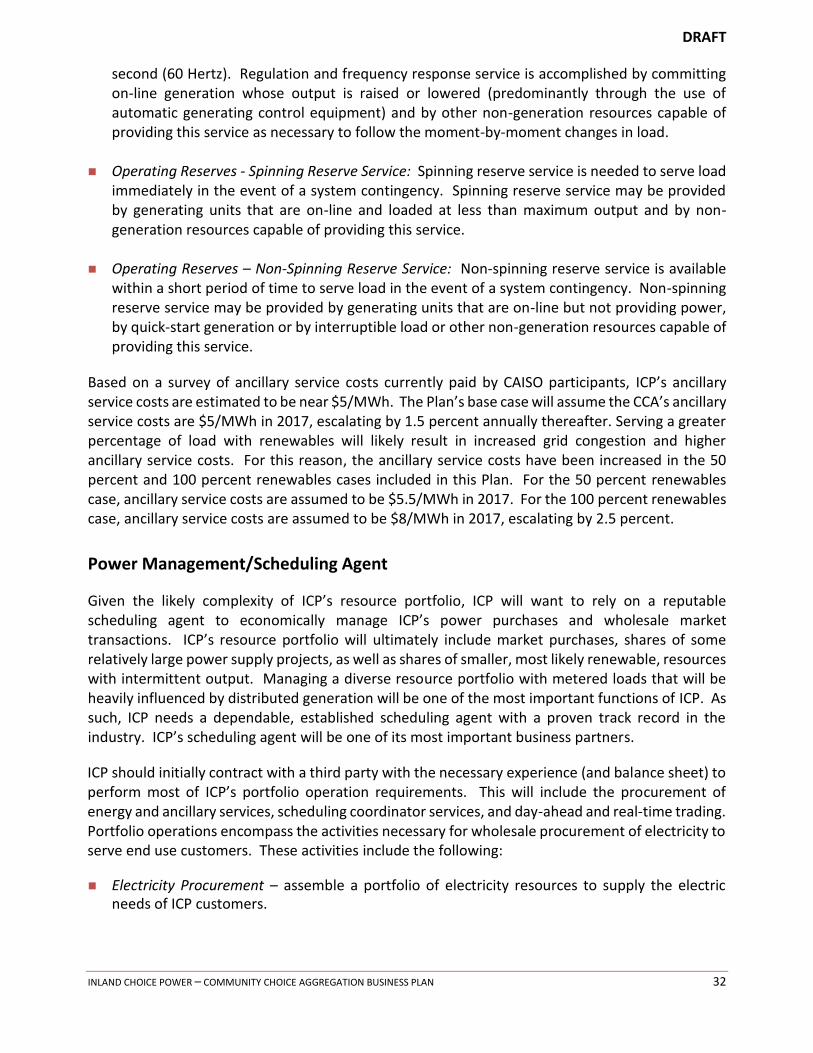
DRAFT
INLAND CHOICE POWER – COMMUNITY CHOICE AGGREGATION BUSINESS PLAN 32
second (60 Hertz). Regulation and frequency response service is accomplished by committing on-line generation whose output is raised or lowered (predominantly through the use of automatic generating control equipment) and by other non-generation resources capable of providing this service as necessary to follow the moment-by-moment changes in load.
Operating Reserves - Spinning Reserve Service: Spinning reserve service is needed to serve load immediately in the event of a system contingency. Spinning reserve service may be provided by generating units that are on-line and loaded at less than maximum output and by non-generation resources capable of providing this service.
Operating Reserves – Non-Spinning Reserve Service: Non-spinning reserve service is available within a short period of time to serve load in the event of a system contingency. Non-spinning reserve service may be provided by generating units that are on-line but not providing power, by quick-start generation or by interruptible load or other non-generation resources capable of providing this service.
Based on a survey of ancillary service costs currently paid by CAISO participants, ICP’s ancillary service costs are estimated to be near $5/MWh. The Plan’s base case will assume the CCA’s ancillary service costs are $5/MWh in 2017, escalating by 1.5 percent annually thereafter. Serving a greater percentage of load with renewables will likely result in increased grid congestion and higher ancillary service costs. For this reason, the ancillary service costs have been increased in the 50 percent and 100 percent renewables cases included in this Plan. For the 50 percent renewables case, ancillary service costs are assumed to be $5.5/MWh in 2017. For the 100 percent renewables case, ancillary service costs are assumed to be $8/MWh in 2017, escalating by 2.5 percent.
Power Management/Scheduling Agent
Given the likely complexity of ICP’s resource portfolio, ICP will want to rely on a reputable scheduling agent to economically manage ICP’s power purchases and wholesale market transactions. ICP’s resource portfolio will ultimately include market purchases, shares of some relatively large power supply projects, as well as shares of smaller, most likely renewable, resources with intermittent output. Managing a diverse resource portfolio with metered loads that will be heavily influenced by distributed generation will be one of the most important functions of ICP. As such, ICP needs a dependable, established scheduling agent with a proven track record in the industry. ICP’s scheduling agent will be one of its most important business partners.
ICP should initially contract with a third party with the necessary experience (and balance sheet) to perform most of ICP’s portfolio operation requirements. This will include the procurement of energy and ancillary services, scheduling coordinator services, and day-ahead and real-time trading. Portfolio operations encompass the activities necessary for wholesale procurement of electricity to serve end use customers. These activities include the following:
Electricity Procurement – assemble a portfolio of electricity resources to supply the electric needs of ICP customers.

DRAFT
INLAND CHOICE POWER – COMMUNITY CHOICE AGGREGATION BUSINESS PLAN 33
Risk Management – standard industry risk management techniques will be employed to reduce exposure to the volatility of energy markets and insulate customer rates from sudden changes in wholesale market prices.
Load Forecasting – develop accurate load forecasts, both long term for resource planning, and short-term for the electricity purchases and sales needed to maintain a balance between hourly resources and loads.
Scheduling Coordination – scheduling and settling electric supply transactions with the CAISO.
ICP should approve and adopt a set of protocols that will serve as the risk management tools for ICP and any third party involved in ICP portfolio operations. Protocols will define risk management policies and procedures, and a process for ensuring compliance throughout the organization. During the initial start-up period, the chosen full requirements electric suppliers will bear the majority of risks and be responsible for their management. Development of protocols can take place during the first few months of ICP operations to cover electricity procurement activities.
A scheduling agent provides day-ahead and real-time power and transmission scheduling services. Scheduling agents bear the responsibility for accurate and timely load forecasting and resource scheduling including wholesale power purchases and sales required to maintain hourly load/resource balances. A scheduling agent needs to provide the marketing expertise and analytical tools required to optimally dispatch ICP’s surplus resources on a monthly, daily and hourly basis.
Inside each hour, the CAISO Energy Imbalance Market (EIM) takes over load/resource balancing duties. The EIM automatically balances loads and resources every fifteen minutes and dispatches least-cost resources every 5-minutes. The EIM allows balancing authorities to share reserves, and more reliably and efficiently integrate renewable resources across a larger geographic region.
Within a given hour, metered energy (i.e. actual usage) may differ from supplied power due to hourly variations in resource output or unexpected load deviations. Deviations between metered energy and supplied power are accounted for by the EIM. The imbalance market is used to resolve imbalances between supply and demand. The EIM deals only with energy, not ancillary services or reserves (which are addressed in the next section).
The EIM optimally dispatches participating resources to maintain load/resource balance in real-time. The EIM uses the CAISO’s real-time market which uses Security Constrained Economic Dispatch (SCED). SCED finds the lowest cost generation to serve the load taking into account operational constraints such as limits on generators or transmission facilities. The five-minute market automatically procures generation needed to meet future imbalances. The purpose of the five-minute market is to meet the very short term load forecast. Dispatch instructions are effectuated through the Automated Dispatch System (ADS).
The CAISO is the market operator, and runs and settles EIM transactions. ICP’s scheduling agent will submit ICP’s load and resource information to the market operator. EIM processes are running continuously for every fifteen-minute and five-minute intervals, producing dispatch instructions and prices.
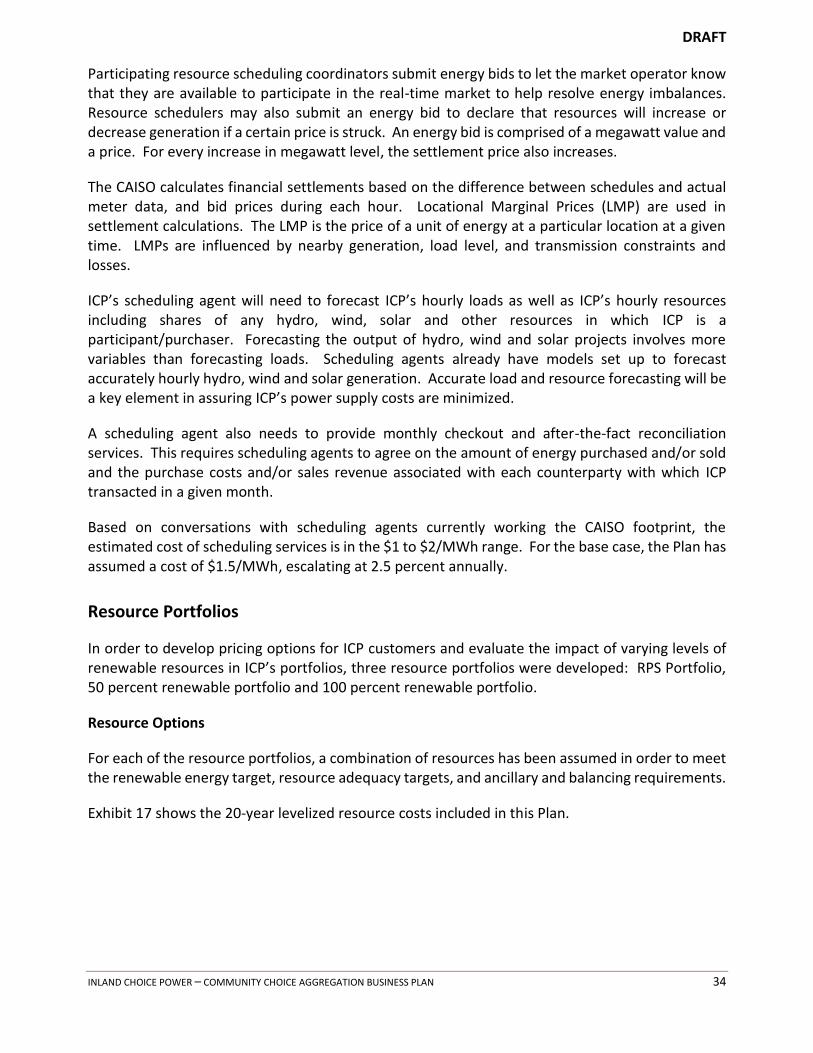
DRAFT
INLAND CHOICE POWER – COMMUNITY CHOICE AGGREGATION BUSINESS PLAN 34
Participating resource scheduling coordinators submit energy bids to let the market operator know that they are available to participate in the real-time market to help resolve energy imbalances. Resource schedulers may also submit an energy bid to declare that resources will increase or decrease generation if a certain price is struck. An energy bid is comprised of a megawatt value and a price. For every increase in megawatt level, the settlement price also increases.
The CAISO calculates financial settlements based on the difference between schedules and actual meter data, and bid prices during each hour. Locational Marginal Prices (LMP) are used in settlement calculations. The LMP is the price of a unit of energy at a particular location at a given time. LMPs are influenced by nearby generation, load level, and transmission constraints and losses.
ICP’s scheduling agent will need to forecast ICP’s hourly loads as well as ICP’s hourly resources including shares of any hydro, wind, solar and other resources in which ICP is a participant/purchaser. Forecasting the output of hydro, wind and solar projects involves more variables than forecasting loads. Scheduling agents already have models set up to forecast accurately hourly hydro, wind and solar generation. Accurate load and resource forecasting will be a key element in assuring ICP’s power supply costs are minimized.
A scheduling agent also needs to provide monthly checkout and after-the-fact reconciliation services. This requires scheduling agents to agree on the amount of energy purchased and/or sold and the purchase costs and/or sales revenue associated with each counterparty with which ICP transacted in a given month.
Based on conversations with scheduling agents currently working the CAISO footprint, the estimated cost of scheduling services is in the $1 to $2/MWh range. For the base case, the Plan has assumed a cost of $1.5/MWh, escalating at 2.5 percent annually.
Resource Portfolios
In order to develop pricing options for ICP customers and evaluate the impact of varying levels of renewable resources in ICP’s portfolios, three resource portfolios were developed: RPS Portfolio, 50 percent renewable portfolio and 100 percent renewable portfolio.
Resource Options
For each of the resource portfolios, a combination of resources has been assumed in order to meet the renewable energy target, resource adequacy targets, and ancillary and balancing requirements.
Exhibit 17 shows the 20-year levelized resource costs included in this Plan.

DRAFT
INLAND CHOICE POWER – COMMUNITY CHOICE AGGREGATION BUSINESS PLAN 35
Exhibit 17 20-Year Levelized Cost
(2016 $/MWH)
Exhibit 17 above includes both spot market and market PPA costs. It is assumed that these costs are primarily for natural gas resources although the specific resource source cannot be determined from a spot market purchase. Market PPA costs are greater than spot market costs in recognition of the cost of the PPA supplier absorbing the market price risk associated with providing a long-term PPA contract price.
The capacity factor for market PPA purchases is assumed to be 100 percent (flat monthly blocks of power). The average monthly capacity factor for renewable resources and local renewables is assumed to be 33 percent. The capacity factor for non-renewable resources is assumed to be 80 percent. As noted above, the cost of renewable resources was increased from $42/MWh to $52/MWh in the 100 percent renewables case in recognition of the need for a more diverse mix of renewable resources. Again, this higher price may be mitigated if large solar projects continue to be pursued in California.
As shown above, the base case 20-year levelized cost of renewable resources is comparable to the 20-year levelized cost of market purchases. The cost of solar projects has declined significantly over the past few years. The $42/MWh projection is based on the cost of relatively new solar projects that reflect the decreased costs, on a $/watt basis, of solar projects and the extension of the Federal production tax credit. The $/watt is expected to continue to decrease in future years. As such, the cost of the output of solar projects is expected to continue to decrease.
On a $/watt basis, the cost of smaller scale solar projects is greater than the cost of large scale solar projects. The $65/MWh cost associated with local renewables reflects this trend. The advantage of local renewable projects is lower transmission costs and less stress on the congested transmission grid.
41.6 42.044.3
60.0
65.0
0
10
20
30
40
50
60
70
Spot Market Renewable Resources Market PPA Natural Gas-Fired Local Renewables
$/M
Wh

DRAFT
INLAND CHOICE POWER – COMMUNITY CHOICE AGGREGATION BUSINESS PLAN 36
A more detailed description of each ICP power supply portfolio option follows.
Portfolio 1: Meet Current RPS Requirements (Baseline Portfolio, similar to current SCE resource mix)
In the first portfolio, ICP will meet the State RPS requirements shown below:
2017-19: 25 percent
2020-23: 33 percent
2024-26: 40 percent
2027-29: 45 percent
Post-2030: 50 percent
As shown above, due to the decrease in the cost of solar projects, the projected cost of renewables is comparable to the cost of market power and less than the cost of new gas-fired generation. Exhibit 18 shows the power supply portfolio used to serve load in Portfolio 1.
Exhibit 18 Portfolio 1: Meet RPS Requirements (aMW)
The green bars increase each year along with California’s RPS requirements. The costs associated with this portfolio could be reduced if it was assumed that more power was purchased from market PPAs instead of non-renewable (natural gas-fired) resources. The percent of non-renewable energy purchased via market PPAs, as opposed to natural gas-fired resources, is the same in each of the three portfolios.
Portfolio 2: Serve 50% of Retail Load with Renewables Starting on Day 1
In this portfolio, the 50 percent renewable energy purchase requirement in the RPS is effectively moved up from 2030 to January 1, 2017. Beginning in 2018, the amount of power purchased from
-
500
1,000
1,500
2,000
2,500
2017 2018 2019 2020 2021 2022 2023 2024 2025 2026 2027 2028 2029 2030 2031 2032 2033 2034 2035 2036
Market PPA Natural Gas-Fired Renewables Local Renewables Spot Market
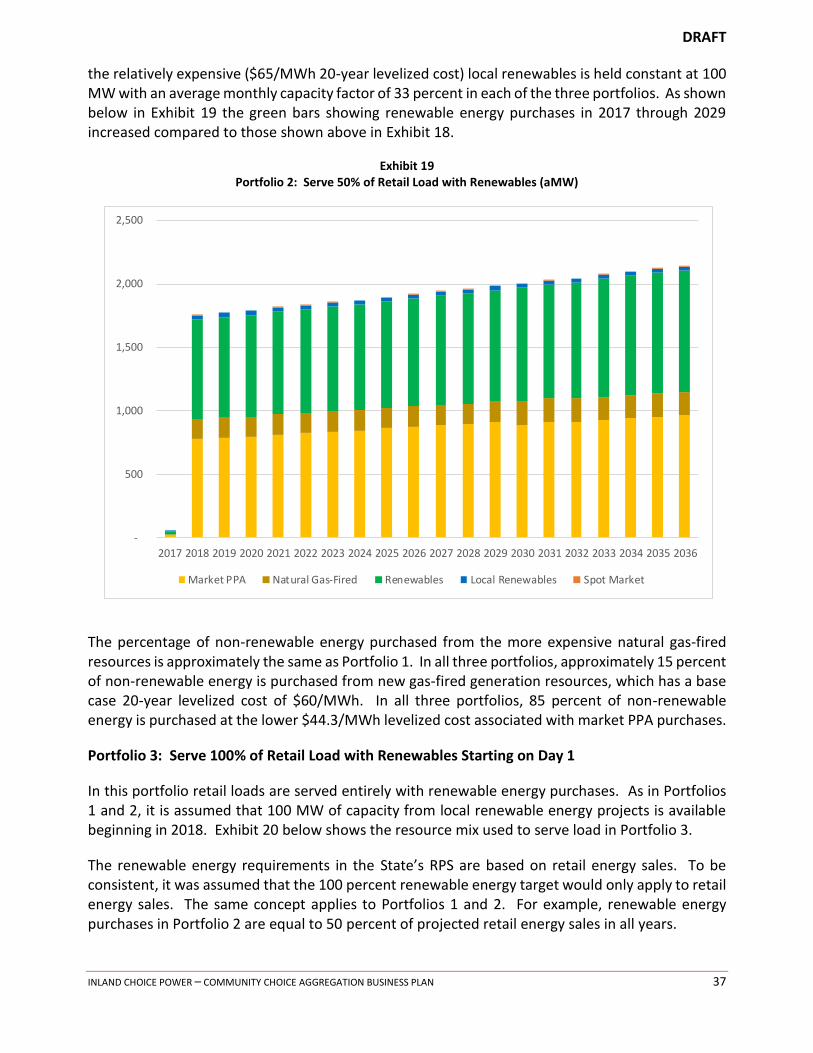
DRAFT
INLAND CHOICE POWER – COMMUNITY CHOICE AGGREGATION BUSINESS PLAN 37
the relatively expensive ($65/MWh 20-year levelized cost) local renewables is held constant at 100 MW with an average monthly capacity factor of 33 percent in each of the three portfolios. As shown below in Exhibit 19 the green bars showing renewable energy purchases in 2017 through 2029 increased compared to those shown above in Exhibit 18.
Exhibit 19 Portfolio 2: Serve 50% of Retail Load with Renewables (aMW)
The percentage of non-renewable energy purchased from the more expensive natural gas-fired resources is approximately the same as Portfolio 1. In all three portfolios, approximately 15 percent of non-renewable energy is purchased from new gas-fired generation resources, which has a base case 20-year levelized cost of $60/MWh. In all three portfolios, 85 percent of non-renewable energy is purchased at the lower $44.3/MWh levelized cost associated with market PPA purchases.
Portfolio 3: Serve 100% of Retail Load with Renewables Starting on Day 1
In this portfolio retail loads are served entirely with renewable energy purchases. As in Portfolios 1 and 2, it is assumed that 100 MW of capacity from local renewable energy projects is available beginning in 2018. Exhibit 20 below shows the resource mix used to serve load in Portfolio 3.
The renewable energy requirements in the State’s RPS are based on retail energy sales. To be consistent, it was assumed that the 100 percent renewable energy target would only apply to retail energy sales. The same concept applies to Portfolios 1 and 2. For example, renewable energy purchases in Portfolio 2 are equal to 50 percent of projected retail energy sales in all years.
-
500
1,000
1,500
2,000
2,500
2017 2018 2019 2020 2021 2022 2023 2024 2025 2026 2027 2028 2029 2030 2031 2032 2033 2034 2035 2036
Market PPA Natural Gas-Fired Renewables Local Renewables Spot Market

DRAFT
INLAND CHOICE POWER – COMMUNITY CHOICE AGGREGATION BUSINESS PLAN 38
Exhibit 20 Portfolio 3: Serve 100% of Retail Load with Renewables (aMW)
There is a significant amount of market PPA and brown resource power included in Portfolio 3 due to the mismatch between seasonal solar generation and seasonal loads. Solar generation is relatively low in winter months and peaks during summer months. Loads are also lower in the winter and higher in the summer. However, beginning in March solar generation ramps up faster than loads. This could put utilities in a position of having to find a market for relatively large amounts of surplus energy during the months of March through June when market prices are typically the lowest. Many utilities and generators will likely be surplus in the spring because of the mismatch between seasonal solar generation and loads in the spring. In addition, utilities and generators located in the Northwest also have surplus energy in the spring due to increased hydroelectric generation (due to melting snow) and wind. Non-renewable resources are included in Portfolio 3 in order to reduce ICP’s exposure to low market prices during periods in which there is an abundance of surplus energy available in the region.
Non-renewable resources are needed in Portfolio 3 to serve load during hours when renewable resources are not capable of generating power (e.g., when the wind is not blowing or the sun is not shining). Purchasing large amounts of renewable generation, as in Portfolio 3, will likely result in over-supply in on-peak hours when solar projects are generating power and under-supply in off-peak hours when solar projects are not generating. As such, during some periods, on-peak energy may need to be exchanged for off-peak energy. The cost of exchanging or firming some of the solar generation into off-peak blocks of energy is reflected in higher ancillary service costs in Portfolio 3.
-
500
1,000
1,500
2,000
2,500
2017 2018 2019 2020 2021 2022 2023 2024 2025 2026 2027 2028 2029 2030 2031 2032 2033 2034 2035 2036
Market PPA Natural Gas-Fired Renewables Local Renewables Spot Market
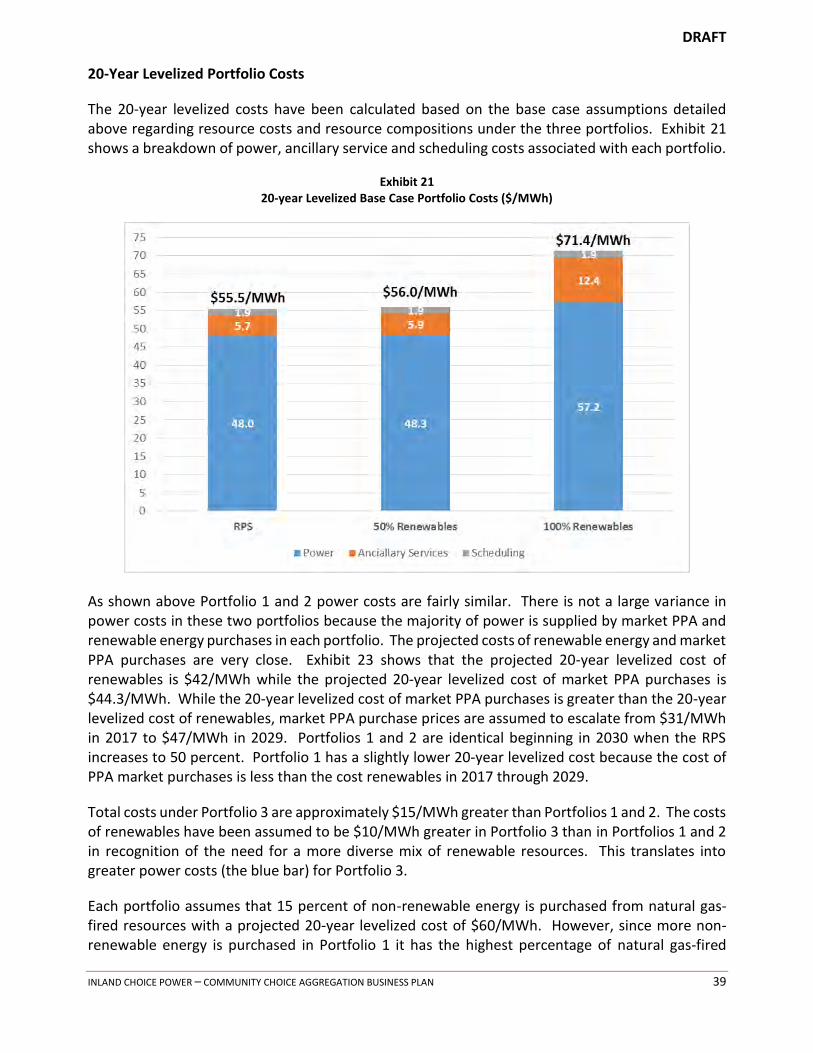
DRAFT
INLAND CHOICE POWER – COMMUNITY CHOICE AGGREGATION BUSINESS PLAN 39
20-Year Levelized Portfolio Costs
The 20-year levelized costs have been calculated based on the base case assumptions detailed above regarding resource costs and resource compositions under the three portfolios. Exhibit 21 shows a breakdown of power, ancillary service and scheduling costs associated with each portfolio.
Exhibit 21 20-year Levelized Base Case Portfolio Costs ($/MWh)
As shown above Portfolio 1 and 2 power costs are fairly similar. There is not a large variance in power costs in these two portfolios because the majority of power is supplied by market PPA and renewable energy purchases in each portfolio. The projected costs of renewable energy and market PPA purchases are very close. Exhibit 23 shows that the projected 20-year levelized cost of renewables is $42/MWh while the projected 20-year levelized cost of market PPA purchases is $44.3/MWh. While the 20-year levelized cost of market PPA purchases is greater than the 20-year levelized cost of renewables, market PPA purchase prices are assumed to escalate from $31/MWh in 2017 to $47/MWh in 2029. Portfolios 1 and 2 are identical beginning in 2030 when the RPS increases to 50 percent. Portfolio 1 has a slightly lower 20-year levelized cost because the cost of PPA market purchases is less than the cost renewables in 2017 through 2029.
Total costs under Portfolio 3 are approximately $15/MWh greater than Portfolios 1 and 2. The costs of renewables have been assumed to be $10/MWh greater in Portfolio 3 than in Portfolios 1 and 2 in recognition of the need for a more diverse mix of renewable resources. This translates into greater power costs (the blue bar) for Portfolio 3.
Each portfolio assumes that 15 percent of non-renewable energy is purchased from natural gas-fired resources with a projected 20-year levelized cost of $60/MWh. However, since more non-renewable energy is purchased in Portfolio 1 it has the highest percentage of natural gas-fired

DRAFT
INLAND CHOICE POWER – COMMUNITY CHOICE AGGREGATION BUSINESS PLAN 40
resource purchases. In Portfolio 1, 10 percent of power purchases are natural gas-fired resource purchases, compared to 9 percent in Portfolio 2 and 5 percent in Portfolio 3.

DRAFT
INLAND CHOICE POWER – COMMUNITY CHOICE AGGREGATION BUSINESS PLAN 41
ICP Cost of Service
This section of the Plan describes the financial pro forma analysis and cost of service for ICP. It includes estimates of start-up costs, staffing and administrative costs, consultant costs, power supply costs, and SCE charges. In addition, it provides an estimate of start-up working capital and longer-term financial needs. The analysis and assumptions are first described for the ICP scenario. The financial impacts of three separate COGs are next described. The cost of a turnkey operation is detailed at the end of this section.
Cost of Service for ICP Base Case Operations
The first category of the pro forma analysis is the cost of service for ICP operations. To estimate the overall costs associated with ICP operations, the following components have been included:
Power Supply Costs
Non-Power Supply Costs
• Start-up costs
• ICP staffing and administration costs
• Consulting Support
• SCE and regulatory charges
• Reserves
• New Program Fund
• Financing costs
Pass-Through Charges from SCE
• Transmission and distribution charges
• Power Cost Indifference Adjustment (PCIA) Charge
• Franchise Fee
• Other non-bypassable charges
Once the costs of ICP operations have been determined, the total costs can be compared to SCE’s projected rates.
Power Supply Costs
A key element of the cost of service analysis is the assumption that electricity will be procured under a power purchase arrangement (PPA) for both renewable and non-renewable power until local ICP resources can be developed. Power supply must be obtained by ICP’s procurement contractor prior to commencing operations. The products required from the third party procurement are energy, capacity, renewable energy, load forecasting and scheduling coordination.
The calculated starting cost of electric power supply, including the cost of the scheduling coordinator and all regulatory power requirements, is between $45 and $65 per MWh. This price

DRAFT
INLAND CHOICE POWER – COMMUNITY CHOICE AGGREGATION BUSINESS PLAN 42
represents the price needed for a full requirements, load following electricity contract. The variation in price is a function of the desired level of renewable resources.
Non-Power Supply Costs
While power supply costs make up the majority of costs associated with operating ICP (roughly 80 percent), there are several additional cost components that must be considered in the pro forma financial analysis. These additional non-power supply costs are noted below.
Start-Up Activities and Costs
Monthly costs associated with ICP start-up and phasing of customer enrollments include expenditures for program staff/contract staff, associated infrastructure, contractor costs and fees payable to SCE by ICP. The estimated startup costs include capital expenditures and one-time expenses as well as ongoing expenses that will be accrued before significant revenues from ICP operations are realized. These cost components are quantified in Exhibit 22 and Exhibit 23 below.
Exhibit 22 Monthly Start-Up Cost Summary (ICP)
Pre-Start
January February March April May June
Start-Up Costs
Infrastructure $0 $0 $0 $0 $55,000 $35,000
Consultants $70,000 $100,000 $100,000 $100,000 $125,000 $125,000
Staffing $0 $0 $0 $0 $38,333 $51,677
Utility Trans. Fee $0 $0 $780 $0 118,636 130,749
Total Start-Up $70,000 $100,000 $100,780 $100,000 $336,969 $342,416
Exhibit 23 Start-Up Costs Summarized by Phase (ICP)
Phase 1 Phase 2
Total Pre-Start Costs 2017 2018
Start-Up Costs
Infrastructure $90,000 $260,000 $350,000
Consultants (incl. Data Manager) $620,000 $1,471,529 $15,724,632
Staffing $90,000 $970,000 $2,488,333
Utility Trans. Fee $250,165 $3,574,050 $8,197,628
Total Start-Up $1,050,165 $6,275,579 $26,760,549
Other costs related to starting up ICP’s program will be the responsibility of ICP’s contractors. These include capital requirements paid by others, customer information system costs, electronic data exchange system costs, call center costs, and billing administration/settlements systems costs. The costs payable by ICP are contained in Exhibit 23.
Estimated Staffing Costs
For start-up, we assume an operating team will be employed prior to the Board’s selection of an Executive Director, per the example of other CCAs in California thus far. This operating team

DRAFT
INLAND CHOICE POWER – COMMUNITY CHOICE AGGREGATION BUSINESS PLAN 43
includes one assistant Executive Director and one manager of policy and regulatory affairs and one administrative assistant. This staff is supported by consultants to manage and operate the CCA. ICP will have two options for ongoing staffing. The first option involves hiring internal staff incrementally to match workloads involved in forming ICP, managing contracts, and initiating customer outreach/marketing during the pre-operations period (Full Staff Scenario). In the alternative approach, the CCA would hire just three staff internally and contract out the remaining work to consultants (Minimum Staff Scenario). Throughout the rest of this Business Plan, we assume that ICP will opt for the Full Staff Scenario, but both options are discussed. Full Staff Scenario
Exhibit 24 provides the estimated staffing budgets for the start-up period through 2018. Staffing budgets include direct salaries and benefits. Exhibit 24 details the anticipated staffing of ICP.
Exhibit 24 Staffing Plan (ICP)
Number of Staff Pre Start-Up 2017 2018
Executive Director 0 1 1
Assistant Executive Director 1 1 1
Policy & Regulatory Manager 1 0 1
Regulatory Analyst 0 1 1
Administrative Assistant 1 1 2
Finance & Rates Manager 0 1 1
Rates Analyst 0 1 1
Accounting & Billing Analyst 0 1 2
Human Resources Manager 0 1 1
HR Specialist 0 1 1
Sales & Marketing Manager 0 1 1
Energy Efficiency Program Manager 0 0 1
Account Representatives 0 2 2
Communication Specialists 0 2 2
IT Manager 0 1 1
IT Specialist 0 0 1
Total Number of Employees 3 15 20
Total Staffing Costs $90,000* $970,000* $2,488,333
*Represents only partial year.
Based on this staffing plan, ICP will initially employ 3 staff members. Once ICP has expanded its service area and operated for one year or so, it is anticipated that staffing will increase to approximately 20 employees. These positions to be hired by ICP over the first two years are described below:
DRAFT
INLAND CHOICE POWER – COMMUNITY CHOICE AGGREGATION BUSINESS PLAN 44
Executive Director
The Executive Director will be responsible for overseeing ICP operation and ensuring that the vision of the JPA Board is followed. The Executive Director will ultimately be responsible for all ICP programs, finances and communication programs plus be accountable to the Board.
Assistant Executive Director
The Assistant Executive Director will oversee the day to day operation of ICP. In particular, this staff position will work closely with outside consultants, and oversee hedging and power procurement, resource portfolio strategy, CAISO settlements and other financial planning and rate setting analysis. Behind the meter ICP programs will also be coordinated through this position.
Policy and Regulatory Manager
The Policy and Regulatory Manager will oversee the legal and regulatory functions of ICP. This position will work closely with the CPUC and State/Federal legislators. ICP will require ongoing regulatory representation to file resource plans, resource adequacy compliance, compliance with California RPS, and overall representation on issues that will impact ICP and its customers. ICP should plan on maintaining an active role at the CPUC, CEC, FERC and the California legislature.
Finance and Rates Manager The Finance and Rates Manager oversees ICP’s budgets and accounting functions. In addition, this person will develop annual budgets, rates and credit policies for approval by the Board. Managing the overall financial aspects of ICP is expected to be a significant work activity.
Sales and Marketing Manager
The Sales and Marketing Manager is responsible for the enrollment and notification of new customers. In addition, this staff person will market ICP, and provide on-going communication with ICP’s communities and customers. A significant amount of customer service and key account representation will be necessary in addition to regular marketing services. This position will be the point person for the outsourced data management and customer service consultants.
Administrative Assistant
The staffing plan assumes a full-time administrative assistant will be added during the pilot phase to provide administrative assistance to management.
Future Staff
As additional customers join ICP, duties can be shifted from third-party consultants to in-house staff if internal staffing is more cost effective.
Minimum Staff Scenario
To build the minimum staff possible to run ICP, all tasks described above would be completed by consultants on a contract basis. We assume these contracts would be managed by the Executive
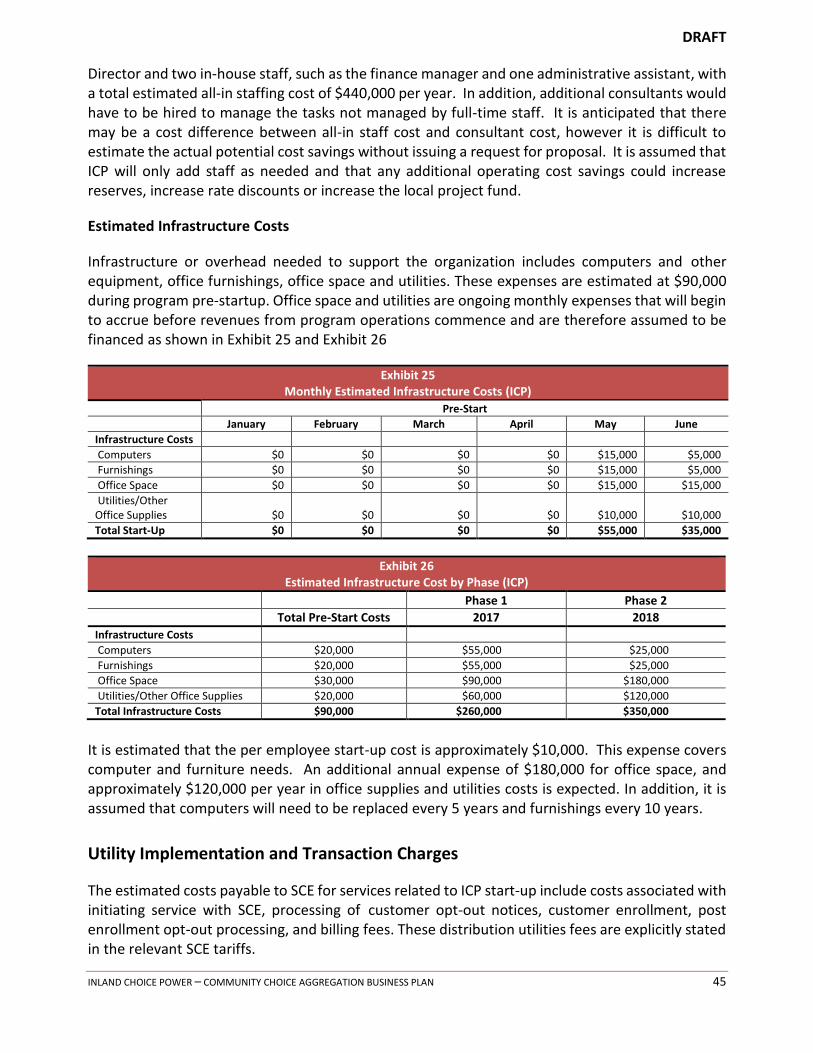
DRAFT
INLAND CHOICE POWER – COMMUNITY CHOICE AGGREGATION BUSINESS PLAN 45
Director and two in-house staff, such as the finance manager and one administrative assistant, with a total estimated all-in staffing cost of $440,000 per year. In addition, additional consultants would have to be hired to manage the tasks not managed by full-time staff. It is anticipated that there may be a cost difference between all-in staff cost and consultant cost, however it is difficult to estimate the actual potential cost savings without issuing a request for proposal. It is assumed that ICP will only add staff as needed and that any additional operating cost savings could increase reserves, increase rate discounts or increase the local project fund.
Estimated Infrastructure Costs
Infrastructure or overhead needed to support the organization includes computers and other equipment, office furnishings, office space and utilities. These expenses are estimated at $90,000 during program pre-startup. Office space and utilities are ongoing monthly expenses that will begin to accrue before revenues from program operations commence and are therefore assumed to be financed as shown in Exhibit 25 and Exhibit 26
Exhibit 25 Monthly Estimated Infrastructure Costs (ICP)
Pre-Start
January February March April May June
Infrastructure Costs
Computers $0 $0 $0 $0 $15,000 $5,000
Furnishings $0 $0 $0 $0 $15,000 $5,000
Office Space $0 $0 $0 $0 $15,000 $15,000
Utilities/Other Office Supplies $0 $0 $0 $0 $10,000 $10,000
Total Start-Up $0 $0 $0 $0 $55,000 $35,000
Exhibit 26 Estimated Infrastructure Cost by Phase (ICP)
Phase 1 Phase 2
Total Pre-Start Costs 2017 2018
Infrastructure Costs
Computers $20,000 $55,000 $25,000
Furnishings $20,000 $55,000 $25,000
Office Space $30,000 $90,000 $180,000
Utilities/Other Office Supplies $20,000 $60,000 $120,000
Total Infrastructure Costs $90,000 $260,000 $350,000
It is estimated that the per employee start-up cost is approximately $10,000. This expense covers computer and furniture needs. An additional annual expense of $180,000 for office space, and approximately $120,000 per year in office supplies and utilities costs is expected. In addition, it is assumed that computers will need to be replaced every 5 years and furnishings every 10 years.
Utility Implementation and Transaction Charges
The estimated costs payable to SCE for services related to ICP start-up include costs associated with initiating service with SCE, processing of customer opt-out notices, customer enrollment, post enrollment opt-out processing, and billing fees. These distribution utilities fees are explicitly stated in the relevant SCE tariffs.

DRAFT
INLAND CHOICE POWER – COMMUNITY CHOICE AGGREGATION BUSINESS PLAN 46
Customers who establish service with ICP will be automatically enrolled in the program and have sixty days from the date of enrollment to customer opt-out of the program. Such customers will be provided with two opt-out notices within this sixty-day post enrollment period. The first notice will be mailed to customers approximately sixty days prior to the date of automatic enrollment. A second notice will be sent approximately thirty days later. Following automatic enrollment, two additional opt-out notices will be provided within the sixty-day period following customer enrollment. It is estimated that the enrollment charges will be approximately $3.4 million for 2017 and $3.5 million for 2018, as shown in Exhibit 27 and Exhibit 28. Enrollment charges are almost as high in 2017 because Phase 2 enrollment starts prior to Phase 2 implementation.
Exhibit 27 Monthly Utility Transaction Fees (ICP)
Pre-Start
January February March April May June
Enrollment Charges 0 0 780 0 $118,636 $130,749
Ongoing Charges 0 0 0 0 0 0
Total SCE Transaction Fee $0 $0 $780 $0 $118,636 $130,749
Exhibit 28 Utility Transaction Fees by Phase (ICP)
Phase 1 Phase 2
Total Pre-Start Costs 2017 2018
Enrollment Charges $250,165 $3,402,449 $3,469,521
Ongoing Charges 0 171,601 $4,728,107
Total SCE Transaction Fees $250,165 $3,574,050 $8,197,628
Estimates of Third Party Contractor Costs
Contractor costs include outside assistance for advertising, legal services, resource and financial planning, implementation support, customer enrollment, customer service, and payment processing/accounts receivable and verification. The latter three will be provided by ICP’s customer account services provider, and these preliminary estimates will be refined as the services and costs provided by the selected contractor are negotiated. Exhibit 29 and Exhibit 30 show the estimated contractor costs during the startup period assuming full staff scenario is implemented.
Exhibit 29 Monthly Estimated Consultant Costs (ICP)
Pre-Start
January February March April May June
Legal/Regulatory $20,000 $50,000 $50,000 $50,000 $50,000 $50,000
Communication $0 $0 $0 $0 $25,000 $25,000
Data Management $0 $0 $0 $0 $0 $0
Financial Consulting $50,000 $50,000 $50,000 $50,000 $50,000 $50,000
Total Consultant Costs $70,000 $100,000 $100,000 $100,000 $125,000 $125,000

DRAFT
INLAND CHOICE POWER – COMMUNITY CHOICE AGGREGATION BUSINESS PLAN 47
Exhibit 30 Estimated Consultant Costs by Phase (ICP)
Phase 1 Phase 2
Total Pre-Start Costs 2017 2018
Legal/Regulatory $270,000 $300,000 $480,000
Communication $50,000 $150,000 $300,000
Data Management $0 $731,529 $14,414,632
Financial Consulting $300,000 $290,000 $530,000
Total Consultant Costs $620,000 $1,471,529 $15,724,632
The estimate for each of the services is based on costs experienced by other CCAs. Consultant costs are increased by inflation every year.
Estimated Reserves
ICP is assumed to receive capital financing during its startup phase. After a successful launch, ICP should strongly consider building up a reserve fund that is available to address contingencies, cost uncertainties, rate stabilization or other risks faced by ICP. This Plan assumes that ICP will begin building its reserves starting from its launch. It is assumed that the first year’s reserve funds can be used to pay off loans. After four years, the assumed savings rate will have accumulated enough reserves for 3 months of expenses. This level of reserves will provide financial stability and assist ICP in obtaining favorable rates if additional financing is needed. After that point, additional savings can begin to fund lower rates, more programs and/or economic development projects (see Programs Section).
Estimated New Programs Fund
Once the reserve fund has reached its target, the revenue requirement includes budget for new customer programs including Distributed Generation support, additional energy efficiency program offering, further rate discounts, etc. These programs have not been identified at this time as the Board will make the decision of priorities for funding.
Cash Flow Analysis and Working Capital
This cash flow analysis estimates the level of working capital that will be required until full operation of ICP is achieved. For the purposes of this Plan, it is assumed that ICP pre-operations begin in January 2017 and continue through June 2017. In general, the components of the cash flow analysis can be summarized into two distinct categories: (1) Cost of ICP operations, and (2) Revenues from ICP operations. The cash flow analysis identifies and provides monthly estimates for each of these two categories. A key aspect of the cash flow analysis is to focus primarily on the monthly costs and revenues associated with ICP and specifically account for the transition or “Phase-In” of ICP customers. The cash flow analysis assumes the phase-In schedule for ICP as described previously. The cash flow analysis also provides estimates for revenues generated from ICP operations or from electricity sales to customers. In determining the level of revenues, the cash flow analysis assumes the customer phase-in schedule noted above, and assumes that ICP provides a discount of 3.7

DRAFT
INLAND CHOICE POWER – COMMUNITY CHOICE AGGREGATION BUSINESS PLAN 48
percent from the existing rates for each customer class, where pre-operations run from January 1, 2017 to June 31, 2017. Thereafter, Phase 1 starts in July 2017.
The results of the cash flow analysis provide an estimate of the level of working capital required for ICP to move through the pre-operations period. This estimated level of working capital is determined by examining the monthly cumulative net cash flows (revenues minus cost of operations) based on assumptions for payment of costs by ICP, along with an assumption for when customer payments will be received. The cash flow analysis assumes that customers will make payments within 60 days of the service month, and that ICP will make payments to suppliers within 30 days of the service month. This analysis is somewhat conservative because customer payments begin to come in soon after the bill is issued, and most are received before the due date. At the same time, some customer payments are received well after the due date. The 30-day net lag is a conservative assumption for cash flow purposes. For purposes of determining working capital requirements related to power purchases, ICP will be responsible for providing the working capital needed to support electricity procurement unless the electricity provider can provide the working capital as part of the contract services. In addition, ICP will be obligated to meet working capital requirements related to program management. For this Plan, it is assumed that this working capital requirement is included in the short term financing associated with start-up funding. Several operating CCAs have been successful in negotiating lines of credit, lockbox arrangements and delayed payment arrangements which reduce the cost of working capital. Any of these arrangements will reduce the cost of working capital and increase the potential savings to customers.
A summary of working capital needs is presented below on Exhibit 31.
Exhibit 31 Working Capital Needs (ICP)
2017 2018
Working Capital (ICP) $12 Million $150 Million
Total Financing Requirements
The start-up of the ICP program will require a significant amount of capital for three major functions: (1) staffing and contractor costs; (2) program initiation; and (3) working capital. Each of these anticipated requirements is discussed below.
Staffing costs for the pre-implementation period (January 2017 through June 2017) are estimated to be approximately $90,000. Contractor costs for the same time period are estimated to be approximately $620,000. These costs include: advertising/communications, consulting, legal, and data management.
ICP initiation costs include the infrastructure that ICP will require (office space, utilities, computers) as well as the distribution utility fees for initiating ICP. Infrastructure costs are estimated to be approximately $90,000 and the distribution utility fees are estimated to be approximately $250,165.

DRAFT
INLAND CHOICE POWER – COMMUNITY CHOICE AGGREGATION BUSINESS PLAN 49
The Public Utilities Code requires demonstration of insurance or posting of a bond sufficient to cover reentry fees imposed on customers that are involuntarily returned to SCE service under certain circumstances. In addition, SCE requires a bond equivalent to two months of transaction fees. For the ICP scenario, the total financing requirement, including working capital, during the start-up and pilot periods, are estimated to be approximately $20 million, increasing to approximately $175 million following full enrollment. The first $20 million is needed in Spring 2017.
Financing Plan
The initial start-up funding will be provided via short-term financing. ICP will recover the principal and interest costs associated with the start-up funding via subsequent retail rates. It is anticipated that the start-up costs will be fully recovered within the first five years of ICP operations.
Additional financing will be needed at the beginning of Phase 2. Depending on market conditions and payment terms established with the third-party suppliers, the loan may need to be increased to approximately $175 million for the start of Phase 2. This number will be refined as the ICP program becomes operational, and bids are received from power providers.
Based on recent information regarding financing options for CCA’s, the Plan’s financial analysis assumes that ICP can obtain a loan for the first $20 million with a term of 5 years at a rate of 5.5 percent. The second loan for $175 million is assumed for a 20-year term at 5.5 percent.
The detail of the base case financial analysis is provided in Appendix B.
Cost of Service for Three CCA Operations
There are several options for how to setup and organize a CCA. In addition to forming one CCA as outlined as the base case in the Plan, three CCAs (one for each COG) is an option. This option would entail each of the three COGs providing a full service CCA including power procurement, data management and local program development/outreach.
In order to develop this three CCA scenario, each major cost component has been reviewed to determine the appropriate cost structure for each individual CCA based on the size of load. Power procurement, SCE charges and data management costs follow load and number of customers in each CCA. However, the internal costs (staffing, office space, consulting) are about the same for a 100,000-meter utility, and a 1,000,000-meter utility. The results are shown for the 50% Renewable portfolio, but Appendix B provide the results for all three power supply scenarios for each of the three COGs separately.

DRAFT
INLAND CHOICE POWER – COMMUNITY CHOICE AGGREGATION BUSINESS PLAN 50
“Three Separate CCA” Assumptions
It is anticipated that if the three COG’s operate separately, staffing would be fairly similar to the ICP scenario for each of the CCA’s. Exhibit 32 provides the estimated staffing and annual cost under the separate CCA scenario.
Exhibit 32 Staffing Plan (Three CCAs)
Number of Staff CVAG SANBAG WRCOG
Executive Director 1 1 1
Assistant Executive Director 1 1 1
Policy & Regulatory Manager 1 1 1
Regulatory Analyst 0 1 1
Administrative Assistant 2 2 2
Finance & Rates Manager 1 1 1
Rates Analyst 0 1 1
Accounting & Billing Analyst 2 2 2
Human Resources Manager 0 1 1
HR Specialist 0 1 0
Sales & Marketing Manager 0 1 0
Energy Efficiency Program Manager 1 1 1
Account Representatives 0 2 2
Communication Specialists 0 2 0
IT Manager 0 1 1
IT Specialist 0 1 1
Total Number of Employees 9 20 16
Total Staffing Costs $1,190,000 $2,488,333 $1,704,167
The estimated start-up costs for each of the COGs and the combined “Three CCA” scenario are shown in Exhibit 33.
For the separate scenarios, computers, furnishings and supplies were forecast based on employees in each CCA. In the WRCOG scenario, staff is added slower than in the SANBAG scenario, thus delaying some staffing and infrastructure costs from 2017 to 2018.
Exhibit 33 Estimated Infrastructure Cost by Phase (Three CCAs)
Phase 1 Phase 2
Total Pre-Start Costs 2017 2018
Infrastructure Costs
CVAG $90,000 $150,000 $350,000
SANBAG $90,000 $260,000 $350,000
WRCOG $90,000 $150,000 $420,000
Total Infrastructure Costs $270,000 $560,000 $1,120,000
The estimated costs payable to SCE for services related to ICP start-up include costs associated with initiating service with SCE, processing of customer opt-out notices, customer enrollment, post enrollment opt-out processing, and billing fees. These distribution utilities fees are explicitly stated

DRAFT
INLAND CHOICE POWER – COMMUNITY CHOICE AGGREGATION BUSINESS PLAN 51
in the relevant SCE tariffs. The utility transaction fees for each of the COGs separately, are shown in Exhibit 34.
Exhibit 34 Utility Transaction Fees by Phase (Three CCAs)
Phase 1 Phase 2
Total Pre-Start Costs 2017 2018
CVAG $39,557 $413,653 $918,803
SANBAG $149,501 $1,939,421 $4,405,258
WRCOG $68,749 $1,228,726 $2,873,783
Total SCE Transaction Fees $257,807 $3,581,800 $8,197,844
Exhibit 35 shows the estimated contractor costs during the startup period for the “Three CCA” scenario. These are costs assumed for financial and accounting assistance, legal assistance, data management and communication.
Exhibit 35 Estimated Consultant Costs by Phase (Three CCAs)
Phase 1 Phase 2
Total Pre-Start Costs 2017 2018
CVAG $620,000 $606,215 $2,398,639
SANBAG $620,000 $1,172,679 $9,074,423
WRCOG $620,000 $932,634 $6,331,569
Total Consultant Costs $1,860,000 $2,711,528 $17,804,631
Estimated non-power supply costs associated with ICP start-up and phasing of customer enrollments for the “Three CCA” scenarios are provided in Exhibit 36.
Exhibit 36 Start-Up Costs for Three CCAs Summarized by Phase
CVAG CVAG SANBAG SANBAG WRCOG WRCOG
2017 2018 2017 2018 2017 2018
Start-Up Costs
Infrastructure $240,000 $350,000 $350,000 $350,000 $240,000 $420,000
Consultants $1,226,215 $2,398,639 $1,792,679 $9,074,423 $1,552,634 $6,331,569
Staffing $400,000 $1,190,000 $1,060,000 $2,488,333 $400,000 $1,704,167
Utility Trans. Fee $453,211 $918,803 $2,088,921 $4,405,258 $1,297,475 $2,873,783
Total Start-Up $2,319,426 $4,857,442 $5,291,600 $16,318,014 $3,490,109 $11,329,519
Each CCA will be responsible for providing the working capital needed to support electricity procurement unless the electricity provider can provide the working capital as part of the contract services. In addition, each CCA will be obligated to meet working capital requirements related to program management. It is assumed that this working capital requirement is included in the short term financing associated with start-up funding. A summary of working capital needs for the three CCAs is presented below on Exhibit 37.
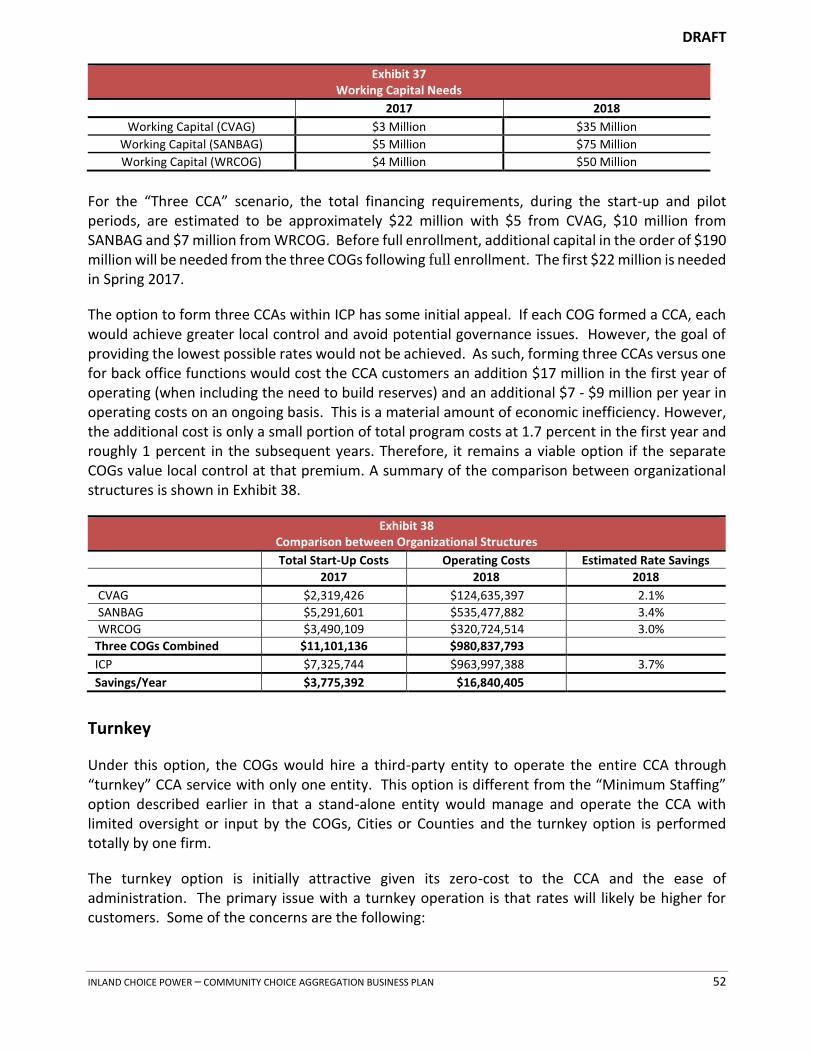
DRAFT
INLAND CHOICE POWER – COMMUNITY CHOICE AGGREGATION BUSINESS PLAN 52
Exhibit 37 Working Capital Needs
2017 2018
Working Capital (CVAG) $3 Million $35 Million
Working Capital (SANBAG) $5 Million $75 Million
Working Capital (WRCOG) $4 Million $50 Million
For the “Three CCA” scenario, the total financing requirements, during the start-up and pilot periods, are estimated to be approximately $22 million with $5 from CVAG, $10 million from SANBAG and $7 million from WRCOG. Before full enrollment, additional capital in the order of $190 million will be needed from the three COGs following full enrollment. The first $22 million is needed in Spring 2017.
The option to form three CCAs within ICP has some initial appeal. If each COG formed a CCA, each would achieve greater local control and avoid potential governance issues. However, the goal of providing the lowest possible rates would not be achieved. As such, forming three CCAs versus one for back office functions would cost the CCA customers an addition $17 million in the first year of operating (when including the need to build reserves) and an additional $7 - $9 million per year in operating costs on an ongoing basis. This is a material amount of economic inefficiency. However, the additional cost is only a small portion of total program costs at 1.7 percent in the first year and roughly 1 percent in the subsequent years. Therefore, it remains a viable option if the separate COGs value local control at that premium. A summary of the comparison between organizational structures is shown in Exhibit 38.
Exhibit 38 Comparison between Organizational Structures
Total Start-Up Costs Operating Costs Estimated Rate Savings
2017 2018 2018
CVAG $2,319,426 $124,635,397 2.1%
SANBAG $5,291,601 $535,477,882 3.4%
WRCOG $3,490,109 $320,724,514 3.0%
Three COGs Combined $11,101,136 $980,837,793
ICP $7,325,744 $963,997,388 3.7%
Savings/Year $3,775,392 $16,840,405
Turnkey
Under this option, the COGs would hire a third-party entity to operate the entire CCA through “turnkey” CCA service with only one entity. This option is different from the “Minimum Staffing” option described earlier in that a stand-alone entity would manage and operate the CCA with limited oversight or input by the COGs, Cities or Counties and the turnkey option is performed totally by one firm.
The turnkey option is initially attractive given its zero-cost to the CCA and the ease of administration. The primary issue with a turnkey operation is that rates will likely be higher for customers. Some of the concerns are the following:

DRAFT
INLAND CHOICE POWER – COMMUNITY CHOICE AGGREGATION BUSINESS PLAN 53
The turnkey model has not been tested in California. Power purchase is highly capital-intensive, so the cost of capital becomes a major driver of CCA-
operating costs. Private third-parties incur roughly twice the cost of capital as would a city, county, or JPA-owned CCA. Therefore, the publicly-operated CCA will almost certainly be able to offer lower rates.
CCAs are required to sign long-term contracts for a portion of their power supply, while turnkey operations in other states tend to rely on short-term contracts.
The cost charged to customers include profit to the third-party firm. Finally, because there are risks associated with operating a CCA, the third-party will make sure
to overestimate costs to mitigate potential risks, or in worst case cease operations if profit targets are not met.
Priority of local community goals is not clear.
In addition, giving CCA operation to a third-party often compromises the CCA’s control over its power supply and other programs. The third-party operator typically guarantees the CCA owner an income stream but in exchange is given liberty to dictate the power supply options, energy efficiency programs, rates, staffing levels, and programs available to the CCA customers.

DRAFT
INLAND CHOICE POWER – COMMUNITY CHOICE AGGREGATION BUSINESS PLAN 54
Products, Services, Rates Comparison and Environmental/Economic Impacts
This section of the Plan provides a comparison of service and rates between SCE and ICP. Rates are evaluated based on total ICP electric total bundled rates as compared to SCE’s total bundled rates. Total bundled electric rates include the rates charged by ICP, including non-bypassable charges, plus SCE’s delivery charges. This section also includes the environmental impacts based on the reduction in Green House Gases (GHG), and the economic development impact on local jobs and overall economic activity created by ICP programs.
Rates Paid by SCE Bundled Customers
The average customer weighted SCE rates have been calculated based on current rate schedules and ICP’s projected customer mix. SCE’s current 2016 rates and surcharges have been applied to customer load data aggregated by major rate schedules to form the basis for the SCE rate forecast.
The average SCE delivery rate, which is paid by both SCE bundled customers and ICP customers, has been calculated based on the forecasted customer mix for ICP. For future years, the SCE rate forecast assumes the delivery costs will increase by 2 percent per year, a conservative assumption given the history of SCE rate increases.
Similarly, the current average power supply rate component for SCE bundled customers has been calculated based on the estimated ICP customer mix. The SCE power supply rate component has been forecast to increase based on SCE’s most recent filings and incorporating the increased RPS requirement mandated by SB 350. The most recent Energy Resource Recovery Account (ERRA) filing has been used to determine the 2017 SCE generation rates for each rate category. Finally, the SCE power supply rates have been projected to increase based on the renewable and non-renewable market price forecast, regulatory requirement for RPS, storage requirement and resource adequacy objectives.
Rates Paid by ICP Customers
It is anticipated that ICP’s rate designs will initially mirror the structure of SCE’s rates with the appropriate discounts so that similar rates can be provided to ICP's customers. In determining the level of ICP rates, the financial analysis assumes the customer phase-in schedule noted above and that the implementation phase costs are financed via a start-up loan.
In addition to paying ICP’s power supply rate, ICP customers will pay the SCE delivery rate and non-bypassable charges. The calculation of the delivery rate is described earlier. The non-bypassable charges that are payable to SCE by ICP customers include:

DRAFT
INLAND CHOICE POWER – COMMUNITY CHOICE AGGREGATION BUSINESS PLAN 55
Power Cost Indifference Adjustment (PCIA)
Department of Water Resources Bond Charge (DWRBC)
Competition Transition Charge (CTC)
Generation Municipal Surcharge (or Franchise Charge)
The DWRBC is the charge to recover the interest and principal of the California Department of Water and Resources (DWR) bonds. This charge is projected to remain at the current level and is scheduled to end in 2023. The CTC is the ongoing charge, which recovers the above market costs of utility generation. This charge is minimal at the moment and is not expected to be a significant cost to ICP customers.
Power Cost Indifference Adjustment (PCIA)
The PCIA is a charge that is designed to keep bundled customers “indifferent” when other customers leave bundled service. The PCIA is calculated annually by subtracting the market price of wholesale power from the incumbent utility’s average cost of power supply based on a methodology determined by the CPUC.8
Exhibit 39 provides the historic values of the PCIA, CTC and DWRBC for the residential class. It is important to note that the non-by passable charges differ by the vintage of a CCA. The vintage of the CCA depends on when the CCA provides a binding notice of intent to SCE.
Exhibit 39 SCE Historic Domestic Non-Bypassable Charges
Note that CARE and medical base line customers do not pay the DWRBC or PCIA charges.
8 See D.-6-07-030 as modified by D. 11-12-018.
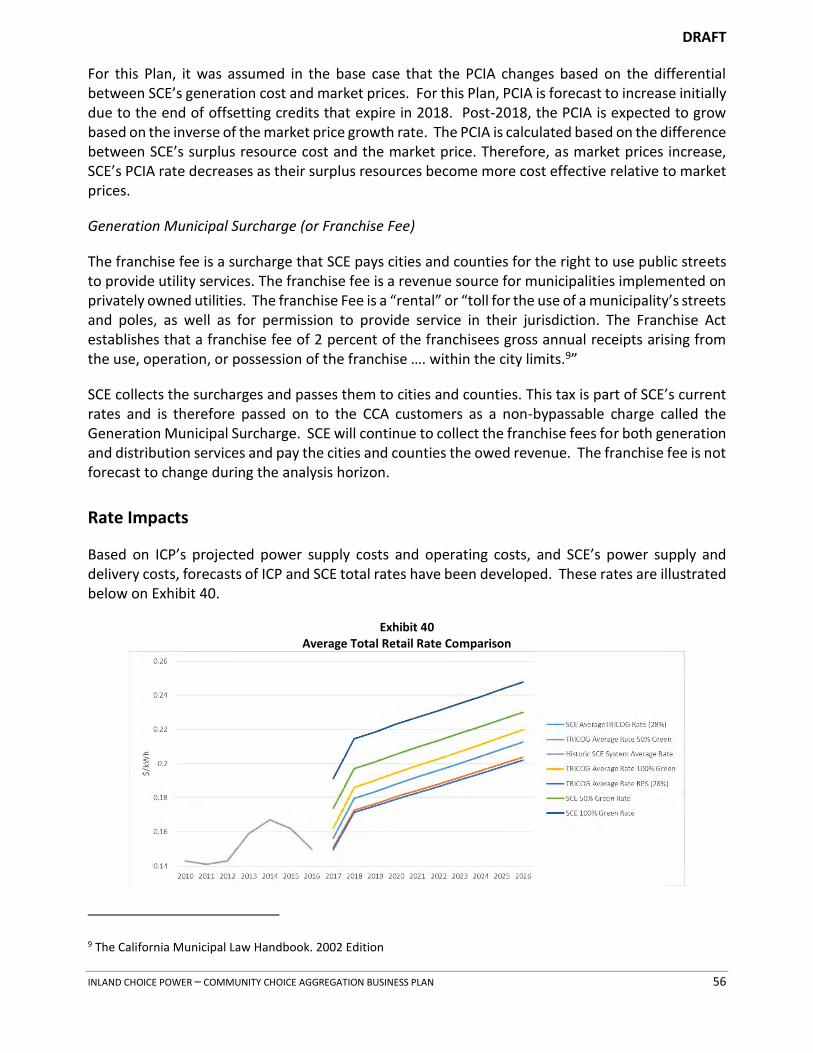
DRAFT
INLAND CHOICE POWER – COMMUNITY CHOICE AGGREGATION BUSINESS PLAN 56
For this Plan, it was assumed in the base case that the PCIA changes based on the differential between SCE’s generation cost and market prices. For this Plan, PCIA is forecast to increase initially due to the end of offsetting credits that expire in 2018. Post-2018, the PCIA is expected to grow based on the inverse of the market price growth rate. The PCIA is calculated based on the difference between SCE’s surplus resource cost and the market price. Therefore, as market prices increase, SCE’s PCIA rate decreases as their surplus resources become more cost effective relative to market prices.
Generation Municipal Surcharge (or Franchise Fee)
The franchise fee is a surcharge that SCE pays cities and counties for the right to use public streets to provide utility services. The franchise fee is a revenue source for municipalities implemented on privately owned utilities. The franchise Fee is a “rental” or “toll for the use of a municipality’s streets and poles, as well as for permission to provide service in their jurisdiction. The Franchise Act establishes that a franchise fee of 2 percent of the franchisees gross annual receipts arising from the use, operation, or possession of the franchise …. within the city limits.9”
SCE collects the surcharges and passes them to cities and counties. This tax is part of SCE’s current rates and is therefore passed on to the CCA customers as a non-bypassable charge called the Generation Municipal Surcharge. SCE will continue to collect the franchise fees for both generation and distribution services and pay the cities and counties the owed revenue. The franchise fee is not forecast to change during the analysis horizon.
Rate Impacts
Based on ICP’s projected power supply costs and operating costs, and SCE’s power supply and delivery costs, forecasts of ICP and SCE total rates have been developed. These rates are illustrated below on Exhibit 40.
Exhibit 40 Average Total Retail Rate Comparison
9 The California Municipal Law Handbook. 2002 Edition

DRAFT
INLAND CHOICE POWER – COMMUNITY CHOICE AGGREGATION BUSINESS PLAN 57
For this Plan, it has been assumed that the projected rate decrease is applied uniformly across all rate classes. Once established, it will be up to the ICP Board and staff to develop rates for each rate class that reflects cost of service. Based on these assumed ICP discounts off the comparable SCE rate, Exhibit 41 provides a comparison of the indicative bundled rates for ICP’s products with the current SCE rate.
Exhibit 41 Indicative Rate Comparison in ¢/kWh
(First Full Year of Operation)
Rate Class Customer
Type
2017 Estimated
SCE Bundled
Rate*
ICP RPS Bundled
Rate
SCE 50% Green
Bundled Rate
ICP 50% Green
Bundled Rate
SCE 100% Green
Bundled Rate
ICP 100% Green
Bundled Rate
Residential Domestic 20.55 19.58 22.30 19.81 24.05 21.79
Residential Care Domestic 12.22 11.64 13.97 11.78 15.72 12.96
GS-1 Commercial 17.03 16.23 18.78 16.41 20.53 18.06
GS-2 Commercial 16.57 15.79 18.32 15.97 20.07 17.57
GS-3 Industrial 14.71 14.02 16.46 14.18 18.21 15.60
PA-2 Public
Authority 13.08 12.46 14.83 12.61 16.58 13.87
PA-3 Public
Authority 11.31 10.78 13.06 10.90 14.81 11.99
TOU-8 Secondary Domestic 13.07 12.45 14.82 12.60 16.57 13.86
TOU-8 Primary Commercial 11.84 11.28 13.59 11.41 15.34 12.55
TOU-8 Substation Industrial 7.76 7.39 9.51 7.48 11.26 8.23
Total ICP Rate Savings over SCE’s Standard Bundled Rate
4.9% 11.2% 9.4%
*SCE bundled average rate based on SCE’s ERRA 2017 Draft Filing The ICP RPS residential rate with an equal amount of renewable power (28 percent) to what SCE currently offers is 0.9/kWh or approximately 4.7 percent lower as can be seen in Exhibit 41. The ICP residential rate with 50 percent renewable power (compared to SCE’s 50 percent) is 2.5¢/kWh or 11.2 percent lower. The ICP residential rate with 100 percent green power (compared to SCE’s 100 percent) is 2.7¢/kWh or 9.4 percent lower. The rates calculated under this Plan are for comparison to SCE rates only. Under formal operations, the ICP policymakers will determine the actual rates to be offered to its customers.
Exhibit 42 shows the initial rate savings associated with the formation of a CCA. By referencing Appendix B, these initial savings increase after ICP becomes fully functional. The savings by rate schedule after ICP is fully functional are presented below in Exhibit 42.
Exhibit 42 CCA Rate Savings at Fully Functional Operations
Power Supply Scenario Range of Savings*
ICP RPS 4.5% - 5.7%
ICP 50% Renewable 3.1% - 4.5%
ICP 100% Renewable (5.7%) – (5.0%)
*Note Appendix B for detail.

DRAFT
INLAND CHOICE POWER – COMMUNITY CHOICE AGGREGATION BUSINESS PLAN 58
A financial proforma in support of these rates can be referenced in Appendix B.
It should be noted that the rate savings noted in ES-2 still allow the accumulation of significant reserves for the CCA. As illustrated in Appendix B, the proforma include a line item called “Contribution to Annual Reserves” that go towards funding the needed cash working capital (approximately $250M). After the target reserves have been met, additional reserves can be used to further lower CCA retail rates, invest in local renewable projects, provide additional energy efficiency programs, or any other CCA-related activity as directed by the CCA’s Board. The projected funds available for this purpose are provided in the line item titled “New Programs” in the proforma. It is widely held that Proposition 26 prohibits the use of these reserves for any non-CCA related activity. The accumulate reserves and new program accruals present the new CCA with a large amount of funding and numerous opportunities going forward.
Exhibit 43 below highlights how much financial reserves are generated among the rate reductions noted above.
Exhibit 43 Accumulative Fund Balances for Financial Reserves and New Programs Under the 50% Renewable
Year
Accumulative Financial Reserve Funds
($ x 1000)
Accumulative New Project Funds
($ x 1000)
Total Financial Reserves
($ x 1,000)
2018 $63,330 $0 $63,330
2019 $130,225 $0 $130,225
2020 $213,504 $0 $213,504
2021 $259,527 $46,022 $305,549
2022 $259,527 $147,956 $407,483
2023 $259,527 $262,232 $521,759
2024 $259,527 $384,563 $644,090
2025 $259,527 $515,637 $775,164
2026 $259,527 $653,238 $912,765
2027 $259,527 $796,925 $1,056,452
2028 $259,527 $946,175 $1,205,702
2029 $259,527 $1,101,642 $1,361,169
2030 $259,527 $1,254,153 $1,513,680
These new project and financial reserve fund balances can be used for CCA-related activities as directed by the Board. These fund balances can also be used for rate reductions larger than calculated in the Plan’s base case.
Local Resources/Behind the Meter ICP Programs
ICP may wish to plan to establish a Net Energy Metering (“NEM”) program for qualified customers in their service territory to encourage DER. In addition, ICP should work with State agencies and SCE to promote deployment of distributed energy resources (DER) within ICP's service territory, with the goal of maximizing use of the available incentives that are funded through current utility distribution rates and public goods surcharges.

DRAFT
INLAND CHOICE POWER – COMMUNITY CHOICE AGGREGATION BUSINESS PLAN 59
ICP should also consider establishing a program which offers a combination of retail tariffs, rebates, incentives and other bundled offerings intended to increase customer participation in demand-side programs including: renewable distributed energy resources, energy storage, energy efficiency, demand response, electric vehicle charging, and other clean energy benefits defined as Distributed Energy Resources (DER). ICP can work with State agencies and SCE to promote deployment of DERs in specific and targeted locations throughout SCE’s distribution grid in order to help support efficient grid operations and maintenance as part of development of the future “smart grid”.
Impact of Resource Plan on Greenhouse Gas (GHG) Emissions
The amount of renewable power in SCE’s power supply portfolio is 28 percent10 and will rise to 33 percent by 2020. Based on power supply strategy described previously, the estimated GHG emission reductions attributable to forming ICP are forecast to range from 1.33 to 2.34 million metric tons CO2e per year by 2018 assuming a 50 percent RPS target is achieved. The baseline for comparison is the resource mix used by SCE versus the resource mix that will be utilized by ICP. Exhibit 44 details these reductions.
Exhibit 44 Baseline Comparison of GHG Reduction by ICP by 2018
ICP CVAG SANBAG WRCOG
Forecast Renewables (50% Renewables) ICP (GWH) – Phase 2
7,533 916 4,184 2,433
ICP RPS (GWH) – Phase 2 4,219 513 2,343 1,362
Additional Green Power 3,315 403 1,841 1,070
CO2 reduction – Low (Million Metric tons CO2e) 1.33 0.16 0.74 0.43
CO2 reduction – High (Million Metric tons CO2e) 2.34 0.28 1.30 0.76
The reductions in GHG associated with ICP operations are significant. This amount of reduced emissions represents a reduction in the emissions from the in-State generation resources from 2.6 to 4.6 percent.
Economic Development
The analyses contained in this Plan for forming ICP has focused on the direct rate effects of this formation. However, in addition to direct effects, indirect microeconomic effects are also encountered.
The indirect effects of creating ICP include the effects of increased commerce, and improved environmental and health conditions. Within this Plan, an Input/Output (IO) analysis is undertaken to analyze these indirect effects. The IO model turns on the assumption that forming ICP will lead to lower energy rates for their customers. Three types of impacts are analyzed in the IO model. These are described below.
10 http://www.cpuc.ca.gov/RPS_Homepage/

DRAFT
INLAND CHOICE POWER – COMMUNITY CHOICE AGGREGATION BUSINESS PLAN 60
Local Investment - ICP may choose to implement programs to incentivize investments in local distributed energy resources (DER). These resources can be behind the meter or community projects where several customers participate in a centrally located project. This demand for local resources will lead to an increase in the manufacturing and installation of DER, and lead to an increase in employment in the manufacturing and construction sectors. Increased Disposable Income - Establishing ICP will lead to reduced customer rates for energy, more disposable income for individuals and greater revenues for businesses. These cost savings would then lead to more investment by individuals and businesses for personal or business purposes. This increase in spending will then lead to increased employment for multiple sectors such as retail, construction, and manufacturing. Environmental and Health Impacts - With the creation of ICP, other non-commerce indirect effects will occur. These may be largely environmental such as improved air quality or improved human health due to ICP adopting mainly renewable energy sources versus continuing use of traditional energy sources. This resource strategy significantly reduces GHG emissions compared with SCE’s current resource mix. While the change in GHG emissions is not modeled directly in economic development models used in this Plan, the reduction of these GHGs may be captured in indirect effects projected by the models. Input-Output Modeling (IO Modeling)
IO modeling is a quantitative analysis representing relationships (dependence) between industries in an economy. IO models are based on the implicit assumption that each basic sector has a multiplier, or ripple effect, on the wider economy because each sector purchases goods and services to support that sector. IO modeling estimates the inter-industry transactions and uses those transactions to estimate the economic impacts of any change to the economy.
The IO model used in the Plan, IMPLAN, displays the economic impacts of changes in rates into four categories: employment, labor income, value added, and output. Employment is the number of jobs gained or lost. Labor income involves the increase in salaries and wages for current and newly gained or lost employees. Value added, similar to Gross Domestic Product (GDP), is the payment to labor and capital used in production of a particular industry.
IO models are made up of matrices of multipliers between each industry present in an economy. Each column shows how an industry is dependent on other industries for both its inputs to production and outputs. The tables of multipliers can be used to estimate the effects in changes in spending for various industries, household consumption, or labor income. Both positive and negative impacts can be measured using IO modeling. IO modeling produces results broken down into several categories. Each of these is described below:
Direct Effects – Increased purchases of inputs used to produce final goods and services purchased by residents. Direct effects are the input values in an IO model, or first round effects.
Indirect Effects – Value of inputs used by firms affected by direct effects (inputs). Economic activity that supports direct effects.

DRAFT
INLAND CHOICE POWER – COMMUNITY CHOICE AGGREGATION BUSINESS PLAN 61
Induced Effects – Results of Direct and Indirect effects (calculated using multipliers). Represents economic activity from household spending.
Total Effects – Sum of Direct, Indirect, and Induced effects.
Total Output – Value of all goods and services produced by industries.
Value Added – Total Output less value of inputs, or the Net Benefit/Impact to an economy.
Employment – Number of additional/reduced full time employment resulting from direct effects.
This Plan uses value added and employment figures to represent the total additional economic impact for each Project Alternative. IMPLAN has been used in this Plan to gauge the impacts on the ICP region of retail rate reductions associated with forming ICP. These impacts are discussed in detail below.
Increase in Disposal Income Associated with Rate Reduction Impacts
Exhibit 43 shows the effects $100 million in rate savings will have on the ICP economy. The $100 million rate savings represents the minimum bill savings per year achievable by ICP once in full operation. Direct effects from reduced rates are expected to add 388 jobs. Indirect effects are expected to add about 60 jobs. The induced effects of the project create approximately 98 jobs. In total, approximately 547 jobs are expected to be created in the ICP region. The ICP region is also projected to have a labor income impact of over $24.0 million, a total value added impact of approximately $37.2 million, and an output impact over $54.9 million. Exhibit 45 details the macroeconomics on the ICP region of the anticipated ICP customer bill reductions.
Exhibit 45 $100 Million Rate Savings Effects on ICP Economy
Impact Type Employment Labor Income Total Value Added Output
Direct Effect 388.0 $18.2 million $27.7 million $36.5 million
Indirect Effect 60.3 $2.1 million $3.5 million $6.3 million
Induced Effect 98.3 $3.8 million $7.0 million $12.1 million
Total Effect 546.6 $24.1 million $37.2 million $54.9 million
These savings are based on the economic construct that households will spend some share of the increased disposable income on more goods and services. This increased spending on goods and services will then lead to producers either increasing the wages of their current employees or hiring additional employees to handle the increased demand. This in turn will give the employees a larger disposable income which they spend on goods and services and thus repeating the cycle of increased demand.
DER Development Impacts
The economic impacts of DER development are estimated using the Jobs and Economic Development Impact (JEDI) model. JEDI estimates the effects of DER development on construction industries and the local economy. JEDI was initially developed by the National Renewable Energy Laboratory to demonstrate the economic benefits associated with constructing and operating wind and photovoltaic systems in the United States. JEDI has since been expanded to analyze similar

DRAFT
INLAND CHOICE POWER – COMMUNITY CHOICE AGGREGATION BUSINESS PLAN 62
economic impacts for various energy sources such as biofuels, coal, concentrating solar power, geothermal, marine and hydrokinetic power, and natural gas. A primary goal of JEDI is that it is being used as a tool for system developers, renewable energy advocates, government officials, decision makers, and others to easily identify the local economic impacts associated with constructing and operating these systems on the economy as a whole, whether through direct and indirect effects.
Users input general information about a particular energy project, such as the project location, the type of system being installed, nameplate capacity, annual operations and maintenance costs, and others. JEDI has default but modifiable data regarding various aspects of each energy system type, such as equipment costs, tax parameters, and labor costs. JEDI then uses the input general information and the data, default or modified, to run calculations on the types of economic effects produced by the proposed project. This model can output projected direct job creation by industry, indirect job and business increases due to the project, projected operation costs, and more.
In order for JEDI to provide information, it must be populated with detailed data for the assumed DER project. Projected system data, type of solar cell, nameplate capacity (kW), and the number of systems. As an example of the macroeconomic activity caused by local DER deployment, this Plan explores the impact of ICP installing of a 50 crystalline silicon, fixed mount solar systems with nameplate capacities of 1 MW each for a total capacity of 50 MW. ICP could install a number of larger local solar projects such as the one described above. Exhibit 46 describes the macroeconomic impacts of constructing only one of these local solar projects.

DRAFT
INLAND CHOICE POWER – COMMUNITY CHOICE AGGREGATION BUSINESS PLAN 63
Exhibit 46 Projected Solar Systems Impacts on ICP’s Economy
Description Jobs Earnings, $000 Output (GDP), $000
During Construction and Installation Period
*Project Development and Onsite Labor Impacts
Construction and Installation Labor 342.5 $22,182
Construction and Installation Related Services
374.3 $20,007
Subtotal 716.8 $42,189 $67,620
*Module and Supply Chain Impacts
Manufacturing Impacts 0.0 $0 $0
Trade (Wholesale and Retail) 79.4 $4,425 $12,887
Finance, Insurance and Real Estate 0.0 $0 $0
Professional Services 53.9 $2,326 $6,908
Other Services 141.4 $15,048 $42,364
Other Sectors 317.1 $10,656 $19,428
Subtotal 591.7 $32,455 $81,587
Induced Impacts 326.7 $13,067 $39,092
Total Impacts 1,635.3 $87,710 $188,298
During Operating Years
*Onsite Labor Impacts
PV Project Labor Only 9.2 $555 $555
*Local Revenue and Supply Chain Impacts 2.7 $145 $458
*Induced Impacts 1.9 $74 $221
Total Impacts 13.8 $774 $1,235
Exhibit 46 shows the construction and ongoing effects of building a 50 MW solar power project. It is projected that roughly 1,635 jobs will be created during construction and installation. Of this total, about 719 jobs will be directly involved in construction and installation while roughly 592 jobs will be indirectly involved with the building of the project. Induced impacts of the construction and installation will create approximately 327 jobs. These induced effects may include anything from increased employment in restaurants, retail, education, and others. Overall, the building of this sample 50 MW solar project is projected to create $87 million in earnings and $188 million in output (GDP) in the local economy along with 1,636 jobs during construction and 14 full-time jobs ongoing.

DRAFT
INLAND CHOICE POWER — COMMUNITY CHOICE AGGREGATION BUSINESS PLAN 64
Sensitivity Analysis
The aforementioned economic analysis provides the base case analysis of forming ICP. This base case is predicated on numerous assumptions and estimates that influence the overall results. This section of the Plan will provide the range of impacts that could result from changes in the most significant variables for the ICP scenario. In addition, this section will address risks that cannot be quantified, but should be addressed and mitigated to the maximum amount possible. Each key assumption is discussed, a band of uncertainty is established and ICP’s rate impacts associated with factoring in this uncertainty is developed for each key variable.
Since resource costs are based on forecast natural gas, wholesale market and renewable market prices, it is prudent to look at the sensitivity of the 20-year levelized cost calculation to fluctuations in these projections. Exhibit 47 below shows a summary of low, base, and high resource costs.
Exhibit 47 Low, Base and High 20-year Levelized Resource Costs ($/MWh)
Case Market PPA Portfolio 1 and 2
Renewables Portfolio 3
Renewables Natural gas-
fired Resources Local
Renewables
Low Case 26.3 32 40 45 45
Base Case 44.3 42 52 60 65
High Case 73.3 62 76 80 85
The 20-year levelized costs of each portfolio has been calculated using the range of resource costs shown above. The base case costs are depicted by the black dots in Exhibit 48.
Exhibit 48 Sensitivity of Portfolio 20-year Levelized Costs

DRAFT
INLAND CHOICE POWER – COMMUNITY CHOICE AGGREGATION BUSINESS PLAN 65
Portfolio 3, which relies on renewable energy purchases to serve all retail loads, has the highest projected costs that range from a low of $57/MWh to a high of $97/MWh. The low case for Portfolio 3 ($57/MWh) is greater than the base case for both Portfolios 1 and 2. The likelihood of solar costs increasing to the point that 20-year levelized costs are near $62/MWh seems unlikely. All signs point to decreases in solar equipment costs on a $/watt basis. There have been significant decreases in solar costs over the past few years. Given the financial incentives targeted at the solar industry as well as the continuing advances in technology, it seems very unlikely that solar costs will increase over the next 10 to 20 years. The study assumes that Production Tax Credits (PTCs) will continue based on the number of times it has been renewed and expanded since 1992.
The potential for market PPA prices to increase to the high case of $73/MWh has a much higher likelihood. Wholesale market prices are dependent on many factors the most notable of which are natural gas prices. Natural gas prices are at historic lows and wholesale market prices have followed. However, natural gas prices are subject to variety of local, national and international forces that could drastically alter the current market place. For one, increased regulation of the natural gas industry with respect to the deployment of fracking technology could cause decreases in natural gas supplies and commensurate increases in natural gas prices. If natural gas prices increased, it is highly likely that electric wholesale market prices would also increase.
When evaluating risks, it is important to note that power supply costs are approximately 81 percent of the total CCA costs, SCE non-bypassable charges account for 13 percent and CCA operating costs account for 6 percent of total CCA revenue requirement.
Loads and Customer Participation Rates
The Plan bases the 20-year load forecasts on expected load growth, load profiles and participation rates. In order to evaluate the potential impact of varying loads, low, medium, and high load forecasts have been developed for the sensitivity analysis. SCE made available load shape profiles by customer class for the entire SCE service area. These load profiles were applied to all customer loads despite the varying climate zones within the County. Another assumption that can impact the costs of ICP is the overall ICP customer participation rates. This Plan uses a conservative participation rate of 75 percent for residential customers and 65 percent for non-residential customers as its base case. A higher participation rate, such as has been experienced by all of California’s operating CCAs to date, will increase energy sales relative to the base case and decrease the fixed costs paid by each customer. On the other hand, a reduced participation rate will increase the fixed costs to ICP participants. Sensitivity to changes in projected loads has been tested for the high and low load forecast scenarios. For the sensitivity analysis, the high case assumes an additional 10 percent participation rate, while the low case assumes the participation rate is reduced by 50 percent. This low participation scenario is intended to explore the case where only some Cities elect to join. The low case assumes a 0 percent growth in energy and customers after 2017, while the high scenario assumes a 5 percent growth in energy and customers.

DRAFT
INLAND CHOICE POWER – COMMUNITY CHOICE AGGREGATION BUSINESS PLAN 66
SCE Rates and Surcharges
The base case forecast of SCE rates assumes delivery rates increase at 2 percent per year and generation rates increase approximately 2 percent based on the projected market prices and renewable resource growth rates. In addition, SCE’s generation cost was modeled in the high and low case by incorporating the expected range of market and renewable resource costs into SCE’s portfolio. The level of the PCIA will impact the cost competiveness of ICP. In order to be cost-effective, ICP power supply costs plus PCIA and other surcharges must be lower than SCE’s generation rates. Over time, the PCIA will vary, but it is expected that it will decline as market prices increase. The PCIA reflects SCE’s own resources and signed contracts. Once the contracts expire, the related PCIA will disappear. Sensitivity to the PCIA has been modeled in the high case by assuming the PCIA would increase to reflect a historic high of 2.5 cents per kWh and remain flat for the 20-year analysis period. For the low case, it was assumed that the PCIA decreases by 50 percent in year 1 and remains flat for the 20-year analysis period.
Sensitivity Results
Exhibit 49 provides the results of the sensitivity analysis for the 50% Green ICP scenario, which is the most likely portfolio for ICP to pursue. This sensitivity shows that the biggest risk to ICP is if the PCIA increases to historic levels, ICP does not achieve sufficient customer participation or if market prices fall significantly below their current historical low level.
Exhibit 49 50% Green Portfolio Sensitivity
20- year Levelized Average System Rate (cents per kWh)
DRAFT
INLAND CHOICE POWER – COMMUNITY CHOICE AGGREGATION BUSINESS PLAN 67
This sensitivity analysis shows that ICP rate could be greater than SCE rates if: The PCIA becomes much larger
ICP loads are much less than forecast
Wholesale market prices are much less than current experience
Each of these three scenarios has a low risk of actually occurring. For example, wholesale market prices for natural gas/electricity are at all-time lows. The probability of any significant further lowering of these prices is judged to be very small. The PCIA level should be fairly stable going forward as regulatory remedies are in play to stabilize the PCIA and the CCA vigilance in this area has increased markedly. Finally, this Plan assumes a relatively high customer opt-out percentage (25 percent for residential customers and 35 percent for non-residential customers) compared to the more modest opt-out rates experienced by California’s actively operating CCAs, which is closer to 5 percent – 15 percent. It is very unlikely ICP loads will not meet or exceed those assumed in this Plan.
Risks
Regulatory Risks There are numerous factors that could impact SCE’s rates in addition to the market price impacts described above. Regulatory changes, plant or technology retirements or additions, and the long-term impact of the Aliso Canyon leak all can impact SCE rates in the future. However, the impact of these factors is difficult to assess and model quantitatively. Regulatory issues continue to arise that may impact the competitiveness of ICP. However, California’s operating CCAs have worked hard to address any potentially detrimental changes through effective lobbying and technical support. New legislation can also impact ICP. For example, new legislation that recently affected CCAs are SB 350 and AB 1110. In addition, there are several changes that impact CCAs regarding power supply procurement and contracting. The CCA-specific changes reflected in SB 350 are generally positive, providing for ongoing autonomy with regard to resource planning and procurement. CCAs must be aware, however, of the long term contracting requirement associated with renewable energy procurement. Regulatory risks also include the potential for utility generation costs to be shifted to non-bypassable and delivery charges. ICP will need to continually monitor and lobby at the Federal, State and local levels to ensure fair and equitable treatment related to non-bypassable charges.

DRAFT
INLAND CHOICE POWER – COMMUNITY CHOICE AGGREGATION BUSINESS PLAN 68
Operational Options
There are several options for how to setup and organize a CCA. For this Plan, we have assumed three options for ICP. These options are:
One CCA for the Three COGs
This option consolidates workload by having one CCA perform all “back office” duties, including power procurement and data management. At the same time, this option allows each COG to design locally-targeting branding, programs, and customer outreach.
Three CCAs Working Independently This option entails each of the three COGs providing a full service CCA to include power procurement, data management and local program development/outreach.
Outsource the Entire CCA Operation to an Independent Third Party
Under this option, the COGs would hire a third-party entity to operate the CCA through “turnkey” CCA service with the guarantee of a fixed income stream. This would be only one entity and not a team of consultants.
Each option is critiqued and compared below.
The CCA operational option of one JPA for back office functions and have the local COGs brand and develop locally-specific programs and outreach is suggested. This option is recommended for the following reasons:
Retail rates will be the lowest possible.
Local control and choice in programs will be maintained.
A JPA organization provides a liability buffer between the CCA and its members.
This business model is currently being used by the four operating CCAs in California with
success.
The option to form three CCAs within ICP also has some initial appeal. If each COG formed a CCA, more local control would be achieved and potential thorny governance issues are avoided; however, the goal of lowest possible rates would likely not be achieved. The back office functions (i.e., power procurement and data management) are fairly consistent on a per customer basis; however, the internal costs are about the same for a 100,000-meter utility, and a 1,000,000-meter utility. Based on the operating CCAs in California, CCA operation requires between 15 and 20 full-time equivalent employees (FTEs). As such, forming three CCAs versus one for back office functions costs the CCA customers an additional $7 - $9 million per year. This is a material amount of economic inefficiency.

DRAFT
INLAND CHOICE POWER – COMMUNITY CHOICE AGGREGATION BUSINESS PLAN 69
Finally, there is the turnkey option. The turnkey option is initially attractive given its zero-cost to the CCA and the ease of administration. The primary issue with a turnkey operation is that rates will likely be higher for customers. Power purchase is highly capital-intensive, so the cost of capital becomes a major driver of CCA-operating costs. Private third-parties incur roughly twice the cost of capital as would a city, county, or JPA-owned CCA. Therefore, the publicly-operated CCA will almost certainly be able to offer lower rates. In addition, giving CCA operation to a third-party often compromises the CCA’s control over its power supply. The third-party guarantees the CCA owner an income stream but in exchange is typically given liberty to dictate the power supply options, energy efficiency programs, rates, staffing levels, and programs available to the CCA customers.

DRAFT
INLAND CHOICE POWER – COMMUNITY CHOICE AGGREGATION BUSINESS PLAN 70
Summary and Recommendations
Rate Impacts and Comparisons
The first impact associated with forming ICP will be lower electricity bills for ICP customers. ICP customers should see no obvious changes in electric service other than the lower price and increased procurement of renewable power. Customers will pay the power supply charges set by ICP and no longer pay the higher costs of SCE power supply.
Given this Plan’s findings, ICP’s rate setting can establish a goal of providing rates that are lower than the equivalent rates offered by SCE even under the 50 percent renewable portfolio. Under the 100 percent renewable portfolio, ICP customers will pay 11 percent less for their power compared to the comparable product offered by SCE. The projected ICP and SCE rates are illustrated in Exhibit 50. For this study, it has been assumed that the projected rate decrease is applied uniformly across all rate classes. Once established, it will be up to the ICP Board and staff to develop rates for each rate class that reflects cost of service.
Exhibit 50 Indicative Rate Comparison in ¢/kWh
(First Full Year of Operation)
Rate Class Customer
Type
2017 Estimated
SCE Bundled
Rate*
ICP RPS Bundled
Rate
SCE 50% Green
Bundled Rate
ICP 50% Green
Bundled Rate
SCE 100% Green
Bundled Rate
ICP 100% Green
Bundled Rate
Residential Domestic 20.55 19.58 22.30 19.81 24.05 21.79
Residential Care Domestic 12.22 11.64 13.97 11.78 15.72 12.96
GS-1 Commercial 17.03 16.23 18.78 16.41 20.53 18.06
GS-2 Commercial 16.57 15.79 18.32 15.97 20.07 17.57
GS-3 Industrial 14.71 14.02 16.46 14.18 18.21 15.60
PA-2 Public
Authority 13.08 12.46 14.83 12.61 16.58 13.87
PA-3 Public
Authority 11.31 10.78 13.06 10.90 14.81 11.99
TOU-8 Secondary Domestic 13.07 12.45 14.82 12.60 16.57 13.86
TOU-8 Primary Commercial 11.84 11.28 13.59 11.41 15.34 12.55
TOU-8 Substation Industrial 7.76 7.39 9.51 7.48 11.26 8.23
Total ICP Rate Savings over Comparable SCE Rates of 50% or 100% Green
4.9% 11.2% 9.4%
Total ICP Rate Savings over SCE’s Standard Bundled Rate
4.9% 3.8% -5.7%
*SCE bundled average rate based on SCE’s ERRA 2017 Draft Filing
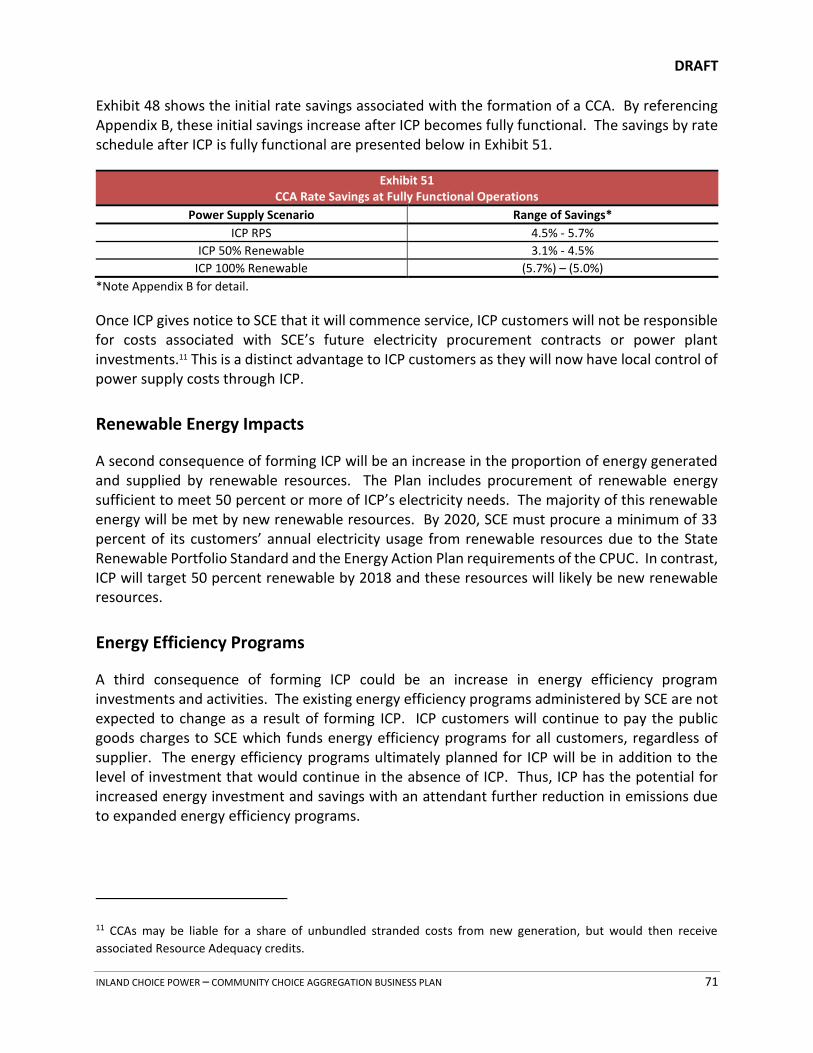
DRAFT
INLAND CHOICE POWER – COMMUNITY CHOICE AGGREGATION BUSINESS PLAN 71
Exhibit 48 shows the initial rate savings associated with the formation of a CCA. By referencing Appendix B, these initial savings increase after ICP becomes fully functional. The savings by rate schedule after ICP is fully functional are presented below in Exhibit 51.
Exhibit 51 CCA Rate Savings at Fully Functional Operations
Power Supply Scenario Range of Savings*
ICP RPS 4.5% - 5.7%
ICP 50% Renewable 3.1% - 4.5%
ICP 100% Renewable (5.7%) – (5.0%)
*Note Appendix B for detail.
Once ICP gives notice to SCE that it will commence service, ICP customers will not be responsible for costs associated with SCE’s future electricity procurement contracts or power plant investments.11 This is a distinct advantage to ICP customers as they will now have local control of power supply costs through ICP.
Renewable Energy Impacts
A second consequence of forming ICP will be an increase in the proportion of energy generated and supplied by renewable resources. The Plan includes procurement of renewable energy sufficient to meet 50 percent or more of ICP’s electricity needs. The majority of this renewable energy will be met by new renewable resources. By 2020, SCE must procure a minimum of 33 percent of its customers’ annual electricity usage from renewable resources due to the State Renewable Portfolio Standard and the Energy Action Plan requirements of the CPUC. In contrast, ICP will target 50 percent renewable by 2018 and these resources will likely be new renewable resources.
Energy Efficiency Programs
A third consequence of forming ICP could be an increase in energy efficiency program investments and activities. The existing energy efficiency programs administered by SCE are not expected to change as a result of forming ICP. ICP customers will continue to pay the public goods charges to SCE which funds energy efficiency programs for all customers, regardless of supplier. The energy efficiency programs ultimately planned for ICP will be in addition to the level of investment that would continue in the absence of ICP. Thus, ICP has the potential for increased energy investment and savings with an attendant further reduction in emissions due to expanded energy efficiency programs.
11 CCAs may be liable for a share of unbundled stranded costs from new generation, but would then receive
associated Resource Adequacy credits.
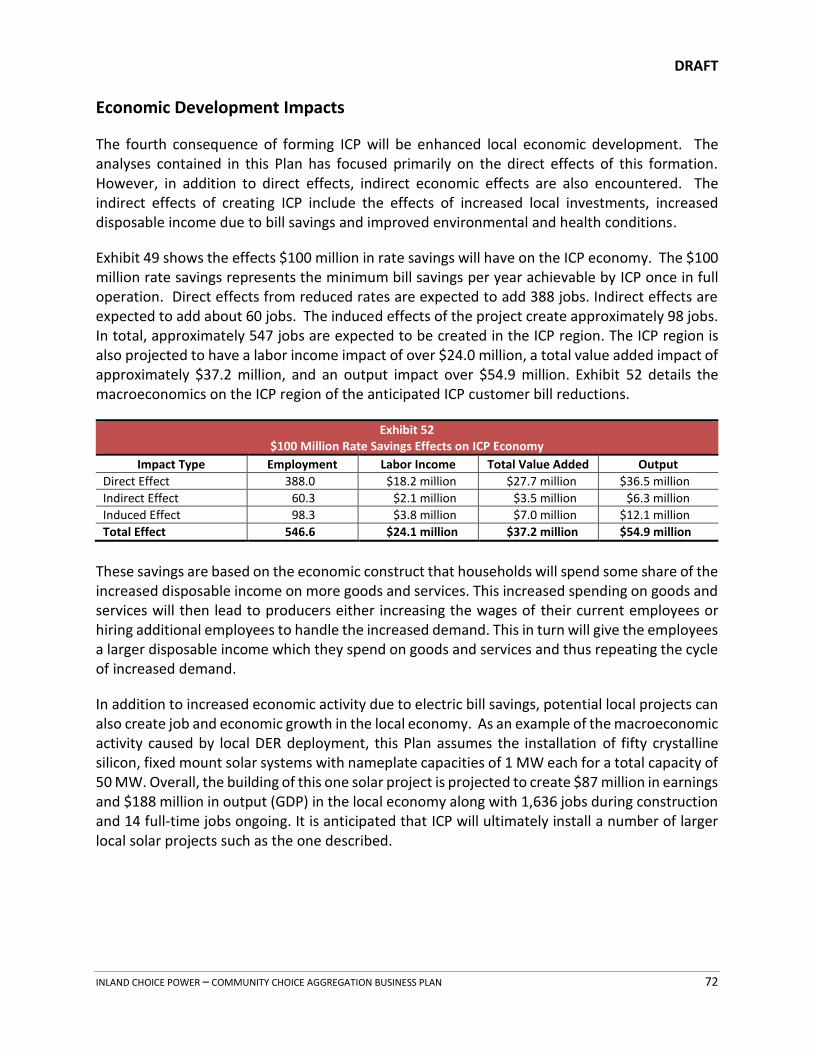
DRAFT
INLAND CHOICE POWER – COMMUNITY CHOICE AGGREGATION BUSINESS PLAN 72
Economic Development Impacts
The fourth consequence of forming ICP will be enhanced local economic development. The analyses contained in this Plan has focused primarily on the direct effects of this formation. However, in addition to direct effects, indirect economic effects are also encountered. The indirect effects of creating ICP include the effects of increased local investments, increased disposable income due to bill savings and improved environmental and health conditions.
Exhibit 49 shows the effects $100 million in rate savings will have on the ICP economy. The $100 million rate savings represents the minimum bill savings per year achievable by ICP once in full operation. Direct effects from reduced rates are expected to add 388 jobs. Indirect effects are expected to add about 60 jobs. The induced effects of the project create approximately 98 jobs. In total, approximately 547 jobs are expected to be created in the ICP region. The ICP region is also projected to have a labor income impact of over $24.0 million, a total value added impact of approximately $37.2 million, and an output impact over $54.9 million. Exhibit 52 details the macroeconomics on the ICP region of the anticipated ICP customer bill reductions.
Exhibit 52 $100 Million Rate Savings Effects on ICP Economy
Impact Type Employment Labor Income Total Value Added Output
Direct Effect 388.0 $18.2 million $27.7 million $36.5 million
Indirect Effect 60.3 $2.1 million $3.5 million $6.3 million
Induced Effect 98.3 $3.8 million $7.0 million $12.1 million
Total Effect 546.6 $24.1 million $37.2 million $54.9 million
These savings are based on the economic construct that households will spend some share of the increased disposable income on more goods and services. This increased spending on goods and services will then lead to producers either increasing the wages of their current employees or hiring additional employees to handle the increased demand. This in turn will give the employees a larger disposable income which they spend on goods and services and thus repeating the cycle of increased demand.
In addition to increased economic activity due to electric bill savings, potential local projects can also create job and economic growth in the local economy. As an example of the macroeconomic activity caused by local DER deployment, this Plan assumes the installation of fifty crystalline silicon, fixed mount solar systems with nameplate capacities of 1 MW each for a total capacity of 50 MW. Overall, the building of this one solar project is projected to create $87 million in earnings and $188 million in output (GDP) in the local economy along with 1,636 jobs during construction and 14 full-time jobs ongoing. It is anticipated that ICP will ultimately install a number of larger local solar projects such as the one described.
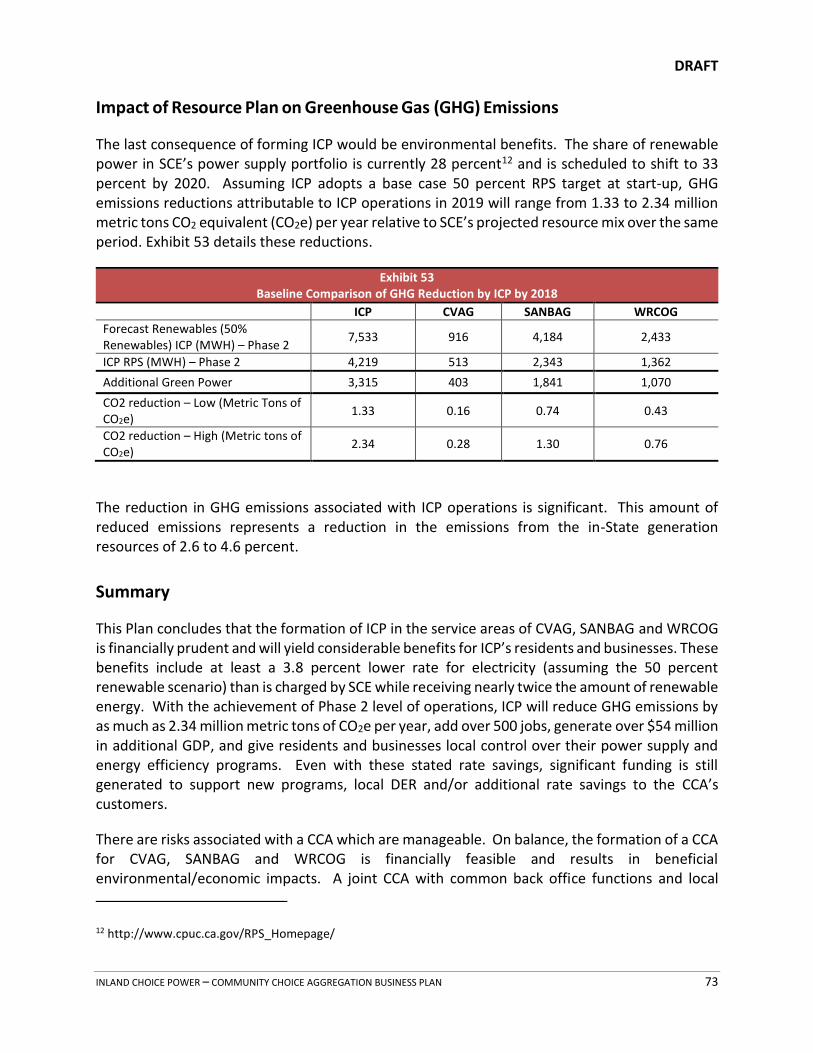
DRAFT
INLAND CHOICE POWER – COMMUNITY CHOICE AGGREGATION BUSINESS PLAN 73
Impact of Resource Plan on Greenhouse Gas (GHG) Emissions
The last consequence of forming ICP would be environmental benefits. The share of renewable power in SCE’s power supply portfolio is currently 28 percent12 and is scheduled to shift to 33 percent by 2020. Assuming ICP adopts a base case 50 percent RPS target at start-up, GHG emissions reductions attributable to ICP operations in 2019 will range from 1.33 to 2.34 million metric tons CO2 equivalent (CO2e) per year relative to SCE’s projected resource mix over the same period. Exhibit 53 details these reductions.
Exhibit 53 Baseline Comparison of GHG Reduction by ICP by 2018
ICP CVAG SANBAG WRCOG
Forecast Renewables (50% Renewables) ICP (MWH) – Phase 2
7,533 916 4,184 2,433
ICP RPS (MWH) – Phase 2 4,219 513 2,343 1,362
Additional Green Power 3,315 403 1,841 1,070
CO2 reduction – Low (Metric Tons of CO2e)
1.33 0.16 0.74 0.43
CO2 reduction – High (Metric tons of CO2e)
2.34 0.28 1.30 0.76
The reduction in GHG emissions associated with ICP operations is significant. This amount of reduced emissions represents a reduction in the emissions from the in-State generation resources of 2.6 to 4.6 percent.
Summary
This Plan concludes that the formation of ICP in the service areas of CVAG, SANBAG and WRCOG is financially prudent and will yield considerable benefits for ICP’s residents and businesses. These benefits include at least a 3.8 percent lower rate for electricity (assuming the 50 percent renewable scenario) than is charged by SCE while receiving nearly twice the amount of renewable energy. With the achievement of Phase 2 level of operations, ICP will reduce GHG emissions by as much as 2.34 million metric tons of CO2e per year, add over 500 jobs, generate over $54 million in additional GDP, and give residents and businesses local control over their power supply and energy efficiency programs. Even with these stated rate savings, significant funding is still generated to support new programs, local DER and/or additional rate savings to the CCA’s customers.
There are risks associated with a CCA which are manageable. On balance, the formation of a CCA for CVAG, SANBAG and WRCOG is financially feasible and results in beneficial environmental/economic impacts. A joint CCA with common back office functions and local
12 http://www.cpuc.ca.gov/RPS_Homepage/
DRAFT
INLAND CHOICE POWER – COMMUNITY CHOICE AGGREGATION BUSINESS PLAN 74
options for program development is the most economical operational option and is recommended.
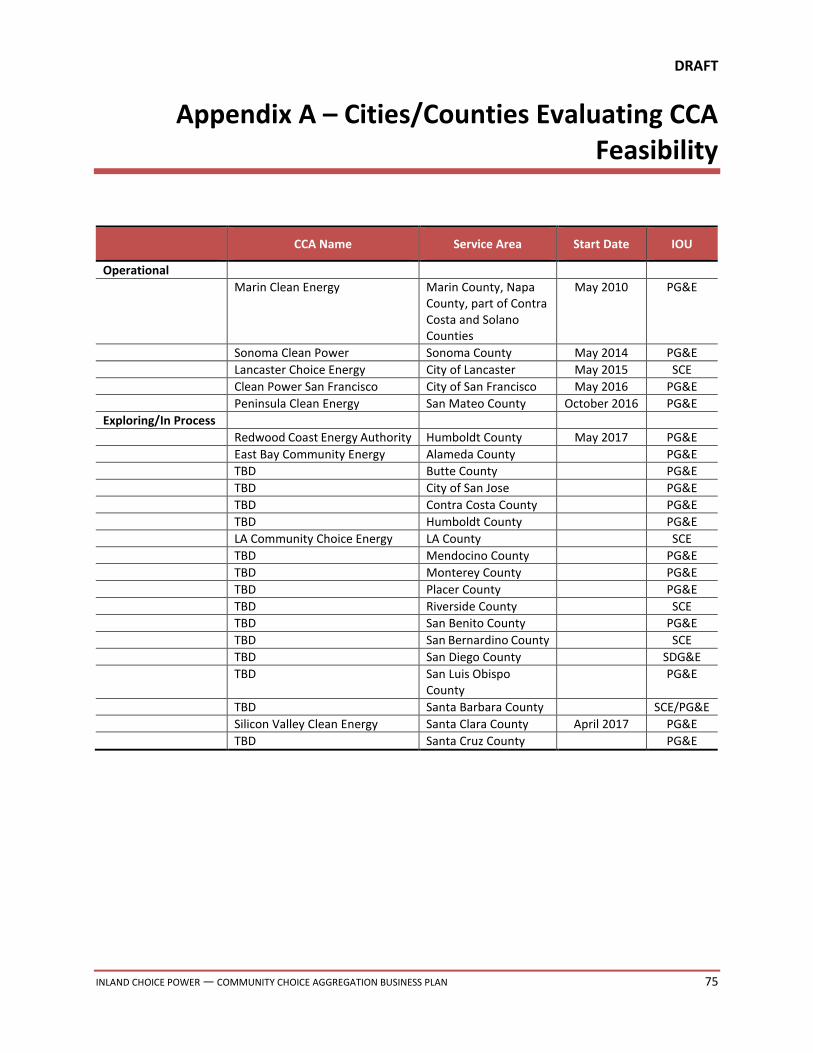
DRAFT
INLAND CHOICE POWER — COMMUNITY CHOICE AGGREGATION BUSINESS PLAN 75
Appendix A – Cities/Counties Evaluating CCA Feasibility
CCA Name Service Area Start Date IOU
Operational
Marin Clean Energy Marin County, Napa County, part of Contra Costa and Solano Counties
May 2010 PG&E
Sonoma Clean Power Sonoma County May 2014 PG&E
Lancaster Choice Energy City of Lancaster May 2015 SCE
Clean Power San Francisco City of San Francisco May 2016 PG&E
Peninsula Clean Energy San Mateo County October 2016 PG&E
Exploring/In Process
Redwood Coast Energy Authority Humboldt County May 2017 PG&E
East Bay Community Energy Alameda County PG&E TBD Butte County PG&E TBD City of San Jose PG&E TBD Contra Costa County PG&E TBD Humboldt County PG&E LA Community Choice Energy LA County SCE
TBD Mendocino County PG&E TBD Monterey County PG&E TBD Placer County PG&E
TBD Riverside County SCE
TBD San Benito County PG&E
TBD San Bernardino County SCE
TBD San Diego County SDG&E
TBD San Luis Obispo County
PG&E
TBD Santa Barbara County SCE/PG&E
Silicon Valley Clean Energy Santa Clara County April 2017 PG&E TBD Santa Cruz County PG&E

DRAFT
INLAND CHOICE POWER – COMMUNITY CHOICE AGGREGATION BUSINESS PLAN 76
Appendix B – Proforma Analyses
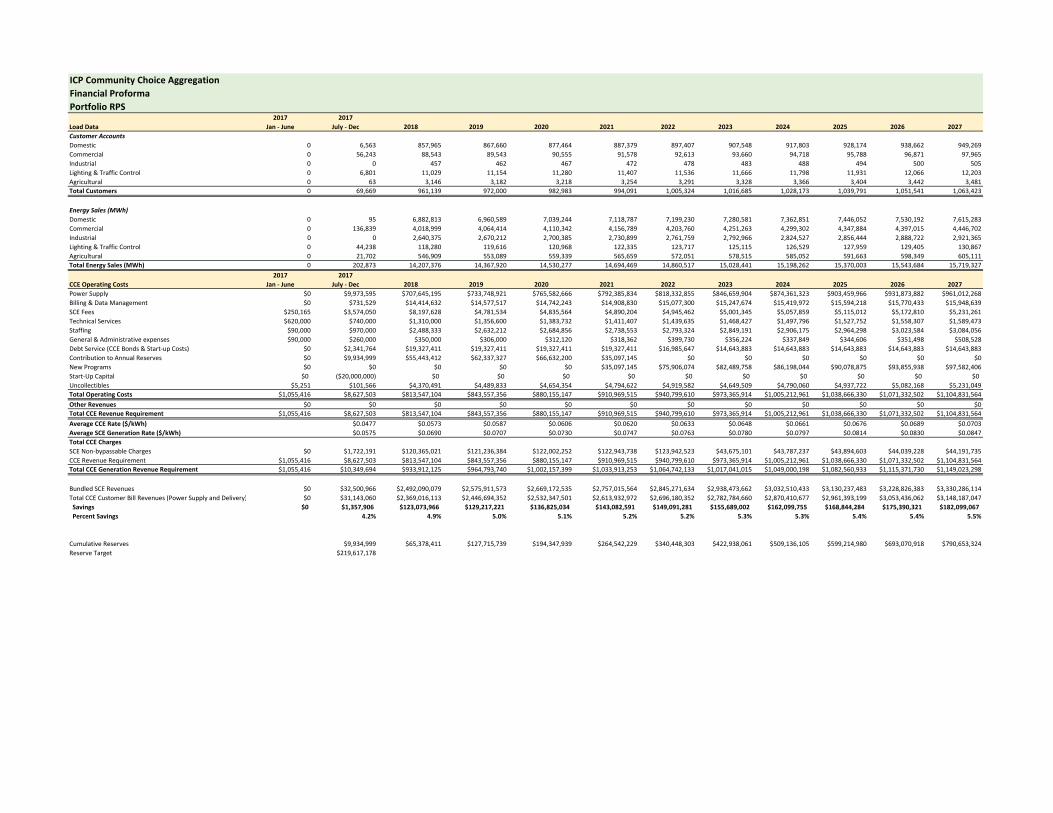
ICP Community Choice AggregationFinancial ProformaPortfolio RPS
2017 2017Load Data Jan ‐ June July ‐ Dec 2018 2019 2020 2021 2022 2023 2024 2025 2026 2027Customer AccountsDomestic 0 6,563 857,965 867,660 877,464 887,379 897,407 907,548 917,803 928,174 938,662 949,269Commercial 0 56,243 88,543 89,543 90,555 91,578 92,613 93,660 94,718 95,788 96,871 97,965Industrial 0 0 457 462 467 472 478 483 488 494 500 505Lighting & Traffic Control 0 6,801 11,029 11,154 11,280 11,407 11,536 11,666 11,798 11,931 12,066 12,203Agricultural 0 63 3,146 3,182 3,218 3,254 3,291 3,328 3,366 3,404 3,442 3,481Total Customers 0 69,669 961,139 972,000 982,983 994,091 1,005,324 1,016,685 1,028,173 1,039,791 1,051,541 1,063,423
Energy Sales (MWh)Domestic 0 95 6,882,813 6,960,589 7,039,244 7,118,787 7,199,230 7,280,581 7,362,851 7,446,052 7,530,192 7,615,283Commercial 0 136,839 4,018,999 4,064,414 4,110,342 4,156,789 4,203,760 4,251,263 4,299,302 4,347,884 4,397,015 4,446,702Industrial 0 0 2,640,375 2,670,212 2,700,385 2,730,899 2,761,759 2,792,966 2,824,527 2,856,444 2,888,722 2,921,365Lighting & Traffic Control 0 44,238 118,280 119,616 120,968 122,335 123,717 125,115 126,529 127,959 129,405 130,867Agricultural 0 21,702 546,909 553,089 559,339 565,659 572,051 578,515 585,052 591,663 598,349 605,111Total Energy Sales (MWh) 0 202,873 14,207,376 14,367,920 14,530,277 14,694,469 14,860,517 15,028,441 15,198,262 15,370,003 15,543,684 15,719,327
2017 2017CCE Operating Costs Jan ‐ June July ‐ Dec 2018 2019 2020 2021 2022 2023 2024 2025 2026 2027Power Supply $0 $9,973,595 $707,645,195 $733,748,921 $765,582,666 $792,385,834 $818,332,855 $846,659,904 $874,361,323 $903,459,966 $931,873,882 $961,012,268Billing & Data Management $0 $731,529 $14,414,632 $14,577,517 $14,742,243 $14,908,830 $15,077,300 $15,247,674 $15,419,972 $15,594,218 $15,770,433 $15,948,639SCE Fees $250,165 $3,574,050 $8,197,628 $4,781,534 $4,835,564 $4,890,204 $4,945,462 $5,001,345 $5,057,859 $5,115,012 $5,172,810 $5,231,261Technical Services $620,000 $740,000 $1,310,000 $1,356,600 $1,383,732 $1,411,407 $1,439,635 $1,468,427 $1,497,796 $1,527,752 $1,558,307 $1,589,473Staffing $90,000 $970,000 $2,488,333 $2,632,212 $2,684,856 $2,738,553 $2,793,324 $2,849,191 $2,906,175 $2,964,298 $3,023,584 $3,084,056General & Administrative expenses $90,000 $260,000 $350,000 $306,000 $312,120 $318,362 $399,730 $356,224 $337,849 $344,606 $351,498 $508,528Debt Service (CCE Bonds & Start‐up Costs) $0 $2,341,764 $19,327,411 $19,327,411 $19,327,411 $19,327,411 $16,985,647 $14,643,883 $14,643,883 $14,643,883 $14,643,883 $14,643,883Contribution to Annual Reserves $0 $9,934,999 $55,443,412 $62,337,327 $66,632,200 $35,097,145 $0 $0 $0 $0 $0 $0New Programs $0 $0 $0 $0 $0 $35,097,145 $75,906,074 $82,489,758 $86,198,044 $90,078,875 $93,855,938 $97,582,406Start‐Up Capital $0 ($20,000,000) $0 $0 $0 $0 $0 $0 $0 $0 $0 $0Uncollectibles $5,251 $101,566 $4,370,491 $4,489,833 $4,654,354 $4,794,622 $4,919,582 $4,649,509 $4,790,060 $4,937,722 $5,082,168 $5,231,049Total Operating Costs $1,055,416 $8,627,503 $813,547,104 $843,557,356 $880,155,147 $910,969,515 $940,799,610 $973,365,914 $1,005,212,961 $1,038,666,330 $1,071,332,502 $1,104,831,564Other Revenues $0 $0 $0 $0 $0 $0 $0 $0 $0 $0 $0 $0Total CCE Revenue Requirement $1,055,416 $8,627,503 $813,547,104 $843,557,356 $880,155,147 $910,969,515 $940,799,610 $973,365,914 $1,005,212,961 $1,038,666,330 $1,071,332,502 $1,104,831,564Average CCE Rate ($/kWh) $0.0477 $0.0573 $0.0587 $0.0606 $0.0620 $0.0633 $0.0648 $0.0661 $0.0676 $0.0689 $0.0703Average SCE Generation Rate ($/kWh) $0.0575 $0.0690 $0.0707 $0.0730 $0.0747 $0.0763 $0.0780 $0.0797 $0.0814 $0.0830 $0.0847Total CCE ChargesSCE Non‐bypassable Charges $0 $1,722,191 $120,365,021 $121,236,384 $122,002,252 $122,943,738 $123,942,523 $43,675,101 $43,787,237 $43,894,603 $44,039,228 $44,191,735CCE Revenue Requirement $1,055,416 $8,627,503 $813,547,104 $843,557,356 $880,155,147 $910,969,515 $940,799,610 $973,365,914 $1,005,212,961 $1,038,666,330 $1,071,332,502 $1,104,831,564Total CCE Generation Revenue Requirement $1,055,416 $10,349,694 $933,912,125 $964,793,740 $1,002,157,399 $1,033,913,253 $1,064,742,133 $1,017,041,015 $1,049,000,198 $1,082,560,933 $1,115,371,730 $1,149,023,298
Bundled SCE Revenues $0 $32,500,966 $2,492,090,079 $2,575,911,573 $2,669,172,535 $2,757,015,564 $2,845,271,634 $2,938,473,662 $3,032,510,433 $3,130,237,483 $3,228,826,383 $3,330,286,114Total CCE Customer Bill Revenues (Power Supply and Delivery) $0 $31,143,060 $2,369,016,113 $2,446,694,352 $2,532,347,501 $2,613,932,972 $2,696,180,352 $2,782,784,660 $2,870,410,677 $2,961,393,199 $3,053,436,062 $3,148,187,047 Savings $0 $1,357,906 $123,073,966 $129,217,221 $136,825,034 $143,082,591 $149,091,281 $155,689,002 $162,099,755 $168,844,284 $175,390,321 $182,099,067 Percent Savings 4.2% 4.9% 5.0% 5.1% 5.2% 5.2% 5.3% 5.3% 5.4% 5.4% 5.5%
Cumulative Reserves $9,934,999 $65,378,411 $127,715,739 $194,347,939 $264,542,229 $340,448,303 $422,938,061 $509,136,105 $599,214,980 $693,070,918 $790,653,324Reserve Target $219,617,178
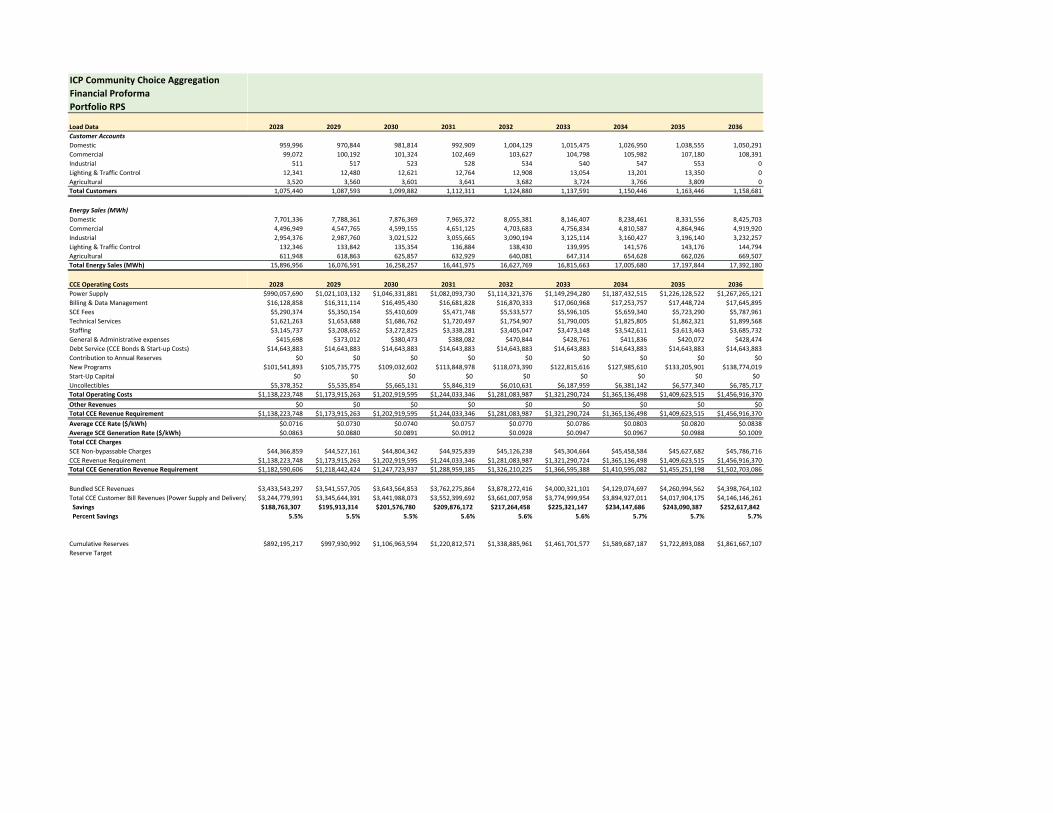
ICP Community Choice AggregationFinancial ProformaPortfolio RPS
Load DataCustomer AccountsDomesticCommercialIndustrialLighting & Traffic ControlAgriculturalTotal Customers
Energy Sales (MWh)DomesticCommercialIndustrialLighting & Traffic ControlAgriculturalTotal Energy Sales (MWh)
CCE Operating CostsPower SupplyBilling & Data ManagementSCE FeesTechnical ServicesStaffingGeneral & Administrative expensesDebt Service (CCE Bonds & Start‐up Costs)Contribution to Annual ReservesNew ProgramsStart‐Up CapitalUncollectiblesTotal Operating CostsOther RevenuesTotal CCE Revenue RequirementAverage CCE Rate ($/kWh)Average SCE Generation Rate ($/kWh)Total CCE ChargesSCE Non‐bypassable ChargesCCE Revenue RequirementTotal CCE Generation Revenue Requirement
Bundled SCE RevenuesTotal CCE Customer Bill Revenues (Power Supply and Delivery) Savings Percent Savings
Cumulative ReservesReserve Target
2028 2029 2030 2031 2032 2033 2034 2035 2036
959,996 970,844 981,814 992,909 1,004,129 1,015,475 1,026,950 1,038,555 1,050,29199,072 100,192 101,324 102,469 103,627 104,798 105,982 107,180 108,391
511 517 523 528 534 540 547 553 012,341 12,480 12,621 12,764 12,908 13,054 13,201 13,350 03,520 3,560 3,601 3,641 3,682 3,724 3,766 3,809 0
1,075,440 1,087,593 1,099,882 1,112,311 1,124,880 1,137,591 1,150,446 1,163,446 1,158,681
7,701,336 7,788,361 7,876,369 7,965,372 8,055,381 8,146,407 8,238,461 8,331,556 8,425,7034,496,949 4,547,765 4,599,155 4,651,125 4,703,683 4,756,834 4,810,587 4,864,946 4,919,9202,954,376 2,987,760 3,021,522 3,055,665 3,090,194 3,125,114 3,160,427 3,196,140 3,232,257132,346 133,842 135,354 136,884 138,430 139,995 141,576 143,176 144,794611,948 618,863 625,857 632,929 640,081 647,314 654,628 662,026 669,507
15,896,956 16,076,591 16,258,257 16,441,975 16,627,769 16,815,663 17,005,680 17,197,844 17,392,180
2028 2029 2030 2031 2032 2033 2034 2035 2036$990,057,690 $1,021,103,132 $1,046,331,881 $1,082,093,730 $1,114,321,376 $1,149,294,280 $1,187,432,515 $1,226,128,522 $1,267,265,121$16,128,858 $16,311,114 $16,495,430 $16,681,828 $16,870,333 $17,060,968 $17,253,757 $17,448,724 $17,645,895$5,290,374 $5,350,154 $5,410,609 $5,471,748 $5,533,577 $5,596,105 $5,659,340 $5,723,290 $5,787,961$1,621,263 $1,653,688 $1,686,762 $1,720,497 $1,754,907 $1,790,005 $1,825,805 $1,862,321 $1,899,568$3,145,737 $3,208,652 $3,272,825 $3,338,281 $3,405,047 $3,473,148 $3,542,611 $3,613,463 $3,685,732$415,698 $373,012 $380,473 $388,082 $470,844 $428,761 $411,836 $420,072 $428,474
$14,643,883 $14,643,883 $14,643,883 $14,643,883 $14,643,883 $14,643,883 $14,643,883 $14,643,883 $14,643,883$0 $0 $0 $0 $0 $0 $0 $0 $0
$101,541,893 $105,735,775 $109,032,602 $113,848,978 $118,073,390 $122,815,616 $127,985,610 $133,205,901 $138,774,019$0 $0 $0 $0 $0 $0 $0 $0 $0
$5,378,352 $5,535,854 $5,665,131 $5,846,319 $6,010,631 $6,187,959 $6,381,142 $6,577,340 $6,785,717$1,138,223,748 $1,173,915,263 $1,202,919,595 $1,244,033,346 $1,281,083,987 $1,321,290,724 $1,365,136,498 $1,409,623,515 $1,456,916,370
$0 $0 $0 $0 $0 $0 $0 $0 $0$1,138,223,748 $1,173,915,263 $1,202,919,595 $1,244,033,346 $1,281,083,987 $1,321,290,724 $1,365,136,498 $1,409,623,515 $1,456,916,370
$0.0716 $0.0730 $0.0740 $0.0757 $0.0770 $0.0786 $0.0803 $0.0820 $0.0838$0.0863 $0.0880 $0.0891 $0.0912 $0.0928 $0.0947 $0.0967 $0.0988 $0.1009
$44,366,859 $44,527,161 $44,804,342 $44,925,839 $45,126,238 $45,304,664 $45,458,584 $45,627,682 $45,786,716$1,138,223,748 $1,173,915,263 $1,202,919,595 $1,244,033,346 $1,281,083,987 $1,321,290,724 $1,365,136,498 $1,409,623,515 $1,456,916,370$1,182,590,606 $1,218,442,424 $1,247,723,937 $1,288,959,185 $1,326,210,225 $1,366,595,388 $1,410,595,082 $1,455,251,198 $1,502,703,086
$3,433,543,297 $3,541,557,705 $3,643,564,853 $3,762,275,864 $3,878,272,416 $4,000,321,101 $4,129,074,697 $4,260,994,562 $4,398,764,102$3,244,779,991 $3,345,644,391 $3,441,988,073 $3,552,399,692 $3,661,007,958 $3,774,999,954 $3,894,927,011 $4,017,904,175 $4,146,146,261$188,763,307 $195,913,314 $201,576,780 $209,876,172 $217,264,458 $225,321,147 $234,147,686 $243,090,387 $252,617,842
5.5% 5.5% 5.5% 5.6% 5.6% 5.6% 5.7% 5.7% 5.7%
$892,195,217 $997,930,992 $1,106,963,594 $1,220,812,571 $1,338,885,961 $1,461,701,577 $1,589,687,187 $1,722,893,088 $1,861,667,107

ICP Community Choice AggregationFinancial ProformaPortfolio ‐50% Renewable
2017 2017Load Data Jan ‐ June July ‐ Dec 2018 2019 2020 2021 2022 2023 2024 2025 2026 2027Customer AccountsDomestic 0 6,563 857,965 867,660 877,464 887,379 897,407 907,548 917,803 928,174 938,662 949,269Commercial 0 56,243 88,543 89,543 90,555 91,578 92,613 93,660 94,718 95,788 96,871 97,965Industrial 0 0 457 462 467 472 478 483 488 494 500 505Lighting & Traffic Control 0 6,801 11,029 11,154 11,280 11,407 11,536 11,666 11,798 11,931 12,066 12,203Agricultural 0 63 3,146 3,182 3,218 3,254 3,291 3,328 3,366 3,404 3,442 3,481Total Customers 0 69,669 961,139 972,000 982,983 994,091 1,005,324 1,016,685 1,028,173 1,039,791 1,051,541 1,063,423
Energy Sales (MWh)Domestic 0 95 6,882,813 6,960,589 7,039,244 7,118,787 7,199,230 7,280,581 7,362,851 7,446,052 7,530,192 7,615,283Commercial 0 136,839 4,018,999 4,064,414 4,110,342 4,156,789 4,203,760 4,251,263 4,299,302 4,347,884 4,397,015 4,446,702Industrial 0 0 2,640,375 2,670,212 2,700,385 2,730,899 2,761,759 2,792,966 2,824,527 2,856,444 2,888,722 2,921,365Lighting & Traffic Control 0 44,238 118,280 119,616 120,968 122,335 123,717 125,115 126,529 127,959 129,405 130,867Agricultural 0 21,702 546,909 553,089 559,339 565,659 572,051 578,515 585,052 591,663 598,349 605,111Total Energy Sales (MWh) 0 202,873 14,207,376 14,367,920 14,530,277 14,694,469 14,860,517 15,028,441 15,198,262 15,370,003 15,543,684 15,719,327
2017 2017CCE Operating Costs Jan ‐ June July ‐ Dec 2018 2019 2020 2021 2022 2023 2024 2025 2026 2027Power Supply $0 $10,381,996 $738,881,822 $759,553,192 $780,672,276 $803,406,868 $826,270,323 $850,038,727 $874,560,745 $900,023,370 $926,876,984 $954,872,057Billing & Data Management $0 $731,529 $14,414,632 $14,577,517 $14,742,243 $14,908,830 $15,077,300 $15,247,674 $15,419,972 $15,594,218 $15,770,433 $15,948,639SCE Fees $250,165 $3,574,050 $8,197,628 $4,781,534 $4,835,564 $4,890,204 $4,945,462 $5,001,345 $5,057,859 $5,115,012 $5,172,810 $5,231,261Technical Services $620,000 $740,000 $1,310,000 $1,356,600 $1,383,732 $1,411,407 $1,439,635 $1,468,427 $1,497,796 $1,527,752 $1,558,307 $1,589,473Staffing $90,000 $970,000 $2,488,333 $2,632,212 $2,684,856 $2,738,553 $2,793,324 $2,849,191 $2,906,175 $2,964,298 $3,023,584 $3,084,056General & Administrative expenses $90,000 $260,000 $350,000 $306,000 $312,120 $318,362 $399,730 $356,224 $337,849 $344,606 $351,498 $508,528Debt Service (CCE Bonds & Start‐up Costs) $0 $2,341,764 $19,327,411 $19,327,411 $19,327,411 $19,327,411 $16,985,647 $14,643,883 $14,643,883 $14,643,883 $14,643,883 $14,643,883Contribution to Annual Reserves $0 $9,874,541 $53,455,920 $66,894,060 $83,279,978 $46,022,380 $0 $0 $0 $0 $0 $0New Programs $0 $0 $0 $0 $0 $46,022,380 $101,933,723 $114,275,941 $122,330,624 $131,074,810 $137,600,681 $143,686,990Start‐Up Capital $0 ($20,000,000) $0 $0 $0 $0 $0 $0 $0 $0 $0 $0Uncollectibles $5,251 $103,608 $4,526,674 $4,618,854 $4,729,802 $4,849,727 $4,959,270 $4,666,403 $4,791,058 $4,920,539 $5,057,184 $5,200,348Total Operating Costs $1,055,416 $8,977,488 $842,952,421 $874,047,381 $911,967,983 $943,896,124 $974,804,415 $1,008,547,815 $1,041,545,960 $1,076,208,487 $1,110,055,364 $1,144,765,235Other Revenues $0 $0 $0 $0 $0 $0 $0 $0 $0 $0 $0 $0Total CCE Revenue Requirement $1,055,416 $8,977,488 $842,952,421 $874,047,381 $911,967,983 $943,896,124 $974,804,415 $1,008,547,815 $1,041,545,960 $1,076,208,487 $1,110,055,364 $1,144,765,235Average CCE Rate ($/kWh) $0.0495 $0.0593 $0.0608 $0.0628 $0.0642 $0.0656 $0.0671 $0.0685 $0.0700 $0.0714 $0.0728Average SCE Generation Rate ($/kWh) $0.0575 $0.0690 $0.0707 $0.0730 $0.0747 $0.0763 $0.0780 $0.0797 $0.0814 $0.0830 $0.0847Total CCE ChargesSCE Non‐bypassable Charges $0 $1,722,191 $120,365,021 $121,236,384 $122,002,252 $122,943,738 $123,942,523 $43,675,101 $43,787,237 $43,894,603 $44,039,228 $44,191,735CCE Revenue Requirement $1,055,416 $8,977,488 $842,952,421 $874,047,381 $911,967,983 $943,896,124 $974,804,415 $1,008,547,815 $1,041,545,960 $1,076,208,487 $1,110,055,364 $1,144,765,235Total CCE Generation Revenue Requirement $1,055,416 $10,699,679 $963,317,442 $995,283,765 $1,033,970,236 $1,066,839,862 $1,098,746,938 $1,052,222,916 $1,085,333,197 $1,120,103,090 $1,154,094,592 $1,188,956,969
Bundled SCE Revenues $0 $32,500,966 $2,492,090,079 $2,575,911,573 $2,669,172,535 $2,757,015,564 $2,845,271,634 $2,938,473,662 $3,032,510,433 $3,130,237,483 $3,228,826,383 $3,330,286,114Total CCE Customer Bill Revenues (Power Supply and Delivery) $0 $31,493,045 $2,398,421,430 $2,477,184,377 $2,564,160,338 $2,646,859,581 $2,730,185,158 $2,817,966,561 $2,906,743,676 $2,998,935,356 $3,092,158,924 $3,188,120,717 Savings $0 $1,007,921 $93,668,649 $98,727,196 $105,012,197 $110,155,982 $115,086,476 $120,507,101 $125,766,757 $131,302,128 $136,667,459 $142,165,397 Percent Savings 3.1% 3.8% 3.8% 3.9% 4.0% 4.0% 4.1% 4.1% 4.2% 4.2% 4.3%
Cumulative Reserves $9,874,541 $63,330,461 $130,224,521 $213,504,499 $305,549,260 $407,482,983 $521,758,924 $644,089,548 $775,164,358 $912,765,040 $1,056,452,029Reserve Target $227,465,380

ICP Community Choice AggregationFinancial ProformaPortfolio ‐50% Renewable
Load DataCustomer AccountsDomesticCommercialIndustrialLighting & Traffic ControlAgriculturalTotal Customers
Energy Sales (MWh)DomesticCommercialIndustrialLighting & Traffic ControlAgriculturalTotal Energy Sales (MWh)
CCE Operating CostsPower SupplyBilling & Data ManagementSCE FeesTechnical ServicesStaffingGeneral & Administrative expensesDebt Service (CCE Bonds & Start‐up Costs)Contribution to Annual ReservesNew ProgramsStart‐Up CapitalUncollectiblesTotal Operating CostsOther RevenuesTotal CCE Revenue RequirementAverage CCE Rate ($/kWh)Average SCE Generation Rate ($/kWh)Total CCE ChargesSCE Non‐bypassable ChargesCCE Revenue RequirementTotal CCE Generation Revenue Requirement
Bundled SCE RevenuesTotal CCE Customer Bill Revenues (Power Supply and Delivery) Savings Percent Savings
Cumulative ReservesReserve Target
2028 2029 2030 2031 2032 2033 2034 2035 2036
959,996 970,844 981,814 992,909 1,004,129 1,015,475 1,026,950 1,038,555 1,050,29199,072 100,192 101,324 102,469 103,627 104,798 105,982 107,180 108,391
511 517 523 528 534 540 547 553 012,341 12,480 12,621 12,764 12,908 13,054 13,201 13,350 03,520 3,560 3,601 3,641 3,682 3,724 3,766 3,809 0
1,075,440 1,087,593 1,099,882 1,112,311 1,124,880 1,137,591 1,150,446 1,163,446 1,158,681
7,701,336 7,788,361 7,876,369 7,965,372 8,055,381 8,146,407 8,238,461 8,331,556 8,425,7034,496,949 4,547,765 4,599,155 4,651,125 4,703,683 4,756,834 4,810,587 4,864,946 4,919,9202,954,376 2,987,760 3,021,522 3,055,665 3,090,194 3,125,114 3,160,427 3,196,140 3,232,257132,346 133,842 135,354 136,884 138,430 139,995 141,576 143,176 144,794611,948 618,863 625,857 632,929 640,081 647,314 654,628 662,026 669,507
15,896,956 16,076,591 16,258,257 16,441,975 16,627,769 16,815,663 17,005,680 17,197,844 17,392,180
2028 2029 2030 2031 2032 2033 2034 2035 2036$983,522,942 $1,013,839,299 $1,046,331,881 $1,082,093,730 $1,114,321,376 $1,149,294,280 $1,187,432,515 $1,226,128,522 $1,267,265,121$16,128,858 $16,311,114 $16,495,430 $16,681,828 $16,870,333 $17,060,968 $17,253,757 $17,448,724 $17,645,895$5,290,374 $5,350,154 $5,410,609 $5,471,748 $5,533,577 $5,596,105 $5,659,340 $5,723,290 $5,787,961$1,621,263 $1,653,688 $1,686,762 $1,720,497 $1,754,907 $1,790,005 $1,825,805 $1,862,321 $1,899,568$3,145,737 $3,208,652 $3,272,825 $3,338,281 $3,405,047 $3,473,148 $3,542,611 $3,613,463 $3,685,732$415,698 $373,012 $380,473 $388,082 $470,844 $428,761 $411,836 $420,072 $428,474
$14,643,883 $14,643,883 $14,643,883 $14,643,883 $14,643,883 $14,643,883 $14,643,883 $14,643,883 $14,643,883$0 $0 $0 $0 $0 $0 $0 $0 $0
$149,249,933 $155,466,599 $152,511,623 $158,814,038 $164,377,630 $170,573,112 $177,327,893 $184,156,148 $191,433,647$0 $0 $0 $0 $0 $0 $0 $0 $0
$5,345,678 $5,499,535 $5,665,131 $5,846,319 $6,010,631 $6,187,959 $6,381,142 $6,577,340 $6,785,717$1,179,364,365 $1,216,345,935 $1,246,398,616 $1,288,998,407 $1,327,388,228 $1,369,048,220 $1,414,478,781 $1,460,573,763 $1,509,575,998
$0 $0 $0 $0 $0 $0 $0 $0 $0$1,179,364,365 $1,216,345,935 $1,246,398,616 $1,288,998,407 $1,327,388,228 $1,369,048,220 $1,414,478,781 $1,460,573,763 $1,509,575,998
$0.0742 $0.0757 $0.0767 $0.0784 $0.0798 $0.0814 $0.0832 $0.0849 $0.0868$0.0863 $0.0880 $0.0891 $0.0912 $0.0928 $0.0947 $0.0967 $0.0988 $0.1009
$44,366,859 $44,527,161 $44,804,342 $44,925,839 $45,126,238 $45,304,664 $45,458,584 $45,627,682 $45,786,716$1,179,364,365 $1,216,345,935 $1,246,398,616 $1,288,998,407 $1,327,388,228 $1,369,048,220 $1,414,478,781 $1,460,573,763 $1,509,575,998$1,223,731,224 $1,260,873,096 $1,291,202,959 $1,333,924,246 $1,372,514,466 $1,414,352,884 $1,459,937,365 $1,506,201,445 $1,555,362,714
$3,433,543,297 $3,541,557,705 $3,643,564,853 $3,762,275,864 $3,878,272,416 $4,000,321,101 $4,129,074,697 $4,260,994,562 $4,398,764,102$3,285,920,608 $3,388,075,063 $3,485,467,095 $3,597,364,753 $3,707,312,199 $3,822,757,450 $3,944,269,294 $4,068,854,422 $4,198,805,888$147,622,689 $153,482,642 $158,097,758 $164,911,111 $170,960,217 $177,563,651 $184,805,403 $192,140,140 $199,958,214
4.3% 4.3% 4.3% 4.4% 4.4% 4.4% 4.5% 4.5% 4.5%
$1,205,701,962 $1,361,168,561 $1,513,680,184 $1,672,494,222 $1,836,871,852 $2,007,444,965 $2,184,772,858 $2,368,929,006 $2,560,362,653

ICP Community Choice AggregationFinancial ProformaPortfolio ‐100% Renewable
2017 2017Load Data Jan ‐ June July ‐ Dec 2018 2019 2020 2021 2022 2023 2024 2025 2026 2027Customer AccountsDomestic 0 6,563 857,965 867,660 877,464 887,379 897,407 907,548 917,803 928,174 938,662 949,269Commercial 0 56,243 88,543 89,543 90,555 91,578 92,613 93,660 94,718 95,788 96,871 97,965Industrial 0 0 457 462 467 472 478 483 488 494 500 505Lighting & Traffic Control 0 6,801 11,029 11,154 11,280 11,407 11,536 11,666 11,798 11,931 12,066 12,203Agricultural 0 63 3,146 3,182 3,218 3,254 3,291 3,328 3,366 3,404 3,442 3,481Total Customers 0 69,669 961,139 972,000 982,983 994,091 1,005,324 1,016,685 1,028,173 1,039,791 1,051,541 1,063,423
Energy Sales (MWh)Domestic 0 95 6,882,813 6,960,589 7,039,244 7,118,787 7,199,230 7,280,581 7,362,851 7,446,052 7,530,192 7,615,283Commercial 0 136,839 4,018,999 4,064,414 4,110,342 4,156,789 4,203,760 4,251,263 4,299,302 4,347,884 4,397,015 4,446,702Industrial 0 0 2,640,375 2,670,212 2,700,385 2,730,899 2,761,759 2,792,966 2,824,527 2,856,444 2,888,722 2,921,365Lighting & Traffic Control 0 44,238 118,280 119,616 120,968 122,335 123,717 125,115 126,529 127,959 129,405 130,867Agricultural 0 21,702 546,909 553,089 559,339 565,659 572,051 578,515 585,052 591,663 598,349 605,111Total Energy Sales (MWh) 0 202,873 14,207,376 14,367,920 14,530,277 14,694,469 14,860,517 15,028,441 15,198,262 15,370,003 15,543,684 15,719,327
2017 2017CCE Operating Costs Jan ‐ June July ‐ Dec 2018 2019 2020 2021 2022 2023 2024 2025 2026 2027Power Supply $0 $13,812,233 $965,273,392 $988,855,853 $1,013,033,065 $1,038,816,390 $1,064,978,225 $1,092,187,159 $1,120,292,984 $1,149,278,806 $1,179,609,155 $1,211,057,134Billing & Data Management $0 $731,529 $14,414,632 $14,577,517 $14,742,243 $14,908,830 $15,077,300 $15,247,674 $15,419,972 $15,594,218 $15,770,433 $15,948,639SCE Fees $250,165 $3,574,050 $8,197,628 $4,781,534 $4,835,564 $4,890,204 $4,945,462 $5,001,345 $5,057,859 $5,115,012 $5,172,810 $5,231,261Technical Services $620,000 $740,000 $1,310,000 $1,356,600 $1,383,732 $1,411,407 $1,439,635 $1,468,427 $1,497,796 $1,527,752 $1,558,307 $1,589,473Staffing $90,000 $970,000 $2,488,333 $2,632,212 $2,684,856 $2,738,553 $2,793,324 $2,849,191 $2,906,175 $2,964,298 $3,023,584 $3,084,056General & Administrative expenses $90,000 $260,000 $350,000 $306,000 $312,120 $318,362 $399,730 $356,224 $337,849 $344,606 $351,498 $508,528Debt Service (CCE Bonds & Start‐up Costs) $0 $2,341,764 $19,327,411 $19,327,411 $19,327,411 $19,327,411 $16,985,647 $14,643,883 $14,643,883 $14,643,883 $14,643,883 $14,643,883Contribution to Annual Reserves $0 $9,227,034 $61,174,927 $80,365,085 $104,260,078 $59,435,532 $0 $0 $0 $0 $0 $0New Programs $0 $0 $0 $0 $0 $59,435,532 $134,070,724 $152,371,971 $166,033,712 $180,910,349 $193,387,742 $205,690,356Start‐Up Capital $0 ($20,000,000) $0 $0 $0 $0 $0 $0 $0 $0 $0 $0Uncollectibles $5,251 $120,759 $5,658,632 $5,765,368 $5,891,606 $6,026,774 $6,152,809 $5,877,145 $6,019,719 $6,166,816 $6,320,844 $6,481,274Total Operating Costs $1,055,416 $11,777,368 $1,078,194,957 $1,117,967,580 $1,166,470,677 $1,207,308,996 $1,246,842,857 $1,290,003,019 $1,332,209,949 $1,376,545,739 $1,419,838,256 $1,464,234,602Other Revenues $0 $0 $0 $0 $0 $0 $0 $0 $0 $0 $0 $0Total CCE Revenue Requirement $1,055,416 $11,777,368 $1,078,194,957 $1,117,967,580 $1,166,470,677 $1,207,308,996 $1,246,842,857 $1,290,003,019 $1,332,209,949 $1,376,545,739 $1,419,838,256 $1,464,234,602Average CCE Rate ($/kWh) $0.0633 $0.0759 $0.0778 $0.0803 $0.0822 $0.0839 $0.0858 $0.0877 $0.0896 $0.0913 $0.0931Average SCE Generation Rate ($/kWh) $0.0575 $0.0690 $0.0707 $0.0730 $0.0747 $0.0763 $0.0780 $0.0797 $0.0814 $0.0830 $0.0847Total CCE ChargesSCE Non‐bypassable Charges $0 $1,722,191 $120,365,021 $121,236,384 $122,002,252 $122,943,738 $123,942,523 $43,675,101 $43,787,237 $43,894,603 $44,039,228 $44,191,735CCE Revenue Requirement $1,055,416 $11,777,368 $1,078,194,957 $1,117,967,580 $1,166,470,677 $1,207,308,996 $1,246,842,857 $1,290,003,019 $1,332,209,949 $1,376,545,739 $1,419,838,256 $1,464,234,602Total CCE Generation Revenue Requirement $1,055,416 $13,499,559 $1,198,559,978 $1,239,203,964 $1,288,472,929 $1,330,252,734 $1,370,785,380 $1,333,678,120 $1,375,997,185 $1,420,440,342 $1,463,877,484 $1,508,426,337
Bundled SCE Revenues $0 $32,500,966 $2,492,090,079 $2,575,911,573 $2,669,172,535 $2,757,015,564 $2,845,271,634 $2,938,473,662 $3,032,510,433 $3,130,237,483 $3,228,826,383 $3,330,286,114Total CCE Customer Bill Revenues (Power Supply and Delivery) $0 $34,292,925 $2,633,663,966 $2,721,104,576 $2,818,663,031 $2,910,272,453 $3,002,223,599 $3,099,421,765 $3,197,407,665 $3,299,272,608 $3,401,941,816 $3,507,590,085 Savings $0 ($1,791,960) ($141,573,887) ($145,193,003) ($149,490,496) ($153,256,890) ($156,951,965) ($160,948,103) ($164,897,232) ($169,035,125) ($173,115,433) ($177,303,971) Percent Savings ‐5.5% ‐5.7% ‐5.6% ‐5.6% ‐5.6% ‐5.5% ‐5.5% ‐5.4% ‐5.4% ‐5.4% ‐5.3%
Cumulative Reserves $9,227,034 $70,401,961 $150,767,046 $255,027,124 $373,898,187 $507,968,911 $660,340,882 $826,374,594 $1,007,284,943 $1,200,672,685 $1,406,363,040Reserve Target $284,346,263

ICP Community Choice AggregationFinancial ProformaPortfolio ‐100% Renewable
Load DataCustomer AccountsDomesticCommercialIndustrialLighting & Traffic ControlAgriculturalTotal Customers
Energy Sales (MWh)DomesticCommercialIndustrialLighting & Traffic ControlAgriculturalTotal Energy Sales (MWh)
CCE Operating CostsPower SupplyBilling & Data ManagementSCE FeesTechnical ServicesStaffingGeneral & Administrative expensesDebt Service (CCE Bonds & Start‐up Costs)Contribution to Annual ReservesNew ProgramsStart‐Up CapitalUncollectiblesTotal Operating CostsOther RevenuesTotal CCE Revenue RequirementAverage CCE Rate ($/kWh)Average SCE Generation Rate ($/kWh)Total CCE ChargesSCE Non‐bypassable ChargesCCE Revenue RequirementTotal CCE Generation Revenue Requirement
Bundled SCE RevenuesTotal CCE Customer Bill Revenues (Power Supply and Delivery) Savings Percent Savings
Cumulative ReservesReserve Target
2028 2029 2030 2031 2032 2033 2034 2035 2036
959,996 970,844 981,814 992,909 1,004,129 1,015,475 1,026,950 1,038,555 1,050,29199,072 100,192 101,324 102,469 103,627 104,798 105,982 107,180 108,391
511 517 523 528 534 540 547 553 012,341 12,480 12,621 12,764 12,908 13,054 13,201 13,350 03,520 3,560 3,601 3,641 3,682 3,724 3,766 3,809 0
1,075,440 1,087,593 1,099,882 1,112,311 1,124,880 1,137,591 1,150,446 1,163,446 1,158,681
7,701,336 7,788,361 7,876,369 7,965,372 8,055,381 8,146,407 8,238,461 8,331,556 8,425,7034,496,949 4,547,765 4,599,155 4,651,125 4,703,683 4,756,834 4,810,587 4,864,946 4,919,9202,954,376 2,987,760 3,021,522 3,055,665 3,090,194 3,125,114 3,160,427 3,196,140 3,232,257132,346 133,842 135,354 136,884 138,430 139,995 141,576 143,176 144,794611,948 618,863 625,857 632,929 640,081 647,314 654,628 662,026 669,507
15,896,956 16,076,591 16,258,257 16,441,975 16,627,769 16,815,663 17,005,680 17,197,844 17,392,180
2028 2029 2030 2031 2032 2033 2034 2035 2036$1,243,478,415 $1,277,923,815 $1,313,160,531 $1,349,217,248 $1,386,279,882 $1,425,852,830 $1,466,789,205 $1,508,492,221 $1,551,453,949
$16,128,858 $16,311,114 $16,495,430 $16,681,828 $16,870,333 $17,060,968 $17,253,757 $17,448,724 $17,645,895$5,290,374 $5,350,154 $5,410,609 $5,471,748 $5,533,577 $5,596,105 $5,659,340 $5,723,290 $5,787,961$1,621,263 $1,653,688 $1,686,762 $1,720,497 $1,754,907 $1,790,005 $1,825,805 $1,862,321 $1,899,568$3,145,737 $3,208,652 $3,272,825 $3,338,281 $3,405,047 $3,473,148 $3,542,611 $3,613,463 $3,685,732$415,698 $373,012 $380,473 $388,082 $470,844 $428,761 $411,836 $420,072 $428,474
$14,643,883 $14,643,883 $14,643,883 $14,643,883 $14,643,883 $14,643,883 $14,643,883 $14,643,883 $14,643,883$0 $0 $0 $0 $0 $0 $0 $0 $0
$217,119,621 $229,507,037 $232,181,003 $250,075,388 $261,493,256 $274,691,737 $291,312,684 $307,982,611 $327,100,898$0 $0 $0 $0 $0 $0 $0 $0 $0
$6,645,455 $6,819,957 $6,999,274 $7,181,937 $7,370,424 $7,570,752 $7,777,925 $7,989,158 $8,206,661$1,508,489,304 $1,555,791,312 $1,594,230,788 $1,648,718,892 $1,697,822,152 $1,751,108,188 $1,809,217,045 $1,868,175,743 $1,930,853,020
$0 $0 $0 $0 $0 $0 $0 $0 $0$1,508,489,304 $1,555,791,312 $1,594,230,788 $1,648,718,892 $1,697,822,152 $1,751,108,188 $1,809,217,045 $1,868,175,743 $1,930,853,020
$0.0949 $0.0968 $0.0981 $0.1003 $0.1021 $0.1041 $0.1064 $0.1086 $0.1110$0.0863 $0.0880 $0.0891 $0.0912 $0.0928 $0.0947 $0.0967 $0.0988 $0.1009
$44,366,859 $44,527,161 $44,804,342 $44,925,839 $45,126,238 $45,304,664 $45,458,584 $45,627,682 $45,786,716$1,508,489,304 $1,555,791,312 $1,594,230,788 $1,648,718,892 $1,697,822,152 $1,751,108,188 $1,809,217,045 $1,868,175,743 $1,930,853,020$1,552,856,163 $1,600,318,473 $1,639,035,131 $1,693,644,731 $1,742,948,390 $1,796,412,852 $1,854,675,629 $1,913,803,426 $1,976,639,736
$3,433,543,297 $3,541,557,705 $3,643,564,853 $3,762,275,864 $3,878,272,416 $4,000,321,101 $4,129,074,697 $4,260,994,562 $4,398,764,102$3,615,045,547 $3,727,520,440 $3,833,299,267 $3,957,085,239 $4,077,746,123 $4,204,817,418 $4,339,007,558 $4,476,456,403 $4,620,082,911($181,502,250) ($185,962,735) ($189,734,414) ($194,809,375) ($199,473,707) ($204,496,317) ($209,932,861) ($215,461,841) ($221,318,809)
‐5.3% ‐5.3% ‐5.2% ‐5.2% ‐5.1% ‐5.1% ‐5.1% ‐5.1% ‐5.0%
$1,623,482,661 $1,852,989,698 $2,085,170,701 $2,335,246,090 $2,596,739,346 $2,871,431,083 $3,162,743,767 $3,470,726,377 $3,797,827,275

CVAG Community Choice AggregationFinancial ProformaPortfolio RPS
2017 2017Load Data Jan ‐ June July ‐ Dec 2018 2019 2020 2021 2022 2023 2024 2025 2026 2027Customer AccountsDomestic 0 780 94,731 95,801 96,884 97,979 99,086 100,205 101,338 102,483 103,641 104,812Commercial 0 8,577 12,246 12,385 12,525 12,666 12,809 12,954 13,100 13,248 13,398 13,550Industrial 0 0 33 33 34 34 35 35 35 36 36 37Lighting & Traffic Control 0 750 1,152 1,165 1,178 1,191 1,205 1,218 1,232 1,246 1,260 1,274Agricultural 0 9 432 437 442 447 452 457 462 467 473 478Total Customers 0 10,116 108,594 109,821 111,062 112,317 113,586 114,870 116,168 117,481 118,808 120,151
Energy Sales (MWh)Domestic 0 15 971,817 982,799 993,904 1,005,135 1,016,493 1,027,980 1,039,596 1,051,343 1,063,224 1,075,238Commercial 0 16,251 464,157 469,402 474,707 480,071 485,496 490,982 496,530 502,141 507,815 513,553Industrial 0 0 168,487 170,391 172,317 174,264 176,233 178,224 180,238 182,275 184,335 186,418Lighting & Traffic Control 0 3,451 9,302 9,408 9,514 9,621 9,730 9,840 9,951 10,064 10,177 10,292Agricultural 0 5,957 109,632 110,870 112,123 113,390 114,672 115,967 117,278 118,603 119,943 121,299Total Energy Sales (MWh) 0 25,675 1,723,396 1,742,870 1,762,565 1,782,482 1,802,624 1,822,993 1,843,593 1,864,426 1,885,494 1,906,800
2017 2017CCE Operating Costs Jan ‐ June July ‐ Dec 2018 2019 2020 2021 2022 2023 2024 2025 2026 2027Power Supply $0 $1,257,583 $86,127,816 $89,335,669 $93,319,633 $96,590,120 $99,841,575 $103,246,018 $106,729,471 $110,096,494 $113,705,277 $116,946,487Billing & Data Management $0 $106,215 $1,628,639 $1,647,043 $1,665,654 $1,684,476 $1,703,511 $1,722,761 $1,742,228 $1,761,915 $1,781,825 $1,801,959SCE Fees $39,557 $413,653 $918,803 $540,338 $546,443 $552,616 $558,860 $565,173 $571,559 $578,016 $584,546 $591,151Technical Services $620,000 $500,000 $770,000 $867,000 $884,340 $902,027 $920,067 $938,469 $957,238 $976,383 $995,910 $1,015,829Staffing $90,000 $310,000 $1,190,000 $1,238,076 $1,262,838 $1,288,094 $1,313,856 $1,340,133 $1,366,936 $1,394,275 $1,422,160 $1,450,603General & Administrative expenses $90,000 $150,000 $350,000 $306,000 $312,120 $318,362 $344,730 $356,224 $337,849 $344,606 $351,498 $398,528Debt Service (CCE Bonds & Start‐up Costs) $0 $585,441 $4,518,055 $4,518,055 $4,518,055 $4,518,055 $3,932,614 $3,347,173 $3,347,173 $3,347,173 $3,347,173 $3,347,173Contribution to Annual Reserves $0 $2,108,273 $6,373,420 $7,223,951 $7,883,898 $0 $0New Programs $0 $0 $0 $0 $0 $8,411,118 $9,501,817 $10,683,769 $11,271,997 $11,812,299 $12,395,778 $12,869,931Start‐Up Capital $0 ($5,000,000) $0 $0 $0 $0 $0 $0 $0 $0 $0 $0Uncollectibles $4,198 $17,768 $551,968 $567,554 $588,689 $606,273 $620,951 $587,041 $605,057 $622,625 $641,414 $658,575Total Operating Costs $843,755 $448,934 $102,428,702 $106,243,686 $110,981,670 $114,871,143 $118,737,981 $122,786,762 $126,929,507 $130,933,785 $135,225,581 $139,080,235Other Revenues $0 $0 $0 $0 $0 $0 $0 $0 $0 $0 $0 $0Total CCE Revenue Requirement $843,755 $448,934 $102,428,702 $106,243,686 $110,981,670 $114,871,143 $118,737,981 $122,786,762 $126,929,507 $130,933,785 $135,225,581 $139,080,235Average CCE Rate ($/kWh) $0.0503 $0.0594 $0.0610 $0.0630 $0.0644 $0.0659 $0.0674 $0.0688 $0.0702 $0.0717 $0.0729Average SCE Generation Rate ($/kWh) $0.0599 $0.0708 $0.0726 $0.0750 $0.0767 $0.0784 $0.0802 $0.0820 $0.0836 $0.0854 $0.0868Total CCE ChargesSCE Non‐bypassable Charges $0 $230,758 $14,890,359 $15,058,620 $15,228,783 $15,400,868 $15,574,898 $5,892,314 $5,958,897 $6,026,232 $6,094,329 $6,163,195CCE Revenue Requirement $843,755 $448,934 $102,428,702 $106,243,686 $110,981,670 $114,871,143 $118,737,981 $122,786,762 $126,929,507 $130,933,785 $135,225,581 $139,080,235Total CCE Generation Revenue Requirement $843,755 $679,692 $117,319,061 $121,302,307 $126,210,453 $130,272,010 $134,312,879 $128,679,075 $132,888,404 $136,960,018 $141,319,910 $145,243,430
Bundled SCE Revenues $0 $3,832,608 $316,552,316 $327,229,345 $339,198,608 $350,357,259 $361,694,778 $373,461,195 $385,558,469 $397,716,797 $410,450,428 $422,904,017Total CCE Customer Bill Revenues (Power Supply and Delivery) $0 $3,678,273 $302,612,480 $312,625,791 $323,756,237 $334,238,413 $344,904,494 $355,965,554 $367,340,317 $378,803,261 $390,787,503 $402,575,738 Savings $0 $154,335 $13,939,836 $14,603,554 $15,442,371 $16,118,847 $16,790,284 $17,495,641 $18,218,152 $18,913,536 $19,662,925 $20,328,278 Percent Savings 4.0% 4.4% 4.5% 4.6% 4.6% 4.6% 4.7% 4.7% 4.8% 4.8% 4.8%
Cumulative Reserves $2,108,273 $8,481,693 $15,705,644 $23,589,542 $32,000,660 $41,502,478 $52,186,247 $63,458,244 $75,270,543 $87,666,321 $100,536,251Reserve Target $27,736,410

CVAG Community Choice AggregationFinancial ProformaPortfolio RPS
Load DataCustomer AccountsDomesticCommercialIndustrialLighting & Traffic ControlAgriculturalTotal Customers
Energy Sales (MWh)DomesticCommercialIndustrialLighting & Traffic ControlAgriculturalTotal Energy Sales (MWh)
CCE Operating CostsPower SupplyBilling & Data ManagementSCE FeesTechnical ServicesStaffingGeneral & Administrative expensesDebt Service (CCE Bonds & Start‐up Costs)Contribution to Annual ReservesNew ProgramsStart‐Up CapitalUncollectiblesTotal Operating CostsOther RevenuesTotal CCE Revenue RequirementAverage CCE Rate ($/kWh)Average SCE Generation Rate ($/kWh)Total CCE ChargesSCE Non‐bypassable ChargesCCE Revenue RequirementTotal CCE Generation Revenue Requirement
Bundled SCE RevenuesTotal CCE Customer Bill Revenues (Power Supply and Delivery) Savings Percent Savings
Cumulative ReservesReserve Target
2028 2029 2030 2031 2032 2033 2034 2035 2036
105,996 107,194 108,405 109,630 110,869 112,122 113,389 114,670 115,96613,703 13,857 14,014 14,172 14,333 14,495 14,658 14,824 14,991
37 37 38 38 39 39 40 40 01,289 1,303 1,318 1,333 1,348 1,363 1,379 1,394 0483 489 494 500 506 511 517 523 0
121,508 122,881 124,270 125,674 127,094 128,530 129,983 131,452 130,958
1,087,388 1,099,676 1,112,102 1,124,669 1,137,378 1,150,230 1,163,227 1,176,372 1,189,665519,356 525,225 531,160 537,162 543,232 549,371 555,578 561,857 568,205188,524 190,654 192,809 194,988 197,191 199,419 201,673 203,952 206,25610,409 10,526 10,645 10,766 10,887 11,010 11,135 11,261 11,388
122,669 124,055 125,457 126,875 128,309 129,758 131,225 132,708 134,2071,928,347 1,950,137 1,972,173 1,994,459 2,016,996 2,039,788 2,062,838 2,086,148 2,109,722
2028 2029 2030 2031 2032 2033 2034 2035 2036$120,715,713 $124,641,715 $127,608,173 $131,633,023 $135,819,990 $140,182,348 $144,729,275 $149,470,270 $154,412,499
$1,822,321 $1,842,913 $1,863,738 $1,884,799 $1,906,097 $1,927,636 $1,949,418 $1,971,446 $1,993,724$597,829 $604,584 $611,414 $618,322 $625,308 $632,373 $639,517 $646,742 $654,049
$1,036,145 $1,056,868 $1,078,006 $1,099,566 $1,121,557 $1,143,988 $1,166,868 $1,190,205 $1,214,009$1,479,615 $1,509,208 $1,539,392 $1,570,180 $1,601,583 $1,633,615 $1,666,287 $1,699,613 $1,733,605$415,698 $373,012 $380,473 $388,082 $415,844 $428,761 $411,836 $420,072 $428,474
$3,347,173 $3,347,173 $3,347,173 $3,347,173 $3,347,173 $3,347,173 $3,347,173 $3,347,173 $3,347,173
$13,470,686 $14,158,610 $14,618,002 $15,270,918 $15,932,080 $16,639,080 $17,408,657 $18,187,257 $19,001,297$0 $0 $0 $0 $0 $0 $0 $0 $0
$677,658 $697,809 $713,423 $734,340 $756,180 $778,833 $802,271 $826,816 $852,380$143,562,840 $148,231,892 $151,759,793 $156,546,402 $161,525,811 $166,713,806 $172,121,302 $177,759,596 $183,637,211
$0 $0 $0 $0 $0 $0 $0 $0 $0$143,562,840 $148,231,892 $151,759,793 $156,546,402 $161,525,811 $166,713,806 $172,121,302 $177,759,596 $183,637,211
$0.0744 $0.0760 $0.0770 $0.0785 $0.0801 $0.0817 $0.0834 $0.0852 $0.0870$0.0886 $0.0905 $0.0916 $0.0934 $0.0953 $0.0973 $0.0993 $0.1014 $0.1036
$6,117,154 $6,186,278 $6,256,183 $6,326,877 $6,398,371 $6,470,673 $6,543,791 $6,617,736 $6,692,517$143,562,840 $148,231,892 $151,759,793 $156,546,402 $161,525,811 $166,713,806 $172,121,302 $177,759,596 $183,637,211$149,679,994 $154,418,170 $158,015,976 $162,873,279 $167,924,183 $173,184,479 $178,665,093 $184,377,333 $190,329,728
$436,353,110 $450,279,924 $463,112,047 $477,714,771 $492,827,740 $508,478,593 $524,689,456 $541,483,196 $558,879,668$415,124,961 $428,231,555 $440,461,602 $454,223,286 $468,459,290 $483,194,255 $498,448,238 $514,241,961 $530,593,669$21,228,149 $22,048,369 $22,650,445 $23,491,485 $24,368,450 $25,284,338 $26,241,218 $27,241,235 $28,286,000
4.9% 4.9% 4.9% 4.9% 4.9% 5.0% 5.0% 5.0% 5.1%
$114,006,937 $128,165,547 $142,783,549 $158,054,467 $173,986,546 $190,625,626 $208,034,283 $226,221,540 $245,222,837

CVAG Community Choice AggregationFinancial ProformaPortfolio ‐50% Renewable
2017 2017Load Data Jan ‐ June July ‐ Dec 2018 2019 2020 2021 2022 2023 2024 2025 2026 2027Customer AccountsDomestic 0 780 94,731 95,801 96,884 97,979 99,086 100,205 101,338 102,483 103,641 104,812Commercial 0 8,577 12,246 12,385 12,525 12,666 12,809 12,954 13,100 13,248 13,398 13,550Industrial 0 0 33 33 34 34 35 35 35 36 36 37Lighting & Traffic Control 0 750 1,152 1,165 1,178 1,191 1,205 1,218 1,232 1,246 1,260 1,274Agricultural 0 9 432 437 442 447 452 457 462 467 473 478Total Customers 0 10,116 108,594 109,821 111,062 112,317 113,586 114,870 116,168 117,481 118,808 120,151
Energy Sales (MWh)Domestic 0 15 971,817 982,799 993,904 1,005,135 1,016,493 1,027,980 1,039,596 1,051,343 1,063,224 1,075,238Commercial 0 16,251 464,157 469,402 474,707 480,071 485,496 490,982 496,530 502,141 507,815 513,553Industrial 0 0 168,487 170,391 172,317 174,264 176,233 178,224 180,238 182,275 184,335 186,418Lighting & Traffic Control 0 3,451 9,302 9,408 9,514 9,621 9,730 9,840 9,951 10,064 10,177 10,292Agricultural 0 5,957 109,632 110,870 112,123 113,390 114,672 115,967 117,278 118,603 119,943 121,299Total Energy Sales (MWh) 0 25,675 1,723,396 1,742,870 1,762,565 1,782,482 1,802,624 1,822,993 1,843,593 1,864,426 1,885,494 1,906,800
2017 2017CCE Operating Costs Jan ‐ June July ‐ Dec 2018 2019 2020 2021 2022 2023 2024 2025 2026 2027Power Supply $0 $1,330,076 $89,872,073 $92,484,855 $95,103,582 $97,924,199 $100,729,211 $103,611,908 $106,609,724 $109,653,650 $112,870,312 $116,216,850Billing & Data Management $0 $106,215 $1,628,639 $1,647,043 $1,665,654 $1,684,476 $1,703,511 $1,722,761 $1,742,228 $1,761,915 $1,781,825 $1,801,959SCE Fees $39,557 $413,653 $918,803 $540,338 $546,443 $552,616 $558,860 $565,173 $571,559 $578,016 $584,546 $591,151Technical Services $620,000 $500,000 $770,000 $867,000 $884,340 $902,027 $920,067 $938,469 $957,238 $976,383 $995,910 $1,015,829Staffing $90,000 $310,000 $1,190,000 $1,238,076 $1,262,838 $1,288,094 $1,313,856 $1,340,133 $1,366,936 $1,394,275 $1,422,160 $1,450,603General & Administrative expenses $90,000 $150,000 $350,000 $306,000 $312,120 $318,362 $344,730 $356,224 $337,849 $344,606 $351,498 $398,528Debt Service (CCE Bonds & Start‐up Costs) $0 $585,441 $4,518,055 $4,518,055 $4,518,055 $4,518,055 $3,932,614 $3,347,173 $3,347,173 $3,347,173 $3,347,173 $3,347,173Contribution to Annual Reserves $0 $2,127,752 $9,926,777 $11,647,854 $14,018,292 $0 $0New Programs $0 $0 $0 $0 $0 $15,275,450 $17,091,028 $19,086,533 $20,458,736 $21,609,770 $22,893,888 $23,537,518Start‐Up Capital $0 ($5,000,000) $0 $0 $0 $0 $0 $0 $0 $0 $0 $0Uncollectibles $4,198 $18,131 $570,690 $583,300 $597,609 $612,943 $625,389 $588,871 $604,458 $620,411 $637,239 $654,926Total Operating Costs $843,755 $541,269 $109,745,038 $113,832,521 $118,908,932 $123,076,224 $127,219,265 $131,557,245 $135,995,901 $140,286,199 $144,884,551 $149,014,537Other Revenues $0 $0 $0 $0 $0 $0 $0 $0 $0 $0 $0 $0Total CCE Revenue Requirement $843,755 $541,269 $109,745,038 $113,832,521 $118,908,932 $123,076,224 $127,219,265 $131,557,245 $135,995,901 $140,286,199 $144,884,551 $149,014,537Average CCE Rate ($/kWh) $0.0539 $0.0637 $0.0653 $0.0675 $0.0690 $0.0706 $0.0722 $0.0738 $0.0752 $0.0768 $0.0781Average SCE Generation Rate ($/kWh) $0.0599 $0.0708 $0.0726 $0.0750 $0.0767 $0.0784 $0.0802 $0.0820 $0.0836 $0.0854 $0.0868Total CCE ChargesSCE Non‐bypassable Charges $0 $230,758 $14,890,359 $15,058,620 $15,228,783 $15,400,868 $15,574,898 $5,892,314 $5,958,897 $6,026,232 $6,094,329 $6,163,195CCE Revenue Requirement $843,755 $541,269 $109,745,038 $113,832,521 $118,908,932 $123,076,224 $127,219,265 $131,557,245 $135,995,901 $140,286,199 $144,884,551 $149,014,537Total CCE Generation Revenue Requirement $843,755 $772,027 $124,635,397 $128,891,141 $134,137,715 $138,477,092 $142,794,163 $137,449,558 $141,954,798 $146,312,431 $150,978,880 $155,177,732
Bundled SCE Revenues $0 $3,832,608 $316,552,316 $327,229,345 $339,198,608 $350,357,259 $361,694,778 $373,461,195 $385,558,469 $397,716,797 $410,450,428 $422,904,017Total CCE Customer Bill Revenues (Power Supply and Delivery) $0 $3,770,608 $309,928,815 $320,214,626 $331,683,499 $342,443,494 $353,385,779 $364,736,037 $376,406,710 $388,155,674 $400,446,473 $412,510,041 Savings $0 $62,000 $6,623,500 $7,014,720 $7,515,109 $7,913,765 $8,308,999 $8,725,158 $9,151,759 $9,561,123 $10,003,955 $10,393,976 Percent Savings 1.6% 2.1% 2.1% 2.2% 2.3% 2.3% 2.3% 2.4% 2.4% 2.4% 2.5%
Cumulative Reserves $2,127,752 $12,054,530 $23,702,384 $37,720,676 $52,996,126 $70,087,154 $89,173,687 $109,632,423 $131,242,193 $154,136,081 $177,673,598Reserve Target $28,677,155

CVAG Community Choice AggregationFinancial ProformaPortfolio ‐50% Renewable
Load DataCustomer AccountsDomesticCommercialIndustrialLighting & Traffic ControlAgriculturalTotal Customers
Energy Sales (MWh)DomesticCommercialIndustrialLighting & Traffic ControlAgriculturalTotal Energy Sales (MWh)
CCE Operating CostsPower SupplyBilling & Data ManagementSCE FeesTechnical ServicesStaffingGeneral & Administrative expensesDebt Service (CCE Bonds & Start‐up Costs)Contribution to Annual ReservesNew ProgramsStart‐Up CapitalUncollectiblesTotal Operating CostsOther RevenuesTotal CCE Revenue RequirementAverage CCE Rate ($/kWh)Average SCE Generation Rate ($/kWh)Total CCE ChargesSCE Non‐bypassable ChargesCCE Revenue RequirementTotal CCE Generation Revenue Requirement
Bundled SCE RevenuesTotal CCE Customer Bill Revenues (Power Supply and Delivery) Savings Percent Savings
Cumulative ReservesReserve Target
2028 2029 2030 2031 2032 2033 2034 2035 2036
105,996 107,194 108,405 109,630 110,869 112,122 113,389 114,670 115,96613,703 13,857 14,014 14,172 14,333 14,495 14,658 14,824 14,991
37 37 38 38 39 39 40 40 01,289 1,303 1,318 1,333 1,348 1,363 1,379 1,394 0483 489 494 500 506 511 517 523 0
121,508 122,881 124,270 125,674 127,094 128,530 129,983 131,452 130,958
1,087,388 1,099,676 1,112,102 1,124,669 1,137,378 1,150,230 1,163,227 1,176,372 1,189,665519,356 525,225 531,160 537,162 543,232 549,371 555,578 561,857 568,205188,524 190,654 192,809 194,988 197,191 199,419 201,673 203,952 206,25610,409 10,526 10,645 10,766 10,887 11,010 11,135 11,261 11,388
122,669 124,055 125,457 126,875 128,309 129,758 131,225 132,708 134,2071,928,347 1,950,137 1,972,173 1,994,459 2,016,996 2,039,788 2,062,838 2,086,148 2,109,722
2028 2029 2030 2031 2032 2033 2034 2035 2036$119,761,096 $123,386,432 $127,608,173 $131,633,023 $135,819,990 $140,182,348 $144,729,275 $149,470,270 $154,412,499
$1,822,321 $1,842,913 $1,863,738 $1,884,799 $1,906,097 $1,927,636 $1,949,418 $1,971,446 $1,993,724$597,829 $604,584 $611,414 $618,322 $625,308 $632,373 $639,517 $646,742 $654,049
$1,036,145 $1,056,868 $1,078,006 $1,099,566 $1,121,557 $1,143,988 $1,166,868 $1,190,205 $1,214,009$1,479,615 $1,509,208 $1,539,392 $1,570,180 $1,601,583 $1,633,615 $1,666,287 $1,699,613 $1,733,605$415,698 $373,012 $380,473 $388,082 $415,844 $428,761 $411,836 $420,072 $428,474
$3,347,173 $3,347,173 $3,347,173 $3,347,173 $3,347,173 $3,347,173 $3,347,173 $3,347,173 $3,347,173
$24,684,565 $26,008,162 $25,457,987 $26,452,804 $27,469,638 $28,547,209 $29,703,036 $30,884,371 $32,118,240$0 $0 $0 $0 $0 $0 $0 $0 $0
$672,885 $691,532 $713,423 $734,340 $756,180 $778,833 $802,271 $826,816 $852,380$153,817,329 $158,819,885 $162,599,779 $167,728,288 $173,063,369 $178,621,935 $184,415,680 $190,456,711 $196,754,155
$0 $0 $0 $0 $0 $0 $0 $0 $0$153,817,329 $158,819,885 $162,599,779 $167,728,288 $173,063,369 $178,621,935 $184,415,680 $190,456,711 $196,754,155
$0.0798 $0.0814 $0.0824 $0.0841 $0.0858 $0.0876 $0.0894 $0.0913 $0.0933$0.0886 $0.0905 $0.0916 $0.0934 $0.0953 $0.0973 $0.0993 $0.1014 $0.1036
$6,117,154 $6,186,278 $6,256,183 $6,326,877 $6,398,371 $6,470,673 $6,543,791 $6,617,736 $6,692,517$153,817,329 $158,819,885 $162,599,779 $167,728,288 $173,063,369 $178,621,935 $184,415,680 $190,456,711 $196,754,155$159,934,482 $165,006,162 $168,855,961 $174,055,165 $179,461,741 $185,092,608 $190,959,472 $197,074,447 $203,446,672
$436,353,110 $450,279,924 $463,112,047 $477,714,771 $492,827,740 $508,478,593 $524,689,456 $541,483,196 $558,879,668$425,379,450 $438,819,548 $451,301,587 $465,405,172 $479,996,848 $495,102,384 $510,742,617 $526,939,075 $543,710,612$10,973,660 $11,460,376 $11,810,459 $12,309,599 $12,830,892 $13,376,209 $13,946,840 $14,544,121 $15,169,056
2.5% 2.5% 2.6% 2.6% 2.6% 2.6% 2.7% 2.7% 2.7%
$202,358,163 $228,366,325 $253,824,312 $280,277,116 $307,746,754 $336,293,962 $365,996,998 $396,881,369 $428,999,609

CVAG Community Choice AggregationFinancial ProformaPortfolio ‐100% Renewable
2017 2017Load Data Jan ‐ June July ‐ Dec 2018 2019 2020 2021 2022 2023 2024 2025 2026 2027Customer AccountsDomestic 0 780 94,731 95,801 96,884 97,979 99,086 100,205 101,338 102,483 103,641 104,812Commercial 0 8,577 12,246 12,385 12,525 12,666 12,809 12,954 13,100 13,248 13,398 13,550Industrial 0 0 33 33 34 34 35 35 35 36 36 37Lighting & Traffic Control 0 750 1,152 1,165 1,178 1,191 1,205 1,218 1,232 1,246 1,260 1,274Agricultural 0 9 432 437 442 447 452 457 462 467 473 478Total Customers 0 10,116 108,594 109,821 111,062 112,317 113,586 114,870 116,168 117,481 118,808 120,151
Energy Sales (MWh)Domestic 0 15 971,817 982,799 993,904 1,005,135 1,016,493 1,027,980 1,039,596 1,051,343 1,063,224 1,075,238Commercial 0 16,251 464,157 469,402 474,707 480,071 485,496 490,982 496,530 502,141 507,815 513,553Industrial 0 0 168,487 170,391 172,317 174,264 176,233 178,224 180,238 182,275 184,335 186,418Lighting & Traffic Control 0 3,451 9,302 9,408 9,514 9,621 9,730 9,840 9,951 10,064 10,177 10,292Agricultural 0 5,957 109,632 110,870 112,123 113,390 114,672 115,967 117,278 118,603 119,943 121,299Total Energy Sales (MWh) 0 25,675 1,723,396 1,742,870 1,762,565 1,782,482 1,802,624 1,822,993 1,843,593 1,864,426 1,885,494 1,906,800
2017 2017CCE Operating Costs Jan ‐ June July ‐ Dec 2018 2019 2020 2021 2022 2023 2024 2025 2026 2027Power Supply $0 $1,774,143 $117,097,797 $120,159,004 $123,200,139 $126,432,728 $129,674,380 $133,037,090 $136,498,693 $140,045,903 $143,804,155 $147,684,617Billing & Data Management $0 $106,215 $1,628,639 $1,647,043 $1,665,654 $1,684,476 $1,703,511 $1,722,761 $1,742,228 $1,761,915 $1,781,825 $1,801,959SCE Fees $39,557 $413,653 $918,803 $540,338 $546,443 $552,616 $558,860 $565,173 $571,559 $578,016 $584,546 $591,151Technical Services $620,000 $500,000 $770,000 $867,000 $884,340 $902,027 $920,067 $938,469 $957,238 $976,383 $995,910 $1,015,829Staffing $90,000 $310,000 $1,190,000 $1,238,076 $1,262,838 $1,288,094 $1,313,856 $1,340,133 $1,366,936 $1,394,275 $1,422,160 $1,450,603General & Administrative expenses $90,000 $150,000 $350,000 $306,000 $312,120 $318,362 $344,730 $356,224 $337,849 $344,606 $351,498 $398,528Debt Service (CCE Bonds & Start‐up Costs) $0 $585,441 $4,518,055 $4,518,055 $4,518,055 $4,518,055 $3,932,614 $3,347,173 $3,347,173 $3,347,173 $3,347,173 $3,347,173Contribution to Annual Reserves $0 $2,004,637 $8,172,100 $10,396,256 $13,526,669 $0 $0New Programs $0 $0 $0 $0 $0 $15,342,165 $17,685,628 $20,210,915 $22,152,700 $23,799,002 $25,611,771 $26,682,471Start‐Up Capital $0 ($5,000,000) $0 $0 $0 $0 $0 $0 $0 $0 $0 $0Uncollectibles $4,198 $20,351 $706,818 $721,671 $738,092 $755,486 $770,115 $735,997 $753,903 $772,373 $791,908 $812,265Total Operating Costs $843,755 $864,441 $135,352,214 $140,393,443 $146,654,350 $151,794,010 $156,903,761 $162,253,935 $167,728,278 $173,019,645 $178,690,946 $183,784,596Other Revenues $0 $0 $0 $0 $0 $0 $0 $0 $0 $0 $0 $0Total CCE Revenue Requirement $843,755 $864,441 $135,352,214 $140,393,443 $146,654,350 $151,794,010 $156,903,761 $162,253,935 $167,728,278 $173,019,645 $178,690,946 $183,784,596Average CCE Rate ($/kWh) $0.0665 $0.0785 $0.0806 $0.0832 $0.0852 $0.0870 $0.0890 $0.0910 $0.0928 $0.0948 $0.0964Average SCE Generation Rate ($/kWh) $0.0599 $0.0708 $0.0726 $0.0750 $0.0767 $0.0784 $0.0802 $0.0820 $0.0836 $0.0854 $0.0868Total CCE ChargesSCE Non‐bypassable Charges $0 $230,758 $14,890,359 $15,058,620 $15,228,783 $15,400,868 $15,574,898 $5,892,314 $5,958,897 $6,026,232 $6,094,329 $6,163,195CCE Revenue Requirement $843,755 $864,441 $135,352,214 $140,393,443 $146,654,350 $151,794,010 $156,903,761 $162,253,935 $167,728,278 $173,019,645 $178,690,946 $183,784,596Total CCE Generation Revenue Requirement $843,755 $1,095,199 $150,242,573 $155,452,063 $161,883,133 $167,194,878 $172,478,658 $168,146,249 $173,687,175 $179,045,877 $184,785,275 $189,947,791
Bundled SCE Revenues $0 $3,832,608 $316,552,316 $327,229,345 $339,198,608 $350,357,259 $361,694,778 $373,461,195 $385,558,469 $397,716,797 $410,450,428 $422,904,017Total CCE Customer Bill Revenues (Power Supply and Delivery) $0 $4,093,781 $335,535,991 $346,775,547 $359,428,917 $371,161,280 $383,070,274 $395,432,727 $408,139,087 $420,889,121 $434,252,869 $447,280,099 Savings $0 ($261,173) ($18,983,675) ($19,546,202) ($20,230,309) ($20,804,021) ($21,375,496) ($21,971,533) ($22,580,618) ($23,172,323) ($23,802,441) ($24,376,083) Percent Savings ‐6.8% ‐6.0% ‐6.0% ‐6.0% ‐5.9% ‐5.9% ‐5.9% ‐5.9% ‐5.8% ‐5.8% ‐5.8%
Cumulative Reserves $2,004,637 $10,176,737 $20,572,993 $34,099,662 $49,441,827 $67,127,455 $87,338,371 $109,491,071 $133,290,073 $158,901,844 $185,584,315Reserve Target $35,517,618

CVAG Community Choice AggregationFinancial ProformaPortfolio ‐100% Renewable
Load DataCustomer AccountsDomesticCommercialIndustrialLighting & Traffic ControlAgriculturalTotal Customers
Energy Sales (MWh)DomesticCommercialIndustrialLighting & Traffic ControlAgriculturalTotal Energy Sales (MWh)
CCE Operating CostsPower SupplyBilling & Data ManagementSCE FeesTechnical ServicesStaffingGeneral & Administrative expensesDebt Service (CCE Bonds & Start‐up Costs)Contribution to Annual ReservesNew ProgramsStart‐Up CapitalUncollectiblesTotal Operating CostsOther RevenuesTotal CCE Revenue RequirementAverage CCE Rate ($/kWh)Average SCE Generation Rate ($/kWh)Total CCE ChargesSCE Non‐bypassable ChargesCCE Revenue RequirementTotal CCE Generation Revenue Requirement
Bundled SCE RevenuesTotal CCE Customer Bill Revenues (Power Supply and Delivery) Savings Percent Savings
Cumulative ReservesReserve Target
2028 2029 2030 2031 2032 2033 2034 2035 2036
105,996 107,194 108,405 109,630 110,869 112,122 113,389 114,670 115,96613,703 13,857 14,014 14,172 14,333 14,495 14,658 14,824 14,991
37 37 38 38 39 39 40 40 01,289 1,303 1,318 1,333 1,348 1,363 1,379 1,394 0483 489 494 500 506 511 517 523 0
121,508 122,881 124,270 125,674 127,094 128,530 129,983 131,452 130,958
1,087,388 1,099,676 1,112,102 1,124,669 1,137,378 1,150,230 1,163,227 1,176,372 1,189,665519,356 525,225 531,160 537,162 543,232 549,371 555,578 561,857 568,205188,524 190,654 192,809 194,988 197,191 199,419 201,673 203,952 206,25610,409 10,526 10,645 10,766 10,887 11,010 11,135 11,261 11,388
122,669 124,055 125,457 126,875 128,309 129,758 131,225 132,708 134,2071,928,347 1,950,137 1,972,173 1,994,459 2,016,996 2,039,788 2,062,838 2,086,148 2,109,722
2028 2029 2030 2031 2032 2033 2034 2035 2036$151,626,153 $155,830,800 $160,130,352 $164,644,719 $169,237,300 $174,146,086 $179,228,310 $184,428,157 $189,686,298
$1,822,321 $1,842,913 $1,863,738 $1,884,799 $1,906,097 $1,927,636 $1,949,418 $1,971,446 $1,993,724$597,829 $604,584 $611,414 $618,322 $625,308 $632,373 $639,517 $646,742 $654,049
$1,036,145 $1,056,868 $1,078,006 $1,099,566 $1,121,557 $1,143,988 $1,166,868 $1,190,205 $1,214,009$1,479,615 $1,509,208 $1,539,392 $1,570,180 $1,601,583 $1,633,615 $1,666,287 $1,699,613 $1,733,605$415,698 $373,012 $380,473 $388,082 $415,844 $428,761 $411,836 $420,072 $428,474
$3,347,173 $3,347,173 $3,347,173 $3,347,173 $3,347,173 $3,347,173 $3,347,173 $3,347,173 $3,347,173
$28,550,893 $30,459,545 $30,713,146 $32,412,649 $34,266,695 $36,092,103 $38,061,831 $40,191,595 $42,577,375$0 $0 $0 $0 $0 $0 $0 $0 $0
$832,210 $853,754 $876,034 $899,399 $923,266 $948,652 $974,766 $1,001,606 $1,028,749$189,708,039 $195,877,858 $200,539,727 $206,864,888 $213,444,822 $220,300,386 $227,446,006 $234,896,610 $242,663,458
$0 $0 $0 $0 $0 $0 $0 $0 $0$189,708,039 $195,877,858 $200,539,727 $206,864,888 $213,444,822 $220,300,386 $227,446,006 $234,896,610 $242,663,458
$0.0984 $0.1004 $0.1017 $0.1037 $0.1058 $0.1080 $0.1103 $0.1126 $0.1150$0.0886 $0.0905 $0.0916 $0.0934 $0.0953 $0.0973 $0.0993 $0.1014 $0.1036
$6,117,154 $6,186,278 $6,256,183 $6,326,877 $6,398,371 $6,470,673 $6,543,791 $6,617,736 $6,692,517$189,708,039 $195,877,858 $200,539,727 $206,864,888 $213,444,822 $220,300,386 $227,446,006 $234,896,610 $242,663,458$195,825,192 $202,064,136 $206,795,910 $213,191,765 $219,843,193 $226,771,059 $233,989,797 $241,514,346 $249,355,974
$436,353,110 $450,279,924 $463,112,047 $477,714,771 $492,827,740 $508,478,593 $524,689,456 $541,483,196 $558,879,668$461,270,160 $475,877,521 $489,241,535 $504,541,772 $520,378,300 $536,780,836 $553,772,942 $571,378,974 $589,619,915($24,917,050) ($25,597,597) ($26,129,489) ($26,827,002) ($27,550,561) ($28,302,243) ($29,083,486) ($29,895,779) ($30,740,247)
‐5.7% ‐5.7% ‐5.6% ‐5.6% ‐5.6% ‐5.6% ‐5.5% ‐5.5% ‐5.5%
$214,135,207 $244,594,752 $275,307,898 $307,720,547 $341,987,242 $378,079,345 $416,141,176 $456,332,771 $498,910,146
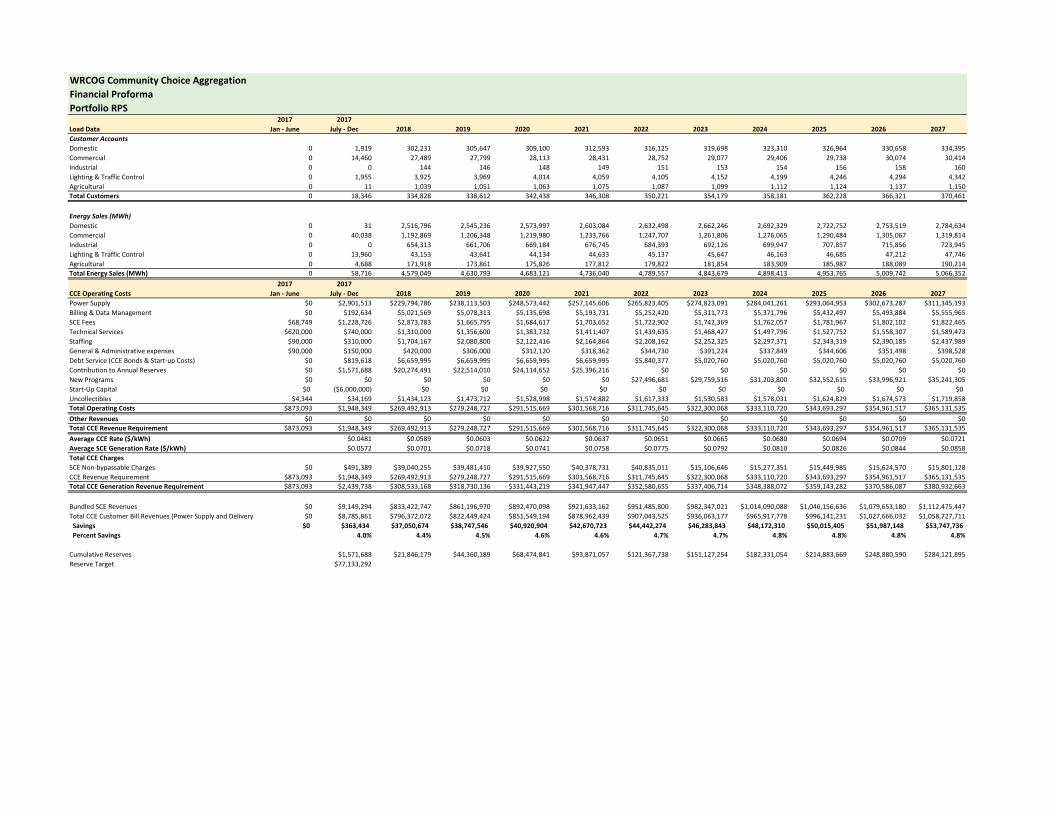
WRCOG Community Choice AggregationFinancial ProformaPortfolio RPS
2017 2017Load Data Jan ‐ June July ‐ Dec 2018 2019 2020 2021 2022 2023 2024 2025 2026 2027Customer AccountsDomestic 0 1,919 302,231 305,647 309,100 312,593 316,125 319,698 323,310 326,964 330,658 334,395Commercial 0 14,460 27,489 27,799 28,113 28,431 28,752 29,077 29,406 29,738 30,074 30,414Industrial 0 0 144 146 148 149 151 153 154 156 158 160Lighting & Traffic Control 0 1,955 3,925 3,969 4,014 4,059 4,105 4,152 4,199 4,246 4,294 4,342Agricultural 0 11 1,039 1,051 1,063 1,075 1,087 1,099 1,112 1,124 1,137 1,150Total Customers 0 18,346 334,828 338,612 342,438 346,308 350,221 354,179 358,181 362,228 366,321 370,461
Energy Sales (MWh)Domestic 0 31 2,516,796 2,545,236 2,573,997 2,603,084 2,632,498 2,662,246 2,692,329 2,722,752 2,753,519 2,784,634Commercial 0 40,038 1,192,869 1,206,348 1,219,980 1,233,766 1,247,707 1,261,806 1,276,065 1,290,484 1,305,067 1,319,814Industrial 0 0 654,313 661,706 669,184 676,745 684,393 692,126 699,947 707,857 715,856 723,945Lighting & Traffic Control 0 13,960 43,153 43,641 44,134 44,633 45,137 45,647 46,163 46,685 47,212 47,746Agricultural 0 4,688 171,918 173,861 175,826 177,812 179,822 181,854 183,909 185,987 188,089 190,214Total Energy Sales (MWh) 0 58,716 4,579,049 4,630,793 4,683,121 4,736,040 4,789,557 4,843,679 4,898,413 4,953,765 5,009,742 5,066,352
2017 2017CCE Operating Costs Jan ‐ June July ‐ Dec 2018 2019 2020 2021 2022 2023 2024 2025 2026 2027Power Supply $0 $2,901,513 $229,794,786 $238,113,503 $248,573,442 $257,145,606 $265,823,405 $274,823,091 $284,041,261 $293,064,953 $302,673,287 $311,345,193Billing & Data Management $0 $192,634 $5,021,569 $5,078,313 $5,135,698 $5,193,731 $5,252,420 $5,311,773 $5,371,796 $5,432,497 $5,493,884 $5,555,965SCE Fees $68,749 $1,228,726 $2,873,783 $1,665,795 $1,684,617 $1,703,652 $1,722,902 $1,742,369 $1,762,057 $1,781,967 $1,802,102 $1,822,465Technical Services $620,000 $740,000 $1,310,000 $1,356,600 $1,383,732 $1,411,407 $1,439,635 $1,468,427 $1,497,796 $1,527,752 $1,558,307 $1,589,473Staffing $90,000 $310,000 $1,704,167 $2,080,800 $2,122,416 $2,164,864 $2,208,162 $2,252,325 $2,297,371 $2,343,319 $2,390,185 $2,437,989General & Administrative expenses $90,000 $150,000 $420,000 $306,000 $312,120 $318,362 $344,730 $391,224 $337,849 $344,606 $351,498 $398,528Debt Service (CCE Bonds & Start‐up Costs) $0 $819,618 $6,659,995 $6,659,995 $6,659,995 $6,659,995 $5,840,377 $5,020,760 $5,020,760 $5,020,760 $5,020,760 $5,020,760Contribution to Annual Reserves $0 $1,571,688 $20,274,491 $22,514,010 $24,114,652 $25,396,216 $0 $0 $0 $0 $0 $0New Programs $0 $0 $0 $0 $0 $0 $27,496,681 $29,759,516 $31,203,800 $32,552,615 $33,996,921 $35,241,305Start‐Up Capital $0 ($6,000,000) $0 $0 $0 $0 $0 $0 $0 $0 $0 $0Uncollectibles $4,344 $34,169 $1,434,123 $1,473,712 $1,528,998 $1,574,882 $1,617,333 $1,530,583 $1,578,031 $1,624,829 $1,674,573 $1,719,858Total Operating Costs $873,093 $1,948,349 $269,492,913 $279,248,727 $291,515,669 $301,568,716 $311,745,645 $322,300,068 $333,110,720 $343,693,297 $354,961,517 $365,131,535Other Revenues $0 $0 $0 $0 $0 $0 $0 $0 $0 $0 $0 $0Total CCE Revenue Requirement $873,093 $1,948,349 $269,492,913 $279,248,727 $291,515,669 $301,568,716 $311,745,645 $322,300,068 $333,110,720 $343,693,297 $354,961,517 $365,131,535Average CCE Rate ($/kWh) $0.0481 $0.0589 $0.0603 $0.0622 $0.0637 $0.0651 $0.0665 $0.0680 $0.0694 $0.0709 $0.0721Average SCE Generation Rate ($/kWh) $0.0572 $0.0701 $0.0718 $0.0741 $0.0758 $0.0775 $0.0792 $0.0810 $0.0826 $0.0844 $0.0858Total CCE ChargesSCE Non‐bypassable Charges $0 $491,389 $39,040,255 $39,481,410 $39,927,550 $40,378,731 $40,835,011 $15,106,646 $15,277,351 $15,449,985 $15,624,570 $15,801,128CCE Revenue Requirement $873,093 $1,948,349 $269,492,913 $279,248,727 $291,515,669 $301,568,716 $311,745,645 $322,300,068 $333,110,720 $343,693,297 $354,961,517 $365,131,535Total CCE Generation Revenue Requirement $873,093 $2,439,738 $308,533,168 $318,730,136 $331,443,219 $341,947,447 $352,580,655 $337,406,714 $348,388,072 $359,143,282 $370,586,087 $380,932,663
Bundled SCE Revenues $0 $9,149,294 $833,422,747 $861,196,970 $892,470,098 $921,633,162 $951,485,800 $982,347,021 $1,014,090,088 $1,046,156,636 $1,079,653,180 $1,112,475,447Total CCE Customer Bill Revenues (Power Supply and Delivery) $0 $8,785,861 $796,372,072 $822,449,424 $851,549,194 $878,962,439 $907,043,525 $936,063,177 $965,917,778 $996,141,231 $1,027,666,032 $1,058,727,711 Savings $0 $363,434 $37,050,674 $38,747,546 $40,920,904 $42,670,723 $44,442,274 $46,283,843 $48,172,310 $50,015,405 $51,987,148 $53,747,736 Percent Savings 4.0% 4.4% 4.5% 4.6% 4.6% 4.7% 4.7% 4.8% 4.8% 4.8% 4.8%
Cumulative Reserves $1,571,688 $21,846,179 $44,360,189 $68,474,841 $93,871,057 $121,367,738 $151,127,254 $182,331,054 $214,883,669 $248,880,590 $284,121,895Reserve Target $77,133,292
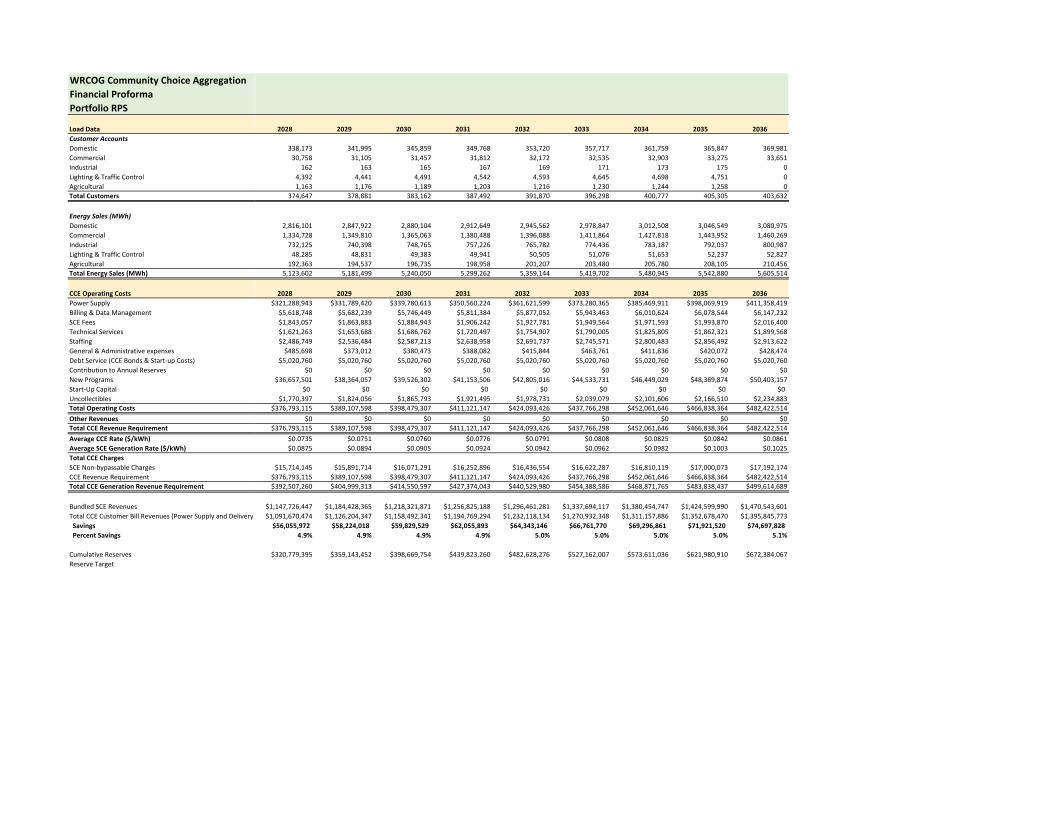
WRCOG Community Choice AggregationFinancial ProformaPortfolio RPS
Load DataCustomer AccountsDomesticCommercialIndustrialLighting & Traffic ControlAgriculturalTotal Customers
Energy Sales (MWh)DomesticCommercialIndustrialLighting & Traffic ControlAgriculturalTotal Energy Sales (MWh)
CCE Operating CostsPower SupplyBilling & Data ManagementSCE FeesTechnical ServicesStaffingGeneral & Administrative expensesDebt Service (CCE Bonds & Start‐up Costs)Contribution to Annual ReservesNew ProgramsStart‐Up CapitalUncollectiblesTotal Operating CostsOther RevenuesTotal CCE Revenue RequirementAverage CCE Rate ($/kWh)Average SCE Generation Rate ($/kWh)Total CCE ChargesSCE Non‐bypassable ChargesCCE Revenue RequirementTotal CCE Generation Revenue Requirement
Bundled SCE RevenuesTotal CCE Customer Bill Revenues (Power Supply and Delivery) Savings Percent Savings
Cumulative ReservesReserve Target
2028 2029 2030 2031 2032 2033 2034 2035 2036
338,173 341,995 345,859 349,768 353,720 357,717 361,759 365,847 369,98130,758 31,105 31,457 31,812 32,172 32,535 32,903 33,275 33,651
162 163 165 167 169 171 173 175 04,392 4,441 4,491 4,542 4,593 4,645 4,698 4,751 01,163 1,176 1,189 1,203 1,216 1,230 1,244 1,258 0
374,647 378,881 383,162 387,492 391,870 396,298 400,777 405,305 403,632
2,816,101 2,847,922 2,880,104 2,912,649 2,945,562 2,978,847 3,012,508 3,046,549 3,080,9751,334,728 1,349,810 1,365,063 1,380,488 1,396,088 1,411,864 1,427,818 1,443,952 1,460,269732,125 740,398 748,765 757,226 765,782 774,436 783,187 792,037 800,98748,285 48,831 49,383 49,941 50,505 51,076 51,653 52,237 52,827
192,363 194,537 196,735 198,958 201,207 203,480 205,780 208,105 210,4565,123,602 5,181,499 5,240,050 5,299,262 5,359,144 5,419,702 5,480,945 5,542,880 5,605,514
2028 2029 2030 2031 2032 2033 2034 2035 2036$321,288,943 $331,789,420 $339,780,613 $350,560,224 $361,621,599 $373,280,365 $385,469,911 $398,069,919 $411,358,419
$5,618,748 $5,682,239 $5,746,449 $5,811,384 $5,877,052 $5,943,463 $6,010,624 $6,078,544 $6,147,232$1,843,057 $1,863,883 $1,884,943 $1,906,242 $1,927,781 $1,949,564 $1,971,593 $1,993,870 $2,016,400$1,621,263 $1,653,688 $1,686,762 $1,720,497 $1,754,907 $1,790,005 $1,825,805 $1,862,321 $1,899,568$2,486,749 $2,536,484 $2,587,213 $2,638,958 $2,691,737 $2,745,571 $2,800,483 $2,856,492 $2,913,622$485,698 $373,012 $380,473 $388,082 $415,844 $463,761 $411,836 $420,072 $428,474
$5,020,760 $5,020,760 $5,020,760 $5,020,760 $5,020,760 $5,020,760 $5,020,760 $5,020,760 $5,020,760$0 $0 $0 $0 $0 $0 $0 $0 $0
$36,657,501 $38,364,057 $39,526,302 $41,153,506 $42,805,016 $44,533,731 $46,449,029 $48,369,874 $50,403,157$0 $0 $0 $0 $0 $0 $0 $0 $0
$1,770,397 $1,824,056 $1,865,793 $1,921,495 $1,978,731 $2,039,079 $2,101,606 $2,166,510 $2,234,883$376,793,115 $389,107,598 $398,479,307 $411,121,147 $424,093,426 $437,766,298 $452,061,646 $466,838,364 $482,422,514
$0 $0 $0 $0 $0 $0 $0 $0 $0$376,793,115 $389,107,598 $398,479,307 $411,121,147 $424,093,426 $437,766,298 $452,061,646 $466,838,364 $482,422,514
$0.0735 $0.0751 $0.0760 $0.0776 $0.0791 $0.0808 $0.0825 $0.0842 $0.0861$0.0875 $0.0894 $0.0905 $0.0924 $0.0942 $0.0962 $0.0982 $0.1003 $0.1025
$15,714,145 $15,891,714 $16,071,291 $16,252,896 $16,436,554 $16,622,287 $16,810,119 $17,000,073 $17,192,174$376,793,115 $389,107,598 $398,479,307 $411,121,147 $424,093,426 $437,766,298 $452,061,646 $466,838,364 $482,422,514$392,507,260 $404,999,313 $414,550,597 $427,374,043 $440,529,980 $454,388,586 $468,871,765 $483,838,437 $499,614,689
$1,147,726,447 $1,184,428,365 $1,218,321,871 $1,256,825,188 $1,296,461,281 $1,337,694,117 $1,380,454,747 $1,424,599,990 $1,470,543,601$1,091,670,474 $1,126,204,347 $1,158,492,341 $1,194,769,294 $1,232,118,134 $1,270,932,348 $1,311,157,886 $1,352,678,470 $1,395,845,773$56,055,972 $58,224,018 $59,829,529 $62,055,893 $64,343,146 $66,761,770 $69,296,861 $71,921,520 $74,697,828
4.9% 4.9% 4.9% 4.9% 5.0% 5.0% 5.0% 5.0% 5.1%
$320,779,395 $359,143,452 $398,669,754 $439,823,260 $482,628,276 $527,162,007 $573,611,036 $621,980,910 $672,384,067

WRCOG Community Choice AggregationFinancial ProformaPortfolio ‐50% Renewable
2017 2017Load Data Jan ‐ June July ‐ Dec 2018 2019 2020 2021 2022 2023 2024 2025 2026 2027Customer AccountsDomestic 0 1,919 302,231 305,647 309,100 312,593 316,125 319,698 323,310 326,964 330,658 334,395Commercial 0 14,460 27,489 27,799 28,113 28,431 28,752 29,077 29,406 29,738 30,074 30,414Industrial 0 0 144 146 148 149 151 153 154 156 158 160Lighting & Traffic Control 0 1,955 3,925 3,969 4,014 4,059 4,105 4,152 4,199 4,246 4,294 4,342Agricultural 0 11 1,039 1,051 1,063 1,075 1,087 1,099 1,112 1,124 1,137 1,150Total Customers 0 18,346 334,828 338,612 342,438 346,308 350,221 354,179 358,181 362,228 366,321 370,461
Energy Sales (MWh)Domestic 0 31 2,516,796 2,545,236 2,573,997 2,603,084 2,632,498 2,662,246 2,692,329 2,722,752 2,753,519 2,784,634Commercial 0 40,038 1,192,869 1,206,348 1,219,980 1,233,766 1,247,707 1,261,806 1,276,065 1,290,484 1,305,067 1,319,814Industrial 0 0 654,313 661,706 669,184 676,745 684,393 692,126 699,947 707,857 715,856 723,945Lighting & Traffic Control 0 13,960 43,153 43,641 44,134 44,633 45,137 45,647 46,163 46,685 47,212 47,746Agricultural 0 4,688 171,918 173,861 175,826 177,812 179,822 181,854 183,909 185,987 188,089 190,214Total Energy Sales (MWh) 0 58,716 4,579,049 4,630,793 4,683,121 4,736,040 4,789,557 4,843,679 4,898,413 4,953,765 5,009,742 5,066,352
2017 2017CCE Operating Costs Jan ‐ June July ‐ Dec 2018 2019 2020 2021 2022 2023 2024 2025 2026 2027Power Supply $0 $3,042,266 $239,817,771 $246,529,453 $253,410,401 $260,765,453 $268,145,822 $275,831,414 $283,833,176 $291,963,329 $300,514,540 $309,463,593Billing & Data Management $0 $192,634 $5,021,569 $5,078,313 $5,135,698 $5,193,731 $5,252,420 $5,311,773 $5,371,796 $5,432,497 $5,493,884 $5,555,965SCE Fees $68,749 $1,228,726 $2,873,783 $1,665,795 $1,684,617 $1,703,652 $1,722,902 $1,742,369 $1,762,057 $1,781,967 $1,802,102 $1,822,465Technical Services $620,000 $740,000 $1,310,000 $1,356,600 $1,383,732 $1,411,407 $1,439,635 $1,468,427 $1,497,796 $1,527,752 $1,558,307 $1,589,473Staffing $90,000 $310,000 $1,704,167 $2,080,800 $2,122,416 $2,164,864 $2,208,162 $2,252,325 $2,297,371 $2,343,319 $2,390,185 $2,437,989General & Administrative expenses $90,000 $150,000 $420,000 $306,000 $312,120 $318,362 $344,730 $391,224 $337,849 $344,606 $351,498 $398,528Debt Service (CCE Bonds & Start‐up Costs) $0 $819,618 $6,659,995 $6,659,995 $6,659,995 $6,659,995 $5,840,377 $5,020,760 $5,020,760 $5,020,760 $5,020,760 $5,020,760Contribution to Annual Reserves $0 $1,557,868 $22,392,737 $26,688,660 $32,441,122 $35,400,664 $0 $0 $0 $0 $0 $0New Programs $0 $0 $0 $0 $0 $0 $39,265,431 $43,326,392 $46,482,220 $49,207,777 $52,224,244 $53,650,169Start‐Up Capital $0 ($6,000,000) $0 $0 $0 $0 $0 $0 $0 $0 $0 $0Uncollectibles $4,344 $34,873 $1,484,238 $1,515,792 $1,553,183 $1,592,981 $1,628,945 $1,535,625 $1,576,991 $1,619,321 $1,663,779 $1,710,449Total Operating Costs $873,093 $2,075,985 $281,684,259 $291,881,407 $304,703,283 $315,211,110 $325,848,424 $336,880,310 $348,180,015 $359,241,327 $371,019,300 $381,649,391Other Revenues $0 $0 $0 $0 $0 $0 $0 $0 $0 $0 $0 $0Total CCE Revenue Requirement $873,093 $2,075,985 $281,684,259 $291,881,407 $304,703,283 $315,211,110 $325,848,424 $336,880,310 $348,180,015 $359,241,327 $371,019,300 $381,649,391Average CCE Rate ($/kWh) $0.0502 $0.0615 $0.0630 $0.0651 $0.0666 $0.0680 $0.0696 $0.0711 $0.0725 $0.0741 $0.0753Average SCE Generation Rate ($/kWh) $0.0572 $0.0701 $0.0718 $0.0741 $0.0758 $0.0775 $0.0792 $0.0810 $0.0826 $0.0844 $0.0858Total CCE ChargesSCE Non‐bypassable Charges $0 $491,389 $39,040,255 $39,481,410 $39,927,550 $40,378,731 $40,835,011 $15,106,646 $15,277,351 $15,449,985 $15,624,570 $15,801,128CCE Revenue Requirement $873,093 $2,075,985 $281,684,259 $291,881,407 $304,703,283 $315,211,110 $325,848,424 $336,880,310 $348,180,015 $359,241,327 $371,019,300 $381,649,391Total CCE Generation Revenue Requirement $873,093 $2,567,375 $320,724,514 $331,362,817 $344,630,833 $355,589,841 $366,683,434 $351,986,955 $363,457,366 $374,691,313 $386,643,870 $397,450,518
Bundled SCE Revenues $0 $9,149,294 $833,422,747 $861,196,970 $892,470,098 $921,633,162 $951,485,800 $982,347,021 $1,014,090,088 $1,046,156,636 $1,079,653,180 $1,112,475,447Total CCE Customer Bill Revenues (Power Supply and Delivery) $0 $8,913,497 $808,563,418 $835,082,105 $864,736,808 $892,604,833 $921,146,305 $950,643,418 $980,987,073 $1,011,689,261 $1,043,723,815 $1,075,245,566 Savings $0 $235,797 $24,859,328 $26,114,865 $27,733,290 $29,028,329 $30,339,495 $31,703,602 $33,103,015 $34,467,375 $35,929,365 $37,229,881 Percent Savings 2.6% 3.0% 3.0% 3.1% 3.1% 3.2% 3.2% 3.3% 3.3% 3.3% 3.3%
Cumulative Reserves $1,557,868 $23,950,605 $50,639,265 $83,080,387 $118,481,051 $157,746,482 $201,072,873 $247,555,093 $296,762,870 $348,987,114 $402,637,284Reserve Target $80,181,128

WRCOG Community Choice AggregationFinancial ProformaPortfolio ‐50% Renewable
Load DataCustomer AccountsDomesticCommercialIndustrialLighting & Traffic ControlAgriculturalTotal Customers
Energy Sales (MWh)DomesticCommercialIndustrialLighting & Traffic ControlAgriculturalTotal Energy Sales (MWh)
CCE Operating CostsPower SupplyBilling & Data ManagementSCE FeesTechnical ServicesStaffingGeneral & Administrative expensesDebt Service (CCE Bonds & Start‐up Costs)Contribution to Annual ReservesNew ProgramsStart‐Up CapitalUncollectiblesTotal Operating CostsOther RevenuesTotal CCE Revenue RequirementAverage CCE Rate ($/kWh)Average SCE Generation Rate ($/kWh)Total CCE ChargesSCE Non‐bypassable ChargesCCE Revenue RequirementTotal CCE Generation Revenue Requirement
Bundled SCE RevenuesTotal CCE Customer Bill Revenues (Power Supply and Delivery) Savings Percent Savings
Cumulative ReservesReserve Target
2028 2029 2030 2031 2032 2033 2034 2035 2036
338,173 341,995 345,859 349,768 353,720 357,717 361,759 365,847 369,98130,758 31,105 31,457 31,812 32,172 32,535 32,903 33,275 33,651
162 163 165 167 169 171 173 175 04,392 4,441 4,491 4,542 4,593 4,645 4,698 4,751 01,163 1,176 1,189 1,203 1,216 1,230 1,244 1,258 0
374,647 378,881 383,162 387,492 391,870 396,298 400,777 405,305 403,632
2,816,101 2,847,922 2,880,104 2,912,649 2,945,562 2,978,847 3,012,508 3,046,549 3,080,9751,334,728 1,349,810 1,365,063 1,380,488 1,396,088 1,411,864 1,427,818 1,443,952 1,460,269732,125 740,398 748,765 757,226 765,782 774,436 783,187 792,037 800,98748,285 48,831 49,383 49,941 50,505 51,076 51,653 52,237 52,827
192,363 194,537 196,735 198,958 201,207 203,480 205,780 208,105 210,4565,123,602 5,181,499 5,240,050 5,299,262 5,359,144 5,419,702 5,480,945 5,542,880 5,605,514
2028 2029 2030 2031 2032 2033 2034 2035 2036$318,781,912 $328,536,021 $339,780,613 $350,560,224 $361,621,599 $373,280,365 $385,469,911 $398,069,919 $411,358,419
$5,618,748 $5,682,239 $5,746,449 $5,811,384 $5,877,052 $5,943,463 $6,010,624 $6,078,544 $6,147,232$1,843,057 $1,863,883 $1,884,943 $1,906,242 $1,927,781 $1,949,564 $1,971,593 $1,993,870 $2,016,400$1,621,263 $1,653,688 $1,686,762 $1,720,497 $1,754,907 $1,790,005 $1,825,805 $1,862,321 $1,899,568$2,486,749 $2,536,484 $2,587,213 $2,638,958 $2,691,737 $2,745,571 $2,800,483 $2,856,492 $2,913,622$485,698 $373,012 $380,473 $388,082 $415,844 $463,761 $411,836 $420,072 $428,474
$5,020,760 $5,020,760 $5,020,760 $5,020,760 $5,020,760 $5,020,760 $5,020,760 $5,020,760 $5,020,760$0 $0 $0 $0 $0 $0 $0 $0 $0
$56,222,470 $59,236,209 $57,552,747 $59,751,843 $61,990,194 $64,337,445 $66,899,437 $69,488,753 $72,227,033$0 $0 $0 $0 $0 $0 $0 $0 $0
$1,757,862 $1,807,789 $1,865,793 $1,921,495 $1,978,731 $2,039,079 $2,101,606 $2,166,510 $2,234,883$393,838,518 $406,710,085 $416,505,751 $429,719,484 $443,278,605 $457,570,012 $472,512,054 $487,957,242 $504,246,390
$0 $0 $0 $0 $0 $0 $0 $0 $0$393,838,518 $406,710,085 $416,505,751 $429,719,484 $443,278,605 $457,570,012 $472,512,054 $487,957,242 $504,246,390
$0.0769 $0.0785 $0.0795 $0.0811 $0.0827 $0.0844 $0.0862 $0.0880 $0.0900$0.0875 $0.0894 $0.0905 $0.0924 $0.0942 $0.0962 $0.0982 $0.1003 $0.1025
$15,714,145 $15,891,714 $16,071,291 $16,252,896 $16,436,554 $16,622,287 $16,810,119 $17,000,073 $17,192,174$393,838,518 $406,710,085 $416,505,751 $429,719,484 $443,278,605 $457,570,012 $472,512,054 $487,957,242 $504,246,390$409,552,662 $422,601,799 $432,577,042 $445,972,381 $459,715,159 $474,192,299 $489,322,173 $504,957,316 $521,438,564
$1,147,726,447 $1,184,428,365 $1,218,321,871 $1,256,825,188 $1,296,461,281 $1,337,694,117 $1,380,454,747 $1,424,599,990 $1,470,543,601$1,108,715,877 $1,143,806,833 $1,176,518,786 $1,213,367,632 $1,251,303,313 $1,290,736,061 $1,331,608,293 $1,373,797,349 $1,417,669,648$39,010,570 $40,621,532 $41,803,085 $43,457,556 $45,157,967 $46,958,056 $48,846,453 $50,802,641 $52,873,953
3.4% 3.4% 3.4% 3.5% 3.5% 3.5% 3.5% 3.6% 3.6%
$458,859,754 $518,095,962 $575,648,710 $635,400,553 $697,390,747 $761,728,192 $828,627,629 $898,116,381 $970,343,414

WRCOG Community Choice AggregationFinancial ProformaPortfolio ‐100% Renewable
2017 2017Load Data Jan ‐ June July ‐ Dec 2018 2019 2020 2021 2022 2023 2024 2025 2026 2027Customer AccountsDomestic 0 1,919 302,231 305,647 309,100 312,593 316,125 319,698 323,310 326,964 330,658 334,395Commercial 0 14,460 27,489 27,799 28,113 28,431 28,752 29,077 29,406 29,738 30,074 30,414Industrial 0 0 144 146 148 149 151 153 154 156 158 160Lighting & Traffic Control 0 1,955 3,925 3,969 4,014 4,059 4,105 4,152 4,199 4,246 4,294 4,342Agricultural 0 11 1,039 1,051 1,063 1,075 1,087 1,099 1,112 1,124 1,137 1,150Total Customers 0 18,346 334,828 338,612 342,438 346,308 350,221 354,179 358,181 362,228 366,321 370,461
Energy Sales (MWh)Domestic 0 31 2,516,796 2,545,236 2,573,997 2,603,084 2,632,498 2,662,246 2,692,329 2,722,752 2,753,519 2,784,634Commercial 0 40,038 1,192,869 1,206,348 1,219,980 1,233,766 1,247,707 1,261,806 1,276,065 1,290,484 1,305,067 1,319,814Industrial 0 0 654,313 661,706 669,184 676,745 684,393 692,126 699,947 707,857 715,856 723,945Lighting & Traffic Control 0 13,960 43,153 43,641 44,134 44,633 45,137 45,647 46,163 46,685 47,212 47,746Agricultural 0 4,688 171,918 173,861 175,826 177,812 179,822 181,854 183,909 185,987 188,089 190,214Total Energy Sales (MWh) 0 58,716 4,579,049 4,630,793 4,683,121 4,736,040 4,789,557 4,843,679 4,898,413 4,953,765 5,009,742 5,066,352
2017 2017CCE Operating Costs Jan ‐ June July ‐ Dec 2018 2019 2020 2021 2022 2023 2024 2025 2026 2027Power Supply $0 $4,037,959 $313,511,321 $320,806,679 $328,299,543 $336,307,961 $344,453,480 $352,877,874 $361,535,487 $370,482,012 $379,738,967 $389,410,496Billing & Data Management $0 $192,634 $5,021,569 $5,078,313 $5,135,698 $5,193,731 $5,252,420 $5,311,773 $5,371,796 $5,432,497 $5,493,884 $5,555,965SCE Fees $68,749 $1,228,726 $2,873,783 $1,665,795 $1,684,617 $1,703,652 $1,722,902 $1,742,369 $1,762,057 $1,781,967 $1,802,102 $1,822,465Technical Services $620,000 $740,000 $1,310,000 $1,356,600 $1,383,732 $1,411,407 $1,439,635 $1,468,427 $1,497,796 $1,527,752 $1,558,307 $1,589,473Staffing $90,000 $310,000 $1,704,167 $2,080,800 $2,122,416 $2,164,864 $2,208,162 $2,252,325 $2,297,371 $2,343,319 $2,390,185 $2,437,989General & Administrative expenses $90,000 $150,000 $420,000 $306,000 $312,120 $318,362 $344,730 $391,224 $337,849 $344,606 $351,498 $398,528Debt Service (CCE Bonds & Start‐up Costs) $0 $819,618 $6,659,995 $6,659,995 $6,659,995 $6,659,995 $5,840,377 $5,020,760 $5,020,760 $5,020,760 $5,020,760 $5,020,760Contribution to Annual Reserves $0 $1,185,303 $8,324,975 $14,206,134 $22,074,475 $26,615,384 $0 $0 $0 $0 $0 $0New Programs $0 $0 $0 $0 $0 $0 $31,976,753 $37,644,834 $42,548,188 $46,809,175 $51,624,890 $54,588,766Start‐Up Capital $0 ($6,000,000) $0 $0 $0 $0 $0 $0 $0 $0 $0 $0Uncollectibles $4,344 $39,852 $1,852,705 $1,887,178 $1,927,628 $1,970,694 $2,010,484 $1,920,857 $1,965,502 $2,011,914 $2,059,901 $2,110,184Total Operating Costs $873,093 $2,704,092 $341,678,515 $354,047,493 $369,600,223 $382,346,050 $395,248,942 $408,630,444 $422,336,806 $435,754,002 $450,040,494 $462,934,625Other Revenues $0 $0 $0 $0 $0 $0 $0 $0 $0 $0 $0 $0Total CCE Revenue Requirement $873,093 $2,704,092 $341,678,515 $354,047,493 $369,600,223 $382,346,050 $395,248,942 $408,630,444 $422,336,806 $435,754,002 $450,040,494 $462,934,625Average CCE Rate ($/kWh) $0.0609 $0.0746 $0.0765 $0.0789 $0.0807 $0.0825 $0.0844 $0.0862 $0.0880 $0.0898 $0.0914Average SCE Generation Rate ($/kWh) $0.0572 $0.0701 $0.0718 $0.0741 $0.0758 $0.0775 $0.0792 $0.0810 $0.0826 $0.0844 $0.0858Total CCE ChargesSCE Non‐bypassable Charges $0 $491,389 $39,040,255 $39,481,410 $39,927,550 $40,378,731 $40,835,011 $15,106,646 $15,277,351 $15,449,985 $15,624,570 $15,801,128CCE Revenue Requirement $873,093 $2,704,092 $341,678,515 $354,047,493 $369,600,223 $382,346,050 $395,248,942 $408,630,444 $422,336,806 $435,754,002 $450,040,494 $462,934,625Total CCE Generation Revenue Requirement $873,093 $3,195,481 $380,718,770 $393,528,903 $409,527,773 $422,724,781 $436,083,953 $423,737,090 $437,614,157 $451,203,987 $465,665,064 $478,735,753
Bundled SCE Revenues $0 $9,149,294 $833,422,747 $861,196,970 $892,470,098 $921,633,162 $951,485,800 $982,347,021 $1,014,090,088 $1,046,156,636 $1,079,653,180 $1,112,475,447Total CCE Customer Bill Revenues (Power Supply and Delivery) $0 $9,541,604 $868,557,674 $897,248,191 $929,633,749 $959,739,774 $990,546,823 $1,022,393,553 $1,055,143,864 $1,088,201,935 $1,122,745,010 $1,156,530,801 Savings $0 ($392,310) ($35,134,927) ($36,051,220) ($37,163,650) ($38,106,611) ($39,061,023) ($40,046,532) ($41,053,776) ($42,045,300) ($43,091,830) ($44,055,354) Percent Savings ‐4.3% ‐4.2% ‐4.2% ‐4.2% ‐4.1% ‐4.1% ‐4.1% ‐4.0% ‐4.0% ‐4.0% ‐4.0%
Cumulative Reserves $1,185,303 $9,510,278 $23,716,412 $45,790,886 $72,406,270 $104,383,023 $142,027,857 $184,576,046 $231,385,221 $283,010,110 $337,598,876Reserve Target $95,179,692
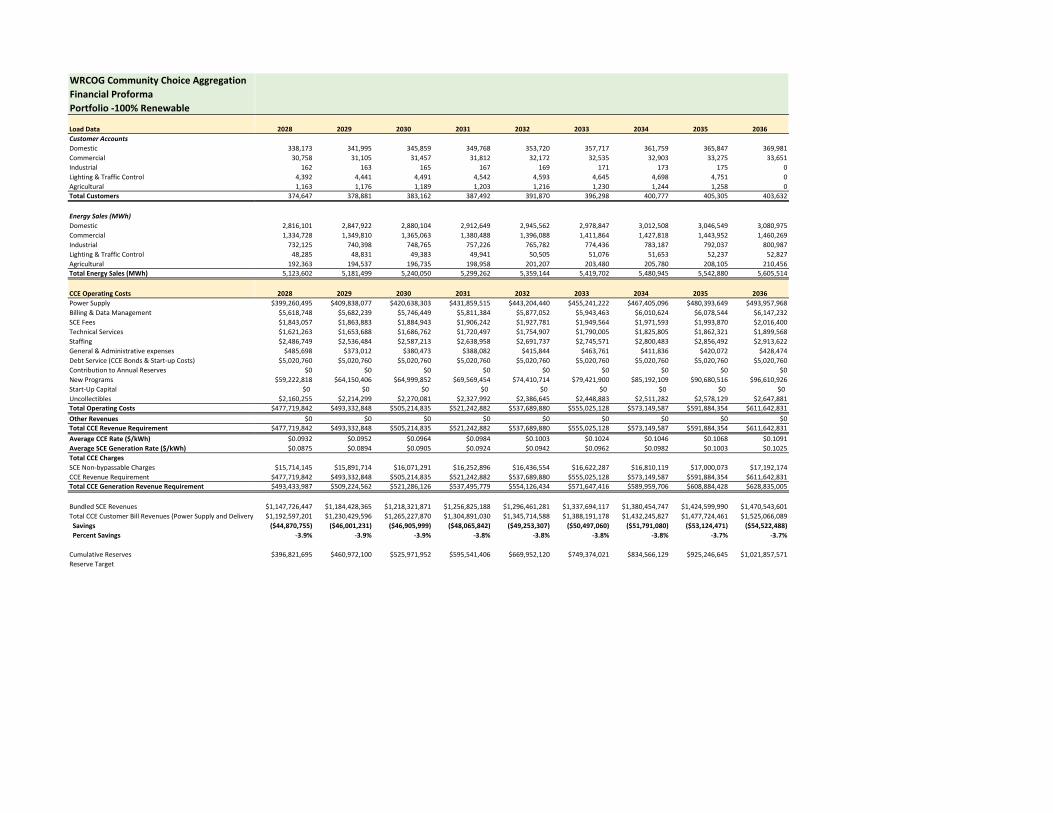
WRCOG Community Choice AggregationFinancial ProformaPortfolio ‐100% Renewable
Load DataCustomer AccountsDomesticCommercialIndustrialLighting & Traffic ControlAgriculturalTotal Customers
Energy Sales (MWh)DomesticCommercialIndustrialLighting & Traffic ControlAgriculturalTotal Energy Sales (MWh)
CCE Operating CostsPower SupplyBilling & Data ManagementSCE FeesTechnical ServicesStaffingGeneral & Administrative expensesDebt Service (CCE Bonds & Start‐up Costs)Contribution to Annual ReservesNew ProgramsStart‐Up CapitalUncollectiblesTotal Operating CostsOther RevenuesTotal CCE Revenue RequirementAverage CCE Rate ($/kWh)Average SCE Generation Rate ($/kWh)Total CCE ChargesSCE Non‐bypassable ChargesCCE Revenue RequirementTotal CCE Generation Revenue Requirement
Bundled SCE RevenuesTotal CCE Customer Bill Revenues (Power Supply and Delivery) Savings Percent Savings
Cumulative ReservesReserve Target
2028 2029 2030 2031 2032 2033 2034 2035 2036
338,173 341,995 345,859 349,768 353,720 357,717 361,759 365,847 369,98130,758 31,105 31,457 31,812 32,172 32,535 32,903 33,275 33,651
162 163 165 167 169 171 173 175 04,392 4,441 4,491 4,542 4,593 4,645 4,698 4,751 01,163 1,176 1,189 1,203 1,216 1,230 1,244 1,258 0
374,647 378,881 383,162 387,492 391,870 396,298 400,777 405,305 403,632
2,816,101 2,847,922 2,880,104 2,912,649 2,945,562 2,978,847 3,012,508 3,046,549 3,080,9751,334,728 1,349,810 1,365,063 1,380,488 1,396,088 1,411,864 1,427,818 1,443,952 1,460,269732,125 740,398 748,765 757,226 765,782 774,436 783,187 792,037 800,98748,285 48,831 49,383 49,941 50,505 51,076 51,653 52,237 52,827
192,363 194,537 196,735 198,958 201,207 203,480 205,780 208,105 210,4565,123,602 5,181,499 5,240,050 5,299,262 5,359,144 5,419,702 5,480,945 5,542,880 5,605,514
2028 2029 2030 2031 2032 2033 2034 2035 2036$399,260,495 $409,838,077 $420,638,303 $431,859,515 $443,204,440 $455,241,222 $467,405,096 $480,393,649 $493,957,968
$5,618,748 $5,682,239 $5,746,449 $5,811,384 $5,877,052 $5,943,463 $6,010,624 $6,078,544 $6,147,232$1,843,057 $1,863,883 $1,884,943 $1,906,242 $1,927,781 $1,949,564 $1,971,593 $1,993,870 $2,016,400$1,621,263 $1,653,688 $1,686,762 $1,720,497 $1,754,907 $1,790,005 $1,825,805 $1,862,321 $1,899,568$2,486,749 $2,536,484 $2,587,213 $2,638,958 $2,691,737 $2,745,571 $2,800,483 $2,856,492 $2,913,622$485,698 $373,012 $380,473 $388,082 $415,844 $463,761 $411,836 $420,072 $428,474
$5,020,760 $5,020,760 $5,020,760 $5,020,760 $5,020,760 $5,020,760 $5,020,760 $5,020,760 $5,020,760$0 $0 $0 $0 $0 $0 $0 $0 $0
$59,222,818 $64,150,406 $64,999,852 $69,569,454 $74,410,714 $79,421,900 $85,192,109 $90,680,516 $96,610,926$0 $0 $0 $0 $0 $0 $0 $0 $0
$2,160,255 $2,214,299 $2,270,081 $2,327,992 $2,386,645 $2,448,883 $2,511,282 $2,578,129 $2,647,881$477,719,842 $493,332,848 $505,214,835 $521,242,882 $537,689,880 $555,025,128 $573,149,587 $591,884,354 $611,642,831
$0 $0 $0 $0 $0 $0 $0 $0 $0$477,719,842 $493,332,848 $505,214,835 $521,242,882 $537,689,880 $555,025,128 $573,149,587 $591,884,354 $611,642,831
$0.0932 $0.0952 $0.0964 $0.0984 $0.1003 $0.1024 $0.1046 $0.1068 $0.1091$0.0875 $0.0894 $0.0905 $0.0924 $0.0942 $0.0962 $0.0982 $0.1003 $0.1025
$15,714,145 $15,891,714 $16,071,291 $16,252,896 $16,436,554 $16,622,287 $16,810,119 $17,000,073 $17,192,174$477,719,842 $493,332,848 $505,214,835 $521,242,882 $537,689,880 $555,025,128 $573,149,587 $591,884,354 $611,642,831$493,433,987 $509,224,562 $521,286,126 $537,495,779 $554,126,434 $571,647,416 $589,959,706 $608,884,428 $628,835,005
$1,147,726,447 $1,184,428,365 $1,218,321,871 $1,256,825,188 $1,296,461,281 $1,337,694,117 $1,380,454,747 $1,424,599,990 $1,470,543,601$1,192,597,201 $1,230,429,596 $1,265,227,870 $1,304,891,030 $1,345,714,588 $1,388,191,178 $1,432,245,827 $1,477,724,461 $1,525,066,089($44,870,755) ($46,001,231) ($46,905,999) ($48,065,842) ($49,253,307) ($50,497,060) ($51,791,080) ($53,124,471) ($54,522,488)
‐3.9% ‐3.9% ‐3.9% ‐3.8% ‐3.8% ‐3.8% ‐3.8% ‐3.7% ‐3.7%
$396,821,695 $460,972,100 $525,971,952 $595,541,406 $669,952,120 $749,374,021 $834,566,129 $925,246,645 $1,021,857,571

SANBAG Community Choice AggregationFinancial ProformaPortfolio RPS
2017 2017Load Data Jan ‐ June July ‐ Dec 2018 2019 2020 2021 2022 2023 2024 2025 2026 2027Customer AccountsDomestic 0 3,864 461,002 466,212 471,480 476,808 482,196 487,644 493,155 498,727 504,363 510,062Commercial 0 33,205 48,808 49,359 49,917 50,481 51,051 51,628 52,212 52,802 53,398 54,002Industrial 0 0 279 282 285 289 292 295 299 302 305 309Lighting & Traffic Control 0 4,096 5,952 6,020 6,088 6,156 6,226 6,296 6,367 6,439 6,512 6,586Agricultural 0 43 1,675 1,694 1,713 1,733 1,752 1,772 1,792 1,812 1,833 1,853Total Customers 0 41,208 517,717 523,567 529,483 535,466 541,517 547,636 553,824 560,083 566,412 572,812
Energy Sales (MWh)Domestic 0 48 3,394,200 3,432,554 3,471,342 3,510,568 3,550,238 3,590,355 3,630,926 3,671,956 3,713,449 3,755,411Commercial 0 80,550 2,361,973 2,388,663 2,415,655 2,442,952 2,470,558 2,498,475 2,526,708 2,555,259 2,584,134 2,613,335Industrial 0 0 1,817,576 1,838,114 1,858,885 1,879,890 1,901,133 1,922,616 1,944,341 1,966,313 1,988,532 2,011,002Lighting & Traffic Control 0 26,827 65,824 66,568 67,320 68,081 68,850 69,628 70,415 71,211 72,015 72,829Agricultural 0 11,057 265,359 268,357 271,390 274,456 277,558 280,694 283,866 287,074 290,318 293,598Total Energy Sales (MWh) 0 118,482 7,904,931 7,994,257 8,084,592 8,175,948 8,268,336 8,361,769 8,456,256 8,551,812 8,648,448 8,746,175
2017 2017CCE Operating Costs Jan ‐ June July ‐ Dec 2018 2019 2020 2021 2022 2023 2024 2025 2026 2027Power Supply $0 $5,817,828 $392,594,259 $406,937,383 $424,584,669 $439,255,432 $453,572,258 $469,213,463 $484,869,768 $501,024,271 $517,156,727 $532,166,740Billing & Data Management $0 $432,679 $7,764,423 $7,852,161 $7,940,891 $8,030,623 $8,121,369 $8,213,140 $8,305,949 $8,399,806 $8,494,724 $8,590,714SCE Fees $149,501 $1,939,421 $4,405,258 $2,575,617 $2,604,720 $2,634,152 $2,663,917 $2,694,018 $2,724,459 $2,755,244 $2,786,377 $2,817,862Technical Services $620,000 $740,000 $1,310,000 $1,356,600 $1,401,003 $1,465,319 $1,552,981 $1,669,111 $1,821,084 $2,019,393 $2,278,936 $2,620,965Staffing $90,000 $970,000 $2,488,333 $2,632,212 $2,684,856 $2,738,553 $2,793,324 $2,849,191 $2,906,175 $2,964,298 $3,023,584 $3,084,056General & Administrative expenses $90,000 $260,000 $350,000 $306,000 $312,120 $318,362 $399,730 $356,224 $337,849 $344,606 $351,498 $508,528Debt Service (CCE Bonds & Start‐up Costs) $0 $1,170,882 $9,872,904 $9,872,904 $9,872,904 $9,872,904 $8,702,022 $7,531,140 $7,531,140 $7,531,140 $7,531,140 $7,531,140Contribution to Annual Reserves $0 $3,338,738 $30,998,387 $34,704,408 $37,070,123 $38,976,136New Programs $0 $0 $0 $0 $0 $0 $41,905,466 $45,349,663 $47,332,068 $49,313,251 $51,226,918 $52,739,319Start‐Up Capital $0 ($10,000,000) $0 $0 $0 $0 $0 $0 $0 $0 $0 $0Uncollectibles $4,748 $61,654 $2,429,498 $2,497,028 $2,590,204 $2,668,653 $2,740,027 $2,591,600 $2,672,908 $2,757,093 $2,841,505 $2,921,497Total Operating Costs $954,248 $4,731,202 $452,213,063 $468,734,314 $489,061,491 $505,960,135 $522,451,094 $540,467,549 $558,501,399 $577,109,102 $595,691,409 $612,980,821Other Revenues $0 $0 $0 $0 $0 $0 $0 $0 $0 $0 $0 $0Total CCE Revenue Requirement $954,248 $4,731,202 $452,213,063 $468,734,314 $489,061,491 $505,960,135 $522,451,094 $540,467,549 $558,501,399 $577,109,102 $595,691,409 $612,980,821Average CCE Rate ($/kWh) $0.0480 $0.0572 $0.0586 $0.0605 $0.0619 $0.0632 $0.0646 $0.0660 $0.0675 $0.0689 $0.0701Average SCE Generation Rate ($/kWh) $0.0571 $0.0681 $0.0698 $0.0720 $0.0737 $0.0752 $0.0769 $0.0786 $0.0803 $0.0820 $0.0834Total CCE ChargesSCE Non‐bypassable Charges $0 $1,000,043 $67,114,353 $67,872,745 $68,639,707 $69,415,336 $70,199,729 $25,793,617 $26,085,085 $26,379,847 $26,677,939 $26,979,400CCE Revenue Requirement $954,248 $4,731,202 $452,213,063 $468,734,314 $489,061,491 $505,960,135 $522,451,094 $540,467,549 $558,501,399 $577,109,102 $595,691,409 $612,980,821Total CCE Generation Revenue Requirement $954,248 $5,731,245 $519,327,416 $536,607,059 $557,701,198 $575,375,471 $592,650,823 $566,261,167 $584,586,484 $603,488,949 $622,369,348 $639,960,221
Bundled SCE Revenues $0 $18,296,669 $1,351,759,556 $1,397,071,297 $1,447,722,341 $1,495,125,726 $1,542,903,988 $1,593,385,654 $1,644,803,337 $1,697,848,344 $1,751,837,051 $1,805,291,234Total CCE Customer Bill Revenues (Power Supply and Delivery) $0 $17,573,193 $1,290,008,143 $1,332,448,522 $1,379,506,381 $1,423,972,783 $1,468,894,900 $1,516,233,071 $1,564,507,203 $1,614,302,648 $1,665,049,960 $1,715,512,382 Savings $0 $723,476 $61,751,414 $64,622,775 $68,215,960 $71,152,944 $74,009,088 $77,152,583 $80,296,134 $83,545,697 $86,787,091 $89,778,852 Percent Savings 4.0% 4.6% 4.6% 4.7% 4.8% 4.8% 4.8% 4.9% 4.9% 5.0% 5.0%
Cumulative Reserves $3,338,738 $34,337,125 $69,041,533 $106,111,656 $145,087,792 $186,993,258 $232,342,920 $279,674,988 $328,988,239 $380,215,157 $432,954,477Reserve Target $122,082,257

SANBAG Community Choice AggregationFinancial ProformaPortfolio RPS
Load DataCustomer AccountsDomesticCommercialIndustrialLighting & Traffic ControlAgriculturalTotal Customers
Energy Sales (MWh)DomesticCommercialIndustrialLighting & Traffic ControlAgriculturalTotal Energy Sales (MWh)
CCE Operating CostsPower SupplyBilling & Data ManagementSCE FeesTechnical ServicesStaffingGeneral & Administrative expensesDebt Service (CCE Bonds & Start‐up Costs)Contribution to Annual ReservesNew ProgramsStart‐Up CapitalUncollectiblesTotal Operating CostsOther RevenuesTotal CCE Revenue RequirementAverage CCE Rate ($/kWh)Average SCE Generation Rate ($/kWh)Total CCE ChargesSCE Non‐bypassable ChargesCCE Revenue RequirementTotal CCE Generation Revenue Requirement
Bundled SCE RevenuesTotal CCE Customer Bill Revenues (Power Supply and Delivery) Savings Percent Savings
Cumulative ReservesReserve Target
2028 2029 2030 2031 2032 2033 2034 2035 2036
515,826 521,655 527,550 533,511 539,540 545,636 551,802 558,037 564,34354,612 55,229 55,853 56,484 57,122 57,768 58,421 59,081 59,749
312 316 319 323 327 330 334 338 06,660 6,735 6,812 6,889 6,966 7,045 7,125 7,205 01,874 1,896 1,917 1,939 1,960 1,983 2,005 2,028 0
579,285 585,831 592,451 599,145 605,916 612,763 619,687 626,689 624,092
3,797,847 3,840,763 3,884,163 3,928,054 3,972,442 4,017,330 4,062,726 4,108,635 4,155,0622,642,865 2,672,730 2,702,932 2,733,475 2,764,363 2,795,600 2,827,191 2,859,138 2,891,4462,033,727 2,056,708 2,079,949 2,103,452 2,127,221 2,151,259 2,175,568 2,200,152 2,225,013
73,652 74,484 75,326 76,177 77,038 77,909 78,789 79,679 80,580296,916 300,271 303,664 307,095 310,566 314,075 317,624 321,213 324,843
8,845,007 8,944,955 9,046,033 9,148,254 9,251,629 9,356,172 9,461,897 9,568,817 9,676,944
2028 2029 2030 2031 2032 2033 2034 2035 2036$548,658,172 $566,362,265 $580,875,978 $599,067,291 $617,551,808 $637,671,875 $658,180,175 $679,537,499 $701,816,578
$8,687,789 $8,785,961 $8,885,243 $8,985,646 $9,087,184 $9,189,869 $9,293,715 $9,398,734 $9,504,939$2,849,703 $2,881,903 $2,914,468 $2,947,400 $2,980,704 $3,014,385 $3,048,446 $3,082,893 $3,117,728$3,076,034 $3,688,515 $4,523,600 $5,678,260 $7,298,639 $9,608,019 $12,952,350 $17,875,422 $25,244,683$3,145,737 $3,208,652 $3,272,825 $3,338,281 $3,405,047 $3,473,148 $3,542,611 $3,613,463 $3,685,732$415,698 $373,012 $380,473 $388,082 $470,844 $428,761 $411,836 $420,072 $428,474
$7,531,140 $7,531,140 $7,531,140 $7,531,140 $7,531,140 $7,531,140 $7,531,140 $7,531,140 $7,531,140
$54,606,116 $56,437,696 $57,523,867 $58,825,997 $59,624,763 $60,093,856 $59,551,620 $57,519,167 $53,160,470$0 $0 $0 $0 $0 $0 $0 $0 $0
$3,006,230 $3,100,085 $3,179,383 $3,278,698 $3,382,215 $3,496,763 $3,618,585 $3,752,704 $3,903,698$631,976,619 $652,369,231 $669,086,976 $690,040,794 $711,332,344 $734,507,815 $758,130,477 $782,731,094 $808,393,442
$0 $0 $0 $0 $0 $0 $0 $0 $0$631,976,619 $652,369,231 $669,086,976 $690,040,794 $711,332,344 $734,507,815 $758,130,477 $782,731,094 $808,393,442
$0.0715 $0.0729 $0.0740 $0.0754 $0.0769 $0.0785 $0.0801 $0.0818 $0.0835$0.0851 $0.0868 $0.0881 $0.0898 $0.0915 $0.0935 $0.0954 $0.0974 $0.0995
$26,881,816 $27,185,580 $27,492,777 $27,803,446 $28,117,624 $28,435,354 $28,756,673 $29,081,624 $29,410,246$631,976,619 $652,369,231 $669,086,976 $690,040,794 $711,332,344 $734,507,815 $758,130,477 $782,731,094 $808,393,442$658,858,435 $679,554,811 $696,579,753 $717,844,240 $739,449,969 $762,943,169 $786,887,151 $811,812,718 $837,803,688
$1,861,813,136 $1,921,066,891 $1,977,048,485 $2,039,210,466 $2,102,947,810 $2,170,138,209 $2,239,109,425 $2,310,532,679 $2,384,548,303$1,768,318,453 $1,823,991,665 $1,877,096,124 $1,935,577,570 $1,995,573,559 $2,058,667,312 $2,123,460,293 $2,190,522,665 $2,259,978,845$93,494,683 $97,075,226 $99,952,361 $103,632,896 $107,374,251 $111,470,897 $115,649,132 $120,010,013 $124,569,457
5.0% 5.1% 5.1% 5.1% 5.1% 5.1% 5.2% 5.2% 5.2%
$487,560,592 $543,998,289 $601,522,155 $660,348,152 $719,972,916 $780,066,772 $839,618,392 $897,137,559 $950,298,029

SANBAG Community Choice AggregationFinancial ProformaPortfolio ‐50% Renewable
2017 2017Load Data Jan ‐ June July ‐ Dec 2018 2019 2020 2021 2022 2023 2024 2025 2026 2027Customer AccountsDomestic 0 3,864 461,002 466,212 471,480 476,808 482,196 487,644 493,155 498,727 504,363 510,062Commercial 0 33,205 48,808 49,359 49,917 50,481 51,051 51,628 52,212 52,802 53,398 54,002Industrial 0 0 279 282 285 289 292 295 299 302 305 309Lighting & Traffic Control 0 4,096 5,952 6,020 6,088 6,156 6,226 6,296 6,367 6,439 6,512 6,586Agricultural 0 43 1,675 1,694 1,713 1,733 1,752 1,772 1,792 1,812 1,833 1,853Total Customers 0 41,208 517,717 523,567 529,483 535,466 541,517 547,636 553,824 560,083 566,412 572,812
Energy Sales (MWh)Domestic 0 48 3,394,200 3,432,554 3,471,342 3,510,568 3,550,238 3,590,355 3,630,926 3,671,956 3,713,449 3,755,411Commercial 0 80,550 2,361,973 2,388,663 2,415,655 2,442,952 2,470,558 2,498,475 2,526,708 2,555,259 2,584,134 2,613,335Industrial 0 0 1,817,576 1,838,114 1,858,885 1,879,890 1,901,133 1,922,616 1,944,341 1,966,313 1,988,532 2,011,002Lighting & Traffic Control 0 26,827 65,824 66,568 67,320 68,081 68,850 69,628 70,415 71,211 72,015 72,829Agricultural 0 11,057 265,359 268,357 271,390 274,456 277,558 280,694 283,866 287,074 290,318 293,598Total Energy Sales (MWh) 0 118,482 7,904,931 7,994,257 8,084,592 8,175,948 8,268,336 8,361,769 8,456,256 8,551,812 8,648,448 8,746,175
2017 2017CCE Operating Costs Jan ‐ June July ‐ Dec 2018 2019 2020 2021 2022 2023 2024 2025 2026 2027Power Supply $0 $6,032,329 $409,940,751 $421,359,492 $433,117,927 $445,534,854 $458,291,916 $471,270,295 $484,786,278 $498,634,313 $513,387,229 $528,761,063Billing & Data Management $0 $432,679 $7,764,423 $7,852,161 $7,940,891 $8,030,623 $8,121,369 $8,213,140 $8,305,949 $8,399,806 $8,494,724 $8,590,714SCE Fees $149,501 $1,939,421 $4,405,258 $2,575,617 $2,604,720 $2,634,152 $2,663,917 $2,694,018 $2,724,459 $2,755,244 $2,786,377 $2,817,862Technical Services $620,000 $740,000 $1,310,000 $1,356,600 $1,401,003 $1,465,319 $1,552,981 $1,669,111 $1,821,084 $2,019,393 $2,278,936 $2,620,965Staffing $90,000 $970,000 $2,488,333 $2,632,212 $2,684,856 $2,738,553 $2,793,324 $2,849,191 $2,906,175 $2,964,298 $3,023,584 $3,084,056General & Administrative expenses $90,000 $260,000 $350,000 $306,000 $312,120 $318,362 $399,730 $356,224 $337,849 $344,606 $351,498 $508,528Debt Service (CCE Bonds & Start‐up Costs) $0 $1,170,882 $9,872,904 $9,872,904 $9,872,904 $9,872,904 $8,702,022 $7,531,140 $7,531,140 $7,531,140 $7,531,140 $7,531,140Contribution to Annual Reserves $0 $3,326,217 $29,715,629 $36,950,700 $45,960,681 $50,735,321New Programs $0 $0 $0 $0 $0 $0 $55,821,177 $62,584,959 $67,362,454 $72,326,198 $76,289,957 $78,054,196Start‐Up Capital $0 ($10,000,000) $0 $0 $0 $0 $0 $0 $0 $0 $0 $0Uncollectibles $4,748 $62,727 $2,516,230 $2,569,139 $2,632,871 $2,700,051 $2,763,625 $2,601,884 $2,672,490 $2,745,143 $2,822,657 $2,904,469Total Operating Costs $954,248 $4,934,254 $468,363,529 $485,474,825 $506,527,972 $524,030,140 $541,110,061 $559,769,962 $578,447,878 $597,720,141 $616,966,102 $634,872,994Other Revenues $0 $0 $0 $0 $0 $0 $0 $0 $0 $0 $0 $0Total CCE Revenue Requirement $954,248 $4,934,254 $468,363,529 $485,474,825 $506,527,972 $524,030,140 $541,110,061 $559,769,962 $578,447,878 $597,720,141 $616,966,102 $634,872,994Average CCE Rate ($/kWh) $0.0497 $0.0592 $0.0607 $0.0627 $0.0641 $0.0654 $0.0669 $0.0684 $0.0699 $0.0713 $0.0726Average SCE Generation Rate ($/kWh) $0.0571 $0.0681 $0.0698 $0.0720 $0.0737 $0.0752 $0.0769 $0.0786 $0.0803 $0.0820 $0.0834Total CCE ChargesSCE Non‐bypassable Charges $0 $1,000,043 $67,114,353 $67,872,745 $68,639,707 $69,415,336 $70,199,729 $25,793,617 $26,085,085 $26,379,847 $26,677,939 $26,979,400CCE Revenue Requirement $954,248 $4,934,254 $468,363,529 $485,474,825 $506,527,972 $524,030,140 $541,110,061 $559,769,962 $578,447,878 $597,720,141 $616,966,102 $634,872,994Total CCE Generation Revenue Requirement $954,248 $5,934,297 $535,477,882 $553,347,570 $575,167,680 $593,445,476 $611,309,791 $585,563,579 $604,532,963 $624,099,988 $643,644,041 $661,852,393
Bundled SCE Revenues $0 $18,296,669 $1,351,759,556 $1,397,071,297 $1,447,722,341 $1,495,125,726 $1,542,903,988 $1,593,385,654 $1,644,803,337 $1,697,848,344 $1,751,837,051 $1,805,291,234Total CCE Customer Bill Revenues (Power Supply and Delivery) $0 $17,776,245 $1,306,158,609 $1,349,189,033 $1,396,972,863 $1,442,042,787 $1,487,553,868 $1,535,535,483 $1,584,453,681 $1,634,913,687 $1,686,324,653 $1,737,404,554 Savings $0 $520,424 $45,600,947 $47,882,263 $50,749,479 $53,082,939 $55,350,120 $57,850,170 $60,349,655 $62,934,657 $65,512,398 $67,886,680 Percent Savings 2.8% 3.4% 3.4% 3.5% 3.6% 3.6% 3.6% 3.7% 3.7% 3.7% 3.8%
Cumulative Reserves $3,326,217 $33,041,846 $69,992,545 $115,953,226 $166,688,548 $222,509,725 $285,094,683 $352,457,137 $424,783,336 $501,073,293 $579,127,489Reserve Target $126,440,563

SANBAG Community Choice AggregationFinancial ProformaPortfolio ‐50% Renewable
Load DataCustomer AccountsDomesticCommercialIndustrialLighting & Traffic ControlAgriculturalTotal Customers
Energy Sales (MWh)DomesticCommercialIndustrialLighting & Traffic ControlAgriculturalTotal Energy Sales (MWh)
CCE Operating CostsPower SupplyBilling & Data ManagementSCE FeesTechnical ServicesStaffingGeneral & Administrative expensesDebt Service (CCE Bonds & Start‐up Costs)Contribution to Annual ReservesNew ProgramsStart‐Up CapitalUncollectiblesTotal Operating CostsOther RevenuesTotal CCE Revenue RequirementAverage CCE Rate ($/kWh)Average SCE Generation Rate ($/kWh)Total CCE ChargesSCE Non‐bypassable ChargesCCE Revenue RequirementTotal CCE Generation Revenue Requirement
Bundled SCE RevenuesTotal CCE Customer Bill Revenues (Power Supply and Delivery) Savings Percent Savings
Cumulative ReservesReserve Target
2028 2029 2030 2031 2032 2033 2034 2035 2036
515,826 521,655 527,550 533,511 539,540 545,636 551,802 558,037 564,34354,612 55,229 55,853 56,484 57,122 57,768 58,421 59,081 59,749
312 316 319 323 327 330 334 338 06,660 6,735 6,812 6,889 6,966 7,045 7,125 7,205 01,874 1,896 1,917 1,939 1,960 1,983 2,005 2,028 0
579,285 585,831 592,451 599,145 605,916 612,763 619,687 626,689 624,092
3,797,847 3,840,763 3,884,163 3,928,054 3,972,442 4,017,330 4,062,726 4,108,635 4,155,0622,642,865 2,672,730 2,702,932 2,733,475 2,764,363 2,795,600 2,827,191 2,859,138 2,891,4462,033,727 2,056,708 2,079,949 2,103,452 2,127,221 2,151,259 2,175,568 2,200,152 2,225,013
73,652 74,484 75,326 76,177 77,038 77,909 78,789 79,679 80,580296,916 300,271 303,664 307,095 310,566 314,075 317,624 321,213 324,843
8,845,007 8,944,955 9,046,033 9,148,254 9,251,629 9,356,172 9,461,897 9,568,817 9,676,944
2028 2029 2030 2031 2032 2033 2034 2035 2036$544,480,927 $561,496,738 $580,875,978 $599,067,291 $617,551,808 $637,671,875 $658,180,175 $679,537,499 $701,816,578
$8,687,789 $8,785,961 $8,885,243 $8,985,646 $9,087,184 $9,189,869 $9,293,715 $9,398,734 $9,504,939$2,849,703 $2,881,903 $2,914,468 $2,947,400 $2,980,704 $3,014,385 $3,048,446 $3,082,893 $3,117,728$3,076,034 $3,688,515 $4,523,600 $5,678,260 $7,298,639 $9,608,019 $12,952,350 $17,875,422 $25,244,683$3,145,737 $3,208,652 $3,272,825 $3,338,281 $3,405,047 $3,473,148 $3,542,611 $3,613,463 $3,685,732$415,698 $373,012 $380,473 $388,082 $470,844 $428,761 $411,836 $420,072 $428,474
$7,531,140 $7,531,140 $7,531,140 $7,531,140 $7,531,140 $7,531,140 $7,531,140 $7,531,140 $7,531,140
$81,374,841 $84,626,453 $81,419,830 $83,470,311 $85,029,490 $86,326,278 $86,627,708 $85,473,849 $82,031,664$0 $0 $0 $0 $0 $0 $0 $0 $0
$2,985,344 $3,075,758 $3,179,383 $3,278,698 $3,382,215 $3,496,763 $3,618,585 $3,752,704 $3,903,698$654,547,213 $675,668,132 $692,982,939 $714,685,109 $736,737,071 $760,740,237 $785,206,566 $810,685,776 $837,264,636
$0 $0 $0 $0 $0 $0 $0 $0 $0$654,547,213 $675,668,132 $692,982,939 $714,685,109 $736,737,071 $760,740,237 $785,206,566 $810,685,776 $837,264,636
$0.0740 $0.0755 $0.0766 $0.0781 $0.0796 $0.0813 $0.0830 $0.0847 $0.0865$0.0851 $0.0868 $0.0881 $0.0898 $0.0915 $0.0935 $0.0954 $0.0974 $0.0995
$26,881,816 $27,185,580 $27,492,777 $27,803,446 $28,117,624 $28,435,354 $28,756,673 $29,081,624 $29,410,246$654,547,213 $675,668,132 $692,982,939 $714,685,109 $736,737,071 $760,740,237 $785,206,566 $810,685,776 $837,264,636$681,429,028 $702,853,712 $720,475,716 $742,488,554 $764,854,695 $789,175,591 $813,963,239 $839,767,400 $866,674,882
$1,861,813,136 $1,921,066,891 $1,977,048,485 $2,039,210,466 $2,102,947,810 $2,170,138,209 $2,239,109,425 $2,310,532,679 $2,384,548,303$1,790,889,047 $1,847,290,566 $1,900,992,087 $1,960,221,884 $2,020,978,286 $2,084,899,734 $2,150,536,382 $2,218,477,347 $2,288,850,040$70,924,090 $73,776,325 $76,056,398 $78,988,582 $81,969,524 $85,238,475 $88,573,044 $92,055,332 $95,698,263
3.8% 3.8% 3.8% 3.9% 3.9% 3.9% 4.0% 4.0% 4.0%
$660,502,330 $745,128,783 $826,548,613 $910,018,924 $995,048,414 $1,081,374,693 $1,168,002,401 $1,253,476,250 $1,335,507,915

SANBAG Community Choice AggregationFinancial ProformaPortfolio ‐100% Renewable
2017 2017Load Data Jan ‐ June July ‐ Dec 2018 2019 2020 2021 2022 2023 2024 2025 2026 2027Customer AccountsDomestic 0 3,864 461,002 466,212 471,480 476,808 482,196 487,644 493,155 498,727 504,363 510,062Commercial 0 33,205 48,808 49,359 49,917 50,481 51,051 51,628 52,212 52,802 53,398 54,002Industrial 0 0 279 282 285 289 292 295 299 302 305 309Lighting & Traffic Control 0 4,096 5,952 6,020 6,088 6,156 6,226 6,296 6,367 6,439 6,512 6,586Agricultural 0 43 1,675 1,694 1,713 1,733 1,752 1,772 1,792 1,812 1,833 1,853Total Customers 0 41,208 517,717 523,567 529,483 535,466 541,517 547,636 553,824 560,083 566,412 572,812
Energy Sales (MWh)Domestic 0 48 3,394,200 3,432,554 3,471,342 3,510,568 3,550,238 3,590,355 3,630,926 3,671,956 3,713,449 3,755,411Commercial 0 80,550 2,361,973 2,388,663 2,415,655 2,442,952 2,470,558 2,498,475 2,526,708 2,555,259 2,584,134 2,613,335Industrial 0 0 1,817,576 1,838,114 1,858,885 1,879,890 1,901,133 1,922,616 1,944,341 1,966,313 1,988,532 2,011,002Lighting & Traffic Control 0 26,827 65,824 66,568 67,320 68,081 68,850 69,628 70,415 71,211 72,015 72,829Agricultural 0 11,057 265,359 268,357 271,390 274,456 277,558 280,694 283,866 287,074 290,318 293,598Total Energy Sales (MWh) 0 118,482 7,904,931 7,994,257 8,084,592 8,175,948 8,268,336 8,361,769 8,456,256 8,551,812 8,648,448 8,746,175
2017 2017CCE Operating Costs Jan ‐ June July ‐ Dec 2018 2019 2020 2021 2022 2023 2024 2025 2026 2027Power Supply $0 $8,054,913 $536,576,640 $549,138,715 $562,272,029 $576,365,622 $590,588,068 $605,302,786 $620,418,253 $636,081,141 $652,426,823 $669,500,366Billing & Data Management $0 $432,679 $7,764,423 $7,852,161 $7,940,891 $8,030,623 $8,121,369 $8,213,140 $8,305,949 $8,399,806 $8,494,724 $8,590,714SCE Fees $149,501 $1,939,421 $4,405,258 $2,575,617 $2,604,720 $2,634,152 $2,663,917 $2,694,018 $2,724,459 $2,755,244 $2,786,377 $2,817,862Technical Services $620,000 $740,000 $1,310,000 $1,356,600 $1,401,003 $1,465,319 $1,552,981 $1,669,111 $1,821,084 $2,019,393 $2,278,936 $2,620,965Staffing $90,000 $970,000 $2,488,333 $2,632,212 $2,684,856 $2,738,553 $2,793,324 $2,849,191 $2,906,175 $2,964,298 $3,023,584 $3,084,056General & Administrative expenses $90,000 $260,000 $350,000 $306,000 $312,120 $318,362 $399,730 $356,224 $337,849 $344,606 $351,498 $508,528Debt Service (CCE Bonds & Start‐up Costs) $0 $1,170,882 $9,872,904 $9,872,904 $9,872,904 $9,872,904 $8,702,022 $7,531,140 $7,531,140 $7,531,140 $7,531,140 $7,531,140Contribution to Annual Reserves $0 $2,850,249 $26,266,804 $36,876,500 $50,070,502 $57,787,103New Programs $0 $0 $0 $0 $0 $0 $65,915,629 $75,867,468 $83,975,321 $92,210,104 $99,661,146 $104,451,184Start‐Up Capital $0 ($10,000,000) $0 $0 $0 $0 $0 $0 $0 $0 $0 $0Uncollectibles $4,748 $72,840 $3,149,410 $3,208,035 $3,278,641 $3,354,204 $3,425,106 $3,272,046 $3,350,650 $3,432,377 $3,517,855 $3,608,165Total Operating Costs $954,248 $6,490,984 $592,183,773 $613,818,744 $640,437,666 $662,566,843 $684,162,147 $707,755,124 $731,370,880 $755,738,110 $780,072,083 $802,712,980Other Revenues $0 $0 $0 $0 $0 $0 $0 $0 $0 $0 $0 $0Total CCE Revenue Requirement $954,248 $6,490,984 $592,183,773 $613,818,744 $640,437,666 $662,566,843 $684,162,147 $707,755,124 $731,370,880 $755,738,110 $780,072,083 $802,712,980Average CCE Rate ($/kWh) $0.0628 $0.0749 $0.0768 $0.0792 $0.0810 $0.0827 $0.0846 $0.0865 $0.0884 $0.0902 $0.0918Average SCE Generation Rate ($/kWh) $0.0571 $0.0681 $0.0698 $0.0720 $0.0737 $0.0752 $0.0769 $0.0786 $0.0803 $0.0820 $0.0834Total CCE ChargesSCE Non‐bypassable Charges $0 $1,000,043 $67,114,353 $67,872,745 $68,639,707 $69,415,336 $70,199,729 $25,793,617 $26,085,085 $26,379,847 $26,677,939 $26,979,400CCE Revenue Requirement $954,248 $6,490,984 $592,183,773 $613,818,744 $640,437,666 $662,566,843 $684,162,147 $707,755,124 $731,370,880 $755,738,110 $780,072,083 $802,712,980Total CCE Generation Revenue Requirement $954,248 $7,491,027 $659,298,126 $681,691,489 $709,077,373 $731,982,179 $754,361,876 $733,548,742 $757,455,965 $782,117,956 $806,750,022 $829,692,380
Bundled SCE Revenues $0 $18,296,669 $1,351,759,556 $1,397,071,297 $1,447,722,341 $1,495,125,726 $1,542,903,988 $1,593,385,654 $1,644,803,337 $1,697,848,344 $1,751,837,051 $1,805,291,234Total CCE Customer Bill Revenues (Power Supply and Delivery) $0 $19,332,976 $1,429,978,853 $1,477,532,952 $1,530,882,557 $1,580,579,491 $1,630,605,953 $1,683,520,646 $1,737,376,684 $1,792,931,655 $1,849,430,634 $1,905,244,541 Savings $0 ($1,036,307) ($78,219,296) ($80,461,656) ($83,160,215) ($85,453,765) ($87,701,965) ($90,134,992) ($92,573,347) ($95,083,311) ($97,593,583) ($99,953,307) Percent Savings ‐5.7% ‐5.8% ‐5.8% ‐5.7% ‐5.7% ‐5.7% ‐5.7% ‐5.6% ‐5.6% ‐5.6% ‐5.5%
Cumulative Reserves $2,850,249 $29,117,053 $65,993,553 $116,064,055 $173,851,157 $239,766,786 $315,634,254 $399,609,575 $491,819,679 $591,480,825 $695,932,009Reserve Target $158,257,831
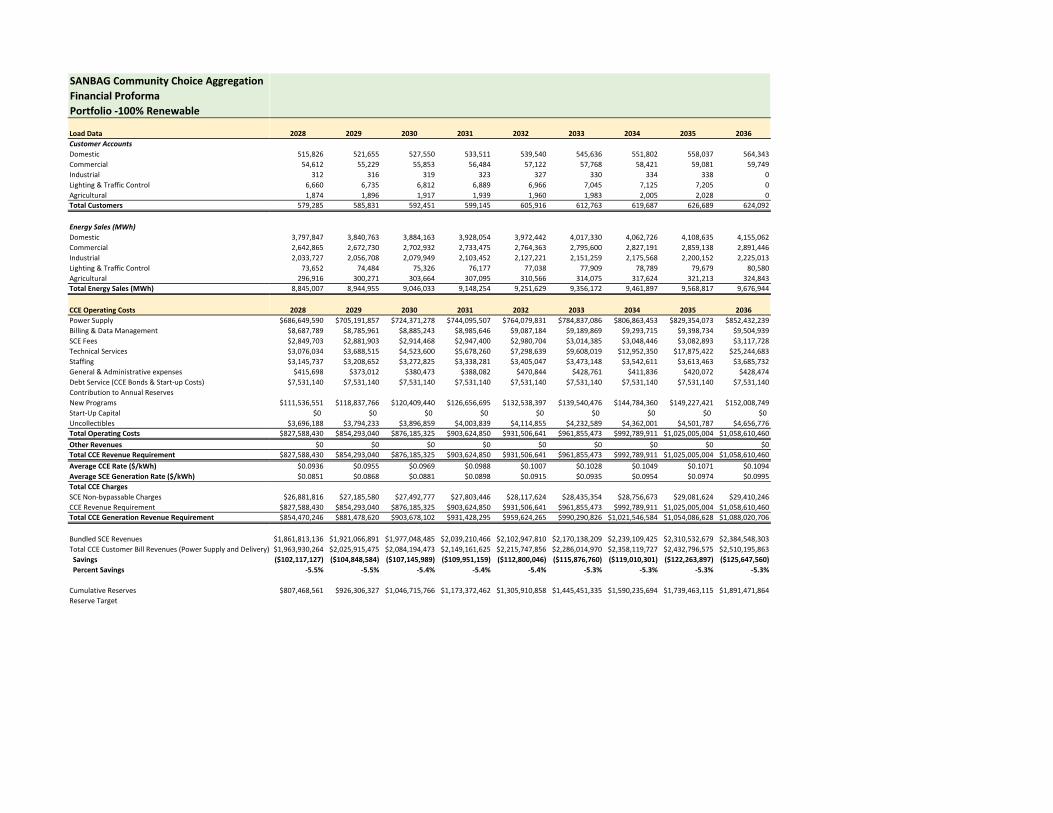
SANBAG Community Choice AggregationFinancial ProformaPortfolio ‐100% Renewable
Load DataCustomer AccountsDomesticCommercialIndustrialLighting & Traffic ControlAgriculturalTotal Customers
Energy Sales (MWh)DomesticCommercialIndustrialLighting & Traffic ControlAgriculturalTotal Energy Sales (MWh)
CCE Operating CostsPower SupplyBilling & Data ManagementSCE FeesTechnical ServicesStaffingGeneral & Administrative expensesDebt Service (CCE Bonds & Start‐up Costs)Contribution to Annual ReservesNew ProgramsStart‐Up CapitalUncollectiblesTotal Operating CostsOther RevenuesTotal CCE Revenue RequirementAverage CCE Rate ($/kWh)Average SCE Generation Rate ($/kWh)Total CCE ChargesSCE Non‐bypassable ChargesCCE Revenue RequirementTotal CCE Generation Revenue Requirement
Bundled SCE RevenuesTotal CCE Customer Bill Revenues (Power Supply and Delivery) Savings Percent Savings
Cumulative ReservesReserve Target
2028 2029 2030 2031 2032 2033 2034 2035 2036
515,826 521,655 527,550 533,511 539,540 545,636 551,802 558,037 564,34354,612 55,229 55,853 56,484 57,122 57,768 58,421 59,081 59,749
312 316 319 323 327 330 334 338 06,660 6,735 6,812 6,889 6,966 7,045 7,125 7,205 01,874 1,896 1,917 1,939 1,960 1,983 2,005 2,028 0
579,285 585,831 592,451 599,145 605,916 612,763 619,687 626,689 624,092
3,797,847 3,840,763 3,884,163 3,928,054 3,972,442 4,017,330 4,062,726 4,108,635 4,155,0622,642,865 2,672,730 2,702,932 2,733,475 2,764,363 2,795,600 2,827,191 2,859,138 2,891,4462,033,727 2,056,708 2,079,949 2,103,452 2,127,221 2,151,259 2,175,568 2,200,152 2,225,013
73,652 74,484 75,326 76,177 77,038 77,909 78,789 79,679 80,580296,916 300,271 303,664 307,095 310,566 314,075 317,624 321,213 324,843
8,845,007 8,944,955 9,046,033 9,148,254 9,251,629 9,356,172 9,461,897 9,568,817 9,676,944
2028 2029 2030 2031 2032 2033 2034 2035 2036$686,649,590 $705,191,857 $724,371,278 $744,095,507 $764,079,831 $784,837,086 $806,863,453 $829,354,073 $852,432,239
$8,687,789 $8,785,961 $8,885,243 $8,985,646 $9,087,184 $9,189,869 $9,293,715 $9,398,734 $9,504,939$2,849,703 $2,881,903 $2,914,468 $2,947,400 $2,980,704 $3,014,385 $3,048,446 $3,082,893 $3,117,728$3,076,034 $3,688,515 $4,523,600 $5,678,260 $7,298,639 $9,608,019 $12,952,350 $17,875,422 $25,244,683$3,145,737 $3,208,652 $3,272,825 $3,338,281 $3,405,047 $3,473,148 $3,542,611 $3,613,463 $3,685,732$415,698 $373,012 $380,473 $388,082 $470,844 $428,761 $411,836 $420,072 $428,474
$7,531,140 $7,531,140 $7,531,140 $7,531,140 $7,531,140 $7,531,140 $7,531,140 $7,531,140 $7,531,140
$111,536,551 $118,837,766 $120,409,440 $126,656,695 $132,538,397 $139,540,476 $144,784,360 $149,227,421 $152,008,749$0 $0 $0 $0 $0 $0 $0 $0 $0
$3,696,188 $3,794,233 $3,896,859 $4,003,839 $4,114,855 $4,232,589 $4,362,001 $4,501,787 $4,656,776$827,588,430 $854,293,040 $876,185,325 $903,624,850 $931,506,641 $961,855,473 $992,789,911 $1,025,005,004 $1,058,610,460
$0 $0 $0 $0 $0 $0 $0 $0 $0$827,588,430 $854,293,040 $876,185,325 $903,624,850 $931,506,641 $961,855,473 $992,789,911 $1,025,005,004 $1,058,610,460
$0.0936 $0.0955 $0.0969 $0.0988 $0.1007 $0.1028 $0.1049 $0.1071 $0.1094$0.0851 $0.0868 $0.0881 $0.0898 $0.0915 $0.0935 $0.0954 $0.0974 $0.0995
$26,881,816 $27,185,580 $27,492,777 $27,803,446 $28,117,624 $28,435,354 $28,756,673 $29,081,624 $29,410,246$827,588,430 $854,293,040 $876,185,325 $903,624,850 $931,506,641 $961,855,473 $992,789,911 $1,025,005,004 $1,058,610,460$854,470,246 $881,478,620 $903,678,102 $931,428,295 $959,624,265 $990,290,826 $1,021,546,584 $1,054,086,628 $1,088,020,706
$1,861,813,136 $1,921,066,891 $1,977,048,485 $2,039,210,466 $2,102,947,810 $2,170,138,209 $2,239,109,425 $2,310,532,679 $2,384,548,303$1,963,930,264 $2,025,915,475 $2,084,194,473 $2,149,161,625 $2,215,747,856 $2,286,014,970 $2,358,119,727 $2,432,796,575 $2,510,195,863($102,117,127) ($104,848,584) ($107,145,989) ($109,951,159) ($112,800,046) ($115,876,760) ($119,010,301) ($122,263,897) ($125,647,560)
‐5.5% ‐5.5% ‐5.4% ‐5.4% ‐5.4% ‐5.3% ‐5.3% ‐5.3% ‐5.3%
$807,468,561 $926,306,327 $1,046,715,766 $1,173,372,462 $1,305,910,858 $1,445,451,335 $1,590,235,694 $1,739,463,115 $1,891,471,864

DRAFT
INLAND CHOICE POWER – COMMUNITY CHOICE AGGREGATION BUSINESS PLAN 77
Appendix C – ICP Excluding Riverside County
Introduction
Riverside County (County) has already been exploring developing a Community Choice Aggregation Program for the unincorporated Riverside County separate from ICP. The County is interested in hiring a third party to operate the CCA on behalf of the County, rather than joining a Joint Power Agreement with other public entities.
This Appendix provides the estimated cost impact of Riverside County not joining the ICP CCA given the 50% Renewable Scenario.
Analysis
Based on the data received by SCE, Riverside County load makes up approximately 9 percent of the total ICP load. This scenario was therefore modeled assuming the ICP load and the number of customers would be reduced by 9 percent.
Power supply, data management, billing, SCE charges and non-bypassable charges were reduced to reflect the lower load and number of customers. It was assumed that ICP without the County would still need the same number of staff, operating and administrative costs, and consultant services as the 9 percent reduction in load would not significantly reduce the level of effort required in these areas.
Results
Based on the analysis, the overall savings to ICP customers are reduced from 3.7 percent to 3.2 percent. Savings are reduced largely because the fixed costs needed to operate the CCA remain nearly unchanged while the generation revenues decrease with the load. Table C-1 provides a summary of the projected cost impacts and savings for 2018, while the following pages provide the proforma for the ICP without County analysis for all three power supply scenarios.
Table C-1 Savings Comparison Under the 50% Renewable Scenario
ICP ICP without Riverside County
Power Supply Expenses $738.9 million $643.2 million
Non-Power Supply Expenses $104.1 million $103.1 million
SCE Non-bypassable Charges $120.3 million $105.4 million
Total $963.3 million $851.7 million
Bundled SCE Rate $2,492.1 million $2,173.2 million
CCA Total Bill $2,384.4 million $2,104.1 million
Savings $93.7 million $69.0 million
3.8% 3.2%

DRAFT
INLAND CHOICE POWER – COMMUNITY CHOICE AGGREGATION BUSINESS PLAN 78
Appendix D – Glossary
aMW: Average annual Megawatt. A unit of energy output over a year that is equal to the energy produced by the continuous operation of one megawatt of capacity over a period of time (8,760 megawatt-hours).
Basis Difference (Natural Gas): The difference between the price of natural gas at the Henry Hub natural gas distribution point in Erath, Louisiana, which serves as a central pricing point for natural gas futures, and the natural gas price at another hub location (such as for Southern California).
Buckets: Buckets 1-3 refer to different types of renewable energy contracts according to the Renewable Portfolio Standards requirements. Bucket 1 are traditional contracts for delivery of electricity directly from a generator within or immediately connected to California. These are the most valuable and make up the majority of the RECS that are required for LSEs to be RPS compliant. Buckets 2 and 3 have different levels of intermediation between the generation and delivery of the energy from the generating resources.
Bundled Customers: Electricity customers who receive all their services (transmission, distribution and supply) from the Investor-Owned Utility.
CAISO: The California Independent System Operator. The organization responsible for managing the electricity grid and system reliability within the former service territories of the three California IOUs.
California Clean Power (CCP): A private company providing wholesale supply and other services to CCAs.
California Energy Commission (CEC): The state regulatory agency with primary responsibility for enforcing the Renewable Portfolio Standards law as well as a number of other, electric-industry related rules and policies.
California Public Utilities Commission (CPUC): The state agency with primary responsibility for regulating IOUs, as well as Direct Access (ESP) and CCA entities.
Capacity Factor: the ratio of an electricity generating resource’s actual output over a period of time to its potential output if it were possible to operate at full nameplate capacity continuously over the same period. Intermittent renewable resources, like wind and solar, typically have lower capacity factors than traditional fossil fuel plants because the wind and sun do not blow or shine consistently.
CCEAC: Community Choice Energy Advisory Committee - a committee formed to advise the City of Davis on the best options for pursuing a CCA.

DRAFT
INLAND CHOICE POWER – COMMUNITY CHOICE AGGREGATION BUSINESS PLAN 79
Climate Zone: A geographic area with distinct climate patterns necessitating varied energy demands for heating and cooling.
Coachella Valley Association of Governments (CVAG): CVAG is the regional planning agency coordinating government services in the Coachella Valley. It includes 10 Cities, Riverside County, the Agua Caliente Band of Cahuilla Indians and the Cabazon Band of Mission Indians as members.
Coincident Peak: Demand for electricity among a group of customers that coincides with peak total demand on the system.
Community Choice Aggregation: Method available through California law to allow Cities and Counties to aggregate their citizens and become their electric generation provider.
Community Choice Energy: A City, County or Joint Powers Agency procuring wholesale power to supply to retail customers.
Community Choice Partners: A private company providing services to CCAs in California.
Congestion Revenue Rights (CRRs): Financial rights that are allocated to Load Serving Entities to offset differences between the prices where their generation is located and the price that they pay to serve their load. These rights may also be bought and sold through an auction process. CRRs are part of the CAISO market design.
Demand Response (DR): Electric customers who have a contract to modify their electricity usage in response to requests from a utility or other electric entity. Typically, will be used to lower demand during peak energy periods, but may be used to raise demand during periods of excess supply.
Direct Access: Large power consumers which have opted to procure their wholesale supply independently of the IOUs through an Electricity Service Provider.
EEI (Edison Electric Institute) Agreement: A commonly used enabling agreement for transacting in wholesale power markets.
Electric Service Providers (ESP): An alternative to traditional utilities. They provide electric services to retail customers in electricity markets that have opened their retail electricity markets to competition. In California the Direct Access program allows large electricity customers to opt-out of utility-supplied power in favor of ESP-provided power. However, there is a cap on the amount of Direct Access load permitted in the state.
Electric Tariffs: The rates and terms applied to customers by electric utilities. Typically have different tariffs for different classes of customers and possibly for different supply mixes.
Enterprise Model: When a City or County establish a CCA by themselves as an enterprise within the municipal government.

DRAFT
INLAND CHOICE POWER – COMMUNITY CHOICE AGGREGATION BUSINESS PLAN 80
Federal Tax Incentives: There are two Federal tax incentive programs. The Investment Tax Credit (ITC) provides payments to solar generators. The Production Tax Credit (PTC) provides payments to wind generators.
Feed-in Tariff: A tariff that specifies what generators who are connected to the distribution system are paid.
Forward Prices: Prices for contracts that specify a future delivery date for a commodity or other security. There are active, liquid forward markets for electricity to be delivered at a number of Western electricity trading hubs, including NP15 which corresponds closely to the price location which the City of Davis will pay to supply its load.
Implied Heat Rate: A calculation of the day-ahead electric price divided by the day-ahead natural gas price. Implied heat rate is also known as the ‘break-even natural gas market heat rate,’ because only a natural gas generator with an operating heat rate (measure of unit efficiency) below the implied heat rate value can make money by burning natural gas to generate power. Natural gas plants with a higher operating heat rate cannot make money at the prevailing electricity and natural gas prices.
Inland Choice Power (ICP): The name of the proposed CCA that would serve the ICP areas of CVAG, SANBAG, and WRCOG.
Integrated Resource Plan: A utility's plan for future generation supply needs.
Investor-Owned Utility: For profit regulated utilities. Within California there are three IOUs - Pacific Gas and Electric, Southern California Edison and San Diego Gas and Electric.
ISDA (International Swaps and Derivatives Association): Popular form of bilateral contract to facilitate wholesale electricity trading.
Joint Powers Agency (JPA): A legal entity comprising two or more public entities. The JPA provides a separation of financial and legal responsibility from its member entities.
Lancaster Choice Energy (LCE): The most recent California CCA to go-live, exclusively serving the City of Lancaster in Southern California.
LEAN Energy (Local Energy Aggregation Network): A not-for-profit organization dedicated to expanding Community Choice Aggregation nationwide.
Load Forecast: A forecast of expected load over some future time horizon. Short-term load forecasts are used to determine what supply sources are needed. Longer-term load forecasts are used for budgeting and long-term resource planning.
Marginal Unit: An additional unit of power generation to what is currently being produced. At and electric power plant, the cost to produce a marginal unit is used to determine the cost of increasing power generation at that source.
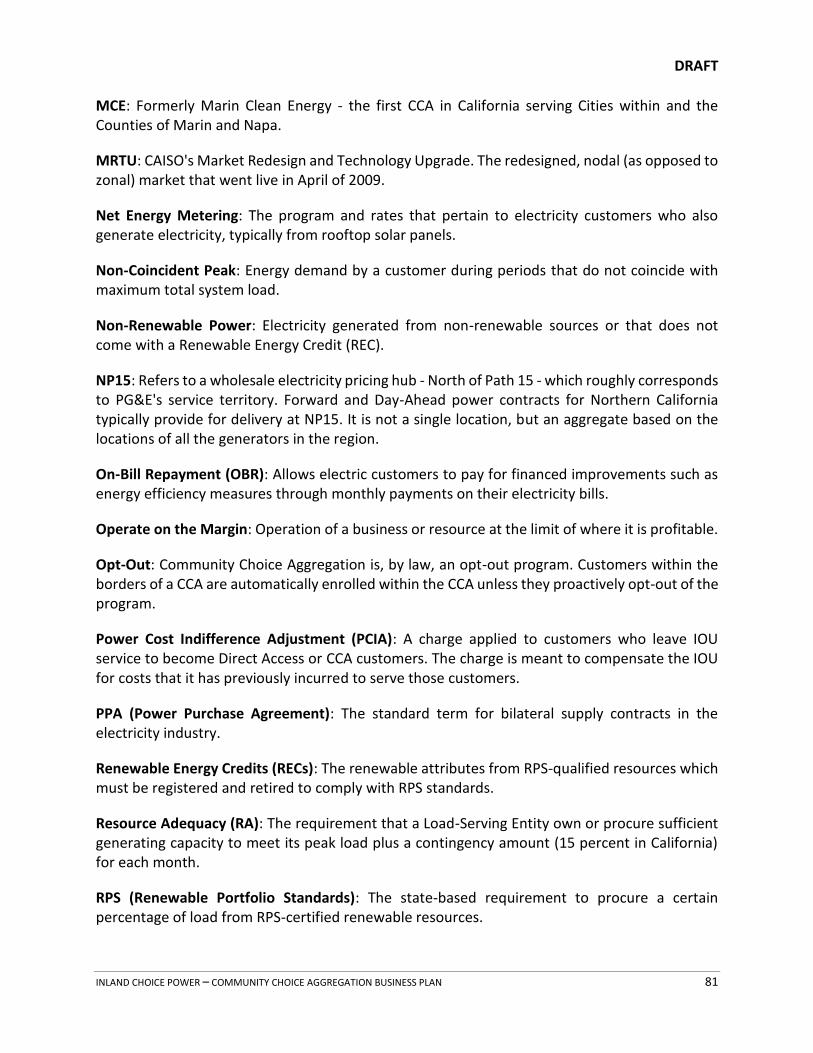
DRAFT
INLAND CHOICE POWER – COMMUNITY CHOICE AGGREGATION BUSINESS PLAN 81
MCE: Formerly Marin Clean Energy - the first CCA in California serving Cities within and the Counties of Marin and Napa.
MRTU: CAISO's Market Redesign and Technology Upgrade. The redesigned, nodal (as opposed to zonal) market that went live in April of 2009.
Net Energy Metering: The program and rates that pertain to electricity customers who also generate electricity, typically from rooftop solar panels.
Non-Coincident Peak: Energy demand by a customer during periods that do not coincide with maximum total system load.
Non-Renewable Power: Electricity generated from non-renewable sources or that does not come with a Renewable Energy Credit (REC).
NP15: Refers to a wholesale electricity pricing hub - North of Path 15 - which roughly corresponds to PG&E's service territory. Forward and Day-Ahead power contracts for Northern California typically provide for delivery at NP15. It is not a single location, but an aggregate based on the locations of all the generators in the region.
On-Bill Repayment (OBR): Allows electric customers to pay for financed improvements such as energy efficiency measures through monthly payments on their electricity bills.
Operate on the Margin: Operation of a business or resource at the limit of where it is profitable.
Opt-Out: Community Choice Aggregation is, by law, an opt-out program. Customers within the borders of a CCA are automatically enrolled within the CCA unless they proactively opt-out of the program.
Power Cost Indifference Adjustment (PCIA): A charge applied to customers who leave IOU service to become Direct Access or CCA customers. The charge is meant to compensate the IOU for costs that it has previously incurred to serve those customers.
PPA (Power Purchase Agreement): The standard term for bilateral supply contracts in the electricity industry.
Renewable Energy Credits (RECs): The renewable attributes from RPS-qualified resources which must be registered and retired to comply with RPS standards.
Resource Adequacy (RA): The requirement that a Load-Serving Entity own or procure sufficient generating capacity to meet its peak load plus a contingency amount (15 percent in California) for each month.
RPS (Renewable Portfolio Standards): The state-based requirement to procure a certain percentage of load from RPS-certified renewable resources.

DRAFT
INLAND CHOICE POWER – COMMUNITY CHOICE AGGREGATION BUSINESS PLAN 82
San Bernardino Associated Governments (SANBAG): SANBAG is the council of government and transportation planning agency for San Bernardino County. SANBAG’s members include 24 cities and San Bernardino County.
Scheduling Coordinator: An entity that is approved to interact directly with CAISO to schedule load and generation. All CAISO participants must be or have an SC.
Scheduling Agent: A person or service that forecasts and monitors short term system load requirements and meets these demands by scheduling power resource to meet that demand.
Sonoma Clean Power (SCP): A CCA serving Sonoma County and Sonoma County Cities.
Spark Spread: The theoretical grow margin of a gas-fired power plant from selling a unit of electricity, having bought the fuel required to produce this unit of electricity. All other costs (capital, operation and maintenance, etc.) must be covered from the spark spread.
Supply Stack: Refers to the generators within a region, stacked up according to their marginal cost to supply energy. Renewables are on the bottom of the stack and peaking gas generators on the top. Used to provide insights into how the price of electricity is likely to change as the load changes.
ICP: Refers collectively to the three councils of governments: Coachella Valley Association of Governments (CVAG), San Bernardino Associated Governments (SANBAG), and Western Riverside Council of Governments (WRCOG).
Weather Adjusted: Normalizing energy use data based on differences in the weather during the time of use. For instance, energy use is expected to be higher on extremely hot days when air conditioning is in higher demand than on days with comfortable temperature. Weather adjustment normalizes for this variation.
Western Electric Coordinating Council (WECC): The organization responsible for coordinating planning and operation on the Western electric grid.
Western Riverside Council of Governments (WRCOG): WRCOG is the council of governments in Western Riverside County consisting of 17 Cities, Riverside County, and the Morongo Band of Mission Indians.
Wholesale Power: Large amounts of electricity that are bought and sold by utilities and other electric companies in bulk at specific trading hubs. Quantities are measured in MWs, and a standard wholesale contract is for 25 MW for a month during heavy-load or peak hours (7am to 10 pm, Mon-Sat), or light-load or off-peak hours (all the other hours).
WSPP (Western States Power Pool) Agreement: Common, standardized enabling agreement to transact in the wholesale power markets.