ITAU BBA - CONSOLIDATED FINANCIAL STATEMENTS
35
ITAU BBA - CONSOLIDATED FINANCIAL STATEMENTS FROM JANUARY 1 TO DECEMBER 31, 2009 AND 2008
Transcript of ITAU BBA - CONSOLIDATED FINANCIAL STATEMENTS

ITAU BBA - CONSOLIDATED
FINANCIAL STATEMENTS
FROM JANUARY 1 TO DECEMBER 31, 2009 AND 2008

BANCO ITAÚ BBA S.A. MANAGEMENT REPORT To our Stockholders: We present the Management Report and the financial statements of Banco Itaú BBA S.A. (Itaú BBA) for the period from January 1 to December 2009 and 2008, in accordance with the regulations established by the Central Bank of Brazil (BACEN). ECONOMIC ENVIRONMENT AND BANKING SECTOR The Brazilian economic activity showed a strong reinvigoration, mainly in industry, from January. Since then, the industrial production grew for ten consecutive months, posting an accumulated increase of 19.1% in November as compared with December 2008. Despite the sequence of monthly increases, production in industry still accumulated a decrease of 9.3% between January and November 2009, as compared with the same period of 2008. Strong growth is expected for the Brazilian economy in 2010, consolidating the scenario of reinvigoration already noticeable in the employment and the investment data as from the third quarter of 2009. Essential for such reinvigoration was the quick recovery of the domestic bank credit. In December, credit reached 45% of GDP. NET INCOME AND STOCKHOLDERS' EQUITY Itaú BBA net income totaled R$ 1,846 million for the period and stockholders' equity totaled R$ 6,387 million. Net income per thousand shares was R$ 174,75 whereas its book value per thousand shares was R$ 604,28. ASSETS AND FUNDS RAISED Assets totaled R$ 126,995 million and were substantially made up of R$ 71,405 million of Interbank Investments and Securities and Derivative Financial Instruments, and R$ 51,237 million of Loan, Lease, Other Credit Operations and Foreign Exchange Portfolio. Raised and Managed Funds represented R$ 109,207 million. CIRCULAR LETTER No. 3,068/01 OF BACEN Itaú BBA S.A. hereby represents to have the financial capacity and the intention to hold to maturity securities classified under the line “held-to-maturity securities” in the balance sheet, in the amount of R$ 81 million, corresponding to only 0.27% of total securities held. ACKNOWLEDGEMENTS We thank our shareholders for their indispensable support and trust to the continuous development achieved by Itaú BBA. To our employees, we express our recognition for their determination and commitment. To our clients, our thanks for their trust and loyalty, which we try to repay with differentiated products and services. São Paulo, February 19, 2010. Executive Board

BOARD OF DIRECTORS DirectorsADRIANO LIMA BORGES
Chairman ALBERTO ZOFFMANN DO ESPÍRITO SANTOROBERTO EGYDIO SETUBAL ALEXANDRE ENRICO SILVA FIGLIOLINO
ANDRÉ FERRARI Vice-Chairmen ANDRÉ LUIZ HELMEISTER
FERNÃO CARLOS BOTELHO BRACHER ANTONIO JOSÉ CALHEIROS RIBEIRO FERREIRAPEDRO MOREIRA SALLES EDUARDO CARDOSO ARMONIA
EDUARDO CORSETTI Members ELAINE CRISTINA ZANATTA RODRIGUES VASQUINHO
ALFREDO EGYDIO SETUBAL EMERSON SAVI JUNQUEIRACANDIDO BOTELHO BRACHER FÁBIO DE SOUZA QUEIROZ FERRAZEDUARDO MAZZILLI DE VASSIMON FABIO MASSASHI OKUMURAHENRI PENCHAS FERNANDO FONTES IUNESJOÃO DIONÍSIO FILGUEIRA BARRETO AMOÊDO FRANCISCO DE ASSIS CREMASÉRGIO RIBEIRO DA COSTA WERLANG GILBERTO FRUSSA
GUSTAVO HENRIQUE PENHA TAVARESGUILHERME DE ALENCAR AMADO
EXECUTIVE BOARD ILAN GOLDFAJN JOÃO CARLOS DE GÊNOVA
Chief Executive Officer JOÃO MARCOS PEQUENO DE BIASECANDIDO BOTELHO BRACHER JOSÉ AUGUSTO DURAND
JOSÉ IRINEU NUNES BRAGAExecutive Vice-Presidents LILIAN SALA PULZATTO KIEFER
ALBERTO FERNANDES LUÍS ALBERTO PIMENTA GARCIAANTONIO CARLOS BARBOSA DE OLIVEIRA LUIZ MARCELO ALVES DE MORAES DANIEL LUIZ GLEIZER MARCELO MAZIEROJEAN-MARC ROBERT NOGUEIRA BAPTISTA ETLIN MARCO ANTONIO SUDANO RODOLFO HENRIQUE FISCHER MARIO ANTONIO BERTONCINI
MÁRIO LÚCIO GURGEL PIRESExecutive Directors MÁRIO LUÍS BRUGNETTI
ALEXANDRE JADALLAH AOUDE MARIO LUIZ AMABILEANDRÉ EMILIO KOK NETO MILTON MALUHY FILHOANDRÉ LUÍS TEIXEIRA RODRIGUES PASCHOAL PIPOLO BAPTISTACAIO IBRAHIM DAVID PAULO DE PAULA ABREUNICOLAU FERREIRA CHACUR PAULO PIRES VAZ PAOLO SERGIO PELLEGRINI PAULO ROBERTO SCHIAVON DE ANDRADE PAULO ROMAGNOLI PEDRO REZENDE MARINHO NUNES
RODRIGO PASTOR FACEIRO LIMA
Head Office: Av. Brigadeiro Faria Lima, 3.400 - 3° ao 8°, 11° e 12° andares - Itaím Bibi - São Paulo - SP

69,406,801 76,971,703 333,435 232,680
19,387,271 24,874,181 Money market 4,320,775 3,309,507 Interbank deposits 15,066,496 21,564,674
18,368,821 19,632,602 Own portfolio 9,376,607 7,335,757
Subject to repurchase commitments 2,375,661 2,110,257
Deposited with the Central Bank 1,055 20,081
Pledged in guarantee 3,829,620 4,049,219
Derivative financial instruments 2,785,878 6,117,288
97,628 22,438 Restricted credits - Central Bank deposits 3,812 999
Interbank onlending 5,098 6,876
Correspondents 88,718 14,563
1,277 12
20,749,551 19,609,792 Loans 21,235,688 19,772,501
(Allowance for loan losses) (486,137) (162,709)
1,873 17,396 Lease receivable and guaranteed residual value 1,017,777 259,514
(Unearned income and offsetting residual value) (944,975) (235,979)
(Allowance for doubtful lease receivables) (70,929) (6,139)
10,374,315 12,530,210 Foreign exchange portfolio (Note 7) 9,174,170 11,167,473 Income receivable 43,505 69,937
Negotiation and intermediation of securities 139,270 715,198
Sundry (Note 10a) 1,094,179 607,337
(Allowance for loan losses) (Notes 3g and 6e) (76,809) (29,735)
92,630 52,392 Other assets 18,198 14,613
Prepaid expenses 74,432 37,779
51,407,592 45,592,953 17,823,806 24,119,457
Money market 11,842,085 13,637,750 Interbank deposits 5,981,721 10,481,707
15,825,353 6,800,894 Own portfolio 2,405,715 3,696,975
Subject to repurchase commitments 12,034,740 1,093,847
Pledged in guarantee 31,078 642,269
Derivative financial instruments 1,353,820 1,367,803
16,920,168 11,732,081 Loans 18,196,636 13,425,450
(Allowance for loan losses) (1,276,468) (1,693,369)
98,379 27,804 Lease receivable and guaranteed residual value 4,692,119 3,003,300
(Unearned income and offsetting residual value) (4,578,252) (2,955,258)
(Allowance for doubtful lease receivables) (15,488) (20,238)
715,976 2,868,361 Foreign exchange portfolio (Note 7) 25,068 993,529
Income receivable - 2,621
Sundry (Note 10a) 690,965 1,873,459
(Allowance for loan losses) (Notes 3g and 6e) (57) (1,248)
23,910 44,356
6,180,733 3,006,910 222,514 136,234
Investments in subsidiaries and affiliates (Note 12) 124,878 131,038
Domestic 123,154 128,573
Foreign 1,724 2,465
Other investments 100,789 8,349
(Allowance for loan losses) (3,153) (3,153)
90,447 39,911 Real estate in use 19,938 13,064
Other fixed assets 132,068 73,227
(Accumulated depreciation) (61,559) (46,380)
4,371,889 2,377,492 Leased assets 4,199,014 2,319,344
(Accumulated depreciation) 172,875 58,148
1,495,883 453,273 Acquisition of rights to credit payroll 270 -
Goodwill from merger 2,179,213 760,905
Accumulated amortization (683,600) (307,632)
126,995,126 125,571,566
LONG-TERM RECEIVABLES
CURRENT ASSETS
OTHER ASSETS (Note 3h)
LEASE OPERATIONS (Notes 3e, 3f and 6d)
LOAN OPERATIONS (Notes 3e, 3g and 6)
SECURITIES AND DERIVATIVE FINANCIAL INSTRUMENTS (Notes 3c, 3d and 5)
PERMANENT ASSETS
OTHER ASSETS - Prepaid expenses (Note 3h)
BANCO ITAÚ BBA S.A.
(In thousands of reais)Balance Sheet
OTHER RECEIVABLES
INTERBANK ACCOUNTS
INTERBRANCH ACCOUNTS - Internal transfers of funds
12/31/2009
INVESTMENTS (Note 3i)
TOTAL ASSETS
OPERATING LEASE ASSETS (Notes 3k and 6d)
FIXED ASSETS (Note 3j)
INTANGIBLE (Note 3m)
12/31/2008
OTHER RECEIVABLES
LEASE OPERATIONS (Notes 3e, 3f and 6d)
LOAN OPERATIONS (Notes 3e, 3g and 6)
SECURITIES AND DERIVATIVE FINANCIAL INSTRUMENTS (Notes 3c, 3d and 5)
ASSETS
INTERBANK INVESTMENTS (Notes 3b and 4)CASH AND CASH EQUIVALENTS
INTERBANK INVESTMENTS (Notes 3b and 4)

71,538,953 68,482,879
32,558,151 34,977,349 Demand deposits 1,112,938 932,444 Interbank deposits 21,524,936 18,410,271 Time deposits 9,916,894 15,621,543 Other deposits 3,383 13,091
18,015,017 6,900,737 Own portfolio 3,646,023 1,528,116 Third-party portfolio 14,368,994 5,372,621
1,983,829 2,508,974 Real estate, mortgage, credit and similar notes 1,484,524 1,410,419
Foreign borrowings through securities 499,305 1,098,555
44,602 23,334 874,553 710,025
4,416,466 9,013,941 Domestic – Other institutions 1,545 1,533
Foreign 4,414,921 9,012,408
1,464,596 1,154,623 National Treasury 5,088 5,986
BNDES 861,165 475,005
CEF 12,578 10,822
FINAME 454,667 533,178
Other institutions 131,098 129,632
2,340,372 6,438,939
9,841,367 6,754,957 Collection and payment of taxes and contributions 21,528 15,747
Foreign exchange portfolio (Note 7) 6,900,091 5,474,463
Social and statutory (Note 13b) 879,604 306,193
Tax and social security contributions (Notes 3o, 3p and 11c) 1,310,992 149,232
Negotiation and intermediation of securities 177,123 642,900
Advances for guaranteed residual values (Notes 31 and 6c) 246,021 -
Sundry (Note 10b) 306,008 166,422
49,012,222 51,180,545 24,312,524 37,036,882
Interbank deposits 22,382,182 30,552,703
Time deposits 1,930,342 6,484,179 11,077,081 3,731,390
Own portfolio 10,976,680 2,184,189
Third-party portfolio - 1,547,201
Free portfolio 100,401 -
727,141 712,221 Real estate, mortgage, credit and similar notes 3,528 16,725 Foreign borrowings through securities 723,613 695,496
2,882,096 1,641,744 7,095,141 3,684,291
BNDES 3,973,755 2,810,368 CEF 74,473 80,140 FINAME 3,032,426 763,586
Other institutions 14,487 30,197
1,415,392 1,811,887
1,502,847 2,562,130 Foreign exchange portfolio (Note 7) 25,086 947,645 Tax and social security contributions (Notes 3o, 3p and 11c) 38,964 895,305
Advances for guaranteed residual values (Notes 31 and 6c) 1,434,905 719,180
Sundry (Note 10b) 3,892 -
57,287 44,161
6,386,664 5,863,981 4,224,086 4,223,086
15,372 15,372
2,104,444 1,439,548
42,762 (17,288)
- 203,263
126,995,126 125,571,566
12/31/2008
DEPOSITS RECEIVED UNDER SECURITIES REPURCHASE AGREEMENTS (Notes 3b and 8a)
BORROWINGS (Note 3b and 8a)
DEPOSITS RECEIVED UNDER SECURITIES REPURCHASE AGREEMENTS (Notes 3b and 8a)
CURRENT LIABILITIES
LONG-TERM LIABILITIES
INTERBANK ACCCOUNTS – Pending settlements
12/31/2009
DOMESTIC ONLENDING (Notes 3b and 8a)
TOTAL LIABILITIES AND STOCKHOLDERS’ EQUITY
OTHER LIABILITIES
OTHER LIABILITIES
DEPOSITS (Notes 3b and 8a)
INTERBRANCH ACCOUNTS - Internal transfers of funds
FUNDS FROM ACCEPTANCE AND ISSUANCE OF SECURITIES – Foreign borrowings through securities (Notes 3b and 8a)
DERIVATIVE FINANCIAL INSTRUMENTS (Notes 3d and 5b)
BORROWINGS – Foreign (Notes 3b and 8a)
Asset valuation adjustment (Notes 3c and 5a)
FUNDS FROM ACCEPTANCE AND ISSUANCE OF SECURITIES - Foreign borrowings through securities (Notes 3b and 8a)
BANCO ITAÚ BBA S.A.
LIABILITIES
(In thousands of reais)Balance Sheet
DOMESTIC ONLENDING (Notes 3b and 8a)
The accompanying notes are an integral part of these financial statements.
DERIVATIVE FINANCIAL INSTRUMENTS (Notes 3d and 5b)
DEPOSITS (Notes 3b and 8a)
Retained earnings
Revenue reserves Capital reserves Capital
STOCKHOLDERS’ EQUITY (Note 13)
DEFERRED INCOME (Note 3q)

2nd half 01/01 to 01/01 to2009 12/31/2009 12/31/2008
6,017,089 12,595,901 13,016,296 1,667,591 3,189,602 3,889,885
790,462 1,399,245 406,636 2,788,496 5,523,564 9,047,692
614,622 2,620,279 (745,935) 155,918 (136,789) 418,018
(3,992,158) (7,800,952) (13,135,860) (3,377,843) (7,485,876) (9,198,443)
148,921 767,166 (1,958,057) (562,307) (989,699) (290,807) (200,929) (92,543) (1,688,553)
2,024,931 4,794,949 (119,564) (432,209) (949,801) (519,296) 364,646 568,341 375,709
(224,613) (388,612) (322,163) (208,932) (372,011) (255,270) (176,479) (357,538) (130,091)
15,922 10,447 24,613 67,471 94,023 43,765
(270,224) (504,451) (255,859) 1,592,722 3,845,148 (638,860)
3,545 6,599 13,300 1,596,267 3,851,747 (625,560) (646,033) (1,676,242) 1,184,285 (271,127) (956,595) (48,363) (374,906) (719,647) 1,232,648 (185,342) (328,580) (147,603) (133,085) (235,501) (106,656) (52,257) (93,079) (40,947) 764,892 1,846,925 411,122
10,569,053 10,569,053 174.75 38.90 604.28 554.83
INCOME FROM FINANCIAL OPERATIONS
(In thousands of reais)Statement of income
Loans
BANCO ITAU BBA S.A.
BOOK VALUE PER THOUSAND SHARES - R$NET INCOME PER THOUSAND SHARES - R$NUMBER OF OUTSTANDING SHARES (Note 13a)NET INCOME
PROFIT SHARING
INCOME TAX AND SOCIAL CONTRIBUTION (Notes 3p and 11a I)INCOME BEFORE TAXES ON INCOMENON-OPERATING INCOME (EXPENSES) OPERATING INCOME
Related to temporary differencesDue on operations for the period
Other operating expenses (Note 10e) Other operating revenues (Note 9c) Equity in earnings of subsidiaries and affiliates (Note 12I)Tax expenses (Notes 3p and 11a II)
Lease operationsSecurities
Other administrative expenses (Note 10d)Personnel expensesBanking service fees (Note 10c)
EXPENSES ON FINANCIAL OPERATIONS
Derivative financial instruments
The accompanying notes are an integral part of these financial statements.
Foreign exchange operations
Officers - Statutory – Law No. 6,404 of 12/15/1976Employees - Law No. 10,101 of 12/19/2000 (Note 15a)
Lease operationsBorrowings and onlendingMoney market
Allowance for loan losses (Notes 3g and 6e)
OTHER OPERATING REVENUES (EXPENSES)GROSS INCOME FROM FINANCIAL OPERATIONS

BANCO ITAÚ BBA S.A.
Statement of Changes in Stockholders’ Equity (Note 13)(In thousands of reais)
Capital Capital reserves Revenue reserves Equity evaluation adjustment Retained earnings Total
BALANCES AT JULY 1, 2009 4,223,086 15,372 1,326,195 46,077 203,263 5,813,993
Capital increase – ESM of 06/30/2009 1,000 - - - - 1,000 Asset valuation adjustment - - - (3,315) - (3,315) Reversal of interest on capital / Dividends 1st half of 2009 - - 131,794 - - 131,794 Net Income - - - - 764,892 764,892 Appropriations: Legal reserve - - 38,245 - (38,245) - Statutory reserve - - 608,210 - (608,210) - Interest on capital – ESM of 12/31/2009 - - - - (321,700) (321,700) BALANCES AT DECEMBER 31, 2009 4,224,086 15,372 2,104,444 42,762 - 6,386,664 CHANGES IN THE PERIOD 1,000 - 778,249 (3,315) (203,263) 572,671 BALANCES AT JANUARY 1, 2008 4,223,086 15,256 1,443,050 891 203,263 5,885,546 Restatement of equity securities - 116 - - - 116 Asset valuation adjustment - - - (18,179) - (18,179) Net Income - - - - 411,122 411,122 Appropriations: - Legal reserve - - 20,556 - (20,556) - Statutory reserve - - (3,461) - 3,461 - Dividends - - (20,597) - (26,027) (46,624) Interest on capital paid - - - - (368,000) (368,000) BALANCES AT DECEMBER 31, 2008 4,223,086 15,372 1,439,548 (17,288) 203,263 5,863,981 CHANGES IN THE PERIOD - 116 (3,502) (18,179) - (21,565) BALANCES AT JANUARY 1, 2009 4,223,086 15,372 1,439,548 (17,288) 203,263 5,863,981 Merger – ESM of 02/28/2009 - - (3,221) - - (3,221) Capital increase - ESM of 06/30/2009 1,000 - - - - 1,000 Asset valuation adjustment - - - 60,050 - 60,050 Net Income - - - - 1,846,925 1,846,925 Appropriations: Legal reserve - - 92,346 - (92,346) - Statutory reserve - - 1,475,771 - (1,475,771) - Dividends - - (900,000) - (160,371) (1,060,371) Interest on capital – ESM of 12/31/2009 - - - - (321,700) (321,700) BALANCES AT DECEMBER 31, 2009 4,224,086 15,372 2,104,444 42,762 - 6,386,664 CHANGES IN THE PERIOD 1,000 - 664,896 60,050 (203,263) 522,683 The accompanying notes are an integral part of these financial statements.

(In thousands of reais)
2nd half 2009 01/01 to 12/31/2009
01/01 to 12/31/2008
959,944 1,853,071 207,395 764,892 1,846,925 411,122 195,052 6,146 (203,727)
Adjustment to market value of securities and derivative financial instruments (assets/liabilities) (210,925) (497,924) 465,929Allowance for loan losses 200,929 92,543 1,701,786Amortization of goodwill 212,012 375,044 139,668Depreciation and amortization 9,169 15,660 6,817Legal liabilities - tax and social security and related escrow deposits (68,353) 81,788 99,465Deferred taxes 374,906 719,647 (1,185,317)Equity in earnings of affiliates (15,922) (10,447) (24,613)Income from available-for-sale securities (316,295) (788,150) (1,408,024)Income from held-to-maturity securities 13,903 22,357 (34,980)(Income) loss from sale of investments (4,372) (4,372) -Other - - 35,542
482,911 (3,768,149) 8,631,224 8,912,689 (1,823,680) 7,343,960 2,015,568 21,784 (2,649,535)
1,845 (2,813) 1,459 87,992 135,490 212,263
(995,090) 594,141 (17,318,655) 756,667 1,134,499 (345,187)
(3,009,678) (1,713,376) (827,257) (11,865,664) (19,105,726) 16,874,945
109,409 18,459,971 (1,332,718) (416,610) (510,225) 1,866,516
5,195,287 340,366 4,976,146 248,572 (488,855) 78,011
(Decrease) increase in deferred income 14,817 13,126 15,301 (572,893) (822,851) (264,025)
1,442,855 (1,915,078) 8,838,619Interest on capital / dividends received from affiliated companies 444 444 -Funds received from sale of available-for-sale securities (149,428) 4,046,262 10,399,922Funds received from redemption of held-to-maturity securities 5,584 1,461 27,232Disposal of assets not for own use 22,755 22,755 1,853Sale of investments 17,951 18,297 21,985Sale of fixed assets 2,083 2,139 47Payment of income tax and social contribution from sale of investments (6,318) (6,318) (8,290)Purchase of available-for-sale securities (6,768,368) (14,970,545) (12,464,660)Purchase of investments (15,494) (15,494) (2,020)Cash and cash equivalents of cash received in the corporate restructuring (Note 13d) - 27 -Purchase of fixed assets (21,288) (68,335) (11,237)Goodwill on purchase of investments - - (1,534)Purchase of intangible assets - (237) -
(6,912,079) (10,969,544) (2,036,702)Capital increase - 1,000 -Dividends and interest on capital paid - (1,048,970) (362,856)
- (1,047,970) (362,856)
(5,469,224) (13,932,592) 6,439,061
9,497,205 17,960,573 11,521,5124,027,981 4,027,981 17,960,573
Banco Itaú BBA S.A.Statement of Cash Flows
ADJUSTED NET INCOMENet IncomeAdjustments to net income:
CHANGE IN ASSETS AND LIABILITIES(Increase) decrease in interbank investments(Increase) decrease in securities and derivative financial instruments (assets/liabilities)(Increase) decrease in compulsory deposits with the Central Bank of Brazil(Increase) decrease in interbank and interbranch accounts (assets/liabilities)(Increase) decrease in loan, lease and other credit operations(Increase) decrease in other receivables and other assets(Increase) decrease in foreign exchange portfolio and negotiation and intermediation of securities (assets/liabilities)(Decrease) increase in deposits(Decrease) increase in deposits received under securities repurchase agreements(Decrease) increase in funds for issuance of securities(Decrease) increase in borrowings and onlending(Decrease) increase in other liabilities
Payment of income tax and social contributionNET CASH PROVIDED BY (USED IN) OPERATING ACTIVITIES
NET CASH PROVIDED BY (USED IN) INVESTMENT ACTIVITIES
NET CASH PROVIDED BY (USED IN) FINANCING ACTIVITIES
The accompanying notes are an integral part of these financial statements.
NET INCREASE (DECREASE) IN CASH AND CASH EQUIVALENTS (Note 3a)
Cash and cash equivalents at the beginning of the periodCash and cash equivalents at the end of the period

BANCO ITAU BBA S.A. NOTES TO THE FINANCIAL STATEMENTS
FROM JANUARY 1 TO DECEMBER 31, 2009 AND 2008 (In thousands of reais)
NOTE 1 - OPERATIONS Banco Itaú BBA S.A. (“Itaú BBA) develops its business as a wholesale bank aimed at client services. NOTE 2 - PRESENTATION OF THE FINANCIAL STATEMENTS The financial statements of Itaú BBA have been prepared in accordance with accounting principles established by the Brazilian Corporate Law, in conformity, when applicable, with instructions issued by the Central Bank of Brazil (BACEN) and the National Monetary Council (CMN), which include the use of estimates necessary to calculate accounting provisions. As a result of the corporate restructuring process (Note 13d), the assets and liabilities for December 31, 2009, include the amounts related to the balances arising from the acquisition and merger of Banco Único S.A. and merger of the spun off portion of an interest in Banco Itaú BBA S.A by Banco Itaú S.A. The statement of income includes income and expenses related to the operations connected with the merged equity amounts as from the respective date of the ESM. As set forth in the sole paragraph of article 7 of BACEN Circular No. 3,068, of November 8, 2001, securities classified as trading securities (Note 5a) are presented in the Balance Sheet under Current Assets regardless of their maturity dates. As set forth in paragraph 1, article 2, of BACEN Circular No. 2,804, of February 11, 1998, the financial statements of Itaú BBA comprise the consolidation of its foreign branches and subsidiaries. NOTE 3 - SUMMARY OF THE MAIN ACCOUNTING PRACTICES a) Cash and cash equivalents – for purposes of Statement of Cash Flows, it includes cash and current
accounts in banks (considered in the heading cash and cash equivalents), interbank deposits and securities purchased under agreements to resell – funded position that have original maturities of up to 90 days or less.
b) Interbank investments, remunerated restricted credits – Central Bank of Brazil, remunerated
deposits, deposits received under securities repurchase agreements, funds from acceptance and issuance of securities, borrowings and onlendings and other receivables and payables – transactions subject to monetary correction and foreign exchange variation and operations with fixed charges are recorded at present value, net of the transaction costs incurred, calculated "pro rata die" based on the effective rate of transactions, according to CVM Resolution No. 556 of November 12, 2008.
c) Securities – recorded at cost of acquisition restated by the index and/or effective interest rate and presented
in the Balance Sheet, according to BACEN Circular No. 3,068, of November 8, 2001. Securities are classified into the following categories:
• Trading securities – acquired to be actively and frequently traded, and adjusted to market value, with a
contra-entry to the results for the period;
• Available–for-sale securities – securities that can be negotiated but are not acquired to be actively and frequently traded. They are adjusted to their market value with a contra-entry to an account disclosed in stockholders’ equity.
• Held-to-maturity securities – securities, except for non-redeemable shares, for which the bank has the
financial condition and intends or is required to hold them in the portfolio up to their maturity, are recorded at cost of acquisition, or market value, whenever these are transferred from another category. The securities are adjusted up to their maturity date, not being adjusted to market value.
Gains and losses on available-for-sale securities, when realized, are recognized at the trading date in the statement of income, with a contra-entry to a specific stockholders’ equity account.

Decreases in the market value of available-for-sale securities below their related costs, resulting from non-temporary reasons, are recorded in results as realized losses. The effects of the application of the procedures described above in the affiliated and subsidiary companies of Itaú BBA and reflected in their respective stockholders’ equity or income and expense accounts, were likewise recorded in stockholders’ equity or in the equity in earnings of the parent company in proportion to Itaú BBA’s ownership percentage.
d) Derivative financial instruments - these are classified on the date of their acquisition, according to
management's intention of using them either as a hedge or not, according to BACEN Circular No. 3,082, of January 30, 2002. Transactions involving financial instruments, carried out upon the client's request, for their own account, or which do not comply with the hedging criteria (mainly derivatives used to manage the overall risk exposure) are stated at market value, including realized and unrealized gains and losses, which are recorded directly in the statements of income.
The derivatives used for protection against risk exposure or to modify the characteristics of financial assets and liabilities, which have changes in market value highly associated with those of the items being protected at the beginning and throughout the duration of the contract, and which are found effective to reduce the risk related to the exposure being protected, are classified as a hedge, in accordance with their nature:
Market Risk Hedge - Financial assets and liabilities, as well as their related financial instruments, are accounted for at their market value plus realized and unrealized gains and losses, which are recorded directly in the statement of income.
Cash Flow Hedge - the effective amount of the hedge of financial assets and liabilities, as well as their related financial instruments, are accounted for at their market value plus realized and unrealized gains and losses, net of tax effects, when applicable, and recorded in a specific account in stockholders’ equity. The ineffective portion of hedge is recorded directly in the statement of income.
e) Loan, Lease and Other Credit Operations (Operations with Credit Granting Characteristics) – these
transactions are recorded at present value and calculated “pro rata die” based on the variation of the contracted index and interest rate, and are recorded on the accrual basis until the 60th day overdue. After the 60th day, income is recognized upon the effective receipt of installments. The income arising from the recovery of operations that had been previously written off is classified in Income from Loan Operations and fees contracted in these operations are classified in Banking Service Fees.
f) Lease receivable and guaranteed residual value - recorded at the contractual amount, with a contra–entry
to unearned income accounts and offsetting residual value at the contracted conditions. The guaranteed residual value received in advance is recorded in Other Liabilities – Advances for Guaranteed Residual Values until the date of the contract termination. The adjustment to present value of considerations and guaranteed residual value receivable from lease operations is recognized as depreciation in excess/deficient in the lease assets so as to make the accounting practices compatible in accordance with BACEN Circular No. 1,429 of January 20, 1989. Lease operations are recorded on the accrual basis until de the 60th day overdue. After the 60th day overdue, income is recognized upon the effective receipt of installments and the income arising from the recovery of operations that had been previously written off is classified in Income from Lease Operations.
g) Allowance for Loan Losses – the balance of the allowance for loan losses was recorded based on the
credit risk analysis, at an amount considered sufficient to cover loan losses according to the rules determined by CMN Resolution No. 2,682 of December 21, 1999, among which are:
• Provisions are recorded from the date loans are granted, based on the client’s risk rating and on the
periodic quality evaluation of clients and industries, and not only in the event of default;
• Based exclusively on delinquency, write-offs may be carried out 360 days after the due date of the credit or 540 days for operations that mature after a period of 36 months.
h) Other assets – these assets are mainly comprised by assets held for sale relating to real estate available for
sale, own real estate not in use and real estate received as payment in kind, which are adjusted to market value through the set-up of a provision, according to current regulations; and prepaid expenses, corresponding to disbursements, the benefit of which will occur in future periods, and commissions paid to dealers upon the granting of vehicle financing or leasing.

i) Investments – in subsidiary and affiliated companies, investments are accounted for under the equity method. The financial statements of foreign subsidiaries are adapted to comply with Brazilian accounting practices and converted into Reais. Other investments are recorded at cost and adjusted to market value by setting up a provision in accordance with current standards. The goodwill arising from the acquisitions of investments is amortized based on the expected future profitability (10 years) or upon their realization.
j) Fixed assets - These assets are stated at cost of acquisition or construction, less accumulated depreciation.
Correspond to rights related to tangible assets intended for maintenance of the company's operations or exercised for such purposes, including assets arising from transactions that transfer to the company their benefits, risks and controls. The items acquired through Lease contracts are recorded according to CVM Resolution No. 554, of November 12, 2008, as contra-entry to Lease obligations. Depreciation is calculated using the straight-line method, based on monetarily restated cost, at the following annual rates:
Real estate in use 4% to 8%Leasehold improvements From 10%Installations, furniture, equipment and security, transportation and communication systems 10% to 25%EDP systems 20% to 50% k) Operating leases – leased assets are recorded in property, plant and equipment at restated cost of
acquisition. The depreciation of leased assets is recognized under the straight-line method, based on their usual useful lives, taking into account that the useful life shall be decreased by 30% should it meet the conditions provided for by Ordinance No. 113 of February 1988, issued by the Ministry of Finance. The annual depreciation rates, without taking into consideration said reduction, are: buildings, 4%, furniture, fixtures and installations, 10%, machinery and equipment, from 10% to 50%, vehicles and related assets, from 20% to 25%, and other assets, from 10% to 20%.
l) Unamortized lease losses – The difference determined at the end of the contract between the attributed
residual value and the guaranteed residual value, when it is owed, is debited from deferred charges for amortization over the remaining useful life of the asset. For publication purposes, the balance of deferred charges is classified in Operating Leases.
m) Intangible assets – correspond to rights acquired whose subjects are intangible assets intended for
maintenance of the company or which are exercised for such purpose, according to the CMN Resolution No. 3,642, of November 26, 2008. They are composed of goodwill from merger corresponding to the goodwill paid upon the acquisition of companies, which is transferred to intangible assets due to the absorption of the companies’ net equity, as determined by Law No. 9,532/97, and are amortized over the terms determined in appraisal reports, rights acquired to credit payrolls amortized over the agreement terms.
n) Reduction to the recoverable value of assets – a loss is recognized when there are clear evidences that
assets are stated at a non-recoverable value. From 2008, this procedure started to be adopted annually at the end of each year.
o) Contingent assets and liabilities and legal liabilities - tax and social security - assessed, recognized
and disclosed according to the provisions set forth in CMN Resolution No. 3,535 of January 31, 2008.
I - Contingent assets and liabilities
Refer to potential rights and obligations arising from past events, the occurrence of which is dependent upon future events.
• Contingent assets - not recognized, except upon evidence ensuring a high reliability level of
realization, usually represented by claims awarded a final and unappealable judgment and confirmation of the recoverability of the claim through receipt of amounts or offset against another liability.
• Contingent Liabilities - basically arise from administrative proceedings and lawsuits, inherent in the
normal course of business, filed by third parties, former employees and governmental bodies, in connection with civil, labor, tax and social security lawsuits and other risks. These contingencies are calculated based on conservative practices, being usually recorded based on the opinion of legal advisors and considering the probability that financial resources shall be required for settling the obligation, the amount of which may be estimated with sufficient certainty. Contingencies are classified either as probable, for which provisions are recognized; possible, which are disclosed but not recognized; and remote, for which recognition or disclosure are not required. Any contingent amounts are measured through the use of models and criteria which allow their adequate measurement, in spite of the uncertainty of their term and amounts.

II - Legal liabilities - tax and social security - Represented by amounts payable related to tax liabilities, the legality or constitutionality of which are subject to administrative or judicial defense, recognized at the full amount under discussion.
Liabilities and related escrow deposits are adjusted in accordance with the current legislation.
p) Taxes - these provisions are calculated according to current legislation at the rates shown below, for effects
of the related calculation bases.
Income tax 15.00%Additional income tax 10.00%Social contribution (*) 15.00%PIS 0.65%COFINS 4.00%ISS up to 0.5%
(*) As from May 1, 2008, the rate was changed from 9% to 15%, as provided for in articles 17 and 41 of Law No. 11,727 of June 24, 2008. q) Deferred income - this refers to unexpired interest received in advance that is recognized in income as
earned. NOTE 4 - INTERBANK INVESTMENTS
0-30 31-180 181-365 Over 365 Total Total183,594 4,137,181 - 11,842,085 16,162,860 16,947,257
- 847,499 - 493,721 1,341,220 9,329,443 183,594 3,187,728 - 11,348,364 14,719,686 -
- 101,954 - - 101,954 7,617,814
4,572,390 5,464,989 5,029,117 5,981,721 21,048,217 32,046,381
4,755,984 9,602,170 5,029,117 17,823,806 37,211,077 48,993,638
12.8 25.8 13.5 47.911,206,890 8,081,090 5,586,201 24,119,457 48,993,638
22.9 16.5 11.4 49.2
Funded positionFinanced positionShort position
Interbank deposits
TOTAL - 12/31/2008% per maturity term
12/31/2008
TOTAL
% per maturity term
12/31/2009
Money market
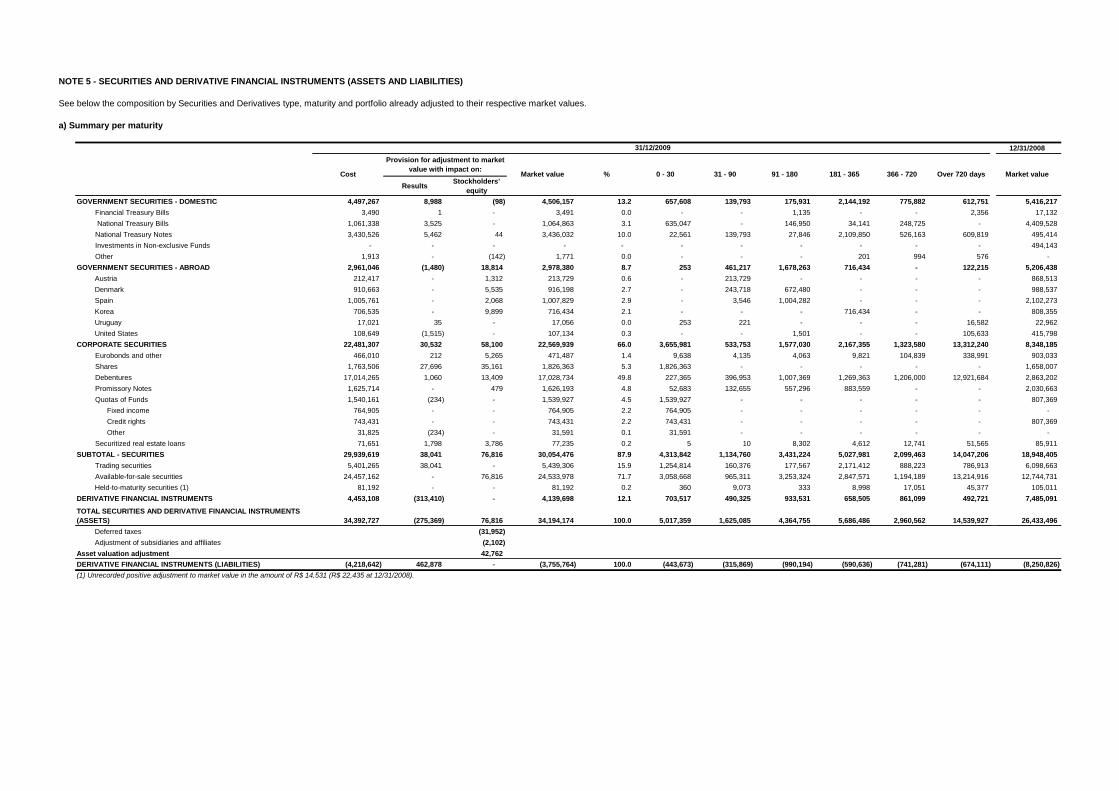
NOTE 5 - SECURITIES AND DERIVATIVE FINANCIAL INSTRUMENTS (ASSETS AND LIABILITIES)
See below the composition by Securities and Derivatives type, maturity and portfolio already adjusted to their respective market values.
12/31/2008
Results Stockholders’ equity
4,497,267 8,988 (98) 4,506,157 13.2 657,608 139,793 175,931 2,144,192 775,882 612,751 5,416,217 3,490 1 - 3,491 0.0 - - 1,135 - - 2,356 17,132
National Treasury Bills 1,061,338 3,525 - 1,064,863 3.1 635,047 - 146,950 34,141 248,725 - 4,409,528 3,430,526 5,462 44 3,436,032 10.0 22,561 139,793 27,846 2,109,850 526,163 609,819 495,414
- - - - - - - - - - - 494,143 1,913 - (142) 1,771 0.0 - - - 201 994 576 -
2,961,046 (1,480) 18,814 2,978,380 8.7 253 461,217 1,678,263 716,434 - 122,215 5,206,438 212,417 - 1,312 213,729 0.6 - 213,729 - - - - 868,513 910,663 - 5,535 916,198 2.7 - 243,718 672,480 - - - 988,537
1,005,761 - 2,068 1,007,829 2.9 - 3,546 1,004,282 - - - 2,102,273 706,535 - 9,899 716,434 2.1 - - - 716,434 - - 808,355
17,021 35 - 17,056 0.0 253 221 - - - 16,582 22,962 108,649 (1,515) - 107,134 0.3 - - 1,501 - - 105,633 415,798
22,481,307 30,532 58,100 22,569,939 66.0 3,655,981 533,753 1,577,030 2,167,355 1,323,580 13,312,240 8,348,185 466,010 212 5,265 471,487 1.4 9,638 4,135 4,063 9,821 104,839 338,991 903,033
1,763,506 27,696 35,161 1,826,363 5.3 1,826,363 - - - - - 1,658,007 17,014,265 1,060 13,409 17,028,734 49.8 227,365 396,953 1,007,369 1,269,363 1,206,000 12,921,684 2,863,202
1,625,714 - 479 1,626,193 4.8 52,683 132,655 557,296 883,559 - - 2,030,663 1,540,161 (234) - 1,539,927 4.5 1,539,927 - - - - - 807,369
Fixed income 764,905 - - 764,905 2.2 764,905 - - - - - - Credit rights 743,431 - - 743,431 2.2 743,431 - - - - - 807,369 Other 31,825 (234) - 31,591 0.1 31,591 - - - - - -
71,651 1,798 3,786 77,235 0.2 5 10 8,302 4,612 12,741 51,565 85,911 29,939,619 38,041 76,816 30,054,476 87.9 4,313,842 1,134,760 3,431,224 5,027,981 2,099,463 14,047,206 18,948,405
5,401,265 38,041 - 5,439,306 15.9 1,254,814 160,376 177,567 2,171,412 888,223 786,913 6,098,663 24,457,162 - 76,816 24,533,978 71.7 3,058,668 965,311 3,253,324 2,847,571 1,194,189 13,214,916 12,744,731
81,192 - - 81,192 0.2 360 9,073 333 8,998 17,051 45,377 105,011 4,453,108 (313,410) - 4,139,698 12.1 703,517 490,325 933,531 658,505 861,099 492,721 7,485,091
34,392,727 (275,369) 76,816 34,194,174 100.0 5,017,359 1,625,085 4,364,755 5,686,486 2,960,562 14,539,927 26,433,496 (31,952)
(2,102) Asset valuation adjustment 42,762
(4,218,642) 462,878 - (3,755,764) 100.0 (443,673) (315,869) (990,194) (590,636) (741,281) (674,111) (8,250,826) (1) Unrecorded positive adjustment to market value in the amount of R$ 14,531 (R$ 22,435 at 12/31/2008).
SUBTOTAL - SECURITIESTrading securities
DERIVATIVE FINANCIAL INSTRUMENTS (LIABILITIES)
Deferred taxes Adjustment of subsidiaries and affiliates
Available-for-sale securities Held-to-maturity securities (1)
DERIVATIVE FINANCIAL INSTRUMENTS
TOTAL SECURITIES AND DERIVATIVE FINANCIAL INSTRUMENTS (ASSETS)
DebenturesPromissory NotesQuotas of Funds
Securitized real estate loans
United StatesCORPORATE SECURITIES
Eurobonds and otherShares
Denmark Spain Korea Uruguay
Investments in Non-exclusive FundsOther
GOVERNMENT SECURITIES - ABROAD Austria
Market value
GOVERNMENT SECURITIES - DOMESTIC
National Treasury Notes
91 - 180 181 - 365 366 - 720 Over 720 days
Financial Treasury Bills
a) Summary per maturity
31/12/2009
Cost
Provision for adjustment to market value with impact on: Market value % 0 - 30 31 - 90

b) Derivative financial instruments The globalization of the markets in recent years has resulted in a high level of sophistication in the financial products used. As a result of this process, there has been an increasing demand for derivative financial instruments to manage market risks, mainly arising from fluctuations in interest and exchange rates, commodities and other asset prices. Accordingly, Itaú BBA operates in the derivative markets for meeting the growing needs of its clients, as well as carrying out its risk management policy. Such policy is based on the use of derivative instruments to minimize the risks resulting from commercial and financial operations. The derivative financial instruments’ business with clients is carried out after the approval of credit limits. The process of limit approval takes into consideration potential stress scenarios. Knowing the client, the sector in which it operates and its risk appetite profile, in addition to providing information on the risks involved in the transaction and the negotiated conditions ensure transparency in the relationship between the parties and the supply of a product that better meet the needs of the client in view of its operating characteristics. The derivative transactions carried out by Itaú BBA with customers are neutralized in order to eliminate market risks. Most derivative contracts traded by the institution with clients in Brazil are swap, forward, option and futures contracts, which are registered at the BM&F Bovespa or at the CETIP S.A. - OTC Clearing House (CETIP). Overseas transactions are carried out with futures, forwards, options and swaps with registration mainly in the Chicago, New York and London Exchanges. It should be emphasized that there are over-the-counter operations, but their risks are low as compared to the institutions’ total. Noteworthy is also the fact that that are no structured operations based on subprime assets and all operations are based on risk factors traded at stock exchanges. The main risk factors of the derivatives, assumed at December 31, 2009, were related to the foreign exchange rate, interest rate, commodities, U.S. dollar coupon, Reference Rate coupon, Libor and variable income. The management of these and other market risk factors is supported by the infrastructure of sophisticated statistical and deterministic models. Based on this management model, the institution, with the use of transactions involving derivatives, has been able to optimize the risk-return ratio, even under highly volatile situations. Most derivatives included in the institution’s portfolio is traded at stock exchanges. The prices disclosed by stock exchanges are used for these derivatives, except in cases in which the low representativeness of price due to illiquidity of a specific contract is identified. Derivatives typically precified like this are future contracts. Likewise, there are other instruments whose quotations (fair prices) are directly disclosed by independent institutions and which are precified based on this direct information. A great part of the Brazilian government securities, highly liquid international (public and private) securities and shares fit into this situation. For derivatives whose prices are not directly disclosed by stock exchanges, fair prices are obtained by pricing models which use market information, deducted based on prices disclosed for higher liquidity assets. Interest and market volatility curves which provide entry data for the models are extracted from those prices. Over-the-counter derivatives, forward contracts and securities without much liquidity are in this situation. The total value of margins pledged in guarantee was R$ 2,055,389 and was basically composed of government securities.

Balance sheet account
receivable / (received)
payable / (paid)
Adjustment to market value (in
results)
12/31/2009 12/31/2008 12/31/2009 12/31/2009 12/31/2009 12/31/2008116,215,752 32,338,478 - (1,371) (1,371) (3,010)
74,670,247 11,837,104 - 11,151 11,151 (30,192) Foreign currency 1,421,521 10,614,363 - (57) (57) 1,778 Interbank market 66,724,761 - - 21,761 21,761 - Indices 6,503,993 1 - 949 949 58 Other 19,972 1,222,740 - (11,502) (11,502) (32,028)
41,545,505 20,501,374 - (12,522) (12,522) 27,182 Foreign currency 2,087,419 10,335,695 - 322 322 1,177 Interbank market 29,492,969 - - (9,445) (9,445) - Indices 8,971,832 1 - 1,131 1,131 (76) Other 993,285 10,165,678 - (4,530) (4,530) 26,081
(109,912) (89,708) (199,620) (1,932,342) 91,546,307 107,397,846 2,345,563 (117,930) 2,227,633 3,667,007
Foreign currency 21,064,121 32,636,149 87,898 13,880 101,778 2,856,069 Interbank market 35,317,510 29,977,733 1,199,351 (91,461) 1,107,890 308,363 Fixed rate 22,459,192 22,212,722 884,759 (108,948) 775,811 318,003 Floating rate 8,166,850 17,802,846 - 383 383 323 Indices 4,435,038 4,728,202 168,945 67,808 236,753 184,208 Other 103,596 40,194 4,610 408 5,018 41
91,656,219 109,347,376 (2,455,475) 28,222 (2,427,253) (5,599,349) Foreign currency 20,537,921 41,011,837 (298,368) 102,628 (195,740) (4,513,224) Interbank market 33,534,842 35,674,906 (1,298,787) 139,756 (1,159,031) (332,268) Fixed rate 23,532,975 24,020,234 (678,941) (131,682) (810,623) (402,454) Floating rate 6,623,801 3,268,670 (8,157) 302 (7,855) (150,980) Indices 7,154,015 5,235,626 (143,333) (80,811) (224,144) (195,135) Other 272,665 136,103 (27,889) (1,971) (29,860) (5,288)
1,310,025,085 18,889,125 485,834 89,741 575,575 (694,796) 343,440,702 4,375,201 776,156 (211,961) 564,195 308,906
Foreign currency 17,615,511 2,172,163 263,302 (138,270) 125,032 281,105 Interbank market 324,902,193 - 464,201 (85,571) 378,630 - Floating rate 32,630 - 114 (5) 109 - Indices 276,247 2,177,700 16,254 8,365 24,619 27,795 Securities 375,332 - 15,743 (2,893) 12,850 - Other 238,789 25,338 16,542 6,413 22,955 6
390,846,667 2,003,135 846,524 (7,987) 838,537 378,899 Foreign currency 9,498,320 937,218 255,272 (1,856) 253,416 9,724 Interbank market 379,890,241 - 176,457 (2,396) 174,061 - Indices 317,238 152 8,441 (5,916) 2,525 23,737 Securities 1,010,199 842,773 393,988 (845) 393,143 308,797 Other 130,669 222,992 12,366 3,026 15,392 36,641
251,648,309 2,562,756 (771,153) 216,281 (554,872) (301,793) Foreign currency 14,971,214 1,080,887 (290,817) 147,369 (143,448) (11,545) Interbank market 235,878,158 - (438,277) 62,827 (375,450) - Indices 249,780 295 (20,642) (4,175) (24,817) (39,969) Securities 410,784 - (8,288) 4,489 (3,799) - Other 138,373 1,481,574 (13,129) 5,771 (7,358) (250,279)
324,089,407 9,948,033 (365,693) 93,408 (272,285) (1,080,808) Foreign currency 11,070,526 7,255,191 (158,683) 63,650 (95,033) (1,038,234) Interbank market 312,501,156 - (177,491) 12,463 (165,028) - Indices 294,246 2,467,700 (11,416) 5,858 (5,558) (33,107) Securities 120,800 - (3,511) 712 (2,799) - Other 102,679 225,142 (14,592) 10,725 (3,867) (9,467)
37,436 - - - - - 18,718 - 18,735 (17) 18,718 -
Floating rate 18,718 - 18,735 (17) 18,718 - - - (18,735) 17 (18,718) -
Floating rate - - (18,735) 17 (18,718) - 18,718 - 18,735 (17) 18,718 -
Floating rate 18,718 - 18,735 (17) 18,718 - - - (18,735) 17 (18,718) -
Floating rate - - (18,735) 17 (18,718) -
Purchase receivable
Sales receivable
Sales deliverable
Purchase payable
Swap contractsAsset position
Liability position
Option contractsPurchase commitments - long position
Commitments to sell - long position
Purchase commitments - short position
Forward contracts
Commitments to sell - short position
Futures contractsPurchase commitments
Commitments to sell
I- See below the composition of the Derivative Financial Instruments portfolio (assets and liabilities) by type of instrument and reference ratio, stated at their notional amounts, cost and market value.
Memorandum Account Notional Amount Market value
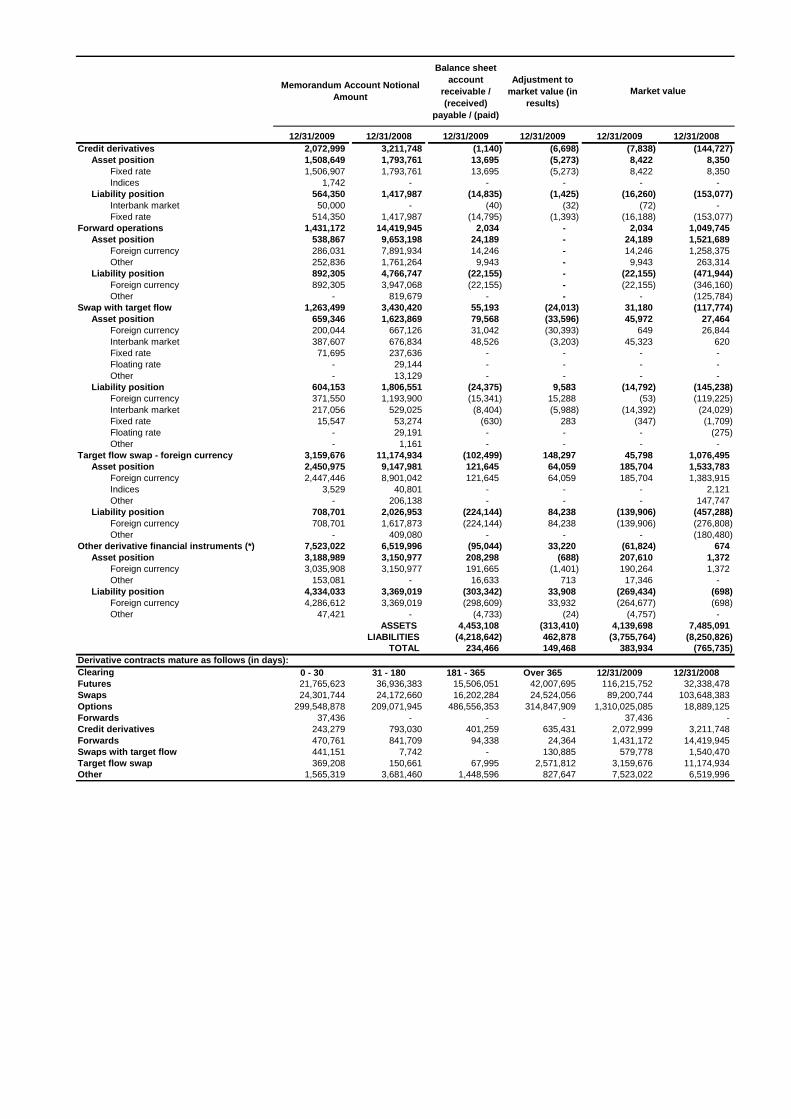
Balance sheet account
receivable / (received)
payable / (paid)
Adjustment to market value (in
results)
12/31/2009 12/31/2008 12/31/2009 12/31/2009 12/31/2009 12/31/20082,072,999 3,211,748 (1,140) (6,698) (7,838) (144,727) 1,508,649 1,793,761 13,695 (5,273) 8,422 8,350
Fixed rate 1,506,907 1,793,761 13,695 (5,273) 8,422 8,350 Indices 1,742 - - - - -
564,350 1,417,987 (14,835) (1,425) (16,260) (153,077) Interbank market 50,000 - (40) (32) (72) - Fixed rate 514,350 1,417,987 (14,795) (1,393) (16,188) (153,077)
1,431,172 14,419,945 2,034 - 2,034 1,049,745 538,867 9,653,198 24,189 - 24,189 1,521,689
Foreign currency 286,031 7,891,934 14,246 - 14,246 1,258,375 Other 252,836 1,761,264 9,943 - 9,943 263,314
892,305 4,766,747 (22,155) - (22,155) (471,944) Foreign currency 892,305 3,947,068 (22,155) - (22,155) (346,160) Other - 819,679 - - - (125,784)
1,263,499 3,430,420 55,193 (24,013) 31,180 (117,774) 659,346 1,623,869 79,568 (33,596) 45,972 27,464
Foreign currency 200,044 667,126 31,042 (30,393) 649 26,844 Interbank market 387,607 676,834 48,526 (3,203) 45,323 620 Fixed rate 71,695 237,636 - - - - Floating rate - 29,144 - - - - Other - 13,129 - - - -
604,153 1,806,551 (24,375) 9,583 (14,792) (145,238) Foreign currency 371,550 1,193,900 (15,341) 15,288 (53) (119,225) Interbank market 217,056 529,025 (8,404) (5,988) (14,392) (24,029) Fixed rate 15,547 53,274 (630) 283 (347) (1,709) Floating rate - 29,191 - - - (275) Other - 1,161 - - - -
3,159,676 11,174,934 (102,499) 148,297 45,798 1,076,495 2,450,975 9,147,981 121,645 64,059 185,704 1,533,783
Foreign currency 2,447,446 8,901,042 121,645 64,059 185,704 1,383,915 Indices 3,529 40,801 - - - 2,121 Other - 206,138 - - - 147,747
708,701 2,026,953 (224,144) 84,238 (139,906) (457,288) Foreign currency 708,701 1,617,873 (224,144) 84,238 (139,906) (276,808) Other - 409,080 - - - (180,480)
7,523,022 6,519,996 (95,044) 33,220 (61,824) 674 3,188,989 3,150,977 208,298 (688) 207,610 1,372
Foreign currency 3,035,908 3,150,977 191,665 (1,401) 190,264 1,372 Other 153,081 - 16,633 713 17,346 -
4,334,033 3,369,019 (303,342) 33,908 (269,434) (698) Foreign currency 4,286,612 3,369,019 (298,609) 33,932 (264,677) (698) Other 47,421 - (4,733) (24) (4,757) -
ASSETS 4,453,108 (313,410) 4,139,698 7,485,091 LIABILITIES (4,218,642) 462,878 (3,755,764) (8,250,826)
TOTAL 234,466 149,468 383,934 (765,735)
0 - 30 31 - 180 181 - 365 Over 365 12/31/2009 12/31/200821,765,623 36,936,383 15,506,051 42,007,695 116,215,752 32,338,478 24,301,744 24,172,660 16,202,284 24,524,056 89,200,744 103,648,383
299,548,878 209,071,945 486,556,353 314,847,909 1,310,025,085 18,889,125 37,436 - - - 37,436 -
243,279 793,030 401,259 635,431 2,072,999 3,211,748 470,761 841,709 94,338 24,364 1,431,172 14,419,945 441,151 7,742 - 130,885 579,778 1,540,470 369,208 150,661 67,995 2,571,812 3,159,676 11,174,934
1,565,319 3,681,460 1,448,596 827,647 7,523,022 6,519,996
Liability position
Memorandum Account Notional Amount Market value
Asset position
Liability position
Asset position
Liability position
Swap with target flow
Other derivative financial instruments (*)Asset position
Credit derivatives
Liability position
Forward operationsAsset position
Target flow swap - foreign currencyAsset position
Liability position
Derivative contracts mature as follows (in days):ClearingFuturesSwaps
Swaps with target flowTarget flow swapOther
OptionsForwardsCredit derivativesForwards

II -
Futures Swaps Options Forwards Credit derivatives Forwards Swap with
target flowTarget flow of
swap Other
114,333,323 9,948,921 1,293,786,394 - - - - - 1,882,429 79,251,823 16,238,691 37,436 2,072,999 1,431,172 579,778 3,159,676 7,523,022 1,822,298 66,991,130 13,189,458 37,436 2,069,517 1,052,162 209,332 215,768 121,972
131 12,260,693 3,049,233 - 3,482 379,010 370,446 2,943,908 7,391,697 116,215,752 89,200,744 1,310,025,085 37,436 2,072,999 1,431,172 579,778 3,159,676 7,523,022 32,338,478 103,648,383 18,889,125 - 3,211,748 14,419,945 1,540,470 11,174,934 6,519,996
III-
12/31/2009 12/31/20081,508,649 1,793,761
1,508,649 1,793,761 564,350 1,417,987
564,350 1,417,987Total 2,072,999 3,211,748
Companies
See below the composition of Credit Derivatives (assets and liabilities) portfolio stated at notional amount.
Credit risk amount
See below the composition of the Derivative Financial Instruments portfolio by type of instrument, stated at their notional amounts, per trading location (organized or over-the-counter market)and counterparties:
Total
Credit derivatives
BM&F/BovespaOver-the-counter market
Total on 12/31/2008
Financial institutions
Total return rate swaps whose underlying assets are:Securities
Received
Transferred
Credit swaps whose underlying assets are:
During the period, there was no occurrence of credit event related to those set forth in agreements.
Securities

IV -01/01 to
12/31/200901/01 to
12/31/2008 Swap 809,879 (237,278) Futures 1,356,300 544,707 Options 126,340 (842,527) Credit derivatives 39,807 (13,192) Other 287,953 (202,370) Total 2,620,279 (750,660)
Realized and unrealized gains of the derivative financial instruments portfolio

(340,466) 148,074
497,924 (457,427)(5,628) 53,013
503,552 (510,440) 106,867 (31,113) 264,325 (340,466)
264,325 (340,466)38,041 43,669 76,816 (30,051)
149,468 (354,084)
12/31/2009 12/31/200876,816 (31,113) 14,531 22,435 91,347 (8,678)
01/01 to 12/31/2008
For better understanding, the following table shows the unrealized gains of available-for-sale securitiesand held-to-maturity securities:
Adjustment of held-to-maturity securities
Derivative financial instruments (assets and liabilities)
Total unrealized gain
Adjustment of available-for-sale securities – stockholders’ equity
Trading securitiesAvailable-for-sale securities
Adjustment to market value
Trading securities
Stockholders’ equityClosing balance
c) Changes in adjustment to market value for the period
01/01 to 12/31/2009
Adjustments with impact on:Results
Derivative financial instruments (assets and liabilities)
Opening balance
d) Reclassification of securities (article 5 of BACEN Circular No. 3,068, of 11/08/2001)
Management sets forth guidelines to classify securities. The classification of the current portfolio of securities, as well as the securities purchased in the period, are periodically and systematically evaluated based on such guidelines. As set forth in Article 5 of BACEN Circular No. 3,068, of November 8, 2008, the revaluation regarding the classification of securities can only be made upon preparation of trial balances for six-month periods. In addition, the transfer from “held-to-maturity” into the other categories can only occur in view of an isolated, unusual, nonrecurring and unexpected reason, which has occurred after the classification date.

12/31/2008AA A B C D E F G H Total Total
15,809,373 16,296,407 4,443,924 1,773,395 472,073 186,945 100,023 90,017 260,167 39,432,324 33,197,950
Loans and discounted trade receivables 7,380,531 7,524,258 2,488,851 1,568,118 379,934 142,050 100,023 90,017 216,124 19,889,906 17,366,408
Financing 6,852,101 7,545,091 1,542,321 191,436 82,429 40,878 - - 30,439 16,284,695 12,779,611
Farming and agribusiness financing 1,576,741 1,227,058 412,752 13,841 9,710 4,017 - - 13,604 3,257,723 3,051,931
Lease operations (Note 6d) 3,309 2,477,274 207,650 71,651 28,910 17,407 13,492 13,329 45,615 2,878,637 1,731,389
383,263 1,196,464 628,993 325,678 8,888 21,724 68,981 1,877 10,790 2,646,658 4,712,432
- - 8,794 - - - - - 736 9,530 117,474
16,195,945 19,970,145 5,289,361 2,170,724 509,871 226,076 182,496 105,223 317,308 44,967,149 39,759,245 16,084,014 10,186,889
16,195,945 19,970,145 5,289,361 2,170,724 509,871 226,076 182,496 105,223 317,308 61,051,163 49,946,134 19,019,208 14,562,004 4,421,523 1,289,740 392,816 19,583 3,112 152 51,107 39,759,245
(1)(2)(3)
NOTE 6 - LOAN, LEASE AND OTHER CREDIT OPERATIONS
a) Composition of the portfolio by type of operations and risk levels
Risk levels 12/31/2009
Loan operations
Advances on exchange contracts (1)
Other sundry receivables (2)
Total operations with credit granting characteristics
Includes Securities and Credits Receivable, Debtors for Purchase of Assets and Endorsements and Sureties paid;Recorded in Memorandum Accounts.
Endorsements and sureties (3)
Total with endorsements and suretiesGrand total 12/31/2008
Includes Advances on Exchange Contracts and Income Receivable from Advances Granted, reclassified from Liabilities - Foreign Exchange Portfolio/Other Receivables (Note 7);

b) Composition of the portfolio by maturity and risk level
AA A B C D E F G H Total %Falling due installments - - 106,383 148,265 92,097 66,694 6,889 39,050 87,671 547,049 1.22% 01 to 60 - - 7,126 23,373 5,504 6,489 784 4,976 3,445 51,697 0.11% 61 to 90 - - 3,294 2,372 930 3,552 375 361 1,555 12,439 0.03% 91 to 180 - - 13,361 8,465 6,217 7,744 1,137 1,095 18,757 56,776 0.13% 181 to 365 - - 20,777 19,254 24,031 19,530 2,264 18,707 27,613 132,176 0.29% Over 365 - - 61,825 94,801 55,415 29,379 2,329 13,911 36,301 293,961 0.65%
Overdue installments - - 8,071 144,586 35,905 132,853 80,737 65,849 212,176 680,177 1.51% 01 to 60 - - 8,071 140,956 10,887 9,279 884 2,384 24,896 197,357 0.44% 61 to 90 - - - 3,102 19,809 23,339 500 4,949 6,761 58,460 0.13% 91 to 180 - - - 528 5,209 97,099 76,294 53,845 28,632 261,607 0.58% 181 to 365 - - - - - 3,136 3,059 4,671 144,399 155,265 0.35% Over 365 - - - - - - - - 7,488 7,488 0.02%
SUBTOTAL - - 114,454 292,851 128,002 199,547 87,626 104,899 299,847 1,227,226 2.73%
AA A B C D E F G H TotalFalling due installments 16,188,394 19,921,192 5,166,100 1,875,186 381,425 26,511 94,865 323 16,999 43,670,995 97.12%01 to 60 2,353,679 3,761,421 893,632 753,305 100,689 9,674 4,546 17 8,827 7,885,790 17.54%61 to 90 615,807 1,668,420 380,800 30,022 13,008 8,665 61,942 9 21 2,778,694 6.18%91 to 180 2,206,925 2,823,104 1,002,240 138,954 19,229 590 7,766 27 56 6,198,891 13.79%181 to 365 2,801,670 3,522,419 750,171 158,344 24,086 3,899 15,110 54 510 7,276,263 16.18%Over 365 8,210,313 8,145,828 2,139,257 794,561 224,413 3,683 5,501 216 7,585 19,531,357 43.43%
Overdue up to 14 days 7,551 48,953 8,807 2,687 444 18 5 1 462 68,928 0.15%SUBTOTAL 16,195,945 19,970,145 5,174,907 1,877,873 381,869 26,529 94,870 324 17,461 43,739,923 97.27%Grand Total 12/31/2009 16,195,945 19,970,145 5,289,361 2,170,724 509,871 226,076 182,496 105,223 317,308 44,967,149Minimum allowance required - (99,851) (52,894) (65,122) (50,987) (67,823) (91,247) (73,656) (317,308) (818,888)Additional allowance - (97,854) (105,258) (164,038) (458,833) (158,231) (91,230) (31,556) - (1,107,000)EXISTING ALLOWANCE - (197,705) (158,152) (229,160) (509,820) (226,054) (182,477) (105,212) (317,308) (1,925,888)
GRAND TOTAL 12/31/2008 19,019,208 14,562,004 4,421,523 1,289,740 392,816 19,583 3,112 152 51,107 39,759,245EXISTING ALLOWANCE - (144,163) (132,203) (1,171,277) (392,777) (19,581) (2,178) (152) (51,107) (1,913,438)(*) Operations with overdue installments for more than 14 days or under responsibility of bankruptcy or in process of bankruptcy companies.
Overdue Operations (*)
Non-Overdue Operations

12/31/2009 12/31/2008
Public Sector 771,119 677,320 Private Sector 44,196,030 39,081,925
Company 41,358,530 37,055,421 Industry and Commerce 20,465,111 20,353,333 Services 12,843,746 10,486,261 Primary Sector 8,028,212 6,187,007 Other 21,461 28,820
Individuals 2,837,500 2,026,504
44,967,149 39,759,245
d) Composition of the present value of lease operations
12/31/2009 12/31/2008Lease operations 187,674 73,077 Lease receivable and guaranteed residual value 5,709,896 3,262,814 (Unearned income and offsetting residual value) (5,523,227) (3,191,237) Other assets – Reinstated assets 1,005 1,500 Lease assets 4,371,889 2,377,492 Leased assets - Vehicles 4,199,014 2,319,344 Accumulated depreciation 172,875 58,148 (Accumulated depreciation) (1,172,744) (274,444) Depreciation in excess 1,345,619 332,592 (Advances for guaranteed residual values) (1,680,926) (719,180)
Total 2,878,637 1,731,389
Total
c) By business sector

e) Changes in allowance for loan losses
01/01 to 12/31/2009
01/01 to 12/31/2008
Opening balance (1,913,438) (272,103) Net increase (92,543) (1,688,553) Minimum required by Resolution No. 2,682/99 (645,338) (191,982) Additional 552,795 (1,496,571) Write-off 80,093 47,218 Closing balance (1,925,888) (1,913,438) Minimum allowance required (Note 3g) (818,888) (253,643) Additional allowance (*) (1,107,000) (1,659,795)
f) Recovery and renegotiation of credits
I -
II -
g) Credit assignment
At 12/31/2009, the balance of renegotiated credits totaled R$ 30,670 and the related allowance for loan lossestotaled R$ 8,341. At 12/31/2008, there were no renegotiated credits.
In the year, credits amounting to R$ 276,348 (R$ 470,151 at 12/31/2008), the book value of which totaled R$267,203 (R$ 470,268 at 12/31/2008), were assigned without joint obligation in accordance with the provision inCMN Resolution No. 2,836, of May 30, 2001. The impact of these operations on stockholders’ equity and result,net of taxes, was R$ 9,144.
(*) Refers to the provision in excess of the minimum required by CMN Resolution No.2,682, of December 12, 1999, recognized within theprudential criteria adopted by Management in accordance with good banking practice, in order to enable the absorption of possible increasesin default arising from a strong reversal of the economic cycle, quantified in view of the historic performance of loan portfolios in economiccrises situations.
At December 31, 2009, the balance of the allowance in relation to the loan portfolio is equivalent to 4.28% (4.81%at 12/31/2008).
In the period, credits amounting to R$ 7,650 (R$ 36,186 at 12/31/2008) that had been written-off to the allowancefor loan losses account were recovered and are recorded in Income from Loan Operations.
As from December 31, 2008, considering the economic scenario and the uncertainties related to it, the criteria for recognition of the additionalallowance for loan losses were revised, including the portion related to risks associated to a more pessimistic scenario. Over 2009, the effectsof the crisis were partially consummated, giving rise to an increase in the required regulatory allowance for loan losses and reduction in theadditional allowance regarding the portfolio.

0 - 30 31 - 180 Over 365 Total Income (expenses) Total Income
(expenses)
Loan operations 439 811 161,101 162,351 (75,429) 350,460 104,366
Foreign borrowings through securities 439 811 161,101 162,351 75,600 350,438 (102,426) 171 1,940
01/01 to 12/31/2008
We present below information related to the restricted operations on assets, in accordance with CMN Resolution No. 2,921, of January 17, 2002.
h) Restricted operations on assets
Net revenue from restricted operations
At December 31, 2009, there were no balances in default.
Restricted operations on assets
Liabilities - restricted operations on assets
12/31/2009 01/01 to 12/31/2009

12/31/2009 12/31/2008
9,199,238 12,161,002 Exchange purchase pending settlement - foreign currency 5,684,560 9,174,496 Exchange sale rights - local currency 3,564,750 3,053,032 (Advances received) – local currency (127,699) (167,903) Income receivable from advances granted 77,627 101,377
6,925,177 6,422,108 Exchange sales pending settlement - foreign currency 3,580,289 4,264,811 Liabilities from purchase of foreign currency - local currency 3,344,381 2,156,765 Other 507 532
168,351 120,227 Outstanding import credits - foreign currency 152,221 101,029 Confirmed export credits - foreign currency 16,130 19,198
MEMORANDUM ACCOUNTS
NOTE 7 - FOREIGN EXCHANGE PORTFOLIO
ASSETS - OTHER RECEIVABLES
LIABILITIES - OTHER LIABILITIES
12/31/2008Up to 365 days Over 365 Total Total
Deposits 32,558,151 24,312,524 56,870,675 72,014,231 Deposits received under securities repurchase agreements 18,015,017 11,077,081 29,092,098 10,632,127 Funds from acceptances and issuance of securities 1,983,829 727,141 2,710,970 3,221,195 Borrowings and onlending (*) 5,881,062 9,977,237 15,858,299 15,517,933 TOTAL 58,438,059 46,093,983 104,532,042 101,385,486 TOTAL - 12/31/2008 54,569,634 46,815,852 101,385,486
(*) Foreign borrowings are basically represented by foreign exchange transactions related to export pre-financing and import financing.
NOTE 8 - FUNDING AND BORROWINGS AND ONLENDING
a) Summary
12/31/2009
12/31/2008Up to 365 days Over 365 Total Total
1,484,524 3,528 1,488,052 1,427,144 499,305 723,613 1,222,918 1,794,051
Brazil Risk Note Programme 21,589 1,809 23,398 919,712 Euro Certificates of Deposits 396,619 34,714 431,333 512,742 Fixed Rate Notes - - - 113,867 Bonds 749 14,452 15,201 - Euro Medium Term Note Programme 71,345 525,989 597,334 84,957 Other 9,003 146,649 155,652 162,773
1,983,829 727,141 2,710,970 3,221,195 2,508,974 712,221 3,221,195
TOTAL TOTAL - 12/31/2008
b) Funds from acceptances and issuance of securities
12/31/2009
REAL ESTATE, MORTGAGE, CREDIT AND SIMILAR NOTESFOREIGN BORROWINGS AND SECURITIES
NOTE 9 - CONTINGENT ASSETS AND LIABILITIES AND LEGAL LIABILITIES – TAX AND SOCIAL
SECURITY Itaú BBA is involved in contingencies in the ordinary course of its businesses, as follows: b) Contingent Liabilities: these are calculated and classified as follows:
- Calculation criteria:
Civil lawsuits: calculated upon judicial notification, and adjusted monthly:
- Individual (lawsuits related to claims considered unusual and the amounts of which are considered significant): at the claimed indemnity amount, based on the evidence presented and on the evaluation of legal advisors which considers case law, legal opinions raised, evidence produced in the records and the judicial decisions to be issued – relating to the risk level of loss of lawsuits.
These are adjusted to the amounts deposited as guarantee for their execution or to the definitive execution amount (indisputable amount) when the claim is awarded a final and unappealable judgment.
Labor claims: these are calculated based on the individual analysis of the potential amount of probable loss for lawsuits with significant amounts.

Tax and social security: calculated upon judicial notification of administrative proceedings based on their monthly adjusted amounts.
- Contingencies classified as probable: are recognized in the accounting books and mainly comprise
civil lawsuits, labor claims and tax and social security lawsuits.
The table below shows the changes in the respective provisions for contingent liabilities and the respective escrow deposits balances:
Civil Labor Tax and social
security Total
Balance at 12/31/2009 60,901 8,877 3,892 73,670 Balance at 12/31/2008 58,019 7,925 - 65,944 Escrow deposits at 12/31/2009 3,219 4,222 1,826 9,267 Escrow deposits at 12/31/2008 508 2,170 3,458 6,136
Provisions for contingent liabilities 01/01 to 12/31/2009
- Contingencies classified as possible: not recognized in the accounting books and comprise Tax and
Social Security Lawsuits amounting to R$ 27,800 mainly related to dismissal of offset request. Offset requests which were not validated due to formal issues or alleged lack of evidence of credit liquidity. Issue discussed in the administrative level, in which the company stated its defense and exhibited documentation evidencing credit liquidity.
The amount of R$ 54,458 (R$ 45,633 at 12/31/2008) related to Permanent Assets represented by Real Estate, R$ 8 (R$ 10 at 12/31/2008), and Investments (shares), R$ 54,450 (R$ 45,624 at 12/31/2008), are pledged in guarantee of voluntary appeals related to contingent liabilities lawsuits. On April 10, 2007, in the unconstitutionality lawsuit No. 1.976, the Federal Supreme Court ruled unconstitutional the requirement of guarantees for considering voluntary appeals. The company is requesting the cancellation of the pledging of guarantees to the Federal Revenue Service.
b)
Change in legal liabilities 01/01 to 12/31/2009
01/01 to 12/31/2008
Opening balance 773,962 638,624 Charges on taxes 49,398 47,790 Changes in the period reflected in results (12,946) 87,548 Increase 23,665 87,548
Reversal (*) (36,611) - Payment (792,769) - Closing balance (Note 11c) 17,646 773,962
Change in escrow deposits 01/01 to 12/31/2009
01/01 to 12/31/2008
Opening balance 568,013 511,037 Appropriation of income 45,336 46,726 Deposited 12,541 10,250 Convertion into income (199,288) - Closing balance 426,602 568,013
Legal Liabilities - Tax and Social Security and Escrow Deposits for filing Legal Processes – recognized at the full amountbeing questioned and respective escrow deposits, as follows:
(*) Refers basically to the effects arising from the adhesion to the Cash or Installment Payment of Federal Taxes – Law 11,941/09
c) Program for Cash or Installment Payment of Federal Taxes - Law No. 11,941/09
ITAÚ BBA and its subsidiaries adhered to the Program for Cash or Installment Payment of Federal Taxes, established by Law No. 11,941, of May 27, 2009. The program included the debits administered by the Federal Revenue Service of Brazil and the General Attorney’s Office of the National Treasury past due before November 30, 2008. The main cases included in this program were as follows:
• increase to the PIS and COFINS calculation basis as per paragraph 1 of article 3 of Law No. 9,718 of November 27, 1998, classified as Legal Liability;

• levy of IRPJ and CSLL on income determined abroad related to the periods between 1996 and 2000 due to the legal dispute on the unconstitutionality of the provisions in article 25 of Law No. 9,249/95 and paragraph 9 of article 2 of Normative Instruction No. 38/96 that address the taxation of income determined abroad classified as Legal Liability.
The net effect on income was R$ 33,469, recorded in Other Operating Income.
According to the opinion of the legal advisors, Itaú BBA is not involved in any other administrative proceedings or lawsuits that may significantly affect the results of its operations.
NOTE 10 – BREAKDOWN OF ACCOUNTS a) Other sundry receivables – They total R$ 1,785,144 (R$ 2,464,712 at 12/31/2008) and are mainly composed of Tax Credits, R$ 1,103,754 (R$ 1,472,156 at 12/31/2008), Escrow Deposits, R$ 435,869 (R$ 574,149 at 12/31/2008) and Taxes and Contributions for Offset R$ 109,605 (R$ 264,703 at 12/31/2008). b) Other sundry liabilities – They total R$ 309,900 (R$ 166,422 at 12/31/2008) and are mainly composed of Sundry Creditors – Local, R$ 177,217 (R$ 68,855 at 12/31/2008), Provisions for Contingent Liabilities, R$ 73,670 (R$ 64,926 at 12/31/2008) and Provision for Sundry Payments R$ 19,303 (R$ 29,245 at 12/31/2008). c) Banking service fees – They total R$ 568,341 (R$ 375,709 from 01/01 to 12/31/2008) and are mainly composed of Loan Operations and Guarantees Provided, R$ 273,433 (R$ 124,038 from 01/01 to 12/31/2008), Economic and Financial Advisory, R$ 211,378 (R$ 76,504 from 01/01 to 12/31/2008), Collection Services, R$ 61,941 (R$ 53,399 from 01/01 to 12/31/2008) and Foreign Exchange Services, R$ 4,837 (R$ 4,261 from 01/01 to 12/31/2008). d) Other administrative expenses – They total R$ 372,011 (R$ 225,270 from 01/01 to 12/31/2008) and are mainly composed of Third-party Services, R$ 82,427 (R$ 67,360 from 01/01 to 12/31/2008), Data Processing and Telecommunications, R$ 69,727 (R$ 43,629 from 01/01 to 12/31/2008), Financial System Services, R$ 35,804 (R$ 77,292 from 01/01 to 12/31/2008), Agreement for Apportionment of Common Costs, R$ 51,851 (R$ 48,013 from 01/01 to 12/31/2008) and Depreciation and Amortization, R$ 15,660 (R$ 6,817 from 01/01 to 12/31/2008). e) Other operating expenses – They total R$ 504,451 (R$ 255,859 from 01/01 to 12/31/2008) and are mainly composed of Goodwill from Merger, R$ 375,044 (R$ 139,668 from 01/01 to 12/31/2008), Allowance for Loan Losses Without Credit Granting Characteristics, R$ 51,704 (R$ 54,142 from 01/01 to 12/31/2008), Foreign Exchange, R$ 19,800 (R$ 16,048 from 01/01 to 12/31/2008).

NOTA 11 - TRIBUTOS
a) Composition of expenses for taxes and contributions
I -
Due on operations for the period 01/01 to 12/31/2009
01/01 to 12/31/2008
Income before income tax and social contribution 3,851,747 (625,560)
Charges (Income tax and social contribution) at the rates in effect (Note 3m) (1,540,699) 250,224
Increase/decrease to income tax and social contribution charges arising from:
Permanent (additions) exclusions (135,543) 905,365 Investments in affiliates 4,179 9,844 Foreign exchange variation on investments abroad (513,567) 465,794 Interest on capital 128,680 147,200 Interest on external debt bonds and dividends 215,118 217,643 Other 30,047 64,884
Temporary (additions) exclusions 393,355 (725,053)Allowance for loan losses 62,473 (652,085)Excess of depreciation of leased assets 254,170 - Adjustment to market value of trading securities and derivative financial instruments and adjustments from operations in futures markets (44,493) (7,603)Legal liabilities - tax and social security, contingent liabilities and restatement of escrow deposits 116,370 - Other non-deductible provisions 4,835 (65,365)
(Increase) offset of tax losses 326,292 (478,899)
Expenses for income tax and social contribution (956,595) (48,363)Income from deferred taxes (719,647) 1,232,648 Total income tax and social contribution (1,676,242) 1,184,285
II -Tax expenses are represented mainly by PIS, COFINS and ISS.
We show below the Income Tax and Social Contribution due on the operations for the period and on temporarydifferences arising from additions and exclusions:
b) Deferred taxes
I -
Tax loss and social contribution loss carryforwards 478,899 (443,207) - 35,692 Allowance for loan losses 753,734 (35,322) - 718,412 Adjustment to market value of securities and derivatives 12,763 41,126 53,889 Other non-deductible provisions 221,684 69,001 290,685
Total 1,467,080 (478,529) 110,127 1,098,678 Social contribution for offset arising from Option foreseen in article 8 of Provisional Measure No. 2,158-35 of 08/24/2001 5,076 - - 5,076
II - At December 31, 2009, there are no unrecorded deferred taxes.At December 31, 2008, unrecorded deferred tax assets amounted to R$ 54,419.
The deferred tax asset balance and its changes, segregated based on its origin and disbursements incurred, are representedas follows:
12/31/2008 Realization Increase 12/31/2009

III-
34%
Temporary differences Tax loss Total
2010 716,475 - 716,475 5,076 2011 64,849 - 64,849 - 2012 187,509 35,692 223,201 - 2013 25,262 - 25,262 - 2014 1,662 - 1,662 -
After 2014 days 67,229 - 67,229 - Total 1,062,986 35,692 1,098,678 5,076
Present value (*) 962,002 30,376 992,378 4,803
The projections of future taxable income include estimates related to macroeconomic variables, exchange rates,interest rates, volume of financial operations and services fees, among others, which can vary in relation to actual dataand amounts.
Net income in the financial statements is not directly related to taxable income for income tax and social contribution,due to differences existing between accounting criteria and tax legislation, besides corporate aspects. Accordingly, werecommend that the trend of the realization of deferred tax assets arising from temporary differences, income tax andsocial contribution loss carryforwards be not used as an indication of future net income.
The estimate of realization and present value of deferred tax assets and social contribution for offset, arising fromProvisional Measure No. 2,158-35 of August 24, 2001 and from the Provision for Deferred Income Tax and SocialContribution existing at December 31, 2009, in accordance with the expected generation of future taxable income,based on the history of profitability and technical feasibility studies, are:
Realization yearDeferred taxes
(*) The average funding rate was used to determine the present value.
Social contribution for
offset
c) Tax and social security contributions
I -
12/31/2009 12/31/2008 Taxes and contributions on income payable 368,000 621 Taxes and contributions payable(1) 489,238 106,303 Provision for deferred income tax and social contribution (2) 475,072 163,651 Legal liabilities - tax and social security (1) 17,646 773,962 Total 1,349,956 1,044,537 (1) They basically include the adhesion to the program of Payment or Installment Payment of Federal Taxes (Note 9c).(2) Mainly represented by excess of depreciation of lease assets.
The balance of taxes and social security contributions is composed as follows:

NOTE 12 - INVESTMENTS
Investments in subsidiaries and affiliates
Companies Balances at 12/31/2008
Subscription/Acquisition/S
ales
Amortization of goodwill
Dividends and interest on capital received
Equity in earnings of subsidiaries
Balances at 12/31/2009
Equity in earnings of subsidiaries and affiliates from 01/01
to 12/31/2008
Domestic Itaú BBA Trading S.A. 45,624 - - (440) 9,266 54,450 10,836 Puerto Cia Securitizadora de Créditos Financeiros 15,373 - - (4) 489 15,858 533 Delle Holdings S.A. 66,771 (14,213) (3,391) - 1,895 51,062 12,682 Banco Itaú Argentina S.A. 2,465 - - - (741) 1,724 646 Estruturadora Brasileira de Projetos S.A. 805 1,441 - - (462) 1,784 (84) Total 131,038 (12,772) (3,391) (444) 10,447 124,878 24,613
Companies Capital Stockholders’ equity
Net income for the period
Equity share in capital and voting
capital (%)Common Preferred
Domestic Itaú BBA Trading S.A. 38,392 54,450 9,267 3,078,040,844 - 100.00 Puerto Cia Securitizadora de Créditos Financeiros 2,532 15,858 489 178,687,269 - 99.99 Delle Holdings S.A. 63,193 87,578 4,327 - 5,067,750 33.08 Banco Itaú Argentina S.A. 67,841 172,385 2,457 1,482,244 - 1.00 Estruturadora Brasileira de Projetos S.A. 20,970 16,053 4,071 2,330,005 - 11.11
Number of shares owned by ITAÚ BBA

NOTE 13 - STOCKHOLDERS' EQUITY a) Shares
Capital comprises 10,569,053 book-entry shares with no par value, of which 5,284,526 are common class A shares, 1 is common class B share and 5,284,526 are preferred shares. The ESM held on June 30, 2009 resolved on the capital increase of R$ 1,000 with the issue of 1 new common class B share, which was approved by BACEN on January 4, 2010.
b) Dividends and interest on capital
Stockholders are entitled to a mandatory dividend of not less than 25% of annual net income, which is adjusted according to the rules set forth in Brazilian Corporate Law. On March 31, 2009, the amount of R$ 900,000 was paid as mandatory dividend for 2009, which was debited from the Revenue Reserves account. At December 31, 2009, a provision for dividends amounting to R$ 160,371 was recognized and the individual credit related to Interest on Capital was resolved on amounting to R$ 321,700, R$ 273,445 of which was the net amount and R$ 48,255 was the Withholding Tax.
c) Capital and revenue reserves
12/31/2009 12/31/2008CAPITAL RESERVES – RESTATEMENT OF EQUITY SECURITIES 15,372 15,372 REVENUE RESERVES 2,104,444 1,439,548 Legal 402,043 309,697 Statutory (*) 1,702,401 1,129,851 (*) Recognized to ensure to the company the proper operating margin, as provided in its By-laws.
d) Corporate restructuring – Based on the balance sheet of February 28, 2009, the ESM held on February 28, 2009 resolved on the acquisition and merger of the interest in Banco Único S.A. (after the merger of an equity portion of Unibanco – União de Bancos Brasileiros S.A.) into Banco Itaú BBA S.A. and merger of the spun off portion of an interest in Banco Itaú BBA S.A by Banco Itaú S.A.
The assets and liabilities transferred are as follows:
BANCO ÚNICO S.A. BANCO ITAÚ S.A. TOTAL
Current and long-term receivables 4,169,907 - 4,169,907 Cash and cash equivalents 27 - 27 Interbank investments 427,106 - 427,106 Interbank accounts 14 - 14 Loan and other credit operations 3,637,869 - 3,637,869 Other receivables 270,022 - 270,022 (Allowance for loan losses) (165,131) - (165,131)
Permanent assets 1,163,894 250,512 1,414,406 Investments 380 - 380 Intangible assets 1,163,514 250,512 1,414,026
TOTAL 5,333,801 250,512 5,584,313
Current and long-term liabilities 5,327,691 259,843 5,587,534Deposits 3,702,327 259,843 3,962,170 Other liabilities 1,625,364 - 1,625,364 Social and statutory 7,378 - 7,378 Tax and Social Security Contributions 8,820 - 8,820 Sundry 1,609,166 - 1,609,166
TOTAL 5,327,691 259,843 5,587,534 NET ASSETS TRANSFERRED 6,110 (9,331) (3,221)
LIABILITIES
ASSETS

12/31/2009 12/31/2008 01/01 to 12/31/2009
01/01 to 12/31/2008
Money market 15,979,266 15,346,008 1,784,773 1,909,582 - Itaú Unibanco S.A. 15,979,266 15,264,750 1,784,773 1,909,582 - Itau Bank Ltda - 81,258 - -
Interbank and foreign currency investments 19,080,159 23,739,303 2,376,458 3,988,666 - Itaú Unibanco S.A. 18,512,644 23,739,303 2,375,921 3,689,204 - Itau Bank Ltda 224,100 - 537 203,745 - Other 343,415 - - 95,717 Securities and derivative financial instruments(assets/liabilities) 12,085,680 (1,513,194) 16,113 (2,539,260)- Itaú Unibanco S.A. (237,285) (2,196,787) (433,949) (2,125,234)- Dibens Leasing S.A. Arrendamento Mercantil 3,749,111 731,732 39,423 (243,684)- BFB Leasing S.A. Arrendamento Mercantil 8,614,370 - 410,639 - - Other (40,516) (48,139) - (170,342)Foreign exchange portfolio 504,217 1,521,822 127,857 2,368,950 - Itaú Unibanco S.A. 504,217 1,473,928 121,980 2,362,561 - Other - 47,894 5,877 6,389 Amounts receivable from/payable to related parties 5,220 4,553 (27,130) (16,932)- Puerto Cia Securitizadora de Créditos Financeiros 6,930 6,930 - - - Fináustria Ass., Adm., Serv.Crédito e Partic. S.A. (1,514) (1,996) (23,249) (14,061)- Fina Promoção e Serviços S.A. (196) (381) (3,881) (2,871)Interbank deposits (45,167,992) (48,822,546) (5,382,030) (5,669,822)- Itaú Unibanco S.A. (45,849,707) (48,270,093) (4,967,987) (5,330,419)- Other 681,715 (552,453) (414,043) (339,403)Repurchase agreements (1,913,944) (2,234,516) (452,333) (168,888)- BFB Leasing S.A. Arrendamento Mercantil (1,832,490) (2,230,953) (452,333) (166,218)- Other (81,454) (3,563) - (2,670)
b) Compensation of the Management Key PersonnelThe fees attributed in the period to ITAÚ BBA officers are as follows:
12/31/2009 12/31/2008Compensation – Board of Directors 86,670 84,780 Profit sharing 102,285 44,997 Contributions to pension plans 3,189 2,028 Total 192,144 131,805
In addition to the aforementioned operations, ITAÚ BBA, as an integral part of the Agreement for Apportionment of Common Costs ofthe Itaú Unibanco group, paid the amount of R$ 51,851 (R$ 48,057 from January 01 to December 31, 2008) in view of the use of thecommon structure.
NOTE 14 - RELATED PARTIES
a) Transactions between related parties are disclosed in compliance with CMN Resolution No. 3,750 of June 30, 2009. Thesetransactions are carried out at amounts, terms and average rates in accordance with normal market practices during the period, as wellas under reciprocal conditions.
Assets/(Liabilities) Income/(Expenses)
NOTE 15 – ADDITIONAL INFORMATION a) Profit sharing – Employees – Law 10,101 of December 19, 2000 – According to the conditions approved in
the collective bargaining agreement, the amount R$ 258,792 (R$ 117,204 from 01/01 to 12/31/2008) was allocated to employee profit sharing, which, net of tax effects, represented R$ 235,501 (R$ 106,656 from 01/01 to 12/31/2008).
b) Risk Management – Itaú BBA, by means of the leading institution, Itaú Unibanco Holding S.A. (ITAÚ
UNIBANCO) adopted the operational and market risk management structure in compliance with CMN Resolutions No. 3,380, of June 29, 2006, and No. 3,464, of June 26, 2007, respectively. The descriptions of these risk management structures are available on the website of the leading institution (http://www.itauunibancori.com.br). Path: Corporate Governance/Regulations and Policies/Operational Risk Management Policy and Market Risk Management Policy.

c) Single Audit Committee – In accordance with CMN Resolution No. 3,198 of May 27, 2004, Itaú BBA adopted the Single Audit Committee established by the Itaú Unibanco Financial Group by way of the leading institution ITAÚ UNIBANCO. The summary of the report of said Committee was disclosed together with the financial statements of the leading institution on February 09, 2010.

d)
12/31/2009 12/31/2008
Cash and cash equivalents 213,141 91,397 Interbank investments 8,818,845 13,026,689 Securities and derivative financial instruments 4,302,787 6,158,463 Loan, lease and other credit operations 6,999,793 7,395,327 Prepaid expenses 15,178 17,168 Foreign exchange portfolio 5,124,652 821,241 Other assets 119,937 585,816
Fixed and intangible assets 18 82 25,594,351 28,096,183
Deposits 8,406,916 11,052,767 Demand deposits 1,076,705 906,289 Time deposits 7,330,211 10,146,478
Deposits received under securities repurchase agreements 286,211 415,169 Funds from acceptances and issuance of securities 1,067,265 1,517,411 Borrowings 6,470,536 7,788,256 Derivative financial instruments 216,843 831,686 Foreign exchange portfolio 5,106,983 884,438 Other liabilities 147,377 557,314
380 1,168
Capital and reserves 3,750,460 4,803,804 Net income 141,380 244,170
25,594,351 28,096,183
Income from financial operations 1,070,140 4,727,662 Expenses on financial operations (939,229) (6,606,865)
Gross income from financial operations 130,911 (1,879,203)Other operating revenues/expenses 7,174 2,127,633
Operating income 138,085 248,430 Non-operating income 3,343 (4,187) Income before taxes on income, profit sharing and minority interests 141,428 244,243 Income tax (48) (73)
141,380 244,170
Statement of income
Net income
Current and long-term liabilities
Deferred incomeStockholders’ equity
Total
Permanent assets
Total
Liabilities
Information on foreign subsidiaries – Itaú BBA carries out operations by means of its branches in Nassau, Bahamas, andMontevideo, Uruguay. The consolidated balances of equity accounts after the elimination of interbranch transactions areas follows:
AssetsCurrent and long-term receivables
e) Reclassifications for comparison purposes – For comparison purposes, Itaú BBA reclassified in its
Statement of Income from 01/01 to 12/31/2008 the amount of R$ 1,532,937 in the heading Loan Operations, R$ 75,739 in the heading Securities, R$ 153,856 in the heading Derivative Financial Instruments, R$ 13,037 in the heading Foreign Exchange Operations, R$ 816,174 in the heading Money Market, R$ 715,165 in the heading Borrowings and Onlending, and R$ 136,117 in the heading Other Administrative Expenses.

Report of Independent Auditors To Directors and Stockholders Banco Itaú BBA S.A. 1 We have audited the accompanying balance sheets of Banco Itaú BBA S.A. as of December 31, 2009
and 2008, and the related statements of income, of changes in stockholders’ equity, of cash flows for the years then ended and for the six-month period ended December 31, 2009. These financial statements are the responsibility of the Bank’s management. Our responsibility is to express an opinion on these financial statements.
2 We conducted our audits in accordance with approved Brazilian auditing standards, which require that we
perform the audit to obtain reasonable assurance about whether the financial statements are fairly presented in all material respects. Accordingly, our work included, among other procedures: (a) planning our audit taking into consideration the significance of balances, the volume of transactions and the accounting and internal control systems of the Bank, (b) examining, on a test basis, evidence and records supporting the amounts and disclosures in the financial statements, and (c) assessing the accounting practices used and significant estimates made by management of the Bank, as well as evaluating the overall financial statement presentation.
3 The Bank records its transactions and prepares its financial statements in accordance with accounting
practices established by the Central Bank of Brazil (BACEN), which require the adjustment to present value of the leasing portfolio as a provision for excess (insufficient) depreciation classified under permanent assets. These practices do not require the reclassification of leasing transactions to current and non-current assets and income (expenses). These transactions continue to be recorded as provided for in Law No. 6099/74, but permit the disclosure of net income and stockholders' equity in accordance with accounting practices adopted in Brazil.
4 In our opinion, the financial statements audited by us present fairly, in all material respects, the financial
position of Banco Itaú BBA S.A. at December 31, 2009 and 2008 and the results of operations, changes in stockholders’ equity, cash flows for the years then ended and the six-month period ended December 31, 2009, in accordance with accounting practices adopted in Brazil.
São Paulo, February 19, 2010 PricewaterhouseCoopers Emerson Laerte da Silva Auditores Independentes Contador CRC 1SP171089/O-3 CRC 2SP000160/O-5