Italy’s Strategy for Growth and Fiscal Consolidation · Official macroeconomic projections...
73
Italy’s Strategy for Growth and Fiscal Consolidation February 7, 2013 Italian Ministry of Economy and Finance, Treasury Department
Transcript of Italy’s Strategy for Growth and Fiscal Consolidation · Official macroeconomic projections...

Italy’s Strategy for Growth and Fiscal Consolidation
February 7, 2013
Italian Ministry of Economy and Finance, Treasury Department
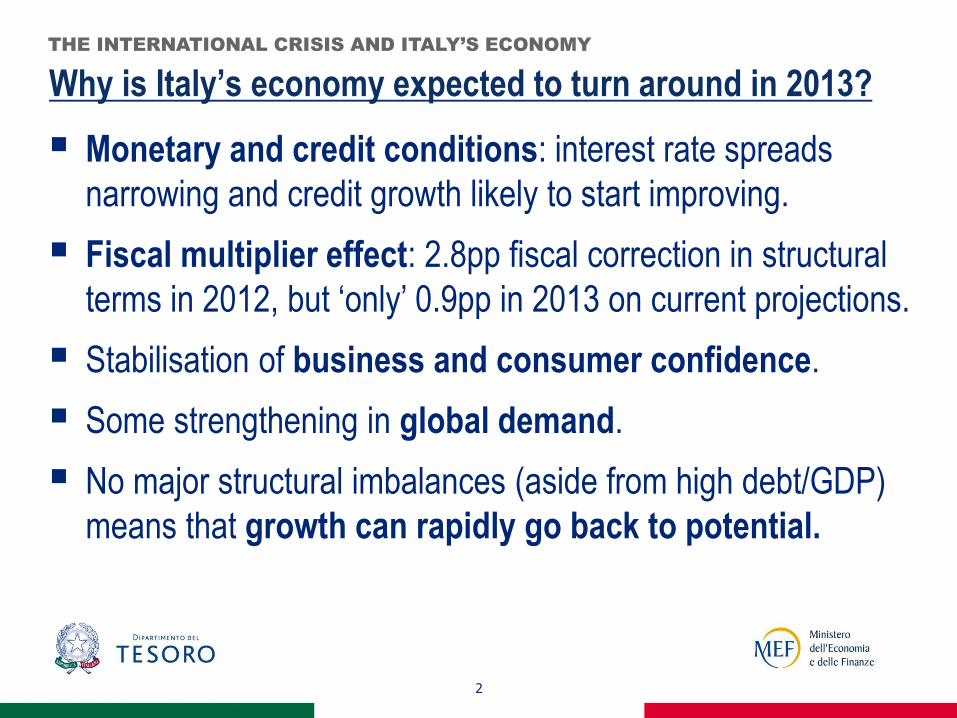
Why is Italy’s economy expected to turn around in 2013?
2
Monetary and credit conditions: interest rate spreads
narrowing and credit growth likely to start improving.
Fiscal multiplier effect: 2.8pp fiscal correction in structural
terms in 2012, but ‘only’ 0.9pp in 2013 on current projections.
Stabilisation of business and consumer confidence.
Some strengthening in global demand.
No major structural imbalances (aside from high debt/GDP)
means that growth can rapidly go back to potential.
THE INTERNATIONAL CRISIS AND ITALY’S ECONOMY
3
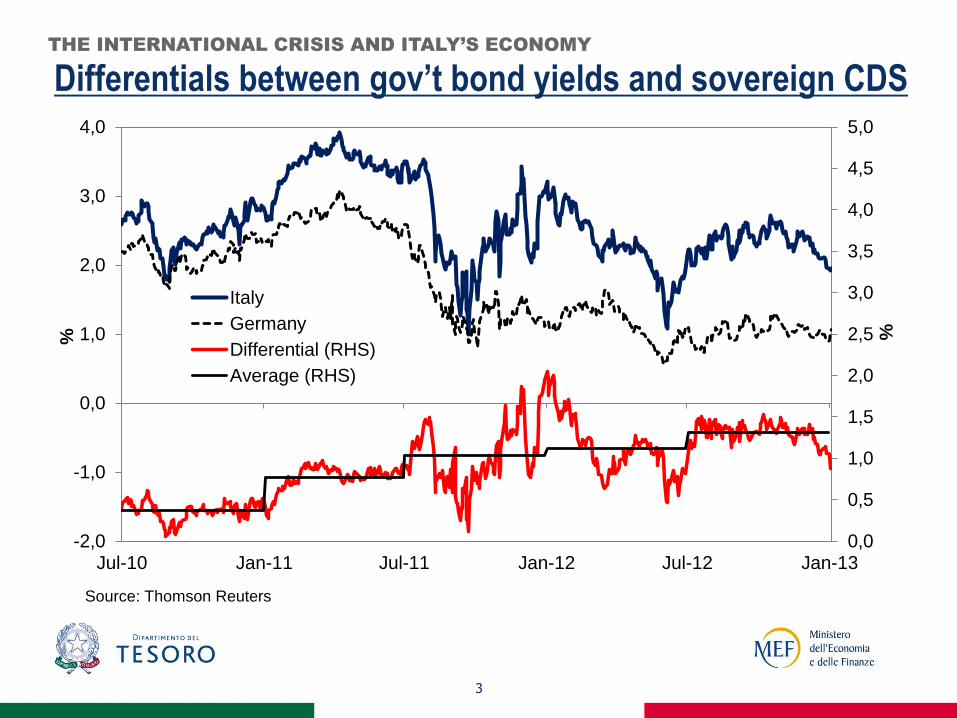
Differentials between gov’t bond yields and sovereign CDS THE INTERNATIONAL CRISIS AND ITALY’S ECONOMY
0,0
0,5
1,0
1,5
2,0
2,5
3,0
3,5
4,0
4,5
5,0
-2,0
-1,0
0,0
1,0
2,0
3,0
4,0
Jul-10 Jan-11 Jul-11 Jan-12 Jul-12 Jan-13
%
%
Italy
Germany
Differential (RHS)
Average (RHS)
Source: Thomson Reuters
4
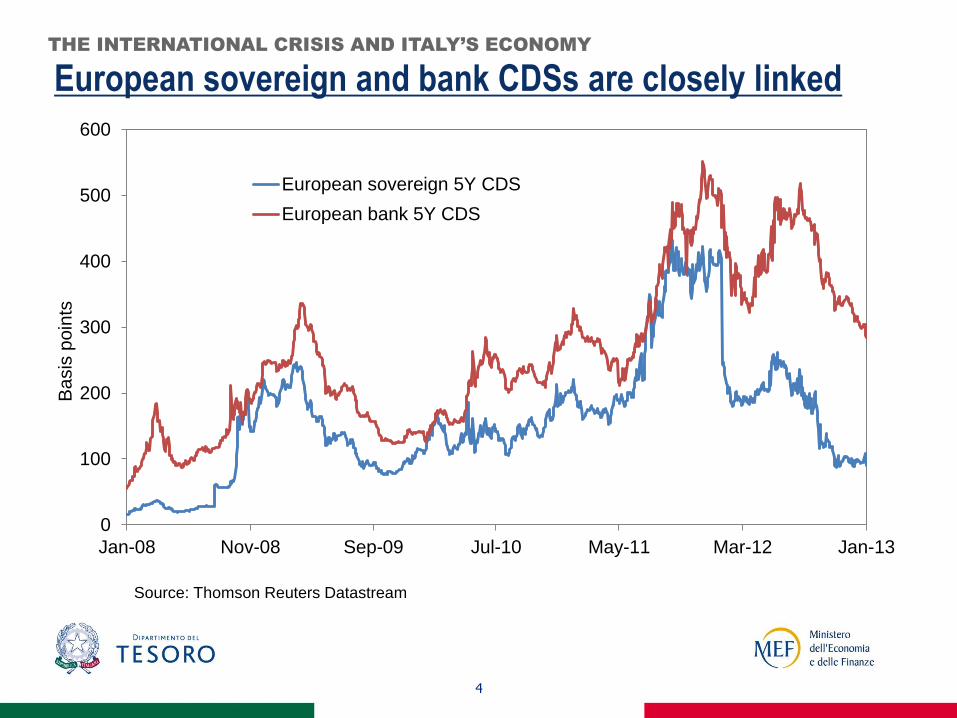
European sovereign and bank CDSs are closely linked THE INTERNATIONAL CRISIS AND ITALY’S ECONOMY
0
100
200
300
400
500
600
Jan-08 Nov-08 Sep-09 Jul-10 May-11 Mar-12 Jan-13
Ba
sis
po
ints
European sovereign 5Y CDS
European bank 5Y CDS
Source: Thomson Reuters Datastream

5
Rapid slowdown in credit growth: how soon will it turn?
THE INTERNATIONAL CRISIS AND ITALY’S ECONOMY
-8
-3
2
7
12
17
22
27
32
Dec-04 Dec-05 Dec-06 Dec-07 Dec-08 Dec-09 Dec-10 Dec-11 Dec-12
% y
ear
-on
-ye
ar
Euro area Germany
Spain France
Italy
Source: ECB
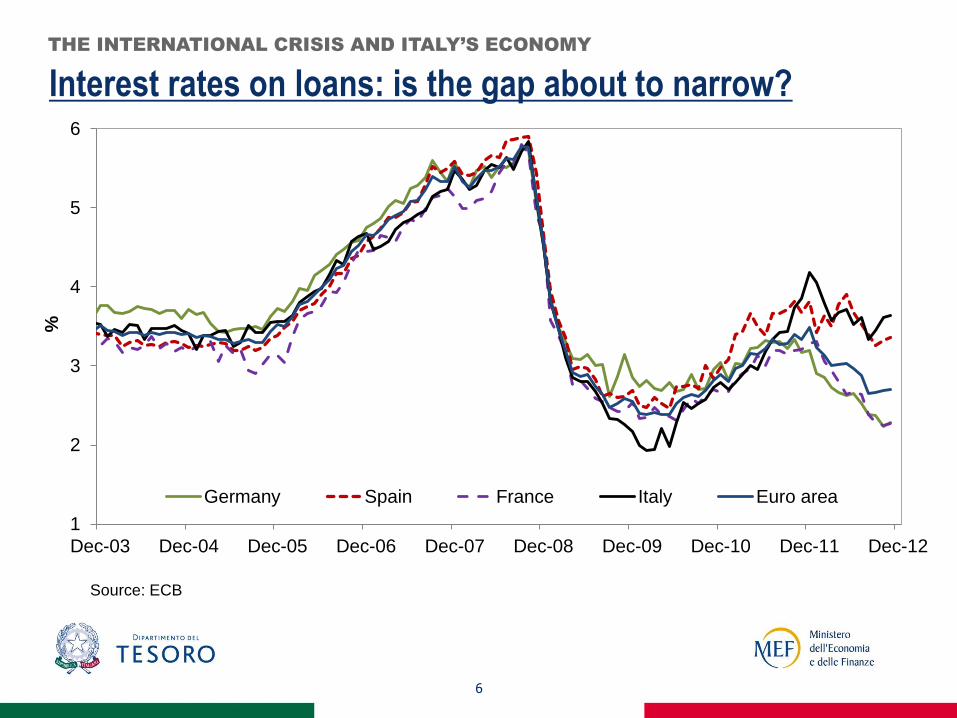
Interest rates on loans: is the gap about to narrow?
6
THE INTERNATIONAL CRISIS AND ITALY’S ECONOMY
1
2
3
4
5
6
Dec-03 Dec-04 Dec-05 Dec-06 Dec-07 Dec-08 Dec-09 Dec-10 Dec-11 Dec-12
%
Source: ECB
Germany Spain France Italy Euro area
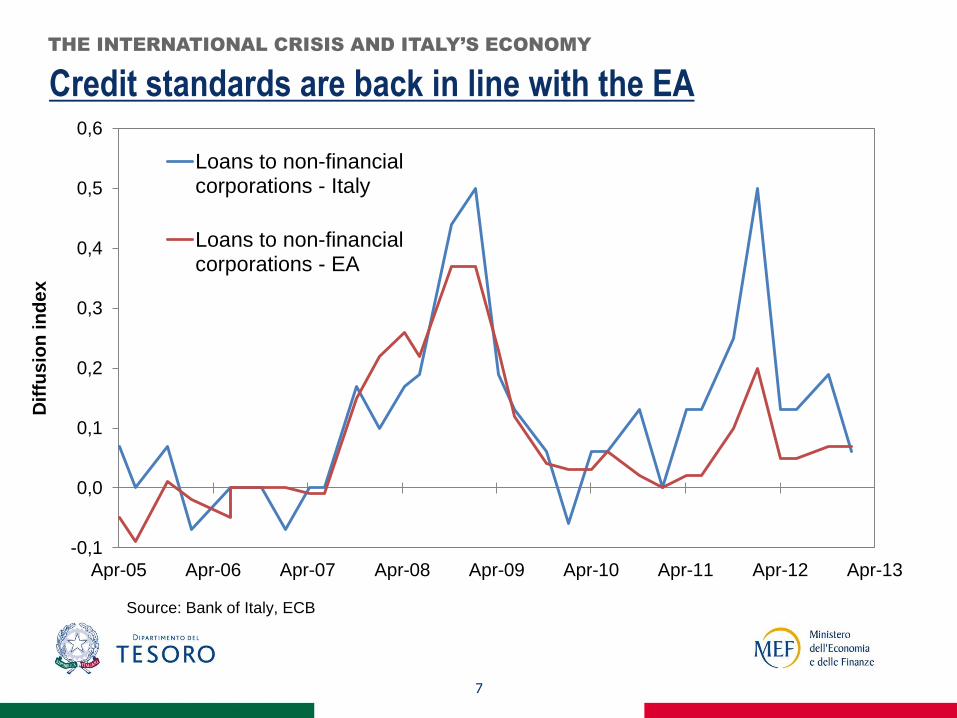
Credit standards are back in line with the EA
7
THE INTERNATIONAL CRISIS AND ITALY’S ECONOMY
-0,1
0,0
0,1
0,2
0,3
0,4
0,5
0,6
Apr-05 Apr-06 Apr-07 Apr-08 Apr-09 Apr-10 Apr-11 Apr-12 Apr-13
Dif
fus
ion
in
de
x
Loans to non-financialcorporations - Italy
Loans to non-financialcorporations - EA
Source: Bank of Italy, ECB
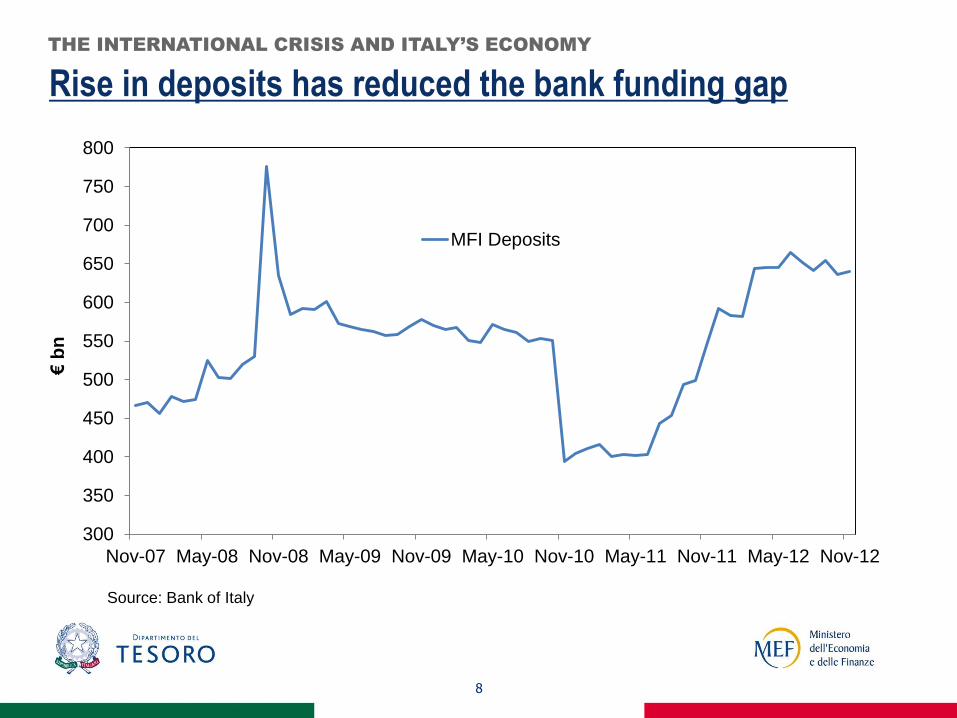
Rise in deposits has reduced the bank funding gap
8
THE INTERNATIONAL CRISIS AND ITALY’S ECONOMY
300
350
400
450
500
550
600
650
700
750
800
Nov-07 May-08 Nov-08 May-09 Nov-09 May-10 Nov-10 May-11 Nov-11 May-12 Nov-12
€ b
n
MFI Deposits
Source: Bank of Italy
9
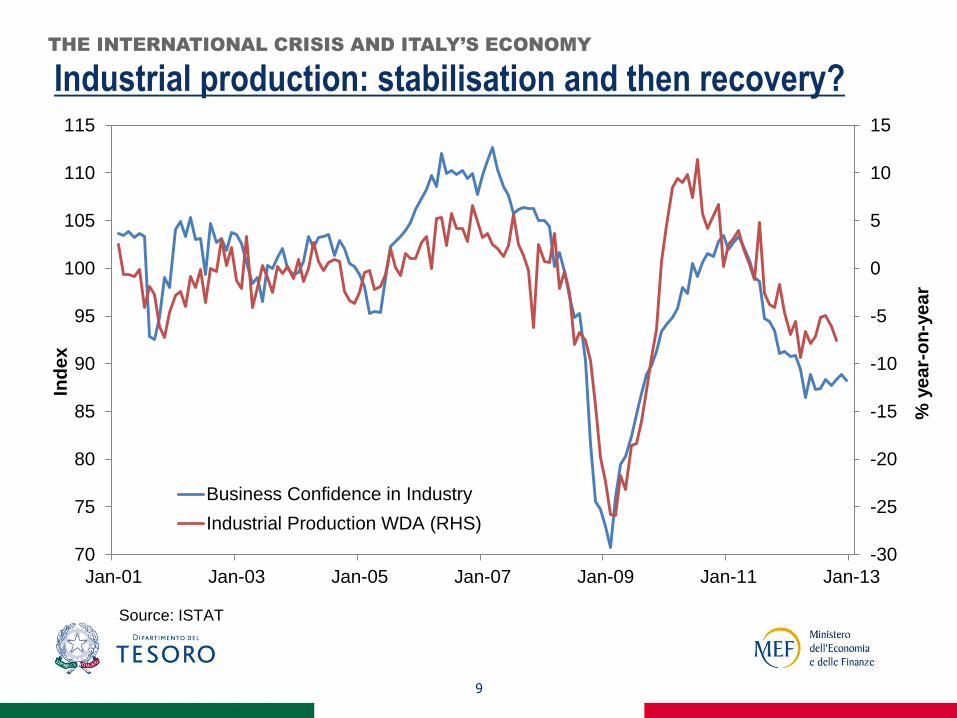
Industrial production: stabilisation and then recovery? THE INTERNATIONAL CRISIS AND ITALY’S ECONOMY
-30
-25
-20
-15
-10
-5
0
5
10
15
70
75
80
85
90
95
100
105
110
115
Jan-01 Jan-03 Jan-05 Jan-07 Jan-09 Jan-11 Jan-13
% y
ear-
on
-year
Ind
ex
Business Confidence in Industry
Industrial Production WDA (RHS)
Source: ISTAT
10
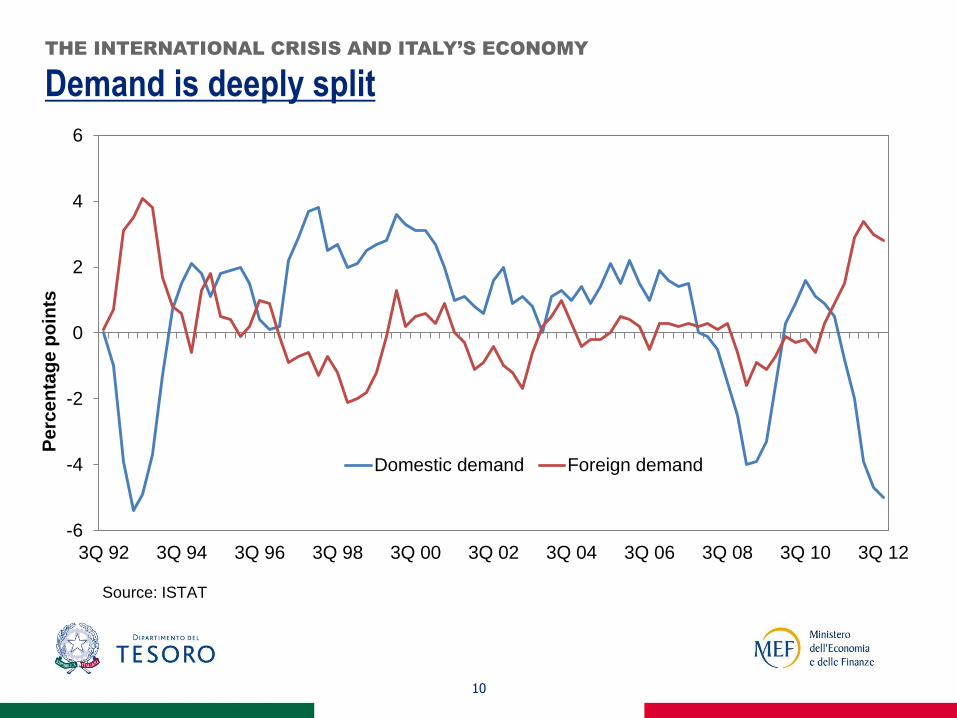
Demand is deeply split THE INTERNATIONAL CRISIS AND ITALY’S ECONOMY
-6
-4
-2
0
2
4
6
3Q 92 3Q 94 3Q 96 3Q 98 3Q 00 3Q 02 3Q 04 3Q 06 3Q 08 3Q 10 3Q 12
Pe
rce
nta
ge
po
ints
Domestic demand Foreign demand
Source: ISTAT
11
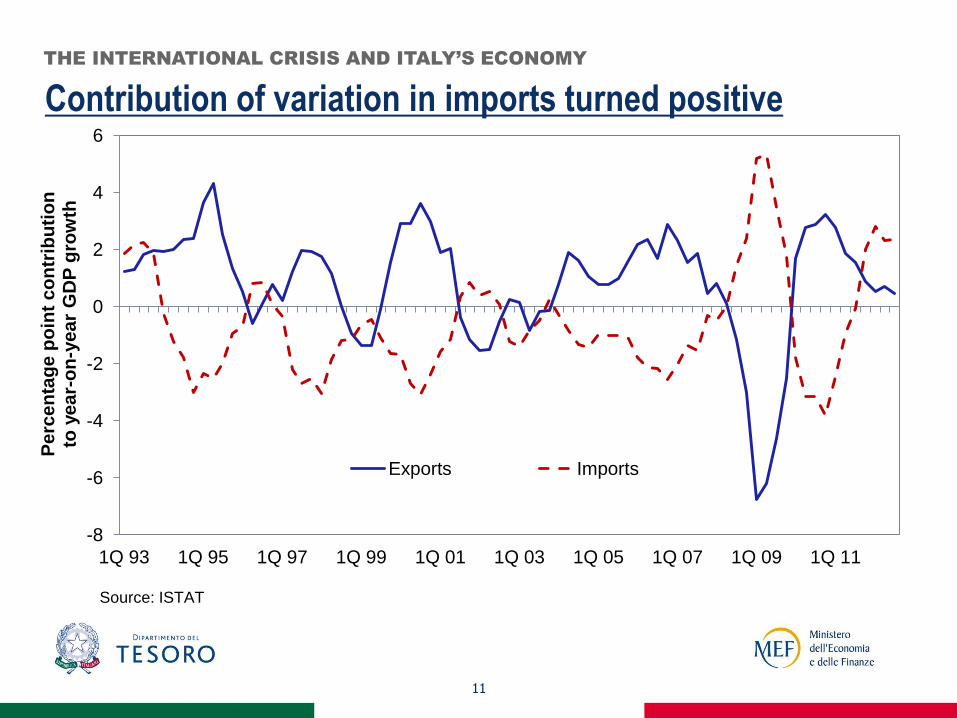
Contribution of variation in imports turned positive
-8
-6
-4
-2
0
2
4
6
1Q 93 1Q 95 1Q 97 1Q 99 1Q 01 1Q 03 1Q 05 1Q 07 1Q 09 1Q 11
Pe
rce
nta
ge
po
int
co
ntr
ibu
tio
n
to y
ea
r-o
n-y
ea
r G
DP
gro
wth
Exports Imports
Source: ISTAT
THE INTERNATIONAL CRISIS AND ITALY’S ECONOMY
12
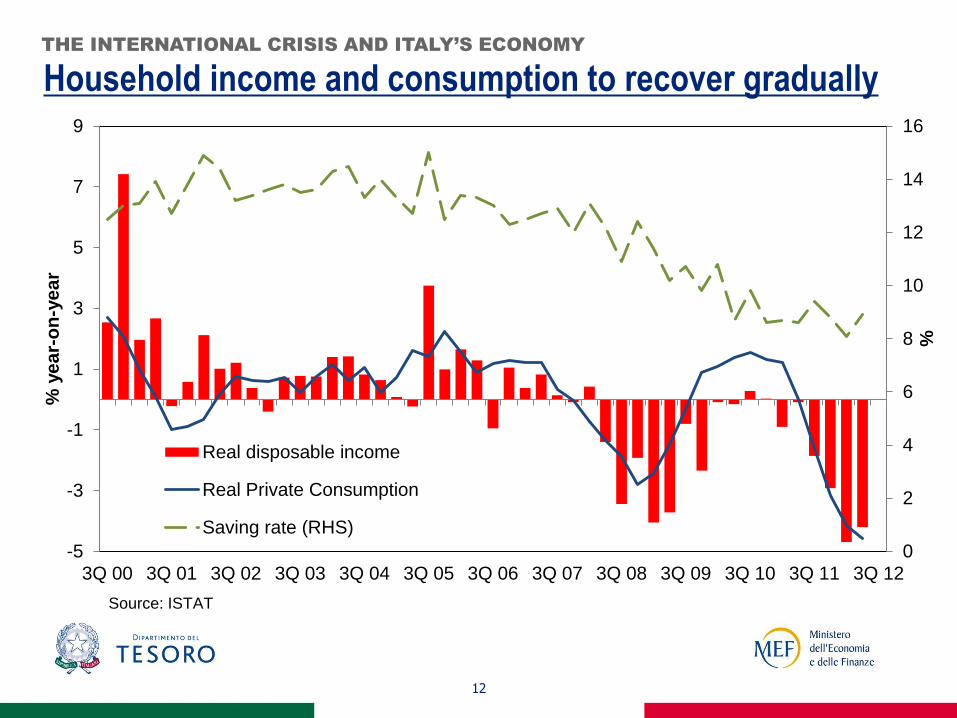
Household income and consumption to recover gradually THE INTERNATIONAL CRISIS AND ITALY’S ECONOMY
0
2
4
6
8
10
12
14
16
-5
-3
-1
1
3
5
7
9
3Q 00 3Q 01 3Q 02 3Q 03 3Q 04 3Q 05 3Q 06 3Q 07 3Q 08 3Q 09 3Q 10 3Q 11 3Q 12
%
% y
ea
r-o
n-y
ea
r
Real disposable income
Real Private Consumption
Saving rate (RHS)
Source: ISTAT
13
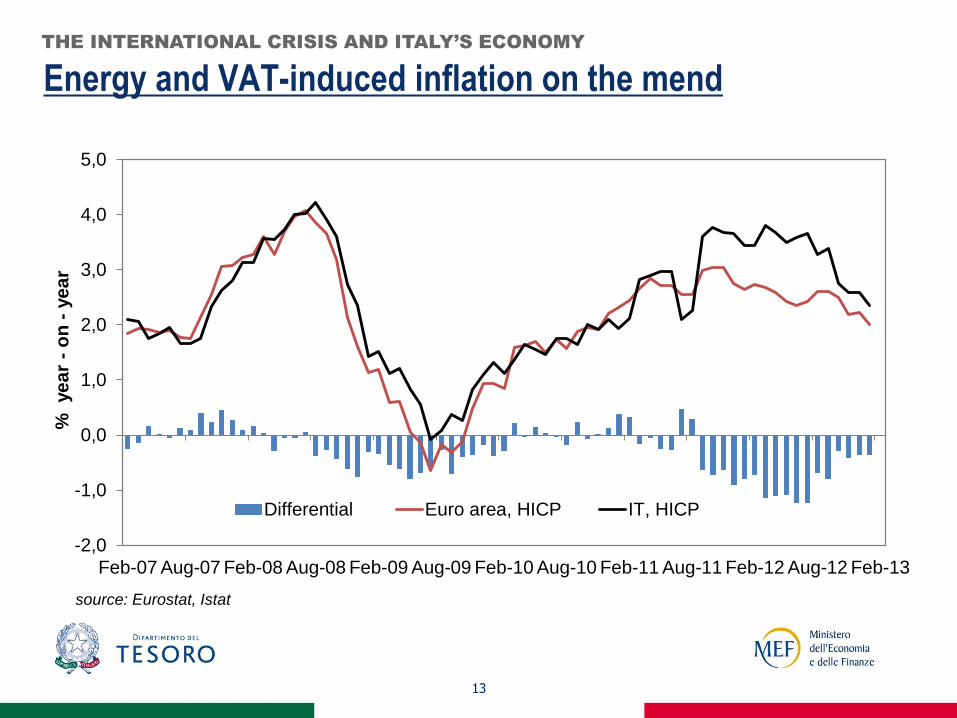
Energy and VAT-induced inflation on the mend THE INTERNATIONAL CRISIS AND ITALY’S ECONOMY
-2,0
-1,0
0,0
1,0
2,0
3,0
4,0
5,0
Feb-07 Aug-07 Feb-08 Aug-08 Feb-09 Aug-09 Feb-10 Aug-10 Feb-11 Aug-11 Feb-12 Aug-12 Feb-13
%
ye
ar
- o
n -
ye
ar
Differential Euro area, HICP IT, HICP
source: Eurostat, Istat

Official macroeconomic projections (September 2012)
14
Source: September 2012 Update to Economic and Financial Document.
THE INTERNATIONAL CRISIS AND ITALY’S ECONOMY
Source: Update of 2012 Economic and Financial Document, September 20, 2012
Note: National account data for 2011 take into account revisions according to ISTAT’s release on October 4.
(% change yoy) 2011 2012 2013 2014 2015
Real GDP 0.4 -2.4 -0.2 1.1 1.3
Domestic demand net of inventories -0.5 -3.6 -0.6 0.7 1.0
Inventories -0.5 -0.9 0.1 0.1 0.0
Net export 1.4 2.3 0.2 0.2 0.2
Nominal GDP 1.7 -1.0 1.2 3.0 3.2
GDP deflator 1.3 1.4 1.4 1.9 1.9
Labour cost 1.2 1.1 0.9 1.2 1.2
Productivity (on GDP) 0.3 -1.2 0.1 0.6 0.7
Unit labour cost (on GDP) 0.9 2.3 0.8 0.5 0.5
Employment (FTE) 0.1 -1.2 -0.3 0.4 0.6
Unemployment rate 8.4 10.8 11.4 11.3 10.9
Current account balance -3.1 -1.4 -1.3 -1.1 -1.0
No major imbalances (apart from high public debt)
15
No major macroeconomic imbalances: no major bubbles
in the housing market, low household debt, fundamentally
sound banking system, no major external imbalances.
No increase in discretionary spending during the crisis:
prudent fiscal policy; automatic stabilisers allowed to work.
Competitiveness issues are contained; although
admittedly high public debt/GDP is a major hurdle.
MACROECONOMIC IMBALANCES AND COMPETITIVENESS
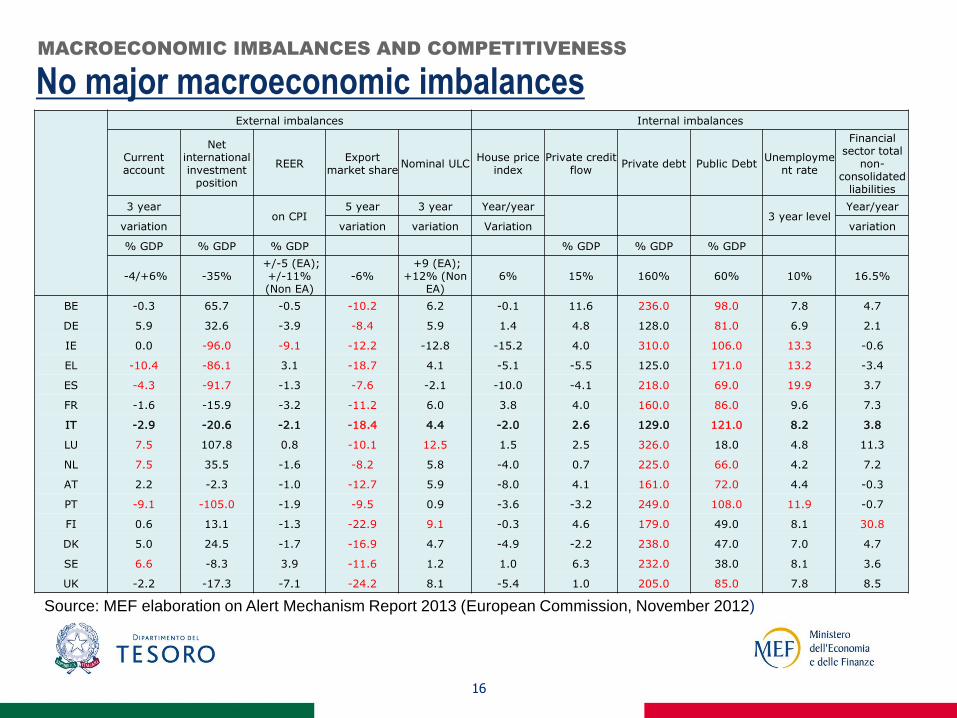
16
No major macroeconomic imbalances MACROECONOMIC IMBALANCES AND COMPETITIVENESS
Source: MEF elaboration on Alert Mechanism Report 2013 (European Commission, November 2012)
External imbalances Internal imbalances
Current account
Net international investment
position
REER Export
market share Nominal ULC
House price index
Private credit flow
Private debt Public Debt Unemployme
nt rate
Financial sector total
non-consolidated
liabilities
3 year on CPI
5 year 3 year Year/year 3 year level
Year/year
variation variation variation Variation variation
% GDP % GDP % GDP % GDP % GDP % GDP
-4/+6% -35% +/-5 (EA);
+/-11% (Non EA)
-6% +9 (EA);
+12% (Non EA)
6% 15% 160% 60% 10% 16.5%
BE -0.3 65.7 -0.5 -10.2 6.2 -0.1 11.6 236.0 98.0 7.8 4.7
DE 5.9 32.6 -3.9 -8.4 5.9 1.4 4.8 128.0 81.0 6.9 2.1
IE 0.0 -96.0 -9.1 -12.2 -12.8 -15.2 4.0 310.0 106.0 13.3 -0.6
EL -10.4 -86.1 3.1 -18.7 4.1 -5.1 -5.5 125.0 171.0 13.2 -3.4
ES -4.3 -91.7 -1.3 -7.6 -2.1 -10.0 -4.1 218.0 69.0 19.9 3.7
FR -1.6 -15.9 -3.2 -11.2 6.0 3.8 4.0 160.0 86.0 9.6 7.3
IT -2.9 -20.6 -2.1 -18.4 4.4 -2.0 2.6 129.0 121.0 8.2 3.8
LU 7.5 107.8 0.8 -10.1 12.5 1.5 2.5 326.0 18.0 4.8 11.3
NL 7.5 35.5 -1.6 -8.2 5.8 -4.0 0.7 225.0 66.0 4.2 7.2
AT 2.2 -2.3 -1.0 -12.7 5.9 -8.0 4.1 161.0 72.0 4.4 -0.3
PT -9.1 -105.0 -1.9 -9.5 0.9 -3.6 -3.2 249.0 108.0 11.9 -0.7
FI 0.6 13.1 -1.3 -22.9 9.1 -0.3 4.6 179.0 49.0 8.1 30.8
DK 5.0 24.5 -1.7 -16.9 4.7 -4.9 -2.2 238.0 47.0 7.0 4.7
SE 6.6 -8.3 3.9 -11.6 1.2 1.0 6.3 232.0 38.0 8.1 3.6
UK -2.2 -17.3 -7.1 -24.2 8.1 -5.4 1.0 205.0 85.0 7.8 8.5
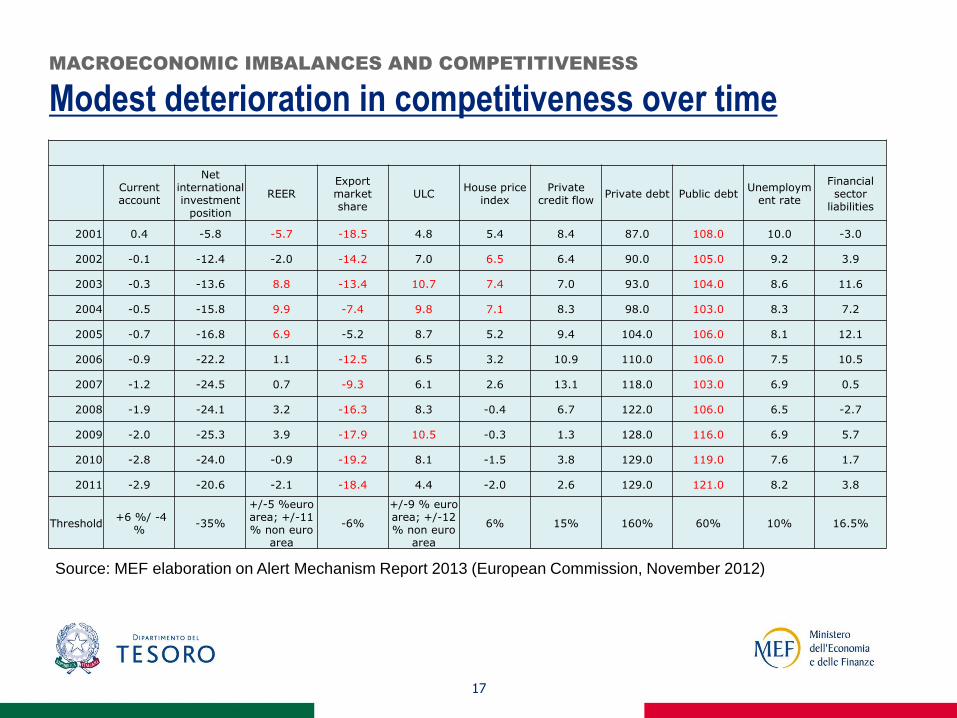
Modest deterioration in competitiveness over time
17
MACROECONOMIC IMBALANCES AND COMPETITIVENESS
Source: MEF elaboration on Alert Mechanism Report 2013 (European Commission, November 2012)
Current account
Net international investment
position
REER Export market share
ULC House price
index Private
credit flow Private debt Public debt
Unemployment rate
Financial sector
liabilities
2001 0.4 -5.8 -5.7 -18.5 4.8 5.4 8.4 87.0 108.0 10.0 -3.0
2002 -0.1 -12.4 -2.0 -14.2 7.0 6.5 6.4 90.0 105.0 9.2 3.9
2003 -0.3 -13.6 8.8 -13.4 10.7 7.4 7.0 93.0 104.0 8.6 11.6
2004 -0.5 -15.8 9.9 -7.4 9.8 7.1 8.3 98.0 103.0 8.3 7.2
2005 -0.7 -16.8 6.9 -5.2 8.7 5.2 9.4 104.0 106.0 8.1 12.1
2006 -0.9 -22.2 1.1 -12.5 6.5 3.2 10.9 110.0 106.0 7.5 10.5
2007 -1.2 -24.5 0.7 -9.3 6.1 2.6 13.1 118.0 103.0 6.9 0.5
2008 -1.9 -24.1 3.2 -16.3 8.3 -0.4 6.7 122.0 106.0 6.5 -2.7
2009 -2.0 -25.3 3.9 -17.9 10.5 -0.3 1.3 128.0 116.0 6.9 5.7
2010 -2.8 -24.0 -0.9 -19.2 8.1 -1.5 3.8 129.0 119.0 7.6 1.7
2011 -2.9 -20.6 -2.1 -18.4 4.4 -2.0 2.6 129.0 121.0 8.2 3.8
Threshold +6 %/ -4
% -35%
+/-5 %euro area; +/-11 % non euro
area
-6%
+/-9 % euro area; +/-12 % non euro
area
6% 15% 160% 60% 10% 16.5%
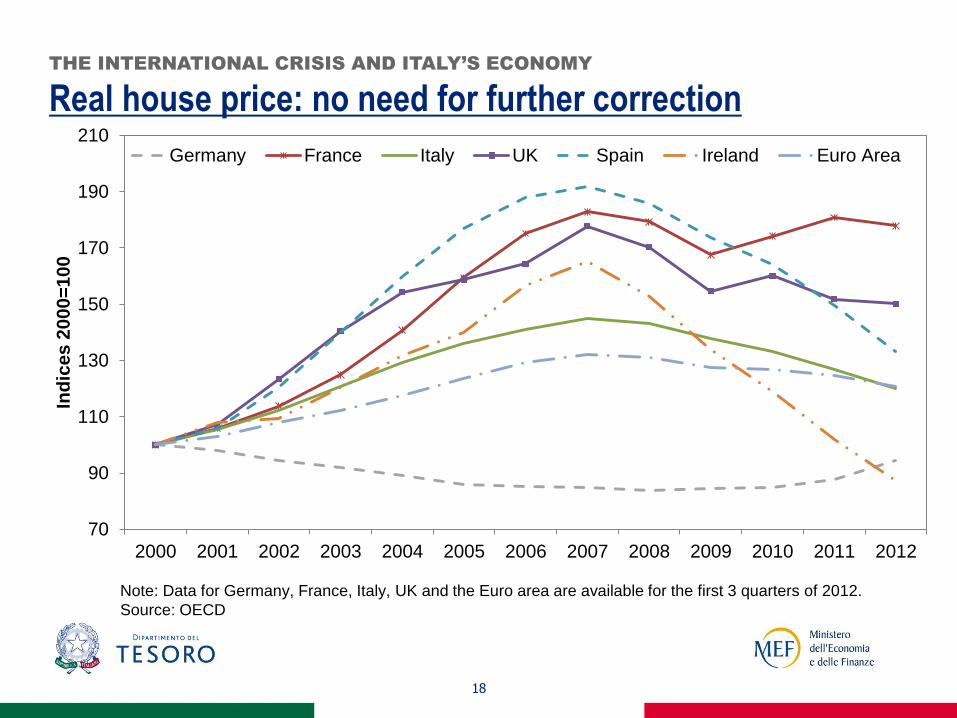
Real house price: no need for further correction
18
THE INTERNATIONAL CRISIS AND ITALY’S ECONOMY
70
90
110
130
150
170
190
210
2000 2001 2002 2003 2004 2005 2006 2007 2008 2009 2010 2011 2012
Ind
ice
s 2
00
0=
10
0
Germany France Italy UK Spain Ireland Euro Area
Note: Data for Germany, France, Italy, UK and the Euro area are available for the first 3 quarters of 2012.
Source: OECD
19
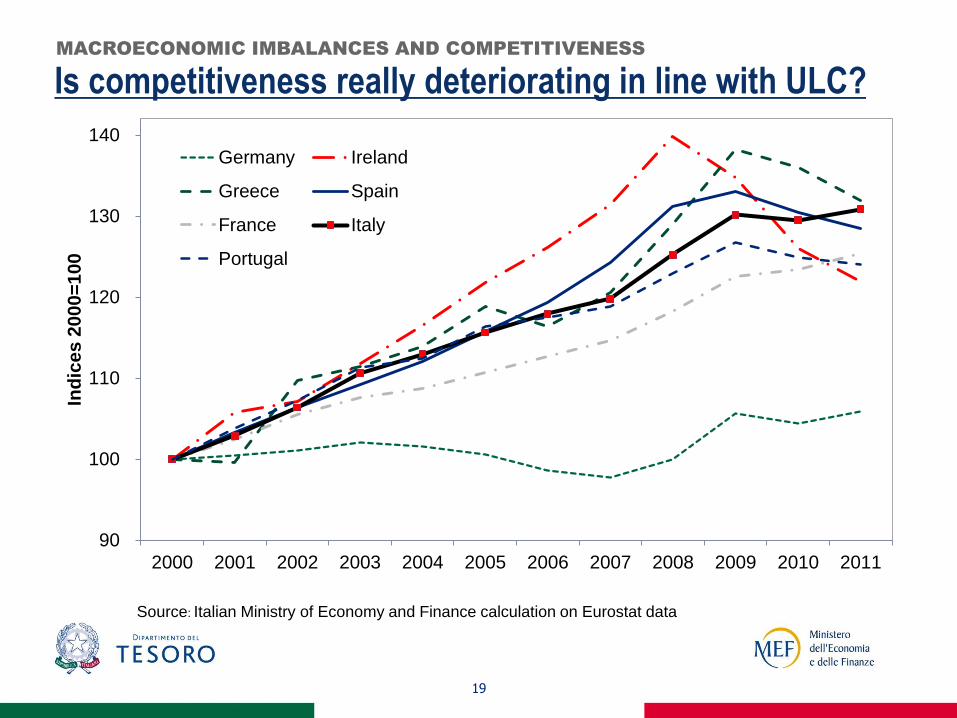
Is competitiveness really deteriorating in line with ULC? MACROECONOMIC IMBALANCES AND COMPETITIVENESS
Source: Italian Ministry of Economy and Finance calculation on Eurostat data
90
100
110
120
130
140
2000 2001 2002 2003 2004 2005 2006 2007 2008 2009 2010 2011
Ind
ice
s 2
00
0=
10
0
Germany Ireland
Greece Spain
France Italy
Portugal
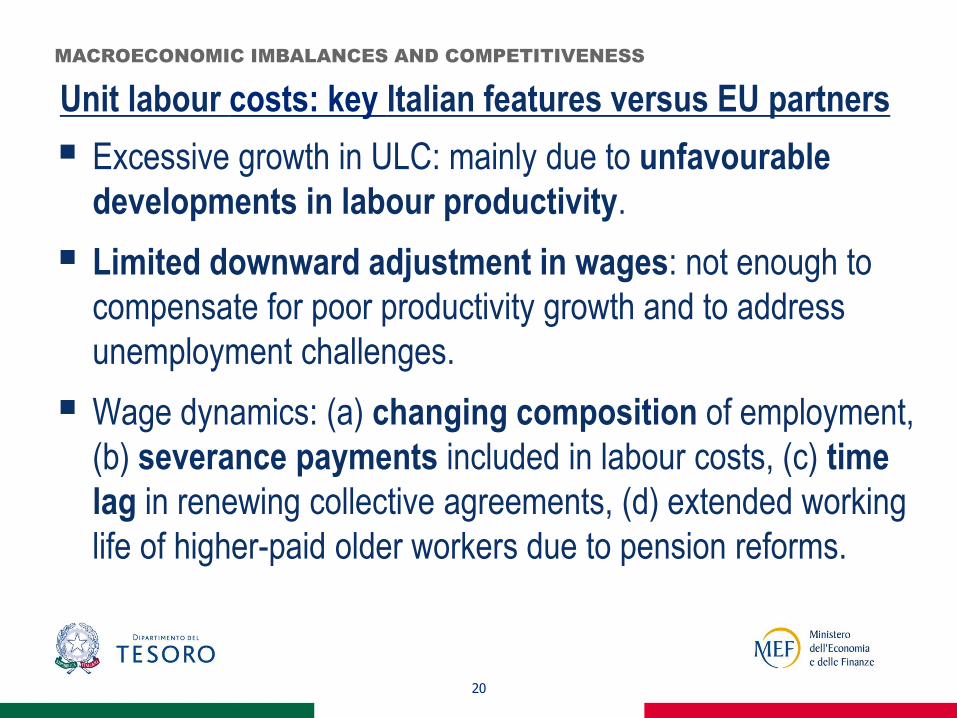
Unit labour costs: key Italian features versus EU partners
Excessive growth in ULC: mainly due to unfavourable
developments in labour productivity.
Limited downward adjustment in wages: not enough to
compensate for poor productivity growth and to address
unemployment challenges.
Wage dynamics: (a) changing composition of employment,
(b) severance payments included in labour costs, (c) time
lag in renewing collective agreements, (d) extended working
life of higher-paid older workers due to pension reforms.
20
MACROECONOMIC IMBALANCES AND COMPETITIVENESS
21
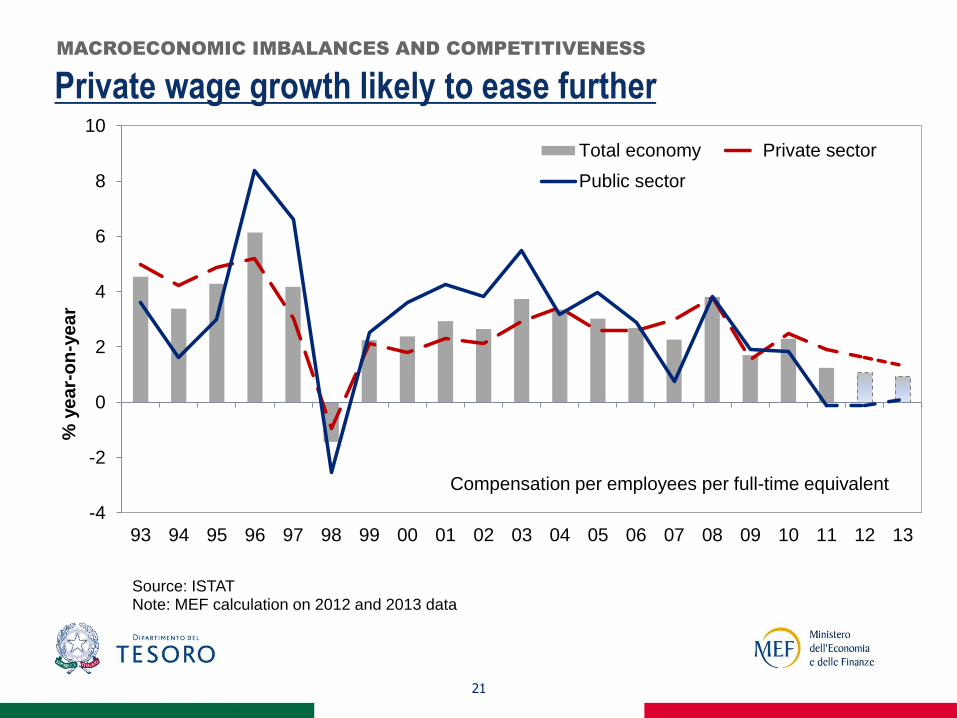
Private wage growth likely to ease further
MACROECONOMIC IMBALANCES AND COMPETITIVENESS
-4
-2
0
2
4
6
8
10
93 94 95 96 97 98 99 00 01 02 03 04 05 06 07 08 09 10 11 12 13
% y
ea
r-o
n-y
ea
r
Source: ISTAT Note: MEF calculation on 2012 and 2013 data
Total economy Private sector
Public sector
Compensation per employees per full-time equivalent
22
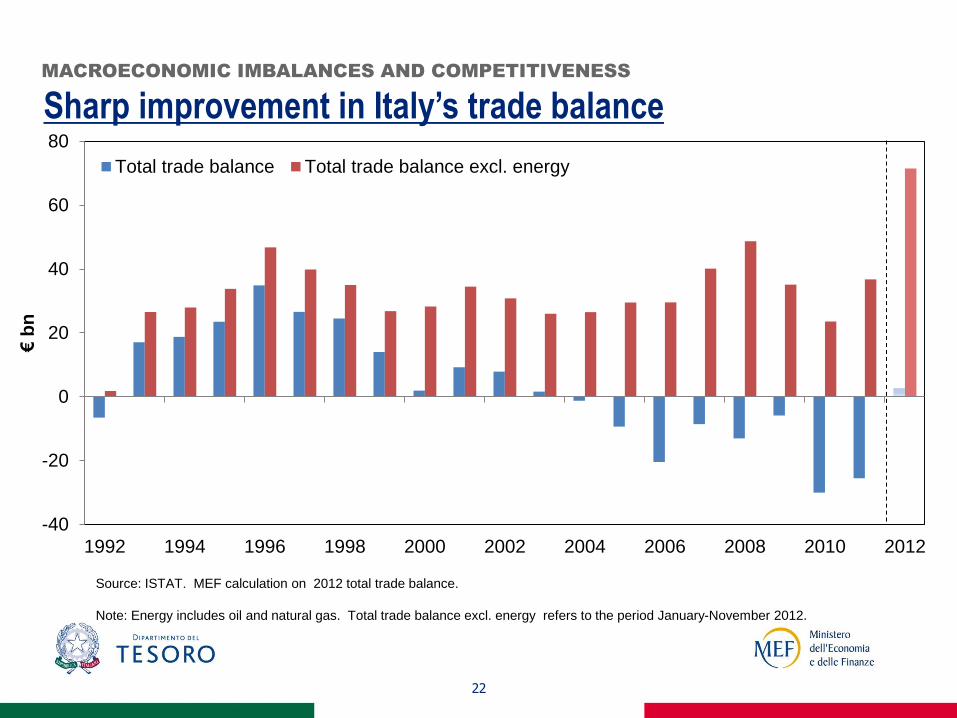
Sharp improvement in Italy’s trade balance MACROECONOMIC IMBALANCES AND COMPETITIVENESS
-40
-20
0
20
40
60
80
1992 1994 1996 1998 2000 2002 2004 2006 2008 2010 2012
€ b
n
Total trade balance Total trade balance excl. energy
Source: ISTAT. MEF calculation on 2012 total trade balance.
Note: Energy includes oil and natural gas. Total trade balance excl. energy refers to the period January-November 2012.
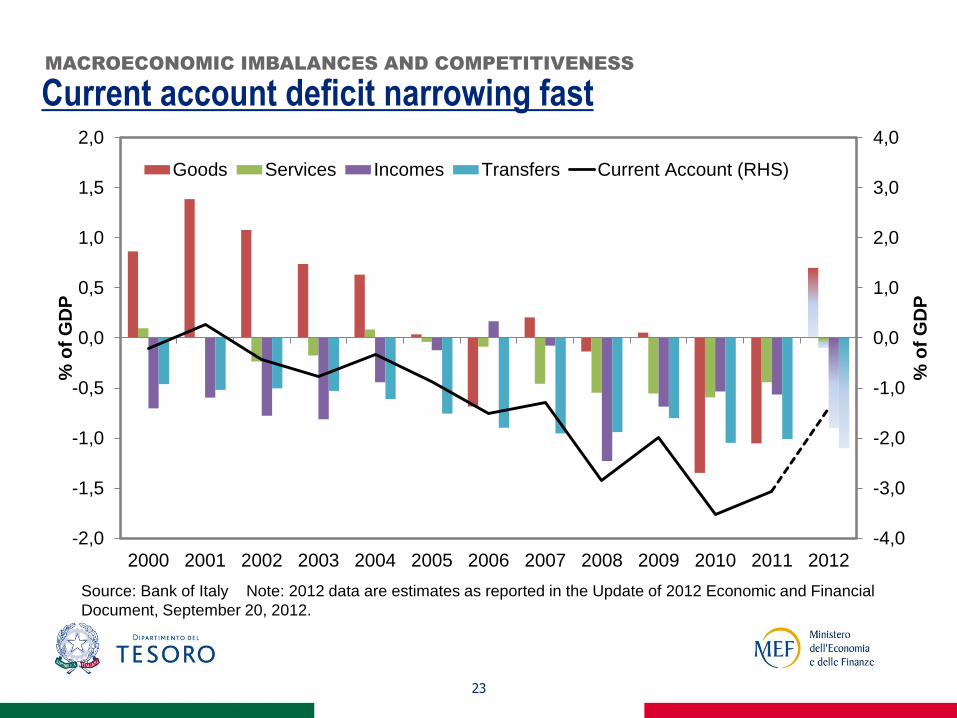
Current account deficit narrowing fast
23
MACROECONOMIC IMBALANCES AND COMPETITIVENESS
-4,0
-3,0
-2,0
-1,0
0,0
1,0
2,0
3,0
4,0
-2,0
-1,5
-1,0
-0,5
0,0
0,5
1,0
1,5
2,0
2000 2001 2002 2003 2004 2005 2006 2007 2008 2009 2010 2011 2012
% o
f G
DP
% o
f G
DP
Goods Services Incomes Transfers Current Account (RHS)
Source: Bank of Italy Note: 2012 data are estimates as reported in the Update of 2012 Economic and Financial
Document, September 20, 2012.
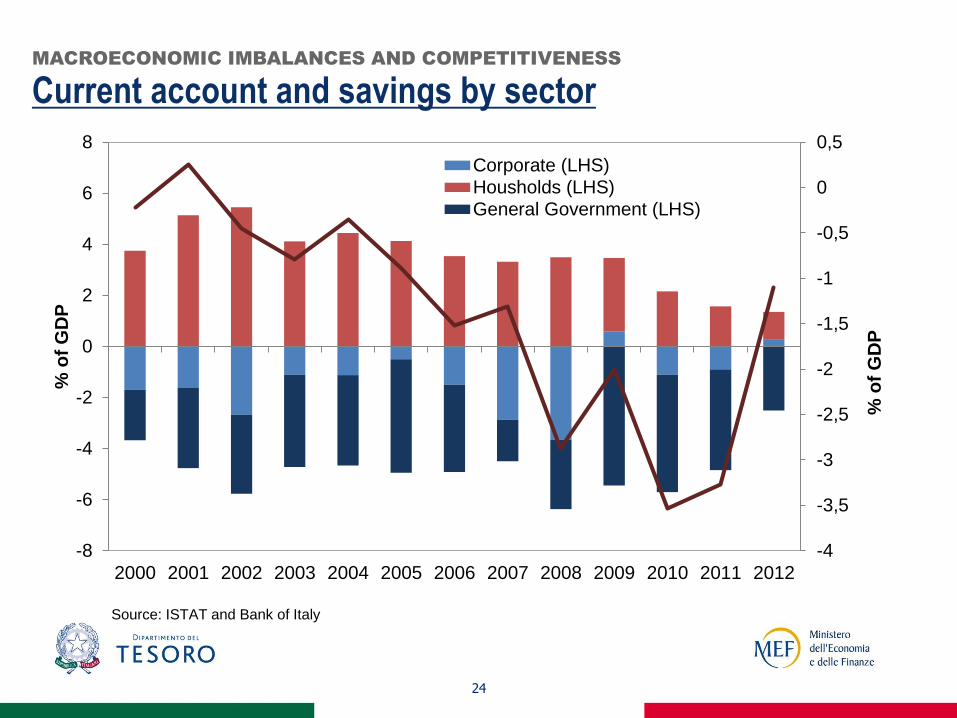
Current account and savings by sector
24
MACROECONOMIC IMBALANCES AND COMPETITIVENESS
-4
-3,5
-3
-2,5
-2
-1,5
-1
-0,5
0
0,5
-8
-6
-4
-2
0
2
4
6
8
2000 2001 2002 2003 2004 2005 2006 2007 2008 2009 2010 2011 2012
% o
f G
DP
% o
f G
DP
Corporate (LHS)
Housholds (LHS)
General Government (LHS)
Source: ISTAT and Bank of Italy
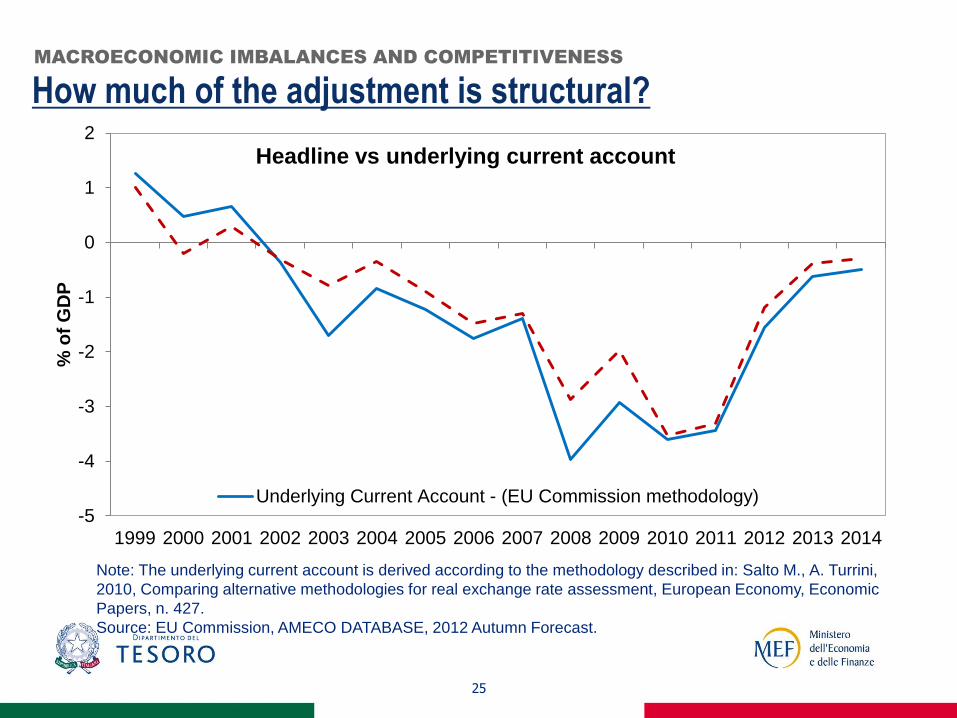
How much of the adjustment is structural?
25
Note: The underlying current account is derived according to the methodology described in: Salto M., A. Turrini,
2010, Comparing alternative methodologies for real exchange rate assessment, European Economy, Economic
Papers, n. 427.
Source: EU Commission, AMECO DATABASE, 2012 Autumn Forecast.
MACROECONOMIC IMBALANCES AND COMPETITIVENESS
-5
-4
-3
-2
-1
0
1
2
1999 2000 2001 2002 2003 2004 2005 2006 2007 2008 2009 2010 2011 2012 2013 2014
% o
f G
DP
Headline vs underlying current account
Underlying Current Account - (EU Commission methodology)

Key public finance projections (September 2012)
26
FISCAL CONSOLIDATION
% of GDP 2010 2011 2012 2013 2014 2015
Net Borrowing Requirement -4.6 -3.9 -2.6 -1.8 -1.5 -1.3
Cyclically-adjusted NBR -3.6 -3.6 -0.9 0.0 -0.2 -0.4
Change in Cyclically-adjusted NBR -0.4 0.0 -2.8 -0.9 0.3 0.2
Primary Balance 0.1 1.0 2.9 3.8 4.4 4.8
Public Debt 119.2 120.7 126.4 126.1 123.1 119.9
Public Debt (net support to Euro Zone) 118.9 119.9 123.3 122.3 119.3 116.1
Source: Update of 2012 Economic and Financial Document, September 20, 2012
27
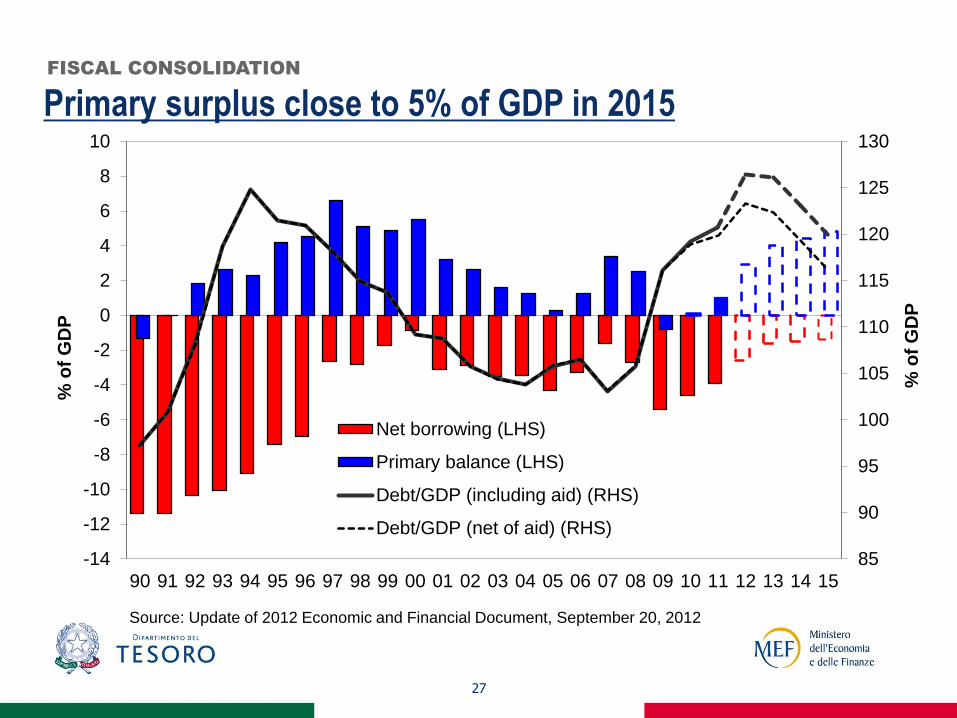
Primary surplus close to 5% of GDP in 2015
FISCAL CONSOLIDATION
Source: Update of 2012 Economic and Financial Document, September 20, 2012
85
90
95
100
105
110
115
120
125
130
-14
-12
-10
-8
-6
-4
-2
0
2
4
6
8
10
90 91 92 93 94 95 96 97 98 99 00 01 02 03 04 05 06 07 08 09 10 11 12 13 14 15
% o
f G
DP
% o
f G
DP
Net borrowing (LHS)
Primary balance (LHS)
Debt/GDP (including aid) (RHS)
Debt/GDP (net of aid) (RHS)

28
2011-2012 measures: a rebalancing over time
FISCAL CONSOLIDATION
0
10
20
30
40
50
60
70
80
90
100
2012 2013 2014 2015
%
Higher net revenues Lower net expenditure
Source: MEF estimates

29
Moderate increase in interest payments (forward rates)
FISCAL CONSOLIDATION
0
2
4
6
8
10
12
14
0
2
4
6
8
10
12
141993
1994
1995
1996
1997
1998
1999
2000
2001
2002
2003
2004
2005
2006
2007
2008
2009
2010
2011
2012
2013
2014
2015
%
Interest payments (LHS) Average yield at issuance Average yield as % debt *
% o
f G
DP
Source: Ministry of Economy and Finance. Figures for interest payments in 2012-2015 are official estimates
(Update 2012 DEF)
* Proxied by interest expenditure divided by the debt level of the previous year
30
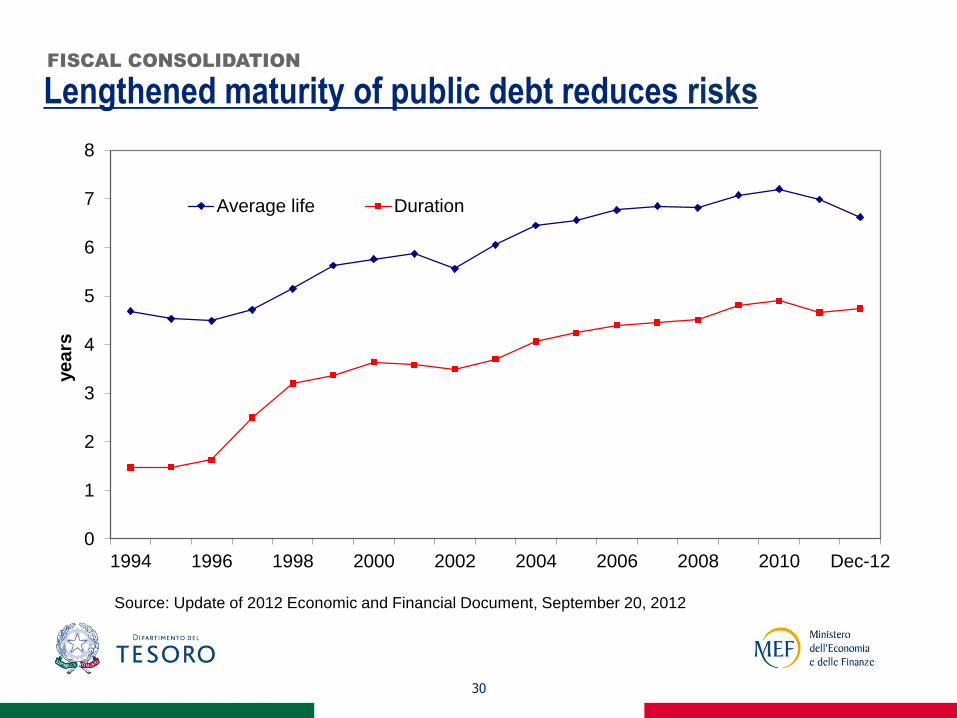
Lengthened maturity of public debt reduces risks
FISCAL CONSOLIDATION
0
1
2
3
4
5
6
7
8
1994 1996 1998 2000 2002 2004 2006 2008 2010 Dec-12
ye
ars
Average life Duration
Source: Update of 2012 Economic and Financial Document, September 20, 2012
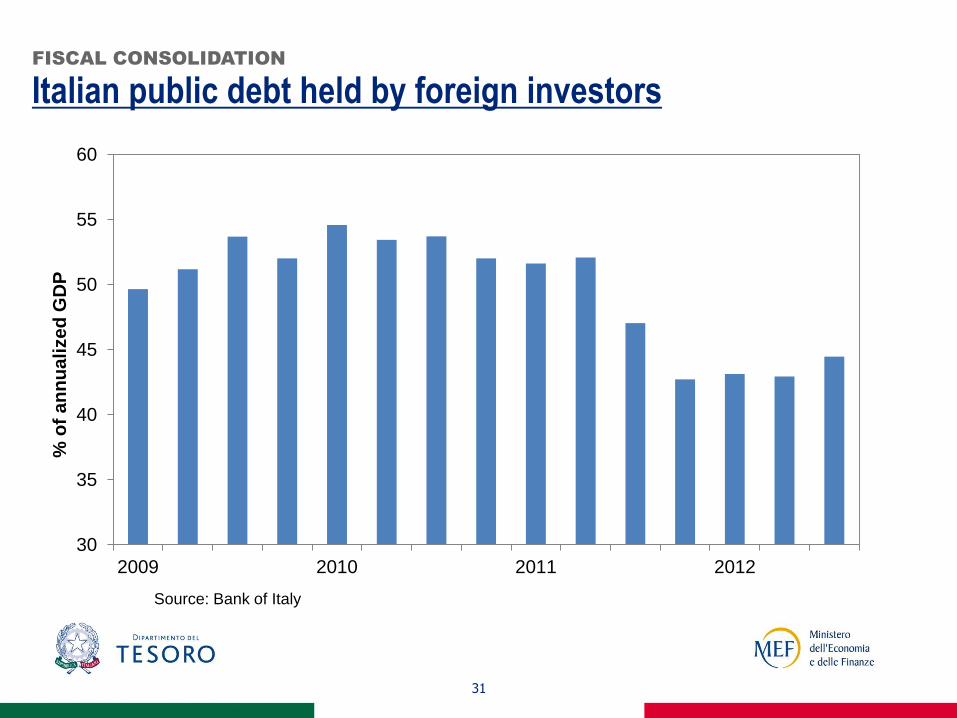
Italian public debt held by foreign investors
31
FISCAL CONSOLIDATION
30
35
40
45
50
55
60
2009 2010 2011 2012
% o
f a
nn
ua
lize
d G
DP
Source: Bank of Italy
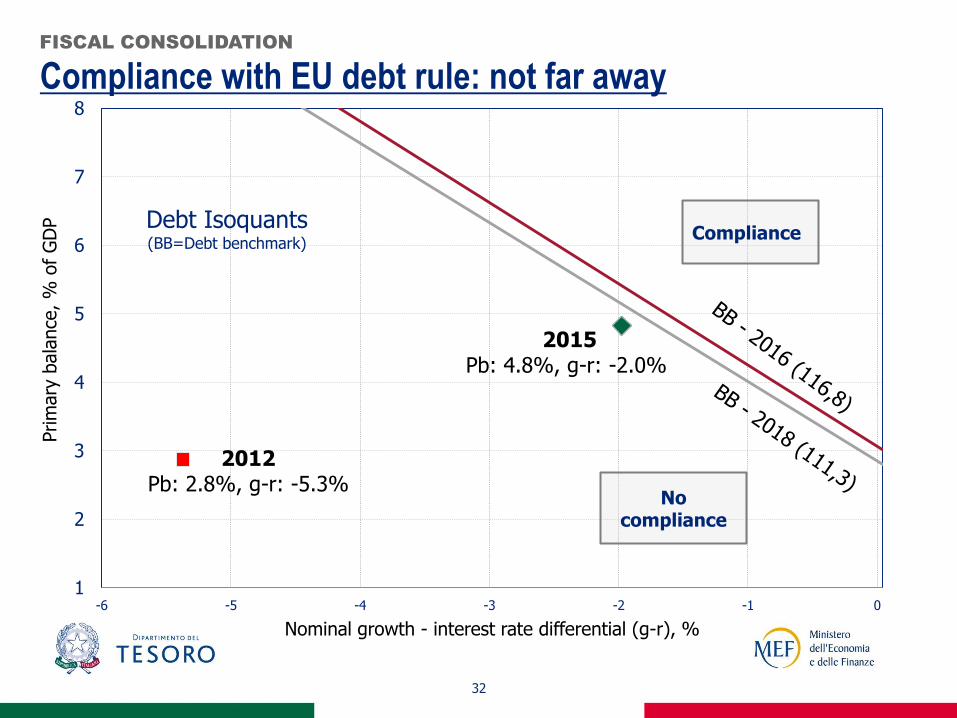
Compliance with EU debt rule: not far away
32
FISCAL CONSOLIDATION
1
2
3
4
5
6
7
8
-6 -5 -4 -3 -2 -1 0
Prim
ary
bala
nce
, %
of
GD
P
Nominal growth - interest rate differential (g-r), %
Debt Isoquants (BB=Debt benchmark)
2012 Pb: 2.8%, g-r: -5.3%
No
compliance
2015 Pb: 4.8%, g-r: -2.0%
Compliance
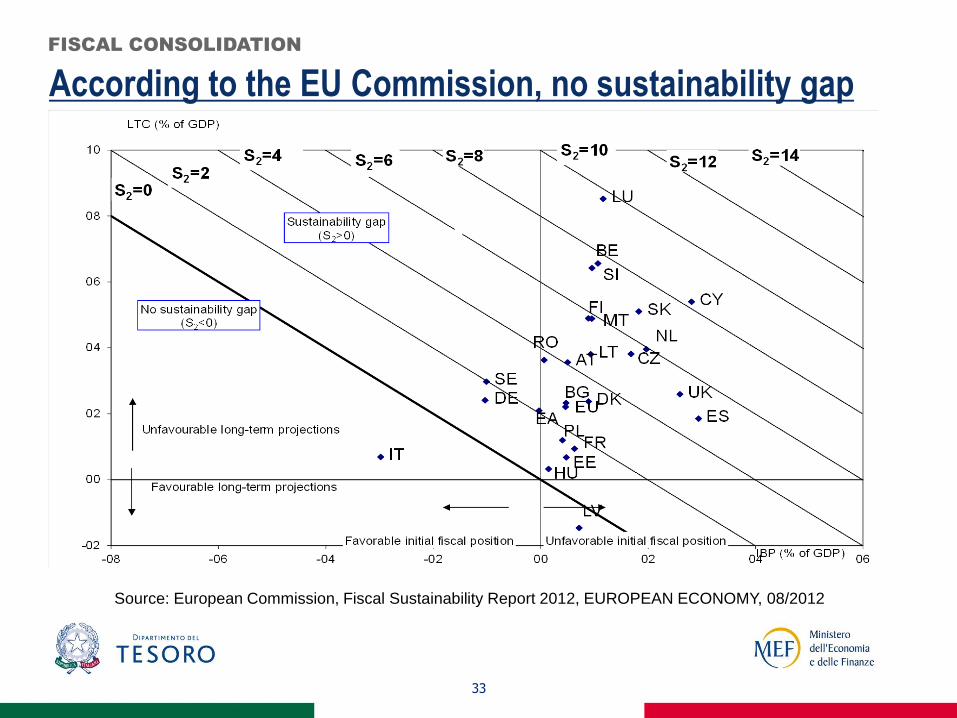
According to the EU Commission, no sustainability gap
33
FISCAL CONSOLIDATION
Source: European Commission, Fiscal Sustainability Report 2012, EUROPEAN ECONOMY, 08/2012
34
Reduction in the stock of public debt: mapping public assets
Local government debt is only 6% of GDP. However, 54% of
real estate assets and stockholdings are at local level.
Very difficult to get a reliable, complete and updated valuation:
1/3 of GDP= tentative estimate of value of recorded assets.
Buildings: Only 53% of administrations have provided
detailed information about their assets. 530,000 real estate
units for 222mn sqm of which 70% is for institutional use and
9% for residential use (47% in terms of units). 80% of units are
owned by local government. Market value is estimated at
about 340bn (21.7% of GDP).
FISCAL CONSOLIDATION

35
Reduction of the stock of public debt: few marketable assets
Land: 760,000 plots of land for a total of more than 1.3mn ha,
98% held by local government (82% municipalities). Market
value is estimated at about 30bn (1.9% of GDP).
Stockholdings: About 7,000 companies of which 80% owned
by local government. Market value estimated at about 150bn
(9.6% of GDP) of which 85.8bn owned by the Ministry of
Economy and Finance (1/2 is National Railways). The three
major quoted companies (about 12bn) are perceived as
strategic; for others there is no market appetite; moreover
quoted companies have far off-peak values.
FISCAL CONSOLIDATION
36
Reduction in the stock of public debt: coming soon
€8.0bn from sale to CDP of SACE, SIMEST and Fintecna.
Further payments are expected by early 2013. Proceeds go to
the Public Debt Sinking Fund or to pay off commercial debt.
Real estate assets will be transferred from central and local
government to real estate funds, which have mandates to
create value and/or dismiss assets.
The Government expects proceeds from dismissals to reduce
public debt by at least 1pp of GDP per year. 3-5bn of state-
owned assets ready for 2013; the rest requires strong
cooperation with local government.
FISCAL CONSOLIDATION
Going for growth and fiscal consolidation
37
RECENT BUDGET MEASURES
Freeing up resources of about €10bn in 2013, €10.7bn in 2014
and €10.1bn in 2015 respectively.
Use of resources for about €12.3bn in 2013, €10.6bn in 2014
and €9.7bn in 2015.
Rebalancing revenues/expenditure to favour growth and fiscal
consolidation.
Reduction in taxes on labour.
Key measures for fiscal consolidation
38
RECENT BUDGET MEASURES
Cut in NHS spending for goods and services and medical
devices.
Further cuts in transfers to local governments in 2013-2015.
Introduction of the Tobin Tax on transactions involving equities
with a proportional tax rate of 0.1% (0.2% for OTC financial
transactions) paid by buyers, to be aligned with European
legislation once it is decided; different treatment on derivatives
(lump sum with a maximum fee of €200 for transactions above
€1Mn) for both buyers and sellers.

Key measures to support growth (1)
39
RECENT BUDGET MEASURES
Increase in the ordinary VAT rate from 21 to 22% as of July
2013, while the lower VAT rate remains at 10%.
Higher tax allowances for families with children: From 2013
the tax credit is €1,220 (currently €900) for each child under the
age of 3 and €950 (€800) for those older than 3.
Reduction in taxes on labour: effective 2013, tax deductions
for employers on IRAP to increase from €4,600 to €7,500. Even
higher deductions for women, workers under 35, and firms
located in ‘disadvantaged’ Regions.

Key measures to support growth (2)
40
RECENT BUDGET MEASURES
Small enterprises and self-employed entrepreneurs can rely
on a new fund for IRAP tax exemptions.
A special fund is designed to favour investments in R&D by
SMEs, using resources previously allocated on a generic basis
to firms. The fund also finances a reduction in the tax wedge.
A new fund, financed with proceeds from the fight against tax
evasion, to reduce the tax burden on households and firms.
Infrastructure projects: additional financing of the Lyon-Turin
high-speed train line and ‘MOSE’, the dam system for Venice.
Constitutional reform: a new fiscal framework
Balanced budget rule included in the Constitution: it will
enter into force in FY 2014.
In December 2012, Parliament approved the ‘reinforced’ law
defining the mechanism by which the balanced budget will be
achieved and clarifying the functions of the independent body
(established by Constitutional amendment) within the
Parliament in charge of monitoring public finances and
checking compliance with fiscal rules.
41
FISCAL CONSOLIDATION
The Government proposal for a reform of the tax system
Reform of cadastral rents: adequacy between official and
actual real estate values.
Fight against tax elusion and avoidance: reshuffling of tax
expenditures for small businesses and low income tax payers.
Tax framework for enterprises: changes in the IRAP tax base
and a single, combined payment of IRAP, IRES and IVA for
small firms.
Sanctions proportional to gravity of violation: more room for
judicial settlement procedures, reorganisation in tax collection.
42
FISCAL CONSOLIDATION

Reduction in the cost of doing politics
Reduced financing of political parties as well as appointees at
regional level; reduction in the number of regional counselors.
Increased financial controls and sanctions for Regions that
do not respect the rules (80% cut in central Government
financing, excluding health care and transport funding).
Greater transparency in balance sheets of local political groups
and regional politicians’ income and personal wealth. Stricter
criteria regarding politicians’ compensation and pension.
Plan to achieve a balance budget within 5 years in case of
excessive deficit in provinces and municipalities.
43
FISCAL CONSOLIDATION
FISCAL CONSOLIDATION
Public sector shrinking since 2007
Since 2007 the number of public employees and their
compensation has declined by 4.3% and 2.3%,
respectively.
Related cost of labour has decreased by 3.3%.
This is the result of 2010 and 2011 policy changes:
extension of freeze in turnover and suspension of national
wage bargaining.
44
Lower tax wedge on labour
45
FISCAL CONSOLIDATION
Higher tax allowances for families with children: From 2013
the tax credit is €1,220 (currently €900) for each child under the
age of 3 and €950 (€800) for those older than 3.
Reduction in taxes on labour: effective 2013, tax deduction for
employers on IRAP to increase from €4,600 to €7,500. Even
higher deductions for women, workers under 35, and firms
located in ‘disadvantaged’ Regions.
Key achievements of the pension reform
Enhances the medium and long-term sustainability of
Italy’s pension system.
Guarantees fairness across and intra generations.
Increases the minimum retirement age and contribution
period required to be entitled to pension benefits.
Links retirement age and contributory periods to changes in
life expectancy.
Improves transparency by merging entities providing
pensions (INPDAP and ENPALS into INPS).
46
PENSION REFORM
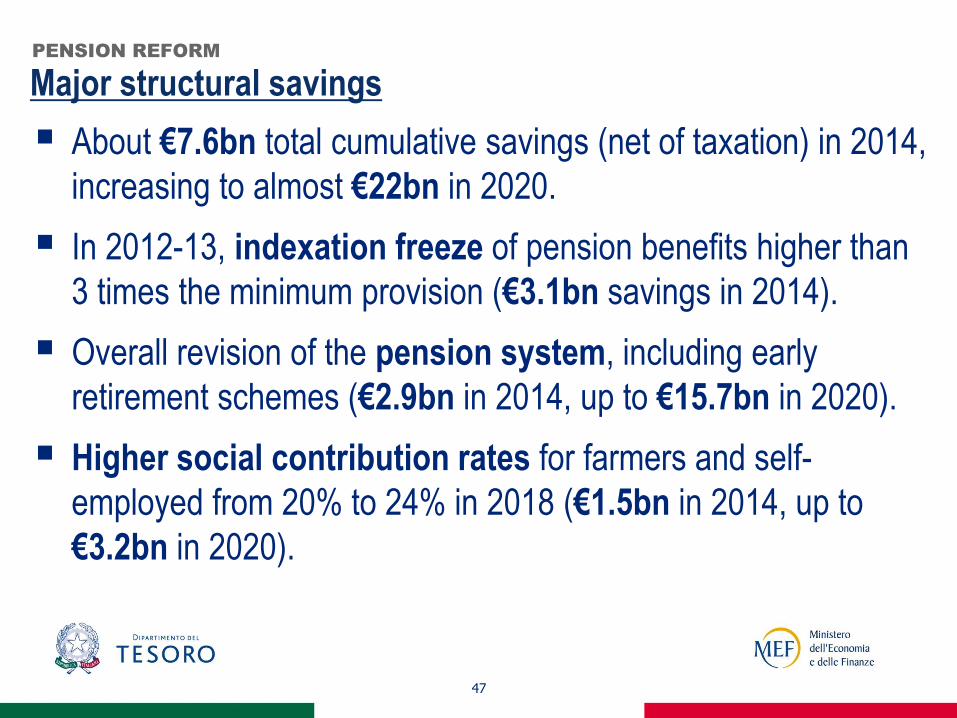
Major structural savings
About €7.6bn total cumulative savings (net of taxation) in 2014,
increasing to almost €22bn in 2020.
In 2012-13, indexation freeze of pension benefits higher than
3 times the minimum provision (€3.1bn savings in 2014).
Overall revision of the pension system, including early
retirement schemes (€2.9bn in 2014, up to €15.7bn in 2020).
Higher social contribution rates for farmers and self-
employed from 20% to 24% in 2018 (€1.5bn in 2014, up to
€3.2bn in 2020).
47
PENSION REFORM
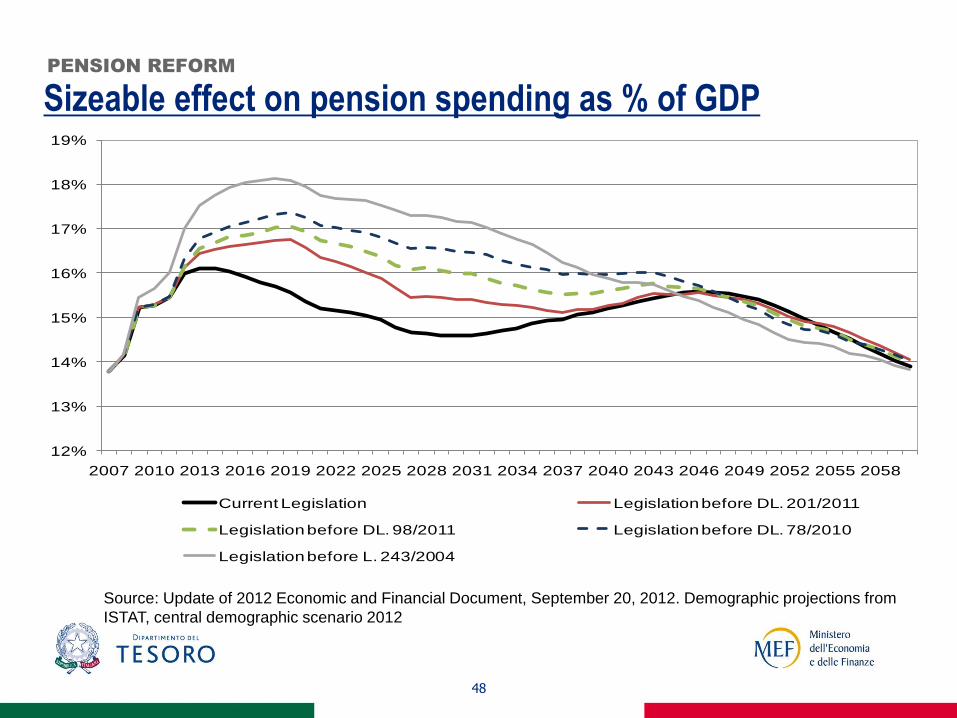
48
Sizeable effect on pension spending as % of GDP
Source: Update of 2012 Economic and Financial Document, September 20, 2012. Demographic projections from
ISTAT, central demographic scenario 2012
PENSION REFORM
12%
13%
14%
15%
16%
17%
18%
19%
2007 2010 2013 2016 2019 2022 2025 2028 2031 2034 2037 2040 2043 2046 2049 2052 2055 2058
Current Legislation Legislation before DL. 201/2011
Legislation before DL. 98/2011 Legislation before DL. 78/2010
Legislation before L. 243/2004
49
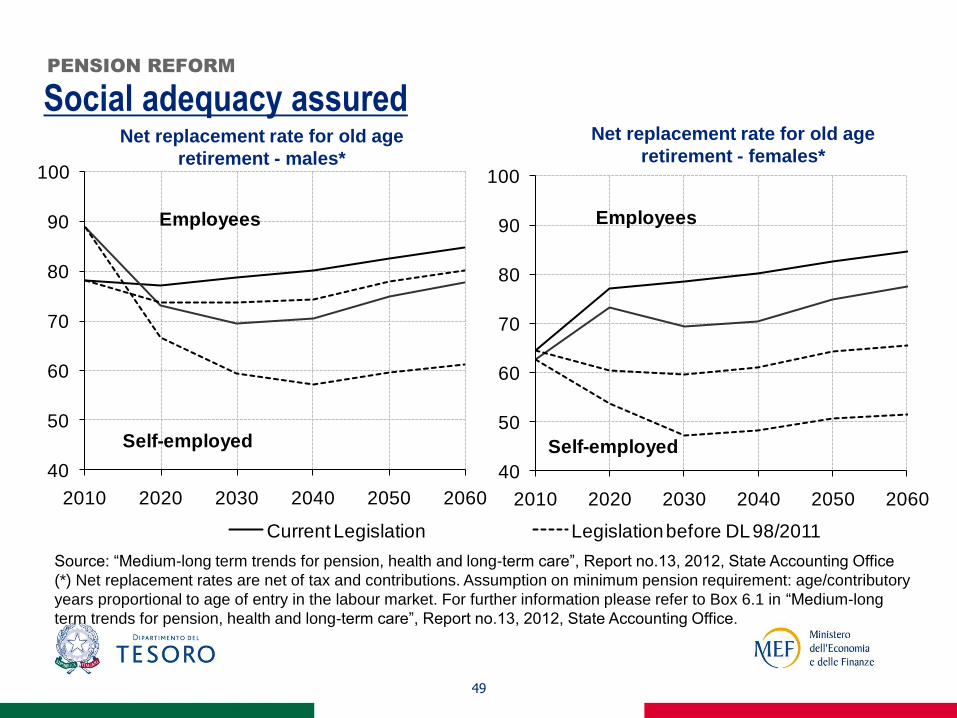
Social adequacy assured
Source: “Medium-long term trends for pension, health and long-term care”, Report no.13, 2012, State Accounting Office
(*) Net replacement rates are net of tax and contributions. Assumption on minimum pension requirement: age/contributory
years proportional to age of entry in the labour market. For further information please refer to Box 6.1 in “Medium-long
term trends for pension, health and long-term care”, Report no.13, 2012, State Accounting Office.
PENSION REFORM
Net replacement rate for old age
retirement - males*
Net replacement rate for old age
retirement - females*
40
50
60
70
80
90
100
2010 2020 2030 2040 2050 2060
Current Legislation Legislation before DL 98/2011
Self-employed
Employees
40
50
60
70
80
90
100
2010 2020 2030 2040 2050 2060
Employees
Self-employed
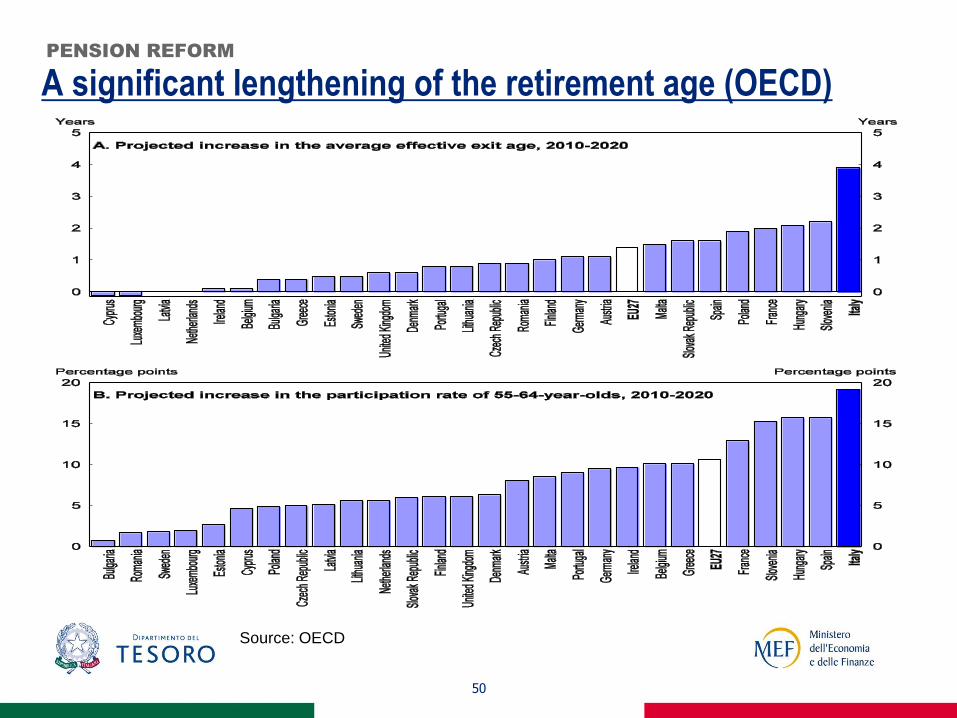
A significant lengthening of the retirement age (OECD)
50
PENSION REFORM
Source: OECD

Towards a leaner and more efficient public administration
In July, the Government adopted measures with savings
estimated at €4.6bn in 2012, €10.8bn in 2013, €11.6bn in
2014 and €12.1bn in 2015.
Public procurement will be managed by Consip or regional
centralised-purchasing agencies only.
Number of civil servants will decrease by 10% (20% at
managerial level).
The majority of rents paid by the Public Administration are
frozen until end-2014 and are to be renegotiated with a 15%
discount.
51
SPENDING REVIEW
Rule of law strengthened
52
Ban from public office for people convicted in final judgment
or subjected to judicial measures.
Revision of norms against corruption and introduction of
two new legal offenses to contrast acts of preferential
treatment by public officials.
Increase in penalties for managers or other corporate
stakeholders for doing or omitting acts in contrast with their
obligations or loyal duties entailing damages to their company.
More severe penalties, especially in cases of judicial
corruption.
FIGHT AGAINST CORRUPTION
Rule of law: stricter procedures and more control
The Commission for the evaluation, transparency and integrity
of the Public Administration (CIVIT) becomes the National
Anti-Corruption Authority.
Creation of a National Anti-Corruption Plan and Anti-mafia
list for businesses to prevent and fight corruption at national
and international level.
Incompatibility of public employment with external
assignment; code of conduct for public employees.
Stricter individuation of eligibility criteria for public positions
at central, regional and local level.
53
FIGHT AGAINST CORRUPTION
An aggressive stance in fighting tax evasion
The legal threshold for cash payments is lowered to € 1,000.
A softer regime for controls will apply to tax payers who are
compliant with so-called sectoral studies.
Cheating on the Revenue Agency is now a criminal offence.
Focus on large tax payers and VAT frauds.
Synergies with the Social Security Institute (INPS) in order to
crack down on undeclared economic activity.
54
FIGHT AGAINST TAX EVASION
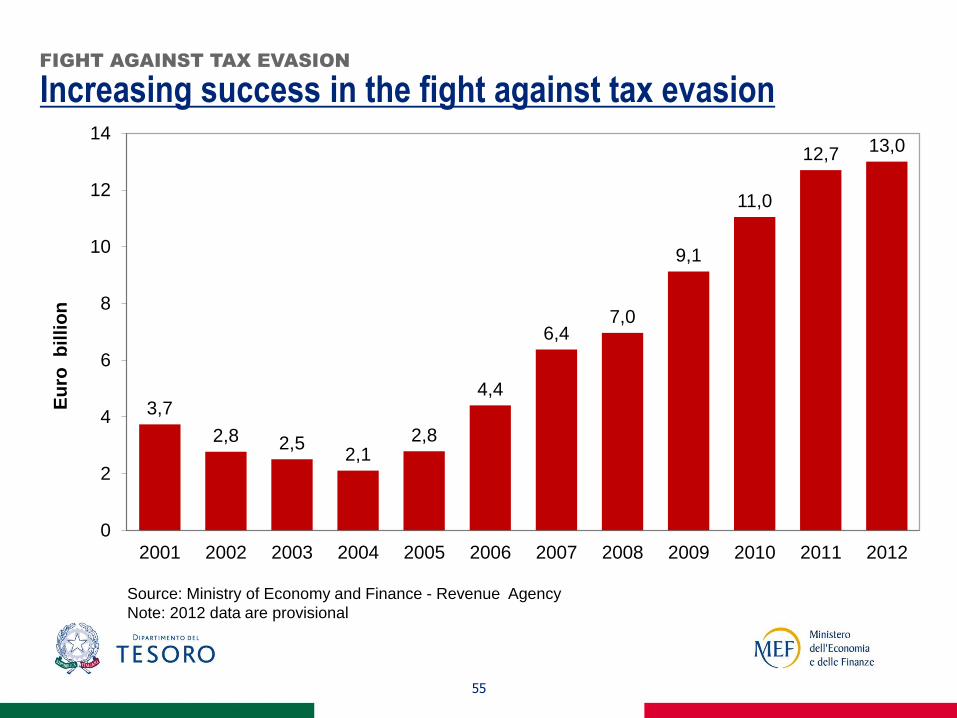
Increasing success in the fight against tax evasion
55
Source: Ministry of Economy and Finance - Revenue Agency
Note: 2012 data are provisional
FIGHT AGAINST TAX EVASION
3,7
2,8 2,5 2,1
2,8
4,4
6,4 7,0
9,1
11,0
12,7 13,0
0
2
4
6
8
10
12
14
2001 2002 2003 2004 2005 2006 2007 2008 2009 2010 2011 2012
Eu
ro b
illi
on

Greater consumer protection
Liberalisation of opening hours for retailers.
Higher competition and strengthening of consumer
protection in the financial sector. Strengthening of Antitrust
Authority. Vigilance powers in water and postal sectors given
to Energy and Communication Authorities respectively.
Protection from deceptive and aggressive trade practices
extended to businesses with less than 10 employees.
56
LIBERALISATION, COMPETITION AND COMPETITIVENESS

Lighter administrative burden and PA payments
Reduction in the administrative burden for firms: elimination
of ex-ante controls, limits, permits, licenses for start-ups.
Substantial simplification for SMEs.
Possibility of setting up a limited liability company with
reduced capital stock and a simplified framework for
people under 35.
Commercial payments by the public administration within 30
days (60 days only in exceptional cases). Interest rate on
arrears is 8% over the rate set by ECB for lending operations.
57
LIBERALISATION, COMPETITION AND COMPETITIVENESS
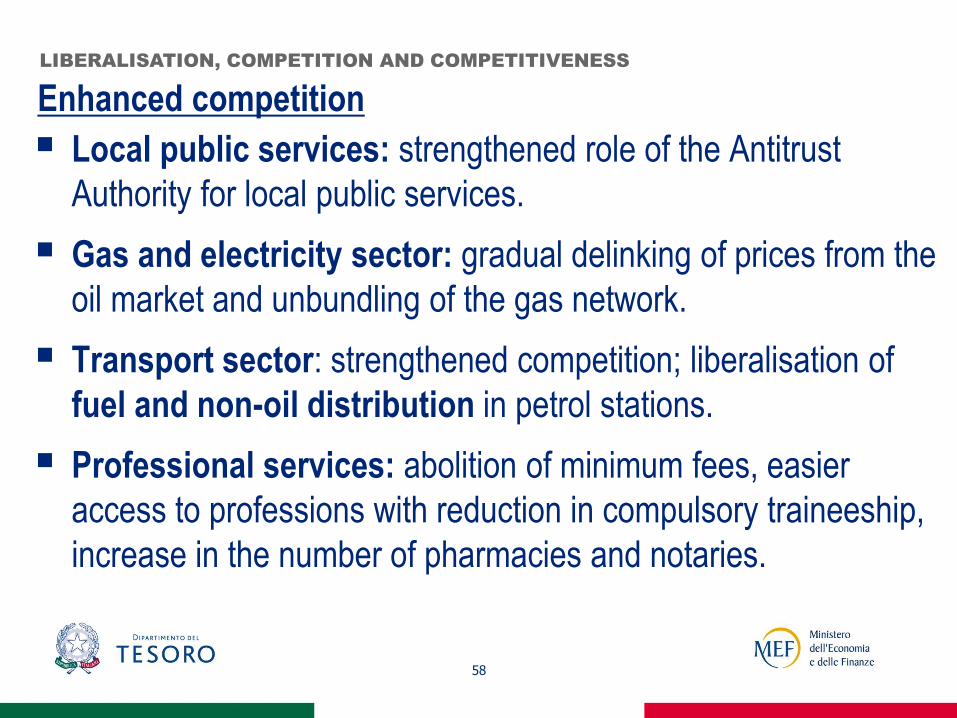
Enhanced competition
Local public services: strengthened role of the Antitrust
Authority for local public services.
Gas and electricity sector: gradual delinking of prices from the
oil market and unbundling of the gas network.
Transport sector: strengthened competition; liberalisation of
fuel and non-oil distribution in petrol stations.
Professional services: abolition of minimum fees, easier
access to professions with reduction in compulsory traineeship,
increase in the number of pharmacies and notaries.
58
LIBERALISATION, COMPETITION AND COMPETITIVENESS
59
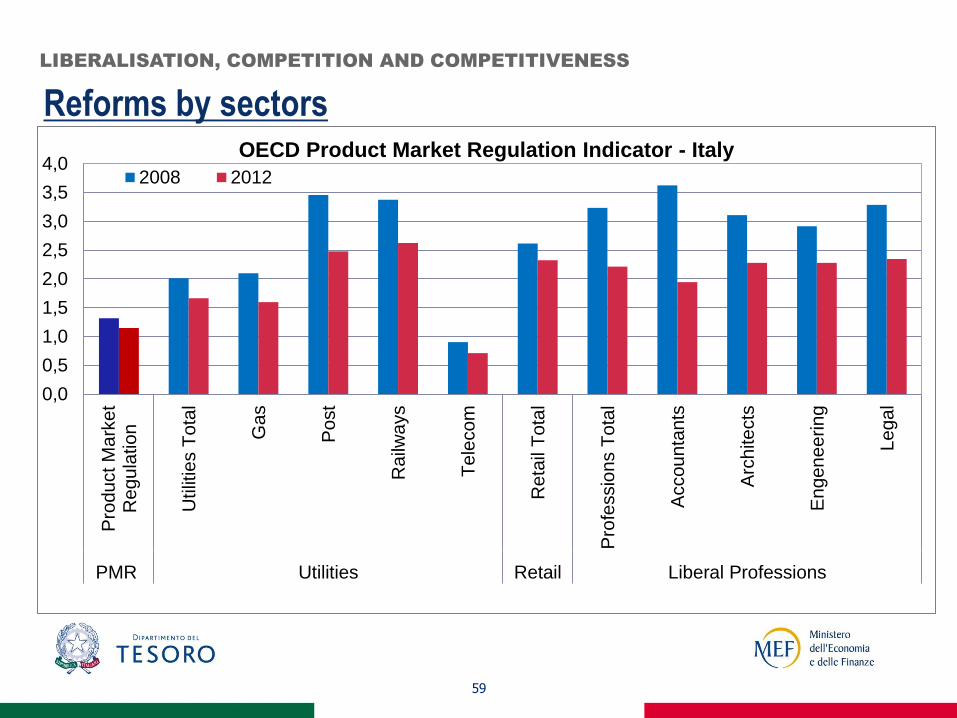
Reforms by sectors
LIBERALISATION, COMPETITION AND COMPETITIVENESS
0,0
0,5
1,0
1,5
2,0
2,5
3,0
3,5
4,0
Pro
du
ct M
ark
et
Re
gu
latio
n
Utilit
ies T
ota
l
Gas
Po
st
Ra
ilwa
ys
Te
leco
m
Re
tail
To
tal
Pro
fessio
ns T
ota
l
Accou
nta
nts
Arc
hite
cts
En
gen
ee
rin
g
Legal
PMR Utilities Retail Liberal Professions
OECD Product Market Regulation Indicator - Italy
2008 2012
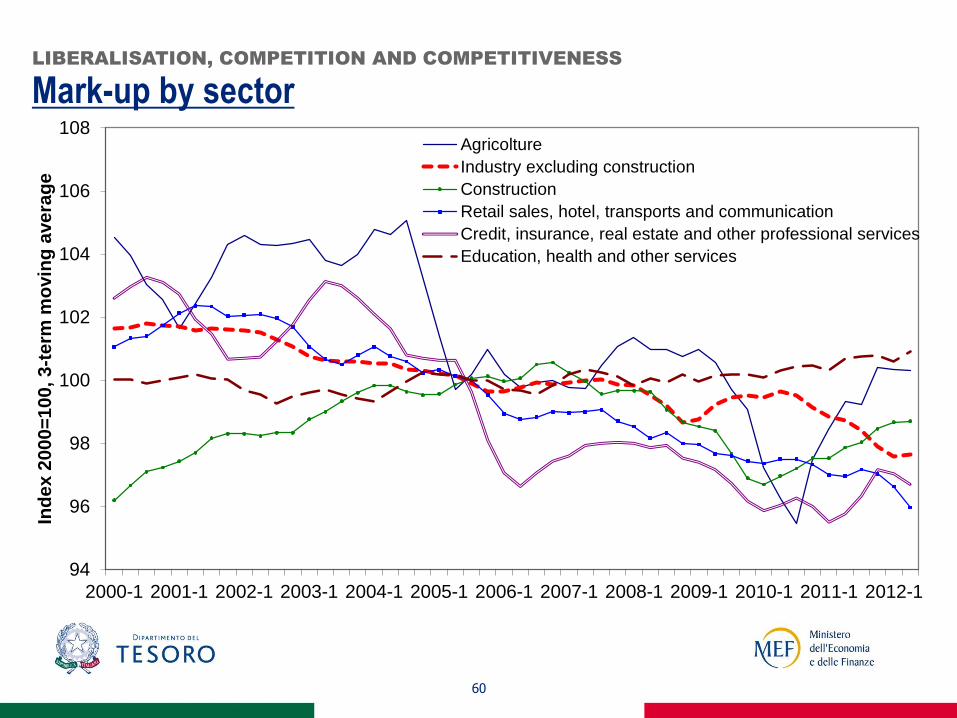
Mark-up by sector
60
LIBERALISATION, COMPETITION AND COMPETITIVENESS
94
96
98
100
102
104
106
108
2000-1 2001-1 2002-1 2003-1 2004-1 2005-1 2006-1 2007-1 2008-1 2009-1 2010-1 2011-1 2012-1
Ind
ex
20
00
=1
00
, 3
-te
rm m
ovin
g a
ve
rag
e
Agricolture
Industry excluding construction
Construction
Retail sales, hotel, transports and communication
Credit, insurance, real estate and other professional services
Education, health and other services

Growth Decree 2.0: the Digital Agenda
Digital Agenda for the development of digital services for
citizens especially in sectors of education and health care.
Mandatory transmission of documents in electronic form within
the Public Administration (PA) and between the PA and private
citizens (also for civil justice).
Enhanced powers of the Agency for Digital Italy to promote
major strategic projects. The Agency will prepare the National
Plan for Smart cities on an annual basis.
Research projects and innovation linked to strategic issues in
line with European ‘Horizon 2020’.
61
LIBERALISATION, COMPETITION AND COMPETITIVENESS
Growth Decree 2.0: innovative start-ups
Start-ups must invest at least 30% in R&D, researchers must
constitute no less than 1/3 of total employees, or hold a patent
to be considered ‘innovative’.
Tax deductions for investors (private and institutional) in
innovative start-ups.
Start-ups can hire workers with a fixed-term contract for a period
between 6 months and 3 years.
Start-ups operating in Italy can use services provided by ‘ICE’
and ‘Desk Italia’ free of charge .
62
LIBERALISATION, COMPETITION AND COMPETITIVENESS
63
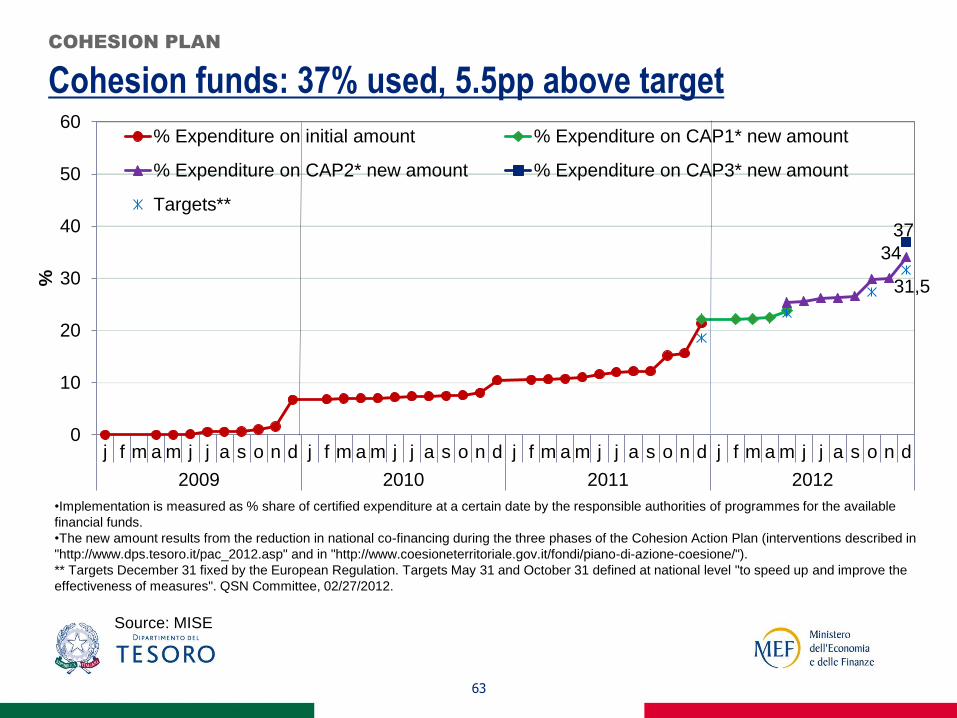
Cohesion funds: 37% used, 5.5pp above target
COHESION PLAN
Source: MISE
34
37
31,5
0
10
20
30
40
50
60
j f m a m j j a s o n d j f m a m j j a s o n d j f m a m j j a s o n d j f m a m j j a s o n d
2009 2010 2011 2012
%
% Expenditure on initial amount % Expenditure on CAP1* new amount
% Expenditure on CAP2* new amount % Expenditure on CAP3* new amount
Targets**
•Implementation is measured as % share of certified expenditure at a certain date by the responsible authorities of programmes for the available
financial funds.
•The new amount results from the reduction in national co-financing during the three phases of the Cohesion Action Plan (interventions described in
"http://www.dps.tesoro.it/pac_2012.asp" and in "http://www.coesioneterritoriale.gov.it/fondi/piano-di-azione-coesione/").
** Targets December 31 fixed by the European Regulation. Targets May 31 and October 31 defined at national level "to speed up and improve the
effectiveness of measures". QSN Committee, 02/27/2012.
Towards more efficient public expenditure
Introduction of 24 hour primary healthcare support units
digitally connected with hospitals and other health structures.
Doctors employed in public hospitals can pursue private
professional activity only if digitally connected to NHS
administrative units. This connection is also used to record
payments.
Obsolete drugs will be eliminated from the official NHS list and
unnecessary medical examinations reduced.
64
NATIONAL HEALTH SYSTEM (NHS)
Making bankruptcy procedure easier
65
Bankruptcy procedure: adaptation of existing procedures to
a system similar to “Chapter 11” in the US. Increasing
protection of the entrepreneur under strains (‘concordato
preventivo’); payment of creditors due for the entire amount
and before other creditors; maturity of credits, covered with
collateral on assets, can be extended by one year.
Trial length: trials can last no more than 6 years, of which 3 in
the first stage, 2 in Appeal Court and 1 in Supreme Court.
Every additional year triggers a compensation between €500
and €1,500.
JUDICIAL SYSTEM
Reform of Civil Justice
66
Reorganisation of judicial districts to close small courts and
reduce public expenditure.
Introduction of sanctions for non-acceptable appeals to
reduce the backlog of cases brought to court.
Administrative communications by certified electronic
mailing to speed up procedures.
Digitalisation of civil justice proceedings.
JUDICIAL SYSTEM

A more dynamic and inclusive labour market
More (regulated) flexibility on the hiring side,
discouraging the abuse of temporary contracts and making
open-ended work contracts more appealing to companies.
More flexibility on the firing side, facilitating more
efficient allocation of workers among sectors.
More comprehensive unemployment benefits (ASPI).
More efficient active labour market policies improving
services and incentives to work.
67
LABOUR MARKET REFORM
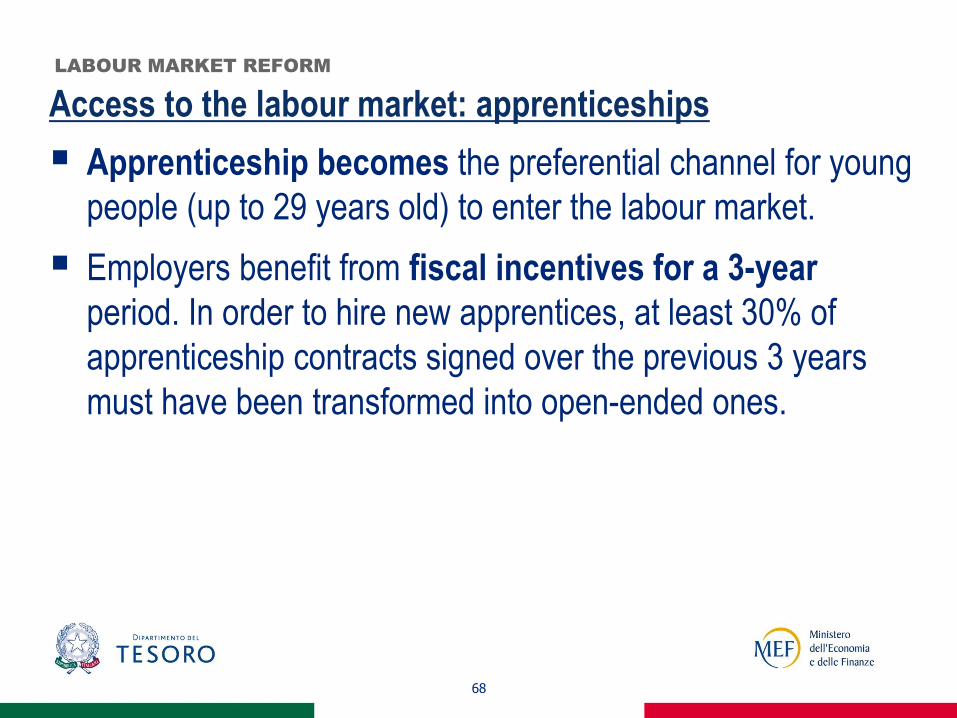
Access to the labour market: apprenticeships
Apprenticeship becomes the preferential channel for young
people (up to 29 years old) to enter the labour market.
Employers benefit from fiscal incentives for a 3-year
period. In order to hire new apprentices, at least 30% of
apprenticeship contracts signed over the previous 3 years
must have been transformed into open-ended ones.
68
LABOUR MARKET REFORM
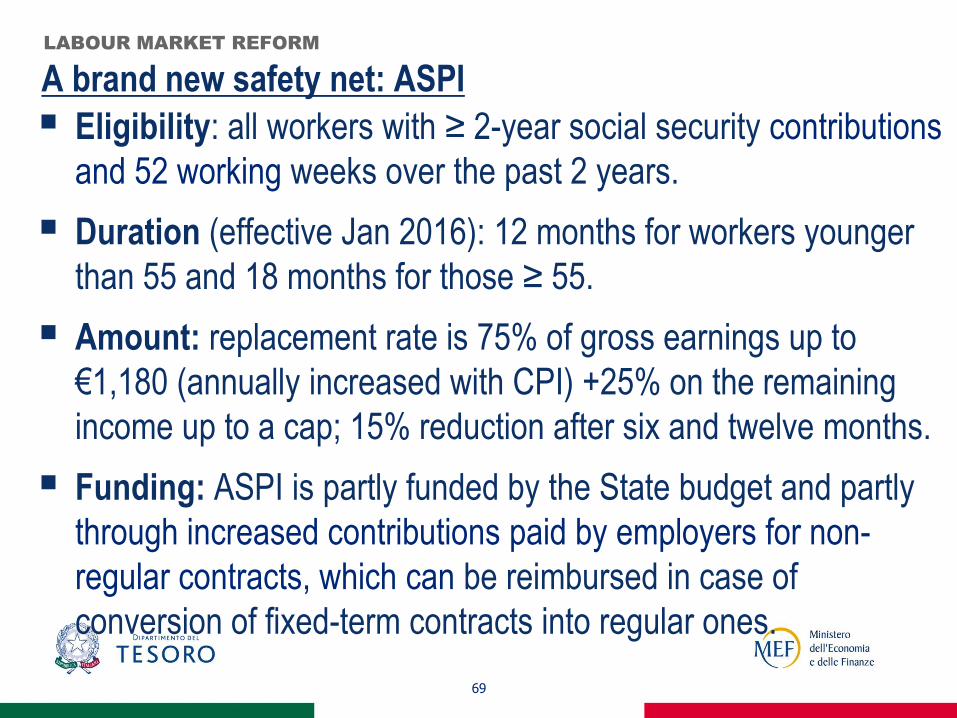
A brand new safety net: ASPI
Eligibility: all workers with ≥ 2-year social security contributions
and 52 working weeks over the past 2 years.
Duration (effective Jan 2016): 12 months for workers younger
than 55 and 18 months for those ≥ 55.
Amount: replacement rate is 75% of gross earnings up to
€1,180 (annually increased with CPI) +25% on the remaining
income up to a cap; 15% reduction after six and twelve months.
Funding: ASPI is partly funded by the State budget and partly
through increased contributions paid by employers for non-
regular contracts, which can be reimbursed in case of
conversion of fixed-term contracts into regular ones.
69
LABOUR MARKET REFORM
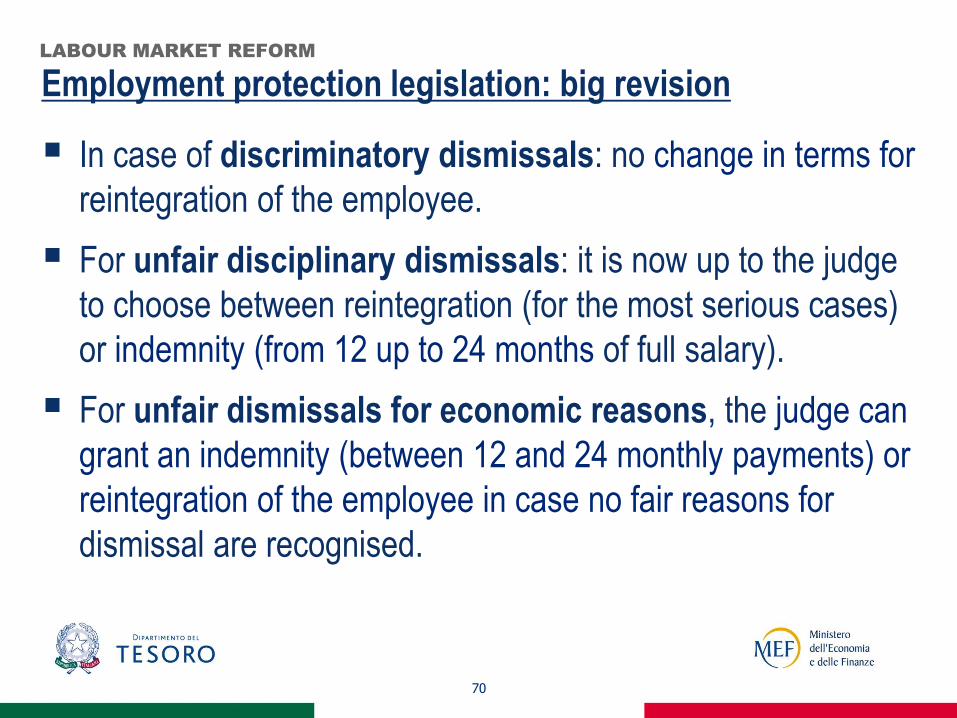
Employment protection legislation: big revision
In case of discriminatory dismissals: no change in terms for
reintegration of the employee.
For unfair disciplinary dismissals: it is now up to the judge
to choose between reintegration (for the most serious cases)
or indemnity (from 12 up to 24 months of full salary).
For unfair dismissals for economic reasons, the judge can
grant an indemnity (between 12 and 24 monthly payments) or
reintegration of the employee in case no fair reasons for
dismissal are recognised.
70
LABOUR MARKET REFORM

National agreement to help boost labour productivity
Shared agreement among Italian trade unions and
employers’ associations to help boost labour productivity by
providing for labour contracts that better reflect the needs of
individual companies.
A special fund is designed to cover the reduction in taxes on
productivity-linked wage increases set at local level.
A pact between generations is introduced, allowing for
senior workers to stay at work longer by smoothing the
retirement transition and increasing the employment of young
workers.
71
LABOUR MARKET REFORM
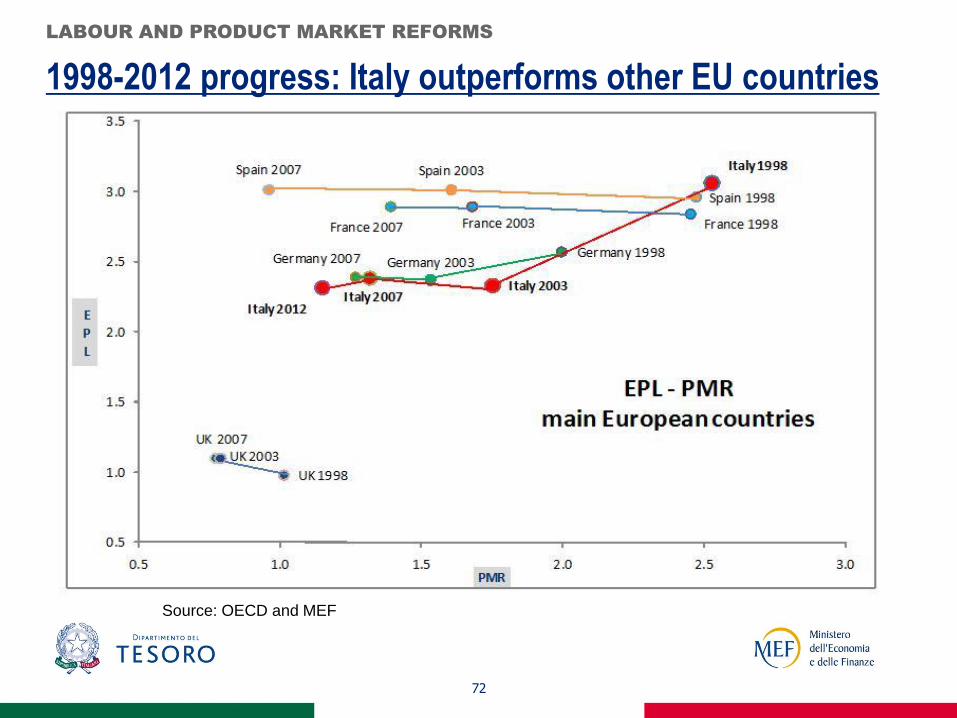
72
1998-2012 progress: Italy outperforms other EU countries
LABOUR AND PRODUCT MARKET REFORMS
Source: OECD and MEF

The current presentation as well as a note on reforms are
updated regularly. You can find them at:
http://www.dt.mef.gov.it/en/analisi_programmazione_
economico_finanziaria/strategia_crescita/
73