Italy in the World Economy - United Nationsunstats.un.org/unsd/trade/s_geneva2011/refdocs/CDs/Italy...
50
Italy in the World Economy ICE Report 2009-2010 - Summary Italian National Statistical System Italian Institute for Foreign Trade
Transcript of Italy in the World Economy - United Nationsunstats.un.org/unsd/trade/s_geneva2011/refdocs/CDs/Italy...
Italy in theWorld EconomyICE Report 2009-2010 - Summary
Italian National Statistical SystemItalian Institute for Foreign Trade


Italy in theWorld EconomyICE Report 2009-2010 - Summary
Italian National Statistical SystemItalian Institute for Foreign Trade
The Report for 2009-10 was prepared by a working group of the Research and StatisticsDivision of the Italian Institute for Foreign Trade (ICE).
Coordinator: Pier Paolo Celeste
Editorial group: Federico Bologna, Ilaria Cingottini, Elena Mazzeo, Vincenzo Pagano, StefaniaPaladini, Alessia Proietti, Lavinia Rotili, Daniele Terriaca, Lia Vaschetto and, for Chapter 9, GianCarlo Bertoni (Simest), Cristina Giglio (Ministry of Economic Development) and Carlo M.Guarinoni (Sace)
Summary: Giorgia Giovannetti and Lelio Iapadre
Assistance and data processing: RetItalia Internazionale S.p.A.
The following are thanked for their suggestions and collaboration on the Report: Fabrizio Onida,Camilla Cionini Visani, Luca De Benedictis, Sergio de Nardis, Giorgia Giovannetti, Lelio Iapadre,Alessandra Lanza, Roberto Monducci, Romeo Orlandi, Roberto Pasca di Magliano, Lucia Tajoliand Roberto Tedeschi
Contributors:Vito Amendolagine, Massimo Armenise, Paola Anitori, Claudio Colacurcio, Giuliano Conti,Stefano Costa, Marco Cucculelli, Claudio Dordi, Andrea Dossena, Natale Renato Fazio, AnnaFerragina, Matteo Ferrazzi, Giovanni Ferri, Margherita Gianessi, Manuela Marianera, EnricoMarvasi, Roberta Mosca, Marco Mutinelli, Carmela Pascucci, Filomena Pietrovito, RosannaPittiglio, Federica Pocek, Alessandro Polli, Alberto Franco Pozzolo, Filippo Reganati, MarcoSanfilippo, Giovanna Summo, Alessandro Terzulli, Umberto Triulzi, Margherita Velucchi andMatteo Verda
The contribution of National Institute for Statistics (Istat) and the Bank of Italy made it possibleto produce the Report.
In the Report reference is also made to the data published in the ICE-Istat Statistical Yearbook,Commercio estero e attività internazionali delle imprese – edizione 2009.
The Report is based on information available at 30 June 2010.
5
Contents
THE ITALIAN ECONOMY AND THE RECOVERY OF WORLD TRADESummary of the ICE Report 2009-2010
1. World trade and international investment Page 7
2. The European Union » 10
3. Trade policies » 12
4. Italy: macroeconomic analysis » 13
5. Regions and countries » 17
6. Sectors » 18
7. The territorial base » 19
8. Firms » 21
Concluding remarks » 23
STATISTICAL TABLES
WORLD AND THE EUROPEAN UNION1.1 World trade and foreign direct investment » 291.2 Regional shares of world merchandise exports » 301.3 Regional shares of world merchandise imports » 301.4 Top twenty world merchandise exporters » 311.5 Top twenty world merchandise importers » 311.6 Inward foreign direct investment: main recipient countries » 321.7 Outward foreign direct investment: main investor countries » 321.8 Shares of world trade and trade balances » 33
ITALY2.1 Italy’s balance of payments » 342.2 Italy’s foreign trade (FOB-CIF) » 352.3 Constant-market-share analysis of Italy’s share of world imports
and its share of world imports from the euro area » 362.4 Italy’s foreign trade by geographical region and with the main countries » 372.5 Size of the markets and Italy’s shares » 382.6 Italian exports: top 20 countries of destination in 2009 » 382.7 Italian imports: top 20 countries of origin in 2009 » 392.8 Italy’s foreign trade by sector » 402.9 Volumes and prices of Italian exports and imports by sector » 412.10 World exports and Italy’s market shares » 422.11 Merchandise exports of the Italian regions » 432.12 Internationalization of Italian firms » 442.13 Exports by firm size class and geographical region » 452.14 Exports by value class of exports and sector of activity » 46

7
The Italian economyand the recoveryof world trade
1. World trade and international investment
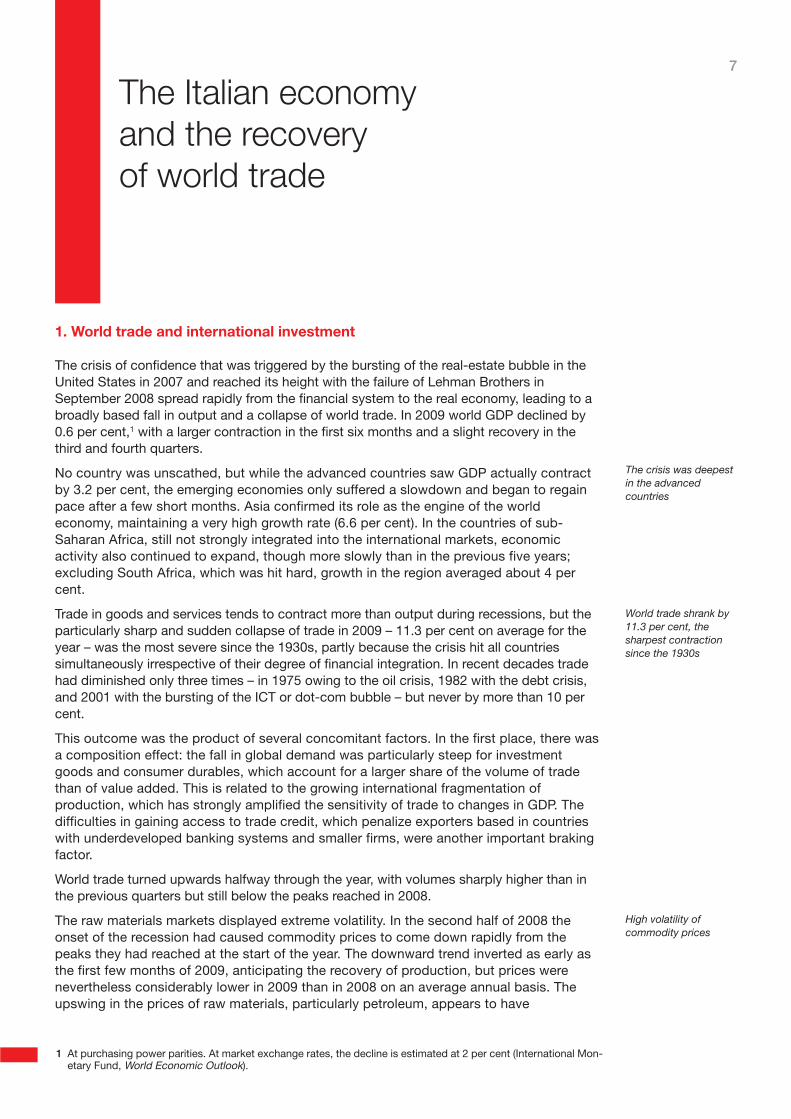
The crisis of confidence that was triggered by the bursting of the real-estate bubble in theUnited States in 2007 and reached its height with the failure of Lehman Brothers inSeptember 2008 spread rapidly from the financial system to the real economy, leading to abroadly based fall in output and a collapse of world trade. In 2009 world GDP declined by0.6 per cent,1 with a larger contraction in the first six months and a slight recovery in thethird and fourth quarters.
No country was unscathed, but while the advanced countries saw GDP actually contractby 3.2 per cent, the emerging economies only suffered a slowdown and began to regainpace after a few short months. Asia confirmed its role as the engine of the worldeconomy, maintaining a very high growth rate (6.6 per cent). In the countries of sub-Saharan Africa, still not strongly integrated into the international markets, economicactivity also continued to expand, though more slowly than in the previous five years;excluding South Africa, which was hit hard, growth in the region averaged about 4 percent.
Trade in goods and services tends to contract more than output during recessions, but theparticularly sharp and sudden collapse of trade in 2009 – 11.3 per cent on average for theyear – was the most severe since the 1930s, partly because the crisis hit all countriessimultaneously irrespective of their degree of financial integration. In recent decades tradehad diminished only three times – in 1975 owing to the oil crisis, 1982 with the debt crisis,and 2001 with the bursting of the ICT or dot-com bubble – but never by more than 10 percent.
This outcome was the product of several concomitant factors. In the first place, there wasa composition effect: the fall in global demand was particularly steep for investmentgoods and consumer durables, which account for a larger share of the volume of tradethan of value added. This is related to the growing international fragmentation ofproduction, which has strongly amplified the sensitivity of trade to changes in GDP. Thedifficulties in gaining access to trade credit, which penalize exporters based in countrieswith underdeveloped banking systems and smaller firms, were another important brakingfactor.
World trade turned upwards halfway through the year, with volumes sharply higher than inthe previous quarters but still below the peaks reached in 2008.
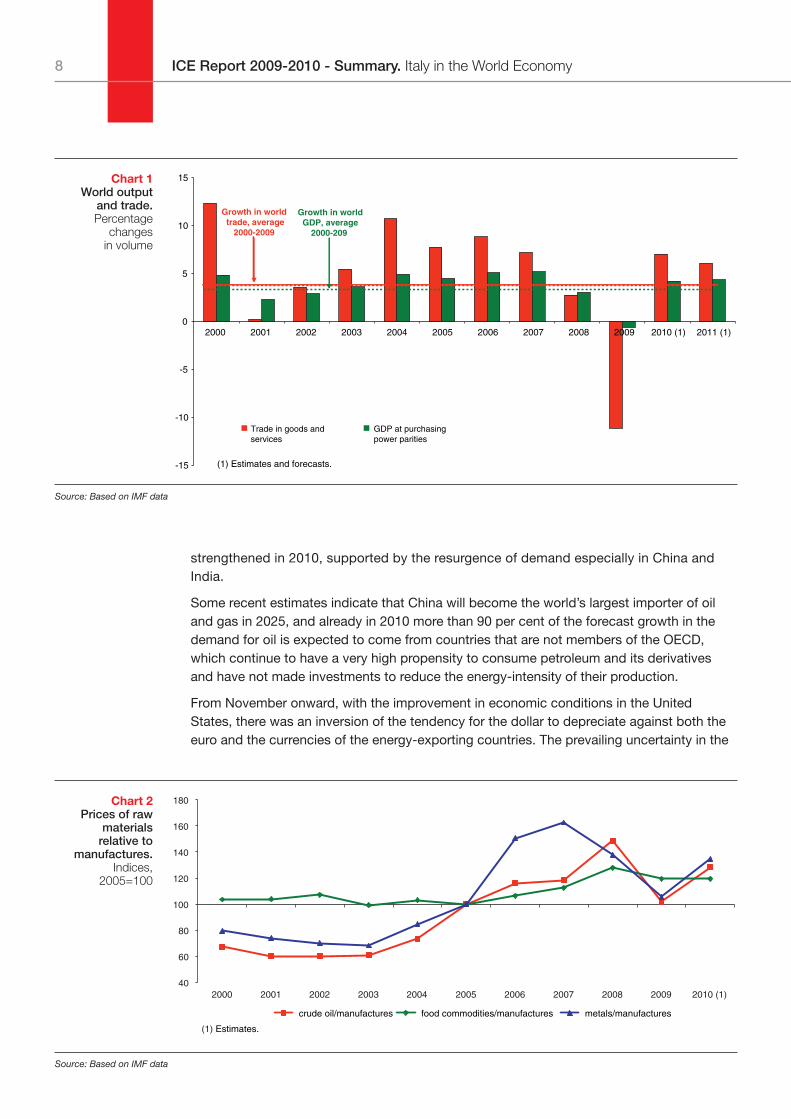
The raw materials markets displayed extreme volatility. In the second half of 2008 theonset of the recession had caused commodity prices to come down rapidly from thepeaks they had reached at the start of the year. The downward trend inverted as early asthe first few months of 2009, anticipating the recovery of production, but prices werenevertheless considerably lower in 2009 than in 2008 on an average annual basis. Theupswing in the prices of raw materials, particularly petroleum, appears to have
The crisis was deepestin the advancedcountries
World trade shrank by11.3 per cent, thesharpest contractionsince the 1930s
High volatility ofcommodity prices
1 At purchasing power parities. At market exchange rates, the decline is estimated at 2 per cent (International Mon-etary Fund, World Economic Outlook).
ICE Report 2009-2010 - Summary. Italy in the World Economy8
strengthened in 2010, supported by the resurgence of demand especially in China andIndia.
Some recent estimates indicate that China will become the world’s largest importer of oiland gas in 2025, and already in 2010 more than 90 per cent of the forecast growth in thedemand for oil is expected to come from countries that are not members of the OECD,which continue to have a very high propensity to consume petroleum and its derivativesand have not made investments to reduce the energy-intensity of their production.
From November onward, with the improvement in economic conditions in the UnitedStates, there was an inversion of the tendency for the dollar to depreciate against both theeuro and the currencies of the energy-exporting countries. The prevailing uncertainty in the
Source: Based on IMF data
-15
-10
-5
0
5
10
15
(1) Estimates and forecasts.
Trade in goods and services
GDP at purchasing power parities
Growth in world trade, average
2000-2009
Growth in worldGDP, average
2000-209
2000 2001 2002 2003 2004 2005 2006 2007 2008 2009 2010 (1) 2011 (1)
Chart 1World output
and trade.Percentage
changes in volume
Source: Based on IMF data
40
60
80
100
120
140
160
180
2000 2001 2002 2003 2004 2005 2006 2007 2008 2009 2010 (1)
crude oil/manufactures food commodities/manufactures metals/manufactures
(1) Estimates.
Chart 2Prices of raw
materials relative to
manufactures.Indices,
2005=100
9The Italian economy and the recovery of world trade
markets caused a surge in demand for US government securities, which were deemed lowrisk. At the same time, the euro came under speculative attack in connection with theweakness of the economic recovery and, most recently, supposedly unsustainablegovernment budget deficits. The exchange rate of the yen did not vary significantly in thecourse of 2009.
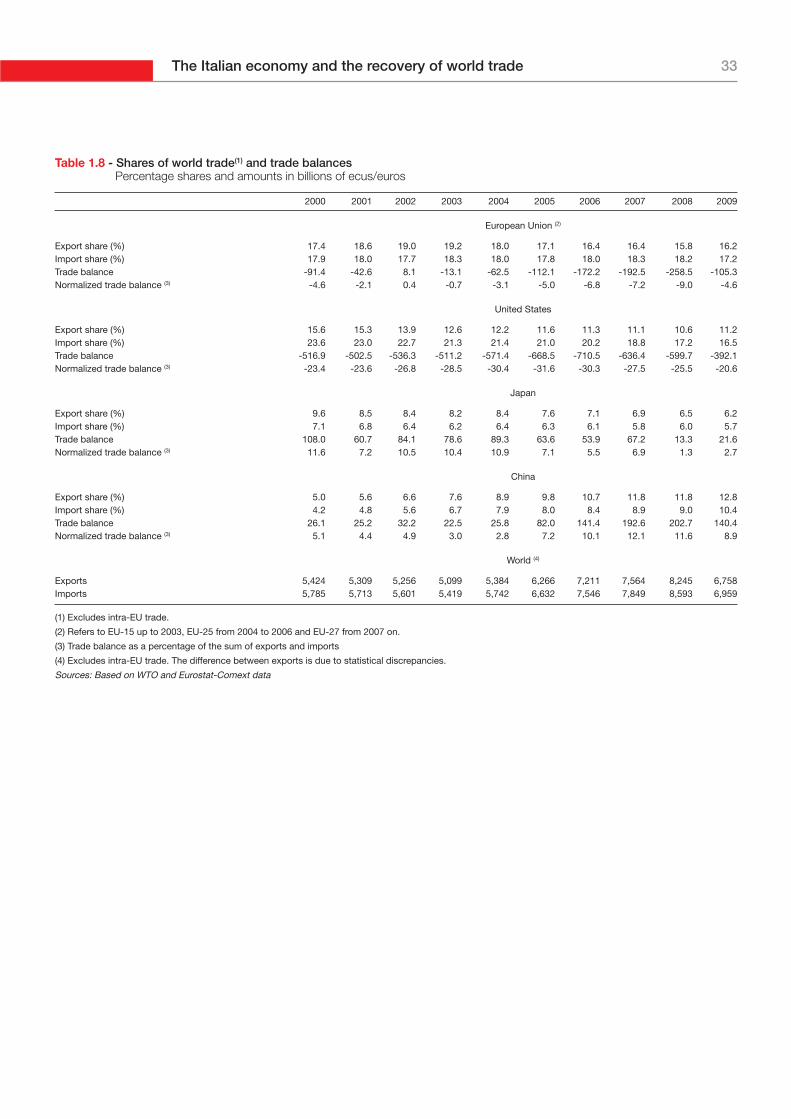
The renminbi was basically stable during the year, appreciating slightly against the dollarand the euro. At the start of 2010, however, a statement by the Chinese central banksuggested a change in monetary policy outlook that could have important consequencesfor trade relations. Balance-of-payments disequilibria lessened in 2009 but were noteliminated. China recorded a current account surplus equal to 10 per cent of GDP, one pointless than in 2008, while the US deficit declined from 5 to 3 per cent of GDP.
Contrary to the pattern of the recent past, trade in services outperformed trade in goods(down by 12.9 and 23 per cent, respectively, in current dollars) and services’ share of worldtrade consequently rose, interrupting a downtrend under way since the early 1990s.
Despite the slowdown in output growth, in 2009 Asia was again the region making thelargest contribution to the expansion of trade in goods. China and India fueled trade withneighboring countries in particular, increasing the intensity of intra-regional trade.
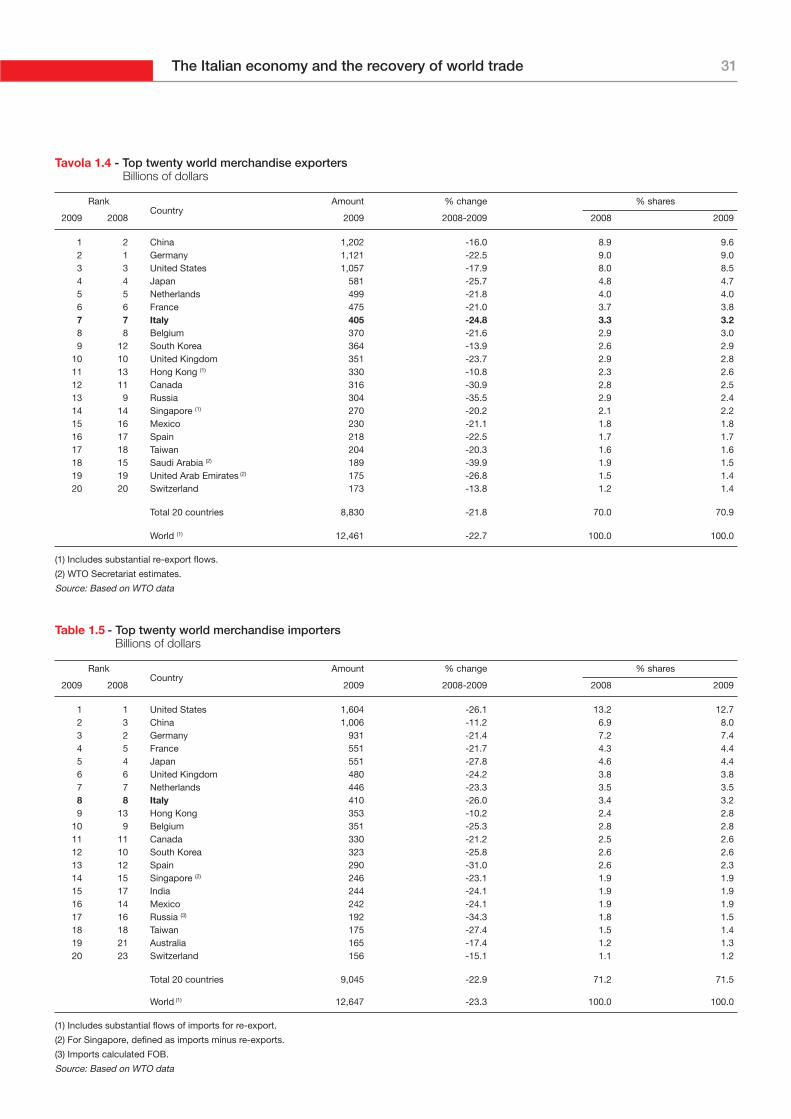
China became the world’s leading exporter of goods, with 9.6 per cent of the total,overtaking Germany, whose share held at 9 per cent. After several years of decline, theshare of the United States rose from 8 to 8.5 per cent and the US remained solidly in thirdplace.
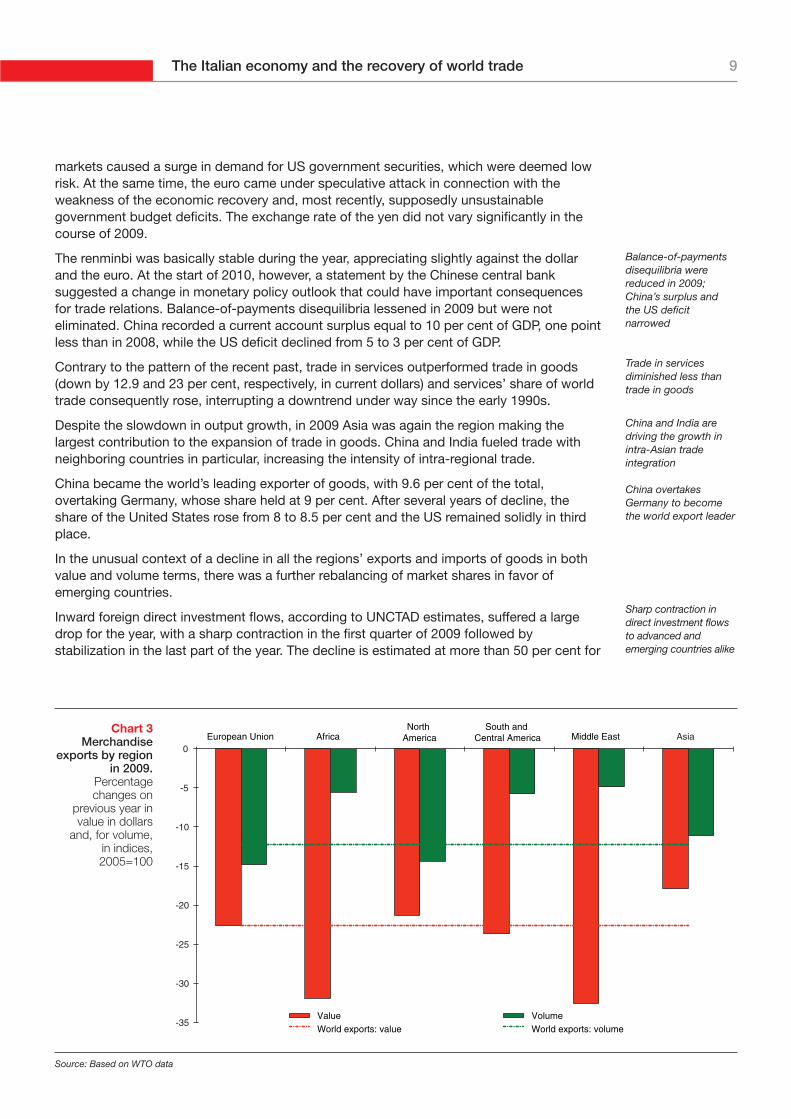
In the unusual context of a decline in all the regions’ exports and imports of goods in bothvalue and volume terms, there was a further rebalancing of market shares in favor ofemerging countries.
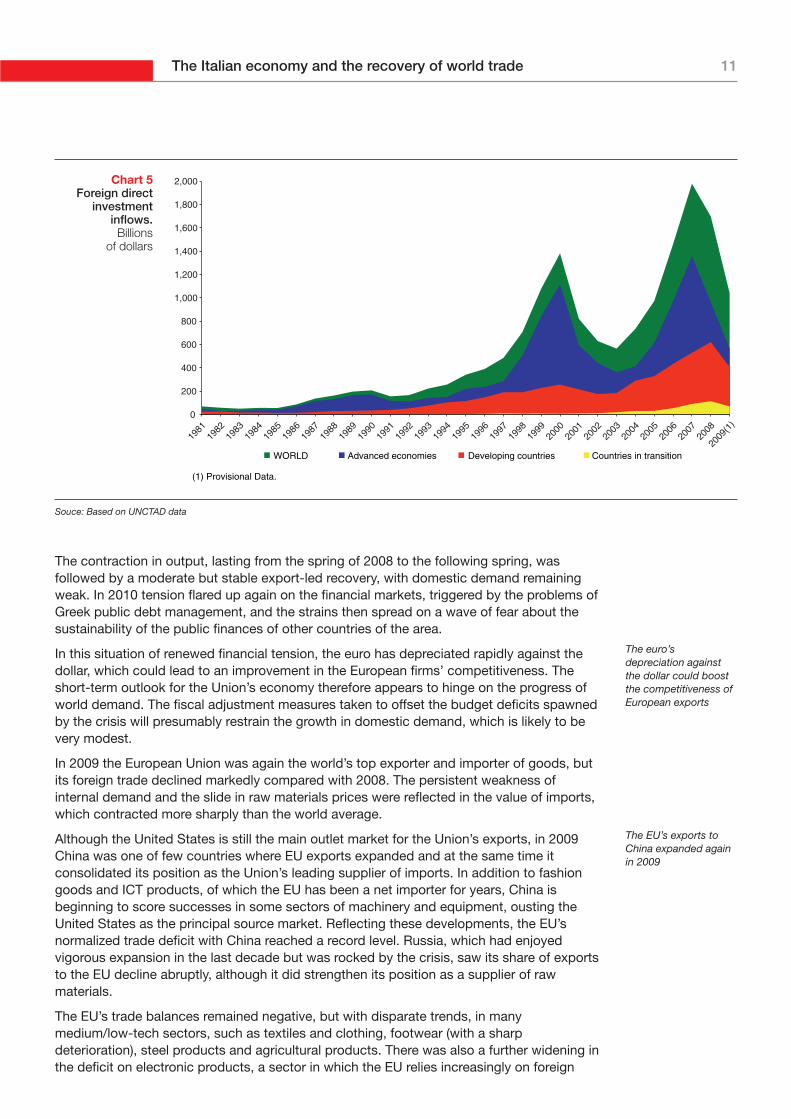
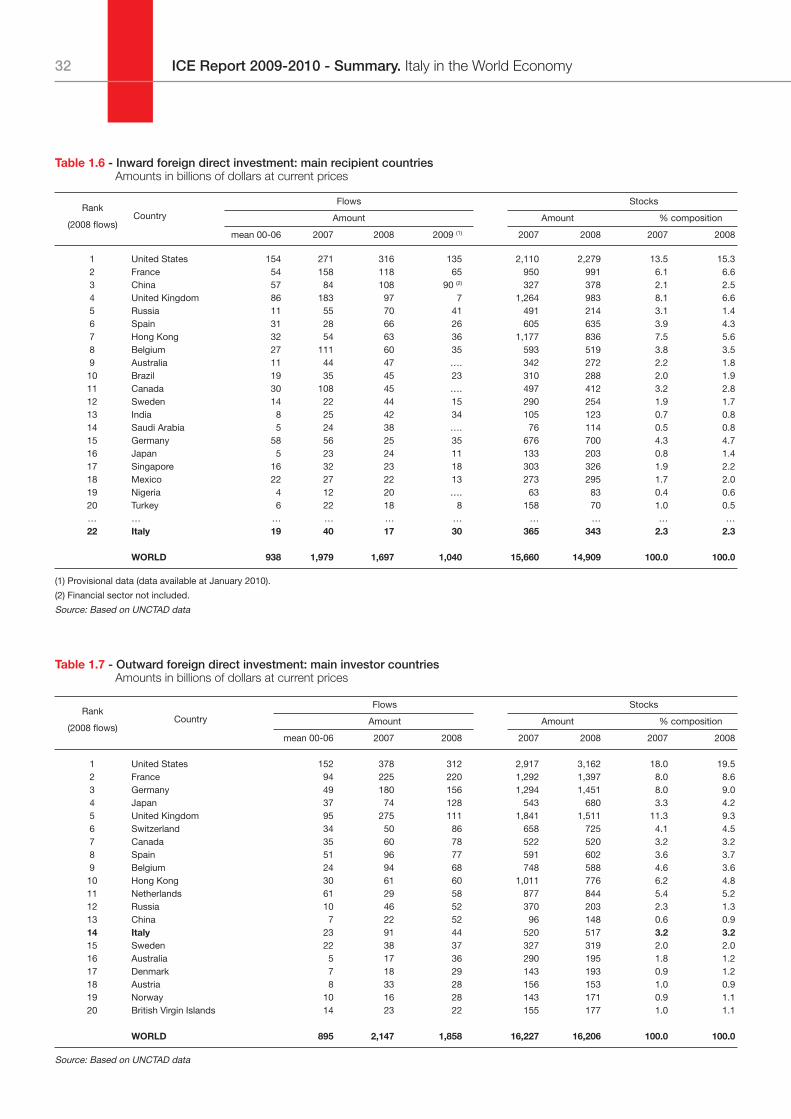
Inward foreign direct investment flows, according to UNCTAD estimates, suffered a largedrop for the year, with a sharp contraction in the first quarter of 2009 followed bystabilization in the last part of the year. The decline is estimated at more than 50 per cent for
Balance-of-paymentsdisequilibria werereduced in 2009;China’s surplus andthe US deficitnarrowed
Trade in servicesdiminished less thantrade in goods
China and India aredriving the growth inintra-Asian tradeintegration
China overtakesGermany to becomethe world export leader
Sharp contraction indirect investment flowsto advanced andemerging countries alike
Source: Based on WTO data
-35
-30
-25
-20
-15
-10
-5
0European Union Africa
North America
South and Central America Middle East Asia
Value VolumeWorld exports: value World exports: volume
Chart 3Merchandise
exports by regionin 2009.
Percentagechanges on
previous year invalue in dollars
and, for volume, in indices,2005=100
ICE Report 2009-2010 - Summary. Italy in the World Economy10
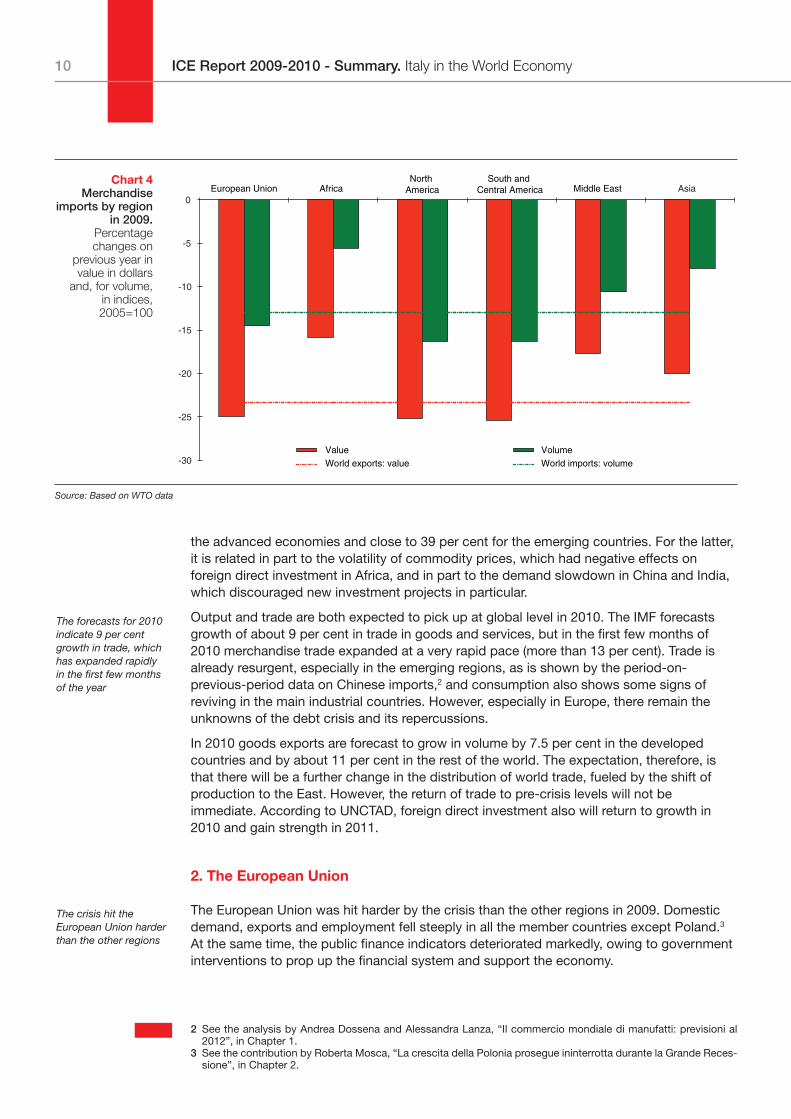
the advanced economies and close to 39 per cent for the emerging countries. For the latter,it is related in part to the volatility of commodity prices, which had negative effects onforeign direct investment in Africa, and in part to the demand slowdown in China and India,which discouraged new investment projects in particular.
Output and trade are both expected to pick up at global level in 2010. The IMF forecastsgrowth of about 9 per cent in trade in goods and services, but in the first few months of2010 merchandise trade expanded at a very rapid pace (more than 13 per cent). Trade isalready resurgent, especially in the emerging regions, as is shown by the period-on-previous-period data on Chinese imports,2 and consumption also shows some signs ofreviving in the main industrial countries. However, especially in Europe, there remain theunknowns of the debt crisis and its repercussions.
In 2010 goods exports are forecast to grow in volume by 7.5 per cent in the developedcountries and by about 11 per cent in the rest of the world. The expectation, therefore, isthat there will be a further change in the distribution of world trade, fueled by the shift ofproduction to the East. However, the return of trade to pre-crisis levels will not beimmediate. According to UNCTAD, foreign direct investment also will return to growth in2010 and gain strength in 2011.
2. The European Union
The European Union was hit harder by the crisis than the other regions in 2009. Domesticdemand, exports and employment fell steeply in all the member countries except Poland.3
At the same time, the public finance indicators deteriorated markedly, owing to governmentinterventions to prop up the financial system and support the economy.
The forecasts for 2010indicate 9 per centgrowth in trade, whichhas expanded rapidlyin the first few monthsof the year
The crisis hit theEuropean Union harderthan the other regions
Source: Based on WTO data
-30
-25
-20
-15
-10
-5
0European Union Africa
North America
South and Central America Middle East Asia
Value VolumeWorld exports: value World imports: volume
Chart 4Merchandise
imports by regionin 2009.
Percentagechanges on
previous year invalue in dollars
and, for volume, in indices,2005=100
2 See the analysis by Andrea Dossena and Alessandra Lanza, “Il commercio mondiale di manufatti: previsioni al2012”, in Chapter 1.
3 See the contribution by Roberta Mosca, “La crescita della Polonia prosegue ininterrotta durante la Grande Reces-sione”, in Chapter 2.
11The Italian economy and the recovery of world trade
The contraction in output, lasting from the spring of 2008 to the following spring, wasfollowed by a moderate but stable export-led recovery, with domestic demand remainingweak. In 2010 tension flared up again on the financial markets, triggered by the problems ofGreek public debt management, and the strains then spread on a wave of fear about thesustainability of the public finances of other countries of the area.
In this situation of renewed financial tension, the euro has depreciated rapidly against thedollar, which could lead to an improvement in the European firms’ competitiveness. Theshort-term outlook for the Union’s economy therefore appears to hinge on the progress ofworld demand. The fiscal adjustment measures taken to offset the budget deficits spawnedby the crisis will presumably restrain the growth in domestic demand, which is likely to bevery modest.
In 2009 the European Union was again the world’s top exporter and importer of goods, butits foreign trade declined markedly compared with 2008. The persistent weakness ofinternal demand and the slide in raw materials prices were reflected in the value of imports,which contracted more sharply than the world average.
Although the United States is still the main outlet market for the Union’s exports, in 2009China was one of few countries where EU exports expanded and at the same time itconsolidated its position as the Union’s leading supplier of imports. In addition to fashiongoods and ICT products, of which the EU has been a net importer for years, China isbeginning to score successes in some sectors of machinery and equipment, ousting theUnited States as the principal source market. Reflecting these developments, the EU’snormalized trade deficit with China reached a record level. Russia, which had enjoyedvigorous expansion in the last decade but was rocked by the crisis, saw its share of exportsto the EU decline abruptly, although it did strengthen its position as a supplier of rawmaterials.
The EU’s trade balances remained negative, but with disparate trends, in manymedium/low-tech sectors, such as textiles and clothing, footwear (with a sharpdeterioration), steel products and agricultural products. There was also a further widening inthe deficit on electronic products, a sector in which the EU relies increasingly on foreign
The euro’sdepreciation againstthe dollar could boostthe competitiveness ofEuropean exports
The EU’s exports toChina expanded againin 2009
Souce: Based on UNCTAD data
0
200
400
600
800
1,000
1,200
1,400
1,600
1,800
2,000
1981
1982
1983
1984
1985
1986
1987
1988
1989
1990
1991
1992
1993
1994
1995
1996
1997
1998
1999
2000
2001
2002
2003
2004
2005
2006
2007
2008
2009
(1)
(1) Provisional Data.
WORLD Advanced economies Developing countries Countries in transition
Chart 5Foreign direct
investmentinflows.
Billions of dollars
ICE Report 2009-2010 - Summary. Italy in the World Economy12
purchases. By contrast, the EU’s normalized surpluses grew in some medium/high-techsectors of specialization, including transport equipment, mechanical machinery andequipment and electrical machinery and apparatus.
The European Union also confirmed its global leadership as an exporter and importer ofservices, with a normalized surplus. Geographically, in 2009 the Union recorded its firstdeficit ever with the United States, its leading trading partner; the negative balance wasascribable to the deficits on construction and foreign travel.
According to the latest available data, which refer to 2008, the European Union lost itsprimacy as a recipient of foreign direct investment. The uncertain outlook for the economiesof the region and the diminished capacity of multinational corporations to maintain theirprevious financial commitments penalized the EU.
3. Trade policies
The negotiations within the World Trade Organization on the Doha Development Agendacontinued to be stalled in 2009, and the hoped-for conclusion of the talks during 2010appears unlikely. Governments’ shared worries about the economic situation diverted theirattention from the issues of negotiation, despite the positive contribution that a goodagreement could make to relaunching the world economy.
The persistent clash of positions between the advanced countries and the emerging ordeveloping countries prevents the talks from reaching conclusion. In the agricultural sectorthere are some areas of partial agreement, but on domestic subsidies many questionsremain pending. For non-agricultural goods, the gap between advanced and emergingcountries in tariff levels makes it hard to reach agreement on the manner and size of thecuts to be made. Headway has also been slow for the talks on services, which areconditioned by developments in the other sectors.
Despite the criticisms leveled against the WTO for its inability to break the deadlock andclose the Round, the WTO played an important role in 2009 in limiting the protectionistpressures generated by the crisis. There does not appear to have been generalizedrecourse by governments to such explicitly protectionist devices as anti-dumpingmeasures, the activation of safeguard clauses or the introduction of new customs duties ornon-tariff barriers. And even the countries that did take restrictive measures did notgenerally infringe the agreements in force, because they exploited the leeway between thelevels of customs duties established by the commitments within the WTO and the lowerlevels actually applied. In reality, some countries, notably developed countries, did useindirect protective devices, for instance public subsidies for domestic producers andmeasures regulating their domestic markets, with potentially discriminatory effects onimports that are difficult to identify and counter under the WTO procedures. In the first fewmonths of 2010, with the resurgence of trade, the number of defensive measures employedbegan to wane. However, there should be no relaxation of vigilance concerning a possiblerevival of protectionism, because many firms are still in difficulty and unemployment is stillvery high in many countries.
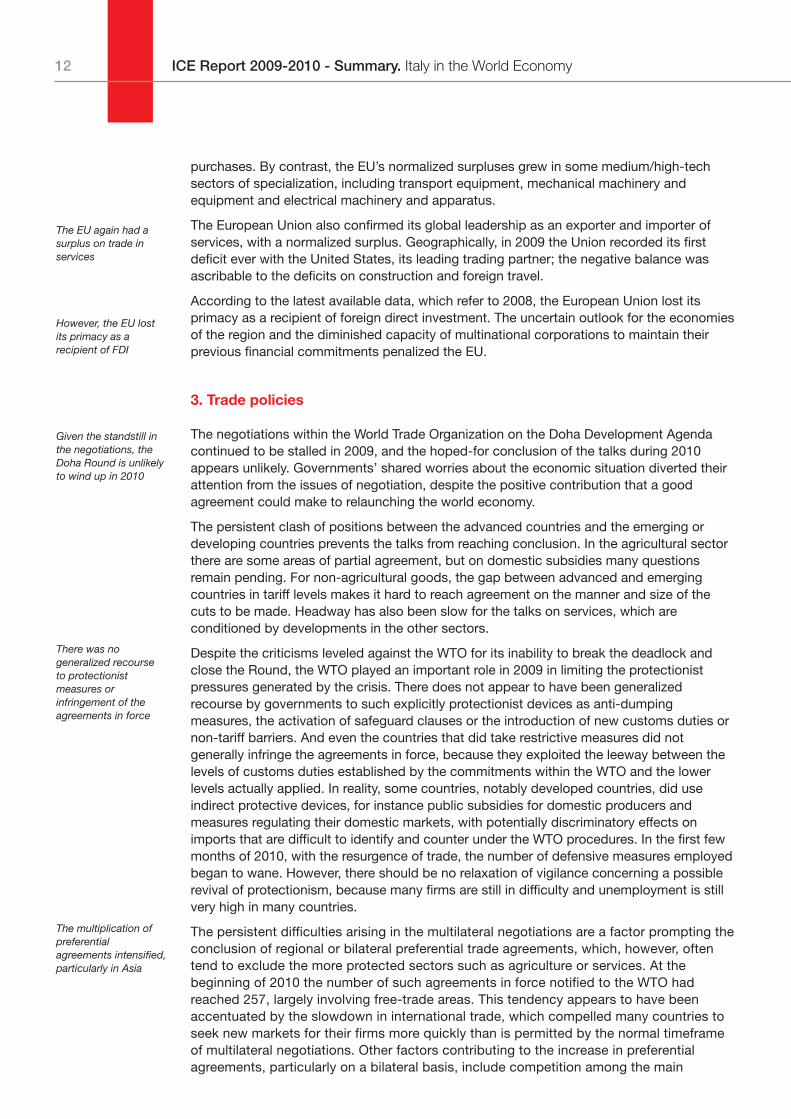
The persistent difficulties arising in the multilateral negotiations are a factor prompting theconclusion of regional or bilateral preferential trade agreements, which, however, oftentend to exclude the more protected sectors such as agriculture or services. At thebeginning of 2010 the number of such agreements in force notified to the WTO hadreached 257, largely involving free-trade areas. This tendency appears to have beenaccentuated by the slowdown in international trade, which compelled many countries toseek new markets for their firms more quickly than is permitted by the normal timeframeof multilateral negotiations. Other factors contributing to the increase in preferentialagreements, particularly on a bilateral basis, include competition among the main
The EU again had asurplus on trade inservices
However, the EU lostits primacy as arecipient of FDI
Given the standstill inthe negotiations, theDoha Round is unlikelyto wind up in 2010
There was nogeneralized recourseto protectionistmeasures orinfringement of theagreements in force
The multiplication ofpreferentialagreements intensified,particularly in Asia
13The Italian economy and the recovery of world trade
exporters to expand their shares on international markets, fear on the part of countriesexcluded from existing agreements that they might pay the price in terms of lessextensive participation in trade, and the goal of fostering the development of internationalproduction and supply chains. These pressures too were possibly heightened by thedecline in trade at global level.
Although a notification and transparency mechanism was put in place within the WTO someyears ago in order to seek to reconcile the bilateral and regional accords with themultilateral agreements, there is still good reason to fear that the shift of world trade towarda system of reciprocal and superimposed preferences will lead to greater complexity ofprocedures and a distortion of trade, mainly to the detriment of the smallest and mostmarginal countries. The Asia-Pacific region was again the most dynamic in establishingpreferential agreements, but these were concluded everywhere. In 2009 China completednegotiations with the six founder-countries of ASEAN for the elimination of import tariffs on90 per cent of industrial products. The potential of this free-trade area is enormous, even ifmany non-tariff barriers remain. In 2009 sub-Saharan Africa, which hitherto had givenpriority to a complex network of superimposed sub-regional pacts, also demonstratedgrowing interest in bilateral accords.
The European Union carried on with the negotiations already under way. Especiallyimportant are the economic partnership talks with the African, Caribbean and Pacific (ACP)group of states, although some disagreements are delaying their conclusion. By contrast,the talks for an agreement with South Korea seem to be headed for a positive conclusion,despite serious difficulties arising during the negotiations. Finally, the EU was also activetoward the Mediterranean region, with the envisaged signing of association agreementswith several countries.
4. Italy: macroeconomic analysis
Following a path similar to that of the other euro-area countries, the Italian economy haspulled out of recession and returned to growth. After contracting by more than 6 per cent inthe two years 2008 and 2009, GDP grew by 0.5 per cent in the first half of 2010 compared
The Italian economytoo has pulled out of
Source: Based on WTO data
0
50
100
150
200
250
300
350
400
450
0
10
20
30
40
50
60
70
80
90
100
1948
1950
1952
1954
1956
1958
1960
1962
1964
1966
1968
1970
1972
1974
1976
1978
1980
1982
1984
1986
1988
1990
1992
1994
1996
1998
2000
2002
2004
2006
2008
Nu
mb
er o
f R
TA
s
RTAs notified in the year (left scale) RTAs in force (right scale) Total RTAs, in force or not (right scale)
Chart 6Regional Trade
Agreements(RTA) notified to
the WTO.Up to
March 2010

ICE Report 2009-2010 - Summary. Italy in the World Economy14
with the year-earlier period and is forecast to expand by about 1 per cent for the entire year.The speed of the recovery is in line with the euro-area average but plainly far below thepace that would be needed for economic activity to rapidly regain the pre-crisis level.
All the main components of demand contributed to the fall in Italy’s GDP in 2009. Thesteepest decline was in fixed investment, which plunged by 12 per cent, but thecontribution of net exports was also negative as the drop in exports of goods and serviceswas greater than that in imports (19 and 14.5 per cent, respectively).
The contraction in foreign trade was thus much larger than that in output, further reducingthe Italian economy’s international openness. This falling back on domestic markets is oneof the most striking aspects of the global recession, but in Italy it was particularly intense.The propensity to export and the degree of import penetration fell at constant prices to 24and 25 per cent, respectively. These are the lowest levels in the European Union,considerably lower than those of countries of comparable economic size, such as Franceand the United Kingdom.
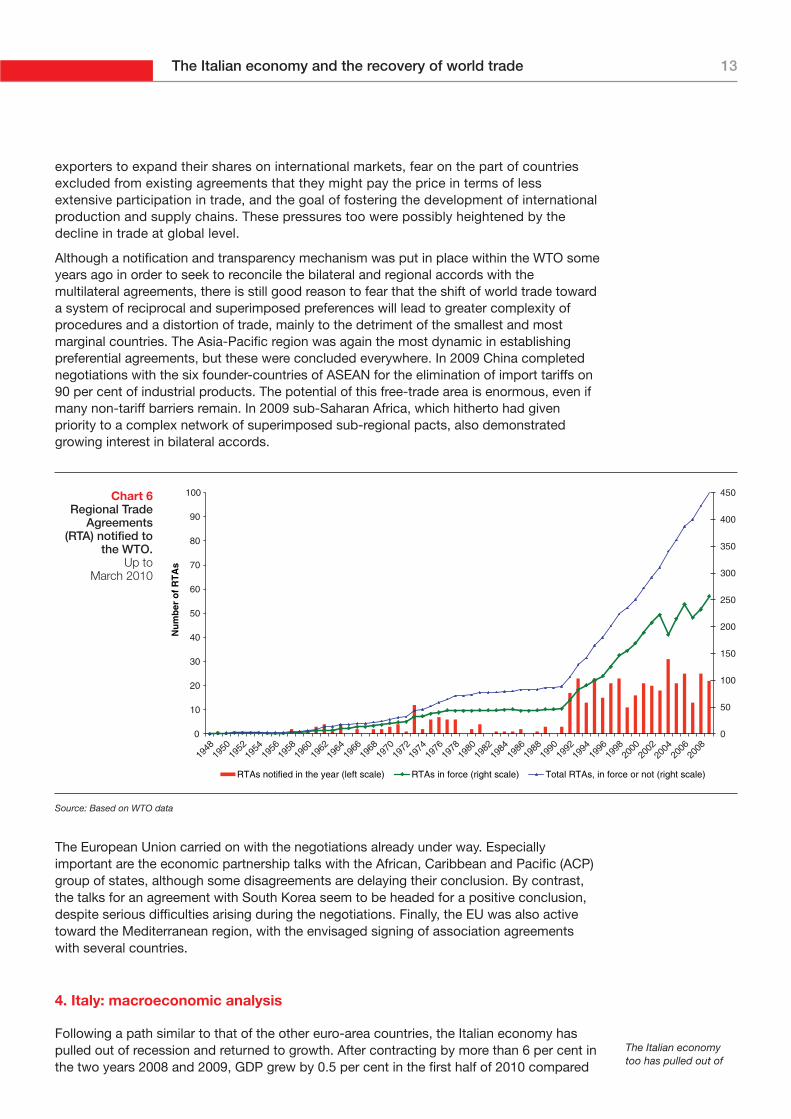
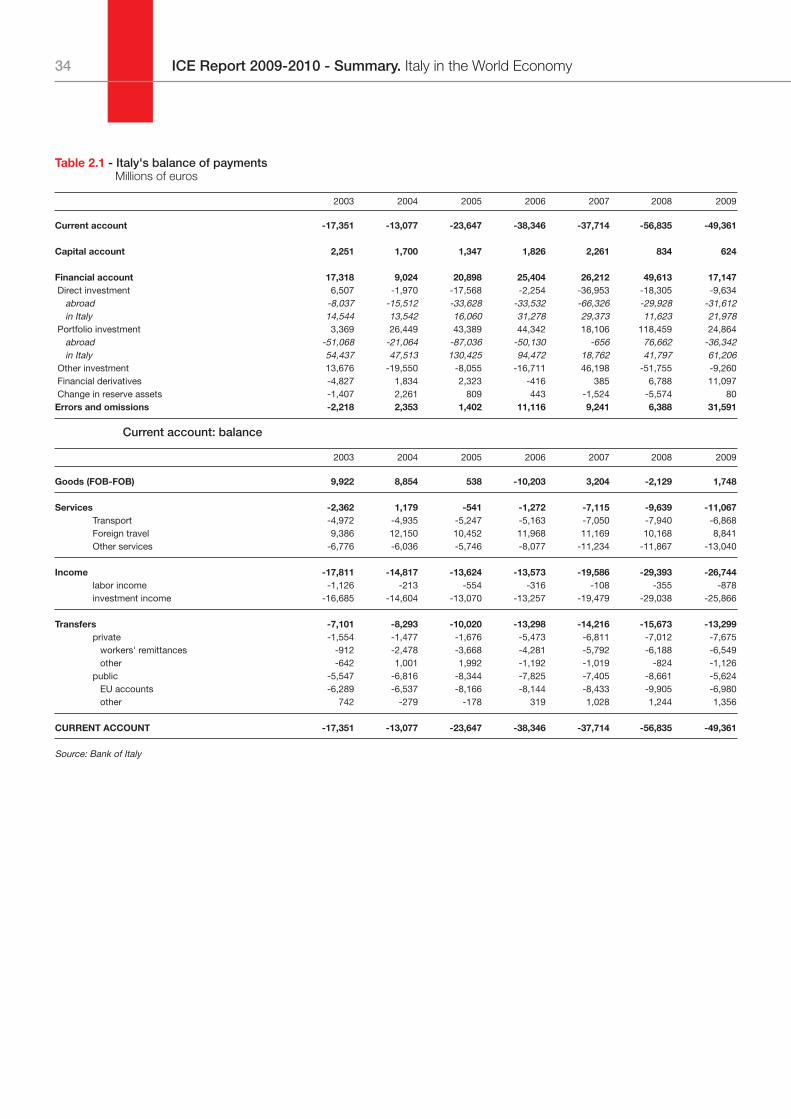
The deficit on the current account of Italy’s balance of payments shrank by about €7 billionin 2009, declining from 3.7 to 3.2 per cent of GDP. The merchandise trade balance (FOB-FOB) turned slightly positive as a result of the fall in the prices of raw materials, which led toa much larger reduction in the unit values of imports than in those of exports. By contrast,the deficit on services widened for the fifth year in a row: the reduction in the deficit ontransportation, closely linked to the performance of trade in goods, was more than offset bya fresh decline in the surplus on travel and by the increase in the deficit on other services.On the other hand, the structural deficits on public transfers and investment incomenarrowed. Positive effects on the latter item came from the decline in interest rates and theimprovement in Italy’s international investment position, the debtor balance on whichremains large (19 per cent of GDP) although smaller than that of other euro-area countries.
In the first few months of 2010 Italy’s balance of trade began to worsen again, as the pricesof imported raw materials rose and exports grew more slowly than imports (including withinthe European Union).
The value of merchandise exports, which had collapsed by 21 per cent in 2009, grew by 8.8per cent in the first four months of 2010 compared with the year-earlier period, slightlyunderperforming the euro-area average (9.3 per cent). The signs of an upturn in exports hadfirst appeared in the summer and they gained strength in the following months as theexpansionary impulses originating from the emerging countries spread to other markets.
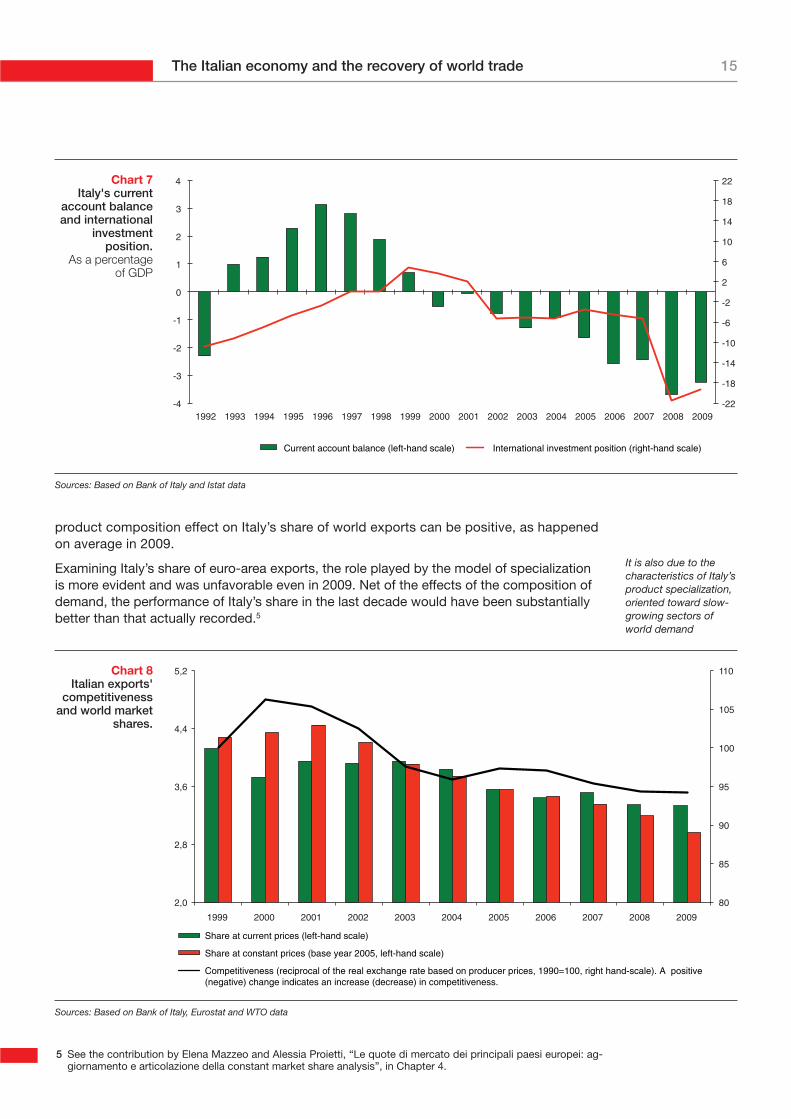
However, the recession snuffed out the incipient recovery that had taken shape for Italianexports in 2007, restoring the declining trend that has characterized the last twenty years. Invalue terms, Italy’s share of world exports fell from 5 to 3 per cent between 1990 and 2010;over the same period its share of EU-15 exports slipped from 11.3 to 10 per cent.
The loss of world export share largely reflects the rise of the emerging countries, China firstand foremost. Italian exports are particularly sensitive to the competitive pressure ofChinese exports in both high-income and emerging markets.4
However, another important factor of the decline in Italian exports is their model ofspecialization, oriented mainly toward products for which world demand has grown moreslowly than average. This negative effect of the product composition of exports is a signof the low income elasticity of demand for them, due in part to the relative dearth ofproduct innovations capable of putting their stamp on households’ patterns ofconsumption. In periods of rising raw materials prices, it also reflects Italy’s comparativedisadvantage in that sector. On the other hand, if commodity prices drop sharply, the
… but the recovery isproceeding slowly andactivity is far fromreaching the pre-crisislevel
The internationalopenness of theeconomy diminished
The external currentaccount deficit shrank
In the first few monthsof 2010, with therebound of the pricesof energycommodities, the tradebalance has started toworsen again
Italy’s loss of sharereflects the rise ofemerging countries,notably China
4 See the contribution by Giorgia Giovannetti, Marco Sanfilippo and Margherita Velucchi, “L’effetto Cina sulle es-portazioni italiane”, in Chapter 4.
15The Italian economy and the recovery of world trade
product composition effect on Italy’s share of world exports can be positive, as happenedon average in 2009.
Examining Italy’s share of euro-area exports, the role played by the model of specializationis more evident and was unfavorable even in 2009. Net of the effects of the composition ofdemand, the performance of Italy’s share in the last decade would have been substantiallybetter than that actually recorded.5
It is also due to thecharacteristics of Italy’sproduct specialization,oriented toward slow-growing sectors ofworld demand
5 See the contribution by Elena Mazzeo and Alessia Proietti, “Le quote di mercato dei principali paesi europei: ag-giornamento e articolazione della constant market share analysis”, in Chapter 4.
Sources: Based on Bank of Italy and Istat data
-22
-18
-14
-10
-6
-2
2
6
10
14
18
22
-4
-3
-2
-1
0
1
2
3
4
1992 1993 1994 1995 1996 1997 1998 1999 2000 2001 2002 2003 2004 2005 2006 2007 2008 2009
Current account balance (left-hand scale) International investment position (right-hand scale)
Chart 7Italy's current
account balanceand international
investmentposition.
As a percentage of GDP
Sources: Based on Bank of Italy, Eurostat and WTO data
80
85
90
95
100
105
110
2,0
2,8
3,6
4,4
5,2
1999 2000 2001 2002 2003 2004 2005 2006 2007 2008 2009
Share at current prices (left-hand scale)
Share at constant prices (base year 2005, left-hand scale)
Competitiveness (reciprocal of the real exchange rate based on producer prices, 1990=100, right hand-scale). A positive (negative) change indicates an increase (decrease) in competitiveness.
Chart 8Italian exports'
competitiveness and world market
shares.
ICE Report 2009-2010 - Summary. Italy in the World Economy16
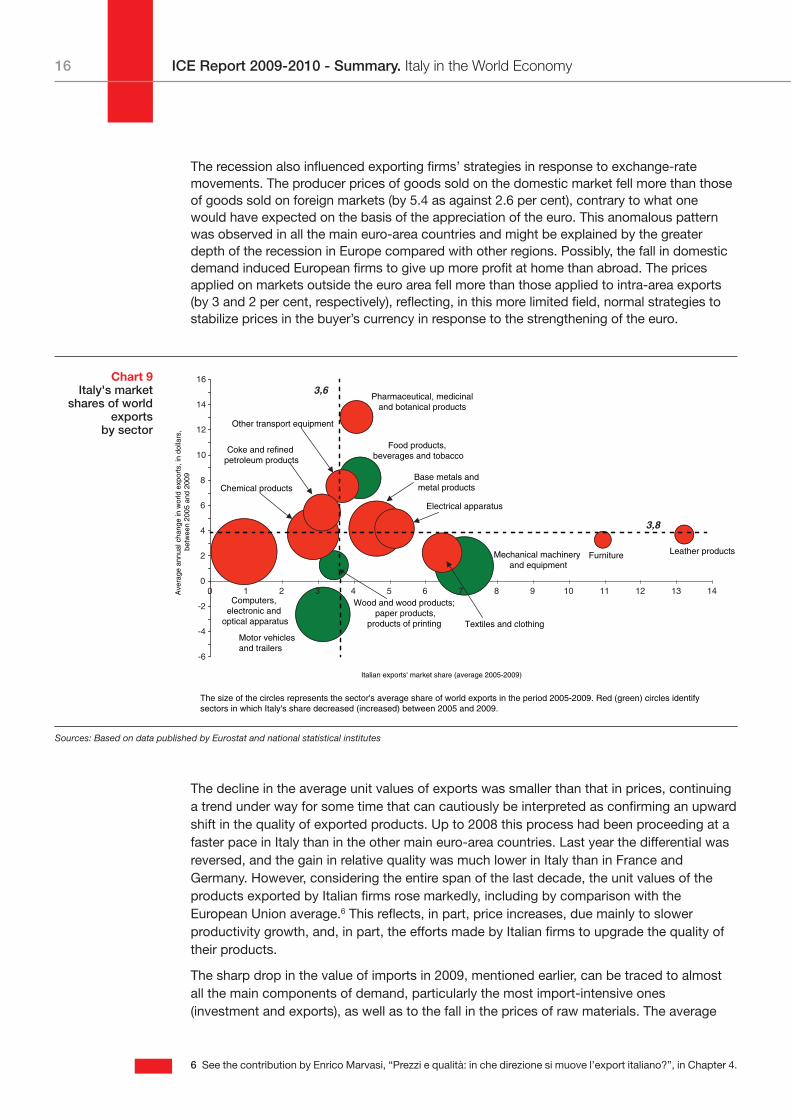
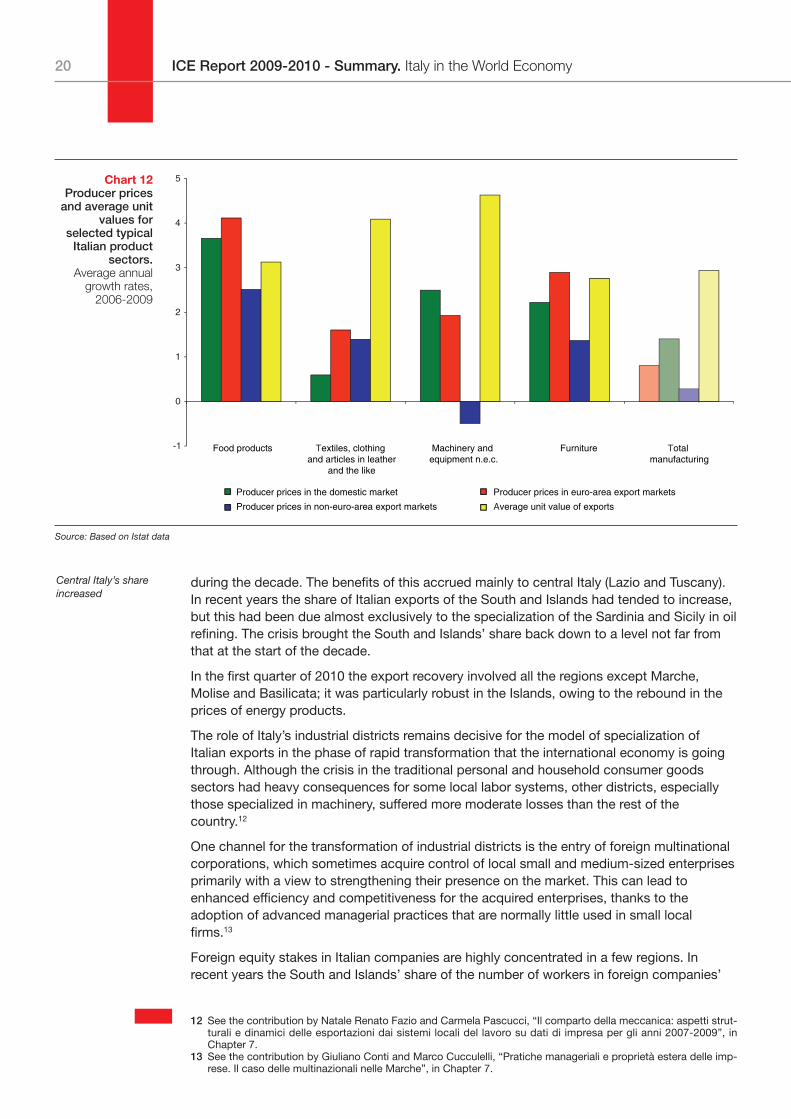
The recession also influenced exporting firms’ strategies in response to exchange-ratemovements. The producer prices of goods sold on the domestic market fell more than thoseof goods sold on foreign markets (by 5.4 as against 2.6 per cent), contrary to what onewould have expected on the basis of the appreciation of the euro. This anomalous patternwas observed in all the main euro-area countries and might be explained by the greaterdepth of the recession in Europe compared with other regions. Possibly, the fall in domesticdemand induced European firms to give up more profit at home than abroad. The pricesapplied on markets outside the euro area fell more than those applied to intra-area exports(by 3 and 2 per cent, respectively), reflecting, in this more limited field, normal strategies tostabilize prices in the buyer’s currency in response to the strengthening of the euro.
The decline in the average unit values of exports was smaller than that in prices, continuinga trend under way for some time that can cautiously be interpreted as confirming an upwardshift in the quality of exported products. Up to 2008 this process had been proceeding at afaster pace in Italy than in the other main euro-area countries. Last year the differential wasreversed, and the gain in relative quality was much lower in Italy than in France andGermany. However, considering the entire span of the last decade, the unit values of theproducts exported by Italian firms rose markedly, including by comparison with theEuropean Union average.6 This reflects, in part, price increases, due mainly to slowerproductivity growth, and, in part, the efforts made by Italian firms to upgrade the quality oftheir products.
The sharp drop in the value of imports in 2009, mentioned earlier, can be traced to almostall the main components of demand, particularly the most import-intensive ones(investment and exports), as well as to the fall in the prices of raw materials. The average
Sources: Based on data published by Eurostat and national statistical institutes
Food products, beverages and tobacco
Leather products
Wood and wood products; paper products,
products of printing
Chemical products
Pharmaceutical, medicinal and botanical products
Base metals and metal products
Computers, electronic and
optical apparatus
Electrical apparatus
Mechanical machinery and equipment
Other transport equipment
Furniture
Motor vehicles and trailers
Textiles and clothing
Coke and refined petroleum products
-6
-4
-2
0
2
4
6
8
10
12
14
16
0 1 2 3 4 5 6 7 8 9 10 11 12 13 14
Italian exports' market share (average 2005-2009)
Ave
rage
ann
ual c
hang
e in
wor
ld e
xpor
ts, i
n do
llars
, be
twee
n 20
05 a
nd 2
009
The size of the circles represents the sector's average share of world exports in the period 2005-2009. Red (green) circles identify sectors in which Italy's share decreased (increased) between 2005 and 2009.
3,8
3,6Chart 9
Italy's marketshares of world
exports by sector
6 See the contribution by Enrico Marvasi, “Prezzi e qualità: in che direzione si muove l’export italiano?”, in Chapter 4.
17The Italian economy and the recovery of world trade
unit value of imported manufactures diminished less than the producer prices of goods soldon the domestic market.
Imports also began to stage a recovery in the second half of the year. In the first fourmonths of 2010 they were up in value by 12.5 per cent compared with a year earlier, in linewith the European average, buoyed by the rebound in production, the recovery incommodity prices and the depreciation of the euro.
The recession had slowed the pace of firms’ internationalization of production as early as2008, causing Italy’s flows of inward and outward direct investment to fall very substantiallythat year. In 2009 there was a partial recovery.
5. Regions and countries
The contraction in world trade in 2009 had widespread effects on flows between Italy andalmost all of its partners. The present recovery is also broadly based, but its strength variesacross regions and countries. Trade is expanding rapidly with emerging countries (China,India, other Asian countries and especially Mercosur and Turkey), while exports to theEuropean Union, the United States and Japan are reviving more slowly. The strong reboundof imports from commodity-producing countries is still not accompanied by a sufficientrecovery in Italian exports.
The reduction in the trade deficit in 2009 derived from the improvements in the balanceswith commodity-producing countries, due to the fall in the prices of imports, and withemerging countries, due to the recession-induced decline in Italian imports of intermediateand capital goods. These changes more than offset the deterioration in Italy’s tradebalances with Europe and North America, which was the result of a larger drop in exportsthan imports. In 2010 the bilateral trade balances are worsening, particularly with thecommodity-producing countries, owing to rising raw materials prices, and vis-à-vis theEuropean Union.
The renewed decline in Italian exports’ market shares in the two years of the crisis involvedalmost all the world’s regions, notably the European Union and Latin America. Gains ofshare by comparison with 2007 were recorded in the non-EU European countries, NorthAfrica and some Asian markets, including China. To some extent they may be connectedwith the exports of intermediate and capital goods stimulated by Italian firms’internationalization of production.
The collapse of world trade at the height of the crisis appears to have had only transitoryeffects on the density of the network of bilateral trade.7 The recovery now under way hasreactivated flows that had ceased, even if they have yet to make good all of the losses. Likeothers, Italy’s network of bilateral trade is basically intact.
Nevertheless, the geographical distribution of Italian exports is still relatively underweighttoward the emerging countries of Asia by comparison with that of Germany, and thisreduces the speed with which Italy absorbs the benefits of the present recovery. However,some signs of a more favorable reorientation have appeared in recent years, especially forcapital goods.
The data on cross-border affiliates, available only up to 2008, indicate that the EuropeanUnion’s share of Italian affiliates abroad and foreign affiliates in Italy declined in the contextof a widespread slowdown in direct investment.
Italy’s trade balanceswith commodity-producing andemerging countriesimproved
The geographicaldistribution of Italianexports is underweighttoward the emergingcountries of Asia.There are initial signsof a reorientation
7 See the contribution by Luca De Benedictis and Lucia Tajoli, “L’Italia, la crisi del commercio internazionale e la retedegli scambi commerciali mondiali”, in Chapter 5.
ICE Report 2009-2010 - Summary. Italy in the World Economy18
6. Sectors
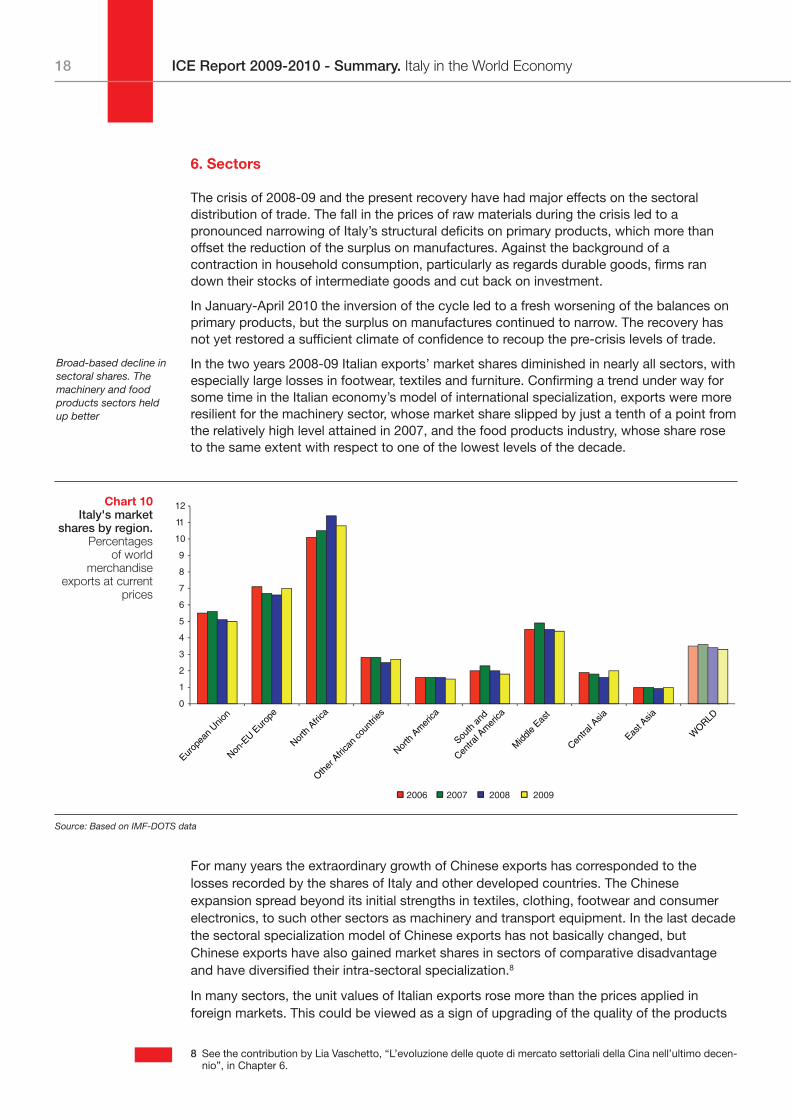
The crisis of 2008-09 and the present recovery have had major effects on the sectoraldistribution of trade. The fall in the prices of raw materials during the crisis led to apronounced narrowing of Italy’s structural deficits on primary products, which more thanoffset the reduction of the surplus on manufactures. Against the background of acontraction in household consumption, particularly as regards durable goods, firms randown their stocks of intermediate goods and cut back on investment.
In January-April 2010 the inversion of the cycle led to a fresh worsening of the balances onprimary products, but the surplus on manufactures continued to narrow. The recovery hasnot yet restored a sufficient climate of confidence to recoup the pre-crisis levels of trade.
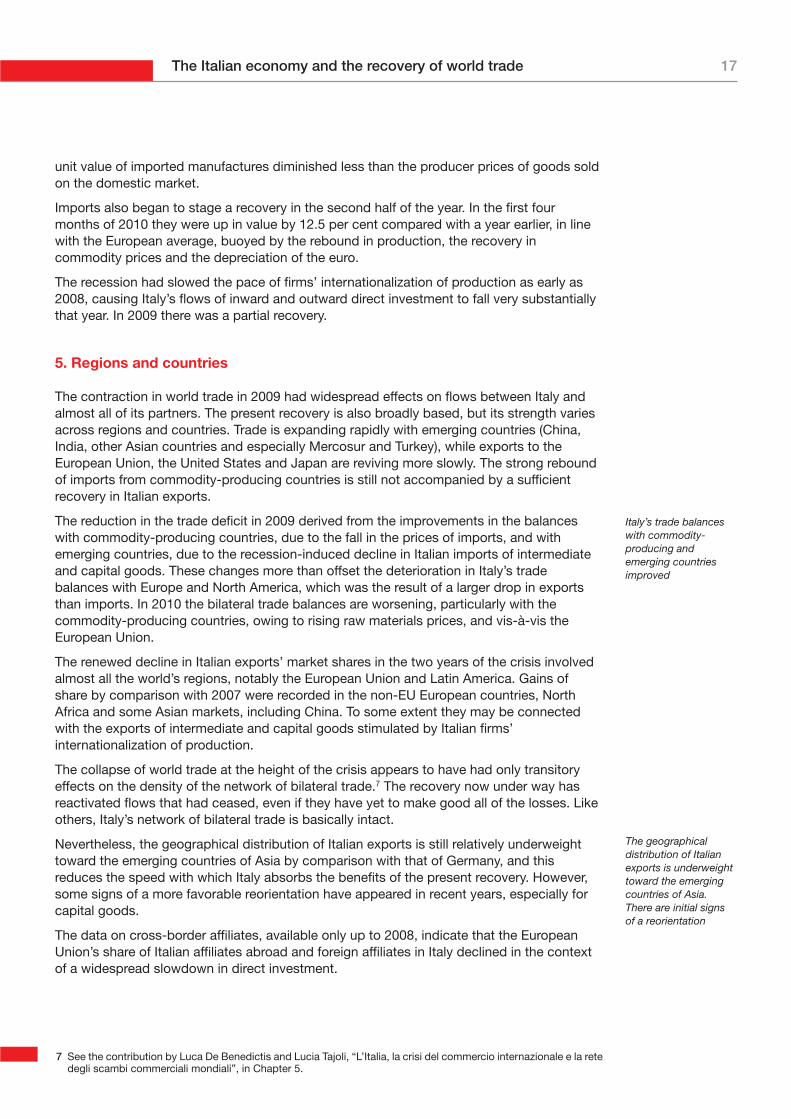
In the two years 2008-09 Italian exports’ market shares diminished in nearly all sectors, withespecially large losses in footwear, textiles and furniture. Confirming a trend under way forsome time in the Italian economy’s model of international specialization, exports were moreresilient for the machinery sector, whose market share slipped by just a tenth of a point fromthe relatively high level attained in 2007, and the food products industry, whose share roseto the same extent with respect to one of the lowest levels of the decade.
For many years the extraordinary growth of Chinese exports has corresponded to thelosses recorded by the shares of Italy and other developed countries. The Chineseexpansion spread beyond its initial strengths in textiles, clothing, footwear and consumerelectronics, to such other sectors as machinery and transport equipment. In the last decadethe sectoral specialization model of Chinese exports has not basically changed, butChinese exports have also gained market shares in sectors of comparative disadvantageand have diversified their intra-sectoral specialization.8
In many sectors, the unit values of Italian exports rose more than the prices applied inforeign markets. This could be viewed as a sign of upgrading of the quality of the products
Broad-based decline insectoral shares. Themachinery and foodproducts sectors heldup better
Source: Based on IMF-DOTS data
0
1
2
3
4
5
6
7
8
9
10
11
12
Europ
ean
Union
Non-E
U Eur
ope
North
Afri
ca
Other
Afri
can
coun
tries
North
Am
erica
South
and
Centra
l Am
erica
Midd
le Eas
t
Centra
l Asia
East A
sia
WORLD
2006 2007 2008 2009
Chart 10Italy's market
shares by region. Percentages
of worldmerchandise
exports at currentprices
8 See the contribution by Lia Vaschetto, “L’evoluzione delle quote di mercato settoriali della Cina nell’ultimo decen-nio”, in Chapter 6.
19The Italian economy and the recovery of world trade
exported by Italian firms, in response to heightened competitive pressure in marketsabroad. However, other empirical evidence does not fully corroborate this interpretation.
The prospects of Italian exports will also depend on their ability to intercept the demand for“affordable luxury”, which is expected to grow rapidly in the emerging countries in thecoming years as the upper-middle class expands and women increasingly participate ineducation and employment.9 With this objective in mind, distribution channels andtechnology will have to be adapted to the new market trends.
In addition, it is essential to strengthen Italian firms’ competitive position in the productionof intermediate and investment goods, whose importance could grow further as theinternational fragmentation of production intensifies. This requires an ability to combineexport strategies and international partnerships in production, as is shown by the exampleof the energy sector.10 The shift of production capacity toward the emerging countries isalso continuing in the world motor vehicle market, which reeled under the impact of thecrisis.11
7. The territorial base
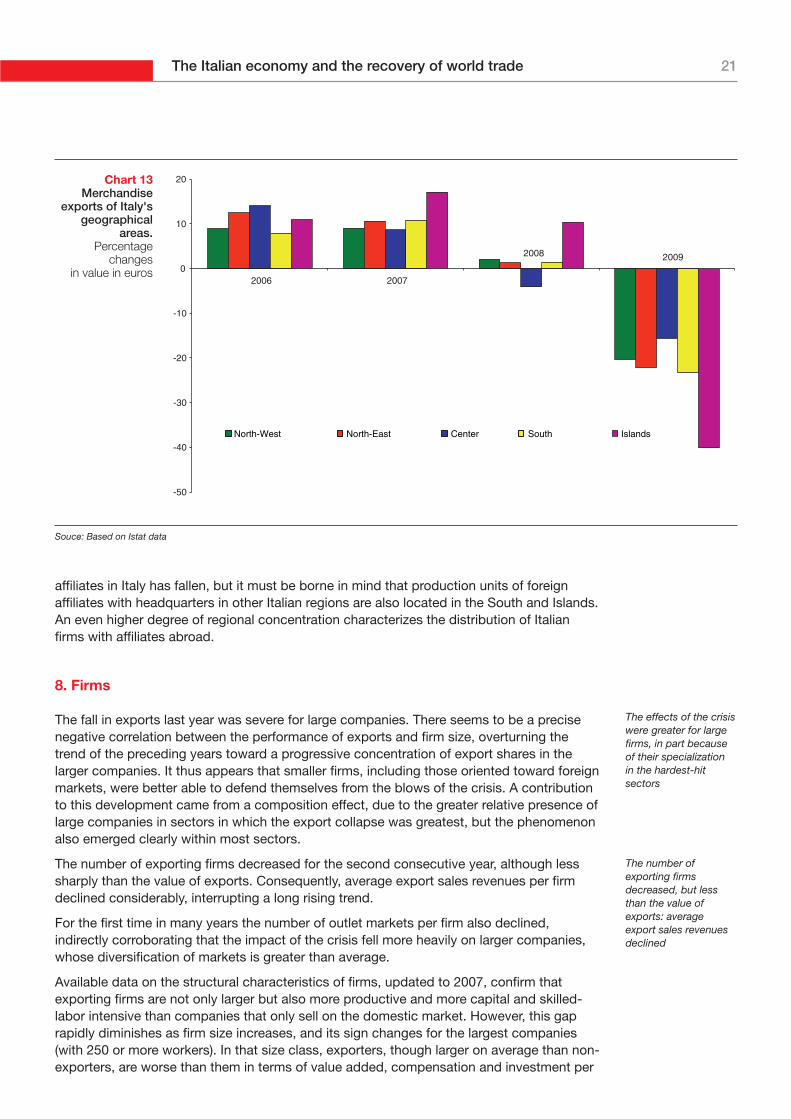
The exports of almost all the Italian regions declined in 2009, but the fall was particularlypronounced in Sardinia and Sicily, owing to their specialization in petroleum derivatives, andin the regions of the Adriatic seaboard.
As a result of the relatively large contractions for Emilia Romagna and Veneto in 2009, theNorth-East gave up some of the gain in its share of Italian exports that it had accumulated
Exports plummeted inSicily and Sardinia,specialized in refinedpetroleum products.The first quarter of2010 shows themreviving
Source: Based on Istat data
-80
-60
-40
-20
0
20
40
60
Mechanicalmachinery and
equipment
Textiles, clothingand leather
products
Fabricated metalproducts (except for
machinery andequipment)
Electrical and nonelectrical domestic
equipment
2006 2007 2008 2009
Products of miningand quarrying
ICT, electricalequipment and
precisioninstruments
Food and agricultural products
Transport equipment
Chart 11Italy's sectoral
balances.Billions of euros
9 See the contribution by Claudio Colacurcio and Manuela Marianera, “Il boom dei nuovi consumatori e le oppor-tunità per il lusso accessibile italiano”, in Chapter 6.
10 See the contribution by Matteo Verda, “L’Italia nei mercati internazionali dell’energia: effetti della crisi e strategiedelle imprese nazionali”, in Chapter 6.
11 See the contribution by Matteo Ferrazzi on the case of Fiat, “L’auto italiana parlerà anche serbo”, in Chapter 6.
ICE Report 2009-2010 - Summary. Italy in the World Economy20
during the decade. The benefits of this accrued mainly to central Italy (Lazio and Tuscany).In recent years the share of Italian exports of the South and Islands had tended to increase,but this had been due almost exclusively to the specialization of the Sardinia and Sicily in oilrefining. The crisis brought the South and Islands’ share back down to a level not far fromthat at the start of the decade.
In the first quarter of 2010 the export recovery involved all the regions except Marche,Molise and Basilicata; it was particularly robust in the Islands, owing to the rebound in theprices of energy products.
The role of Italy’s industrial districts remains decisive for the model of specialization ofItalian exports in the phase of rapid transformation that the international economy is goingthrough. Although the crisis in the traditional personal and household consumer goodssectors had heavy consequences for some local labor systems, other districts, especiallythose specialized in machinery, suffered more moderate losses than the rest of thecountry.12
One channel for the transformation of industrial districts is the entry of foreign multinationalcorporations, which sometimes acquire control of local small and medium-sized enterprisesprimarily with a view to strengthening their presence on the market. This can lead toenhanced efficiency and competitiveness for the acquired enterprises, thanks to theadoption of advanced managerial practices that are normally little used in small localfirms.13
Foreign equity stakes in Italian companies are highly concentrated in a few regions. Inrecent years the South and Islands’ share of the number of workers in foreign companies’
Central Italy’s shareincreased
12 See the contribution by Natale Renato Fazio and Carmela Pascucci, “Il comparto della meccanica: aspetti strut-turali e dinamici delle esportazioni dai sistemi locali del lavoro su dati di impresa per gli anni 2007-2009”, inChapter 7.
13 See the contribution by Giuliano Conti and Marco Cucculelli, “Pratiche manageriali e proprietà estera delle imp-rese. Il caso delle multinazionali nelle Marche”, in Chapter 7.
Source: Based on Istat data
-1
0
1
2
3
4
5
Food products Textiles, clothing and articles in leather
and the like
Machinery and equipment n.e.c.
Furniture Total manufacturing
Producer prices in the domestic market Producer prices in euro-area export markets
Producer prices in non-euro-area export markets Average unit value of exports
Chart 12Producer prices
and average unitvalues for
selected typicalItalian product
sectors.Average annual
growth rates,2006-2009
21The Italian economy and the recovery of world trade
affiliates in Italy has fallen, but it must be borne in mind that production units of foreignaffiliates with headquarters in other Italian regions are also located in the South and Islands.An even higher degree of regional concentration characterizes the distribution of Italianfirms with affiliates abroad.
8. Firms
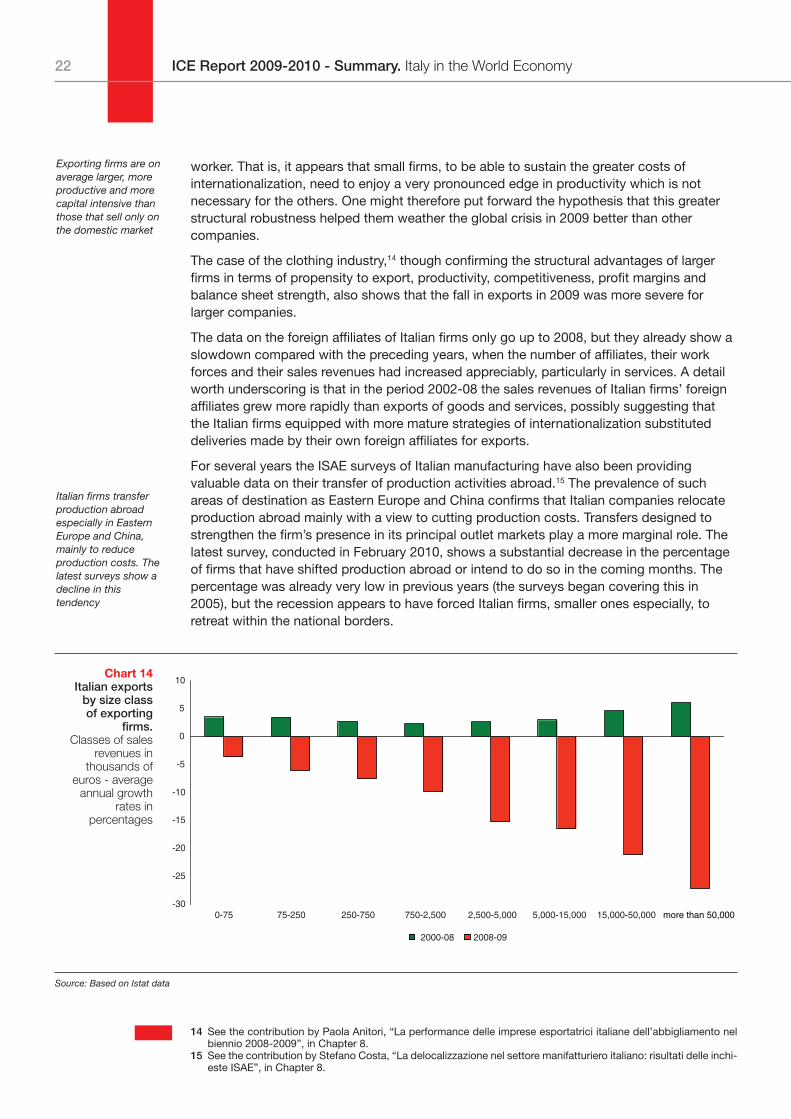
The fall in exports last year was severe for large companies. There seems to be a precisenegative correlation between the performance of exports and firm size, overturning thetrend of the preceding years toward a progressive concentration of export shares in thelarger companies. It thus appears that smaller firms, including those oriented toward foreignmarkets, were better able to defend themselves from the blows of the crisis. A contributionto this development came from a composition effect, due to the greater relative presence oflarge companies in sectors in which the export collapse was greatest, but the phenomenonalso emerged clearly within most sectors.
The number of exporting firms decreased for the second consecutive year, although lesssharply than the value of exports. Consequently, average export sales revenues per firmdeclined considerably, interrupting a long rising trend.
For the first time in many years the number of outlet markets per firm also declined,indirectly corroborating that the impact of the crisis fell more heavily on larger companies,whose diversification of markets is greater than average.
Available data on the structural characteristics of firms, updated to 2007, confirm thatexporting firms are not only larger but also more productive and more capital and skilled-labor intensive than companies that only sell on the domestic market. However, this gaprapidly diminishes as firm size increases, and its sign changes for the largest companies(with 250 or more workers). In that size class, exporters, though larger on average than non-exporters, are worse than them in terms of value added, compensation and investment per
The effects of the crisiswere greater for largefirms, in part becauseof their specializationin the hardest-hitsectors
The number ofexporting firmsdecreased, but lessthan the value ofexports: averageexport sales revenuesdeclined
Souce: Based on Istat data
-50
-40
-30
-20
-10
0
10
20
2006 2007
North-West North-East Center South Islands
2008 2009
Chart 13 Merchandise
exports of Italy'sgeographical
areas. Percentage
changes in value in euros
ICE Report 2009-2010 - Summary. Italy in the World Economy22
worker. That is, it appears that small firms, to be able to sustain the greater costs ofinternationalization, need to enjoy a very pronounced edge in productivity which is notnecessary for the others. One might therefore put forward the hypothesis that this greaterstructural robustness helped them weather the global crisis in 2009 better than othercompanies.
The case of the clothing industry,14 though confirming the structural advantages of largerfirms in terms of propensity to export, productivity, competitiveness, profit margins andbalance sheet strength, also shows that the fall in exports in 2009 was more severe forlarger companies.
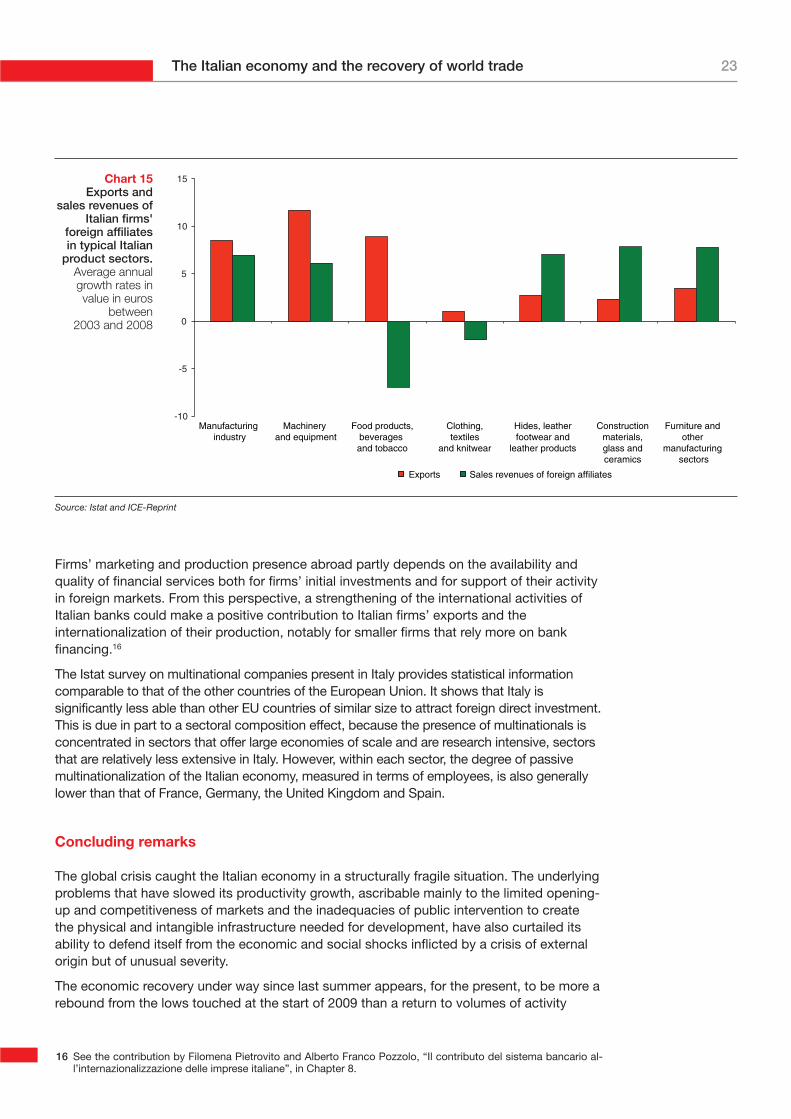
The data on the foreign affiliates of Italian firms only go up to 2008, but they already show aslowdown compared with the preceding years, when the number of affiliates, their workforces and their sales revenues had increased appreciably, particularly in services. A detailworth underscoring is that in the period 2002-08 the sales revenues of Italian firms’ foreignaffiliates grew more rapidly than exports of goods and services, possibly suggesting thatthe Italian firms equipped with more mature strategies of internationalization substituteddeliveries made by their own foreign affiliates for exports.
For several years the ISAE surveys of Italian manufacturing have also been providingvaluable data on their transfer of production activities abroad.15 The prevalence of suchareas of destination as Eastern Europe and China confirms that Italian companies relocateproduction abroad mainly with a view to cutting production costs. Transfers designed tostrengthen the firm’s presence in its principal outlet markets play a more marginal role. Thelatest survey, conducted in February 2010, shows a substantial decrease in the percentageof firms that have shifted production abroad or intend to do so in the coming months. Thepercentage was already very low in previous years (the surveys began covering this in2005), but the recession appears to have forced Italian firms, smaller ones especially, toretreat within the national borders.
Exporting firms are onaverage larger, moreproductive and morecapital intensive thanthose that sell only onthe domestic market
Italian firms transferproduction abroadespecially in EasternEurope and China,mainly to reduceproduction costs. Thelatest surveys show adecline in thistendency
Source: Based on Istat data
-30
-25
-20
-15
-10
-5
0
5
10
0-75 75-250 250-750 750-2,500 2,500-5,000 5,000-15,000 15,000-50,000 more than 50,000
2000-08 2008-09
Chart 14 Italian exports
by size class of exporting
firms.Classes of sales
revenues inthousands of
euros - averageannual growth
rates inpercentages
14 See the contribution by Paola Anitori, “La performance delle imprese esportatrici italiane dell’abbigliamento nelbiennio 2008-2009”, in Chapter 8.
15 See the contribution by Stefano Costa, “La delocalizzazione nel settore manifatturiero italiano: risultati delle inchi-este ISAE”, in Chapter 8.
23The Italian economy and the recovery of world trade
Firms’ marketing and production presence abroad partly depends on the availability andquality of financial services both for firms’ initial investments and for support of their activityin foreign markets. From this perspective, a strengthening of the international activities ofItalian banks could make a positive contribution to Italian firms’ exports and theinternationalization of their production, notably for smaller firms that rely more on bankfinancing.16
The Istat survey on multinational companies present in Italy provides statistical informationcomparable to that of the other countries of the European Union. It shows that Italy issignificantly less able than other EU countries of similar size to attract foreign direct investment.This is due in part to a sectoral composition effect, because the presence of multinationals isconcentrated in sectors that offer large economies of scale and are research intensive, sectorsthat are relatively less extensive in Italy. However, within each sector, the degree of passivemultinationalization of the Italian economy, measured in terms of employees, is also generallylower than that of France, Germany, the United Kingdom and Spain.
Concluding remarks
The global crisis caught the Italian economy in a structurally fragile situation. The underlyingproblems that have slowed its productivity growth, ascribable mainly to the limited opening-up and competitiveness of markets and the inadequacies of public intervention to createthe physical and intangible infrastructure needed for development, have also curtailed itsability to defend itself from the economic and social shocks inflicted by a crisis of externalorigin but of unusual severity.
The economic recovery under way since last summer appears, for the present, to be more arebound from the lows touched at the start of 2009 than a return to volumes of activity
Source: Istat and ICE-Reprint
-10
-5
0
5
10
15
Manufacturing industry
Machinery and equipment
Food products,beverages and tobacco
Clothing, textiles
and knitwear
Hides, leather footwear and
leather products
Construction materials, glass and ceramics
Furniture and other
manufacturing sectors
Exports Sales revenues of foreign affiliates
Chart 15 Exports and
sales revenues ofItalian firms'
foreign affiliatesin typical Italian
product sectors.Average annualgrowth rates invalue in euros
between 2003 and 2008
16 See the contribution by Filomena Pietrovito and Alberto Franco Pozzolo, “Il contributo del sistema bancario al-l’internazionalizzazione delle imprese italiane”, in Chapter 8.
ICE Report 2009-2010 - Summary. Italy in the World Economy24
comparable to those, modest enough, recorded before the crisis. The stimulus coming fromforeign demand is not coupled with a sufficient recovery in domestic demand, which iscompressed by the stagnation of wages, the fall in employment and the persistentuncertainty about the future that paralyzes households’ and firms’ spending plans withoutthe public finances – burdened with their unsolved problems – being able to intervene insupport. The suspicion naturally arises that the Italian economy may have permanentlyembarked on a structurally lower growth path than that of the preceding decades.
Moreover, in the aggregate data, the Italian economy appears to be increasingly inward-looking. The ratio of trade in goods and services to GDP has fallen by nine percentagepoints in two years and is the lowest in the European Union, below that of the largesteconomies, for which this indicator of openness tends to be lower. Signs of retreat alsoemerge in direct investment abroad, while the Italian economic system’s ability to attract theinterest of foreign multinational and immigrants appears to be limited with respect to itspotential.
And yet, before the crisis the competitive winnowing imposed by the new technologicalparadigm and the more intense integration of international markets seemed to be impartinga positive thrust to the productive system in Italy, as elsewhere. The emerging enterprisesdisplayed a capacity for scaling-up, technological renewal, improving the quality of theirproducts and developing strategies for international expansion. These changes were not yetsufficient to counterbalance the widespread difficulties in local production systems, whosecrisis they sometimes even aggravated by interrupting long-standing subcontractingrelations. But they did reveal an ability to react, indicating a possible way out for the Italianeconomy from a long phase of stagnation in growth.
Even some macroeconomic data appeared to be starting to reflect the signs of thistransformation. These included, in particular, Italian exports’ world market share, a summaryindicator of the competitive success of firms and a subject of many of the analysescontained in this Report.
Measured in value with respect to the total exports of the euro area, this indicator had risenby two tenths of a point in 2007, interrupting a long decline. But it lost seven tenths of apoint in 2008-09 and at least another one in the first quarter of 2010.
The reference to euro-area exports is useful in order to restrict the comparison to countriesthat are not too unlike one another, putting aside the often ambiguous role of exchangerates and the increase in the export shares of the emerging countries, particularly China,and the producers of raw materials. Among the euro-area countries, only Finland and Maltahave turned in worse results than Italy’s in the last two years.
Among the reasons for the decline in Italian exports’ share, special emphasis needs to bepaid, as this Report repeatedly does, to the characteristics of their model of specialization,oriented mainly to products for which world demand has, for various reasons, grown moreslowly than average. Without this negative effect, Italian exports would have posted betterresults, comparable to those of the other large euro-area countries.
Among the structural aspects often cited in order to explain the Italian economy’s growthgap and Italian firms’ problems of competitiveness is the fragmentation of the productivefabric, the unusually large role played by small firms in Italy compared with otherdeveloped countries. There is a threshold below which it becomes very hard to sustain thecosts and risks of the innovations needed to compete on the international markets. Toemerge, small firms must make up for these diseconomies of scale with significantadvantages in terms of productivity and/or capital and skilled-labor intensity, which are noteasy to obtain. Some succeed, at times by exploiting external economies deriving fromtheir strong local roots in industrial districts. Others fail, reinforcing the idea that policiesdesigned to foster the scaling-up of firms are essential in order to support the growth ofthe Italian economy.
25The Italian economy and the recovery of world trade
But in 2009, in nearly every sector, the collapse in exports was severest for the largestcompanies, interrupting the gradual rise in their share. We do not know exactly why thishappened, and it is too early to rule out that this was a one-off, transitory development.However, it may be useful to reopen discussion of the relationship between the size ofcompanies and their international competitiveness.
Instead of pursuing the scaling-up of existing firms for itself, on the assumption that this willautomatically translate into greater capacities for innovation and internationalization, itmight be better to aim for their qualitative improvement, by encouraging the patterns ofevolution that had appeared before the crisis. The crucial point appears to be firms’ abilityto adapt rapidly to the technological and organizational changes required by developmentsin the markets. If they succeed, growth in size will follow and a virtuous circle will becreated, making international expansion a factor further boosting the productivity of thebest firms.
To this end, a context of rules, incentives and infrastructure favorable to entrepreneurialactivities is needed, an environment that stimulates the best energies that are present in thecountry’s productive fabric. But there must also be major public investment in the educationand research system, not only to turn its points of excellence to account but also, indeedmainly, to improve its weakest parts. Without a consistent, resolute effort in this direction,the drive to renew the entrepreneurial fabric and model of international specialization of theItalian economy risks foundering on the long-standing problem of the symmetrical shortageof both demand for and supply of skilled labor, which today forces many young people toseek their future abroad.
An important element of the context in which firms operate is the system of public supportfor their internationalization. The set of measures and programs of financial and real supportcan play a valuable role in promoting and strengthening the international activities of firms,helping them to overcome the significant initial costs of access to foreign markets, withindirect benefits for the entire economy that justify public intervention. It is essential,however, to ensure that the system is designed in a way that avoids coordination problemsamong the different national and local organizations that participate in it, therebymaximizing the results achieved in relation to the human and financial resources used. Thereform measures that the Government is preparing to implement must also be assessedwith these parameters.
Lastly, it is essential, for economic development and for the quality of social life, to relaunchItaly’s international openness. This task falls within various spheres of public action atdifferent international levels: from trade policies, defined at European level, where thepriority remains bringing the WTO negotiations to a positive conclusion; to competitionpolicies, which can play a valuable role in opening up markets, especially in the crucialsector of services; to all the forms of international cooperation, beginning with policies formigrations, which can foster greater economic and social integration among countries atdifferent levels of development, with benefits for all.


Statisticaltables

29The Italian economy and the recovery of world trade
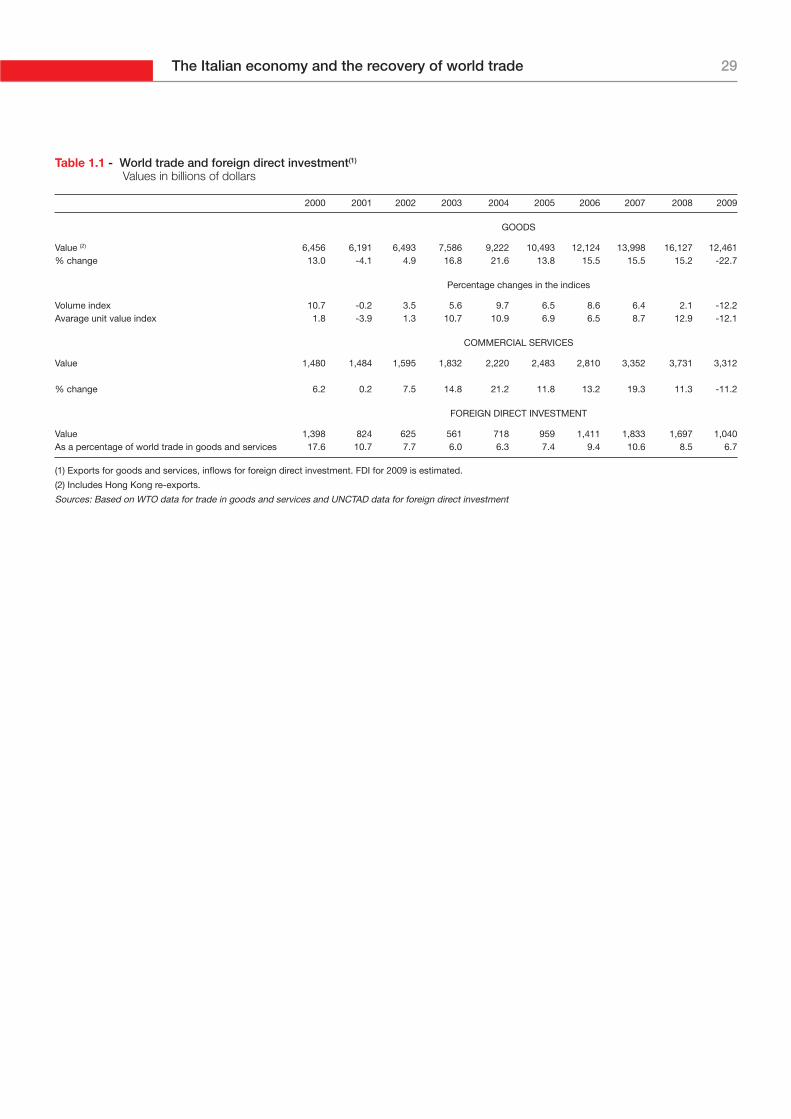
Table 1.1 - World trade and foreign direct investment(1)
Values in billions of dollars
2000 2001 2002 2003 2004 2005 2006 2007 2008 2009
GOODS
Value (2) 6,456 6,191 6,493 7,586 9,222 10,493 12,124 13,998 16,127 12,461% change 13.0 -4.1 4.9 16.8 21.6 13.8 15.5 15.5 15.2 -22.7
Percentage changes in the indices
Volume index 10.7 -0.2 3.5 5.6 9.7 6.5 8.6 6.4 2.1 -12.2Avarage unit value index 1.8 -3.9 1.3 10.7 10.9 6.9 6.5 8.7 12.9 -12.1
COMMERCIAL SERVICES
Value 1,480 1,484 1,595 1,832 2,220 2,483 2,810 3,352 3,731 3,312
% change 6.2 0.2 7.5 14.8 21.2 11.8 13.2 19.3 11.3 -11.2
FOREIGN DIRECT INVESTMENT
Value 1,398 824 625 561 718 959 1,411 1,833 1,697 1,040As a percentage of world trade in goods and services 17.6 10.7 7.7 6.0 6.3 7.4 9.4 10.6 8.5 6.7
(1) Exports for goods and services, inflows for foreign direct investment. FDI for 2009 is estimated.
(2) Includes Hong Kong re-exports.
Sources: Based on WTO data for trade in goods and services and UNCTAD data for foreign direct investment
ICE Report 2009-2010 - Summary. Italy in the World Economy30
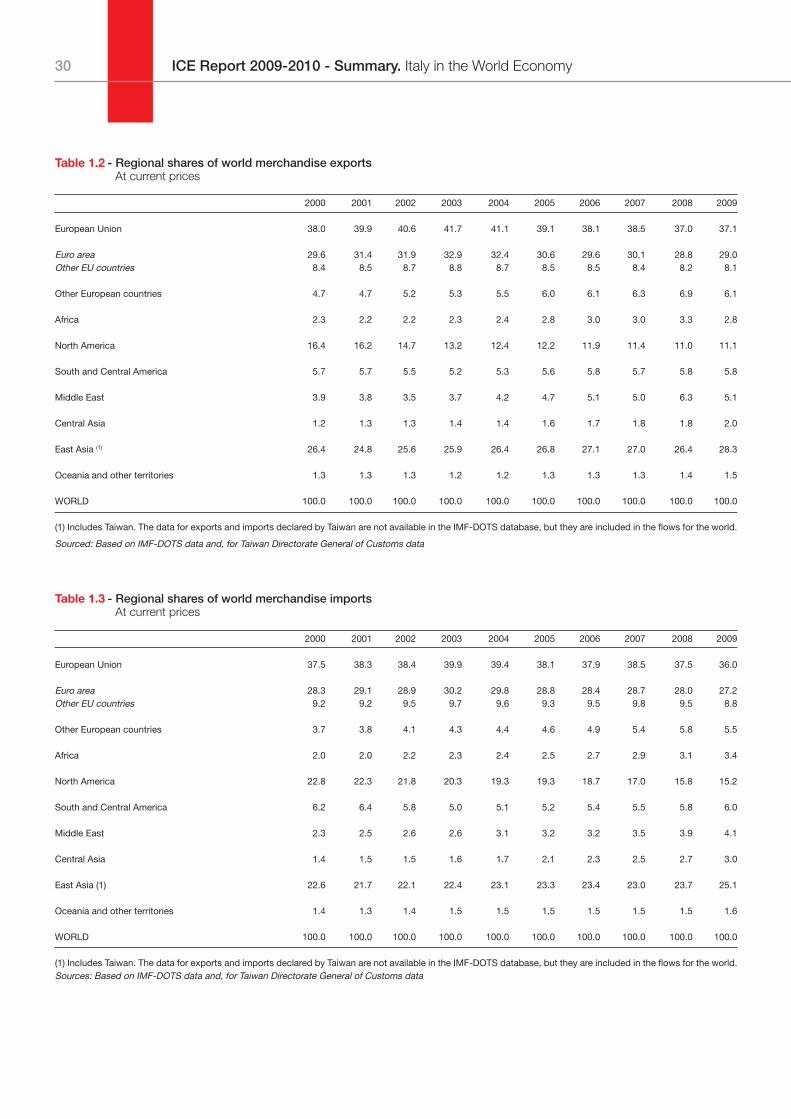
Table 1.2 - Regional shares of world merchandise exportsAt current prices
2000 2001 2002 2003 2004 2005 2006 2007 2008 2009
European Union 38.0 39.9 40.6 41.7 41.1 39.1 38.1 38.5 37.0 37.1
Euro area 29.6 31.4 31.9 32.9 32.4 30.6 29.6 30.1 28.8 29.0Other EU countries 8.4 8.5 8.7 8.8 8.7 8.5 8.5 8.4 8.2 8.1
Other European countries 4.7 4.7 5.2 5.3 5.5 6.0 6.1 6.3 6.9 6.1
Africa 2.3 2.2 2.2 2.3 2.4 2.8 3.0 3.0 3.3 2.8
North America 16.4 16.2 14.7 13.2 12.4 12.2 11.9 11.4 11.0 11.1
South and Central America 5.7 5.7 5.5 5.2 5.3 5.6 5.8 5.7 5.8 5.8
Middle East 3.9 3.8 3.5 3.7 4.2 4.7 5.1 5.0 6.3 5.1
Central Asia 1.2 1.3 1.3 1.4 1.4 1.6 1.7 1.8 1.8 2.0
East Asia (1) 26.4 24.8 25.6 25.9 26.4 26.8 27.1 27.0 26.4 28.3
Oceania and other territories 1.3 1.3 1.3 1.2 1.2 1.3 1.3 1.3 1.4 1.5
WORLD 100.0 100.0 100.0 100.0 100.0 100.0 100.0 100.0 100.0 100.0
(1) Includes Taiwan. The data for exports and imports declared by Taiwan are not available in the IMF-DOTS database, but they are included in the flows for the world.
Sourced: Based on IMF-DOTS data and, for Taiwan Directorate General of Customs data
Table 1.3 - Regional shares of world merchandise importsAt current prices
2000 2001 2002 2003 2004 2005 2006 2007 2008 2009
European Union 37.5 38.3 38.4 39.9 39.4 38.1 37.9 38.5 37.5 36.0
Euro area 28.3 29.1 28.9 30.2 29.8 28.8 28.4 28.7 28.0 27.2Other EU countries 9.2 9.2 9.5 9.7 9.6 9.3 9.5 9.8 9.5 8.8
Other European countries 3.7 3.8 4.1 4.3 4.4 4.6 4.9 5.4 5.8 5.5
Africa 2.0 2.0 2.2 2.3 2.4 2.5 2.7 2.9 3.1 3.4
North America 22.8 22.3 21.8 20.3 19.3 19.3 18.7 17.0 15.8 15.2
South and Central America 6.2 6.4 5.8 5.0 5.1 5.2 5.4 5.5 5.8 6.0
Middle East 2.3 2.5 2.6 2.6 3.1 3.2 3.2 3.5 3.9 4.1
Central Asia 1.4 1.5 1.5 1.6 1.7 2.1 2.3 2.5 2.7 3.0
East Asia (1) 22.6 21.7 22.1 22.4 23.1 23.3 23.4 23.0 23.7 25.1
Oceania and other territories 1.4 1.3 1.4 1.5 1.5 1.5 1.5 1.5 1.5 1.6
WORLD 100.0 100.0 100.0 100.0 100.0 100.0 100.0 100.0 100.0 100.0
(1) Includes Taiwan. The data for exports and imports declared by Taiwan are not available in the IMF-DOTS database, but they are included in the flows for the world.Sources: Based on IMF-DOTS data and, for Taiwan Directorate General of Customs data
31The Italian economy and the recovery of world trade
Tavola 1.4 - Top twenty world merchandise exportersBillions of dollars
RankCountry
Amount % change % shares
2009 2008 2009 2008-2009 2008 2009
1 2 China 1,202 -16.0 8.9 9.62 1 Germany 1,121 -22.5 9.0 9.03 3 United States 1,057 -17.9 8.0 8.54 4 Japan 581 -25.7 4.8 4.75 5 Netherlands 499 -21.8 4.0 4.06 6 France 475 -21.0 3.7 3.87 7 Italy 405 -24.8 3.3 3.28 8 Belgium 370 -21.6 2.9 3.09 12 South Korea 364 -13.9 2.6 2.9
10 10 United Kingdom 351 -23.7 2.9 2.811 13 Hong Kong (1) 330 -10.8 2.3 2.612 11 Canada 316 -30.9 2.8 2.513 9 Russia 304 -35.5 2.9 2.414 14 Singapore (1) 270 -20.2 2.1 2.215 16 Mexico 230 -21.1 1.8 1.816 17 Spain 218 -22.5 1.7 1.717 18 Taiwan 204 -20.3 1.6 1.618 15 Saudi Arabia (2) 189 -39.9 1.9 1.519 19 United Arab Emirates (2) 175 -26.8 1.5 1.420 20 Switzerland 173 -13.8 1.2 1.4
Total 20 countries 8,830 -21.8 70.0 70.9
World (1) 12,461 -22.7 100.0 100.0
(1) Includes substantial re-export flows.
(2) WTO Secretariat estimates.
Source: Based on WTO data
Table 1.5 - Top twenty world merchandise importersBillions of dollars
RankCountry
Amount % change % shares
2009 2008 2009 2008-2009 2008 2009
1 1 United States 1,604 -26.1 13.2 12.72 3 China 1,006 -11.2 6.9 8.03 2 Germany 931 -21.4 7.2 7.44 5 France 551 -21.7 4.3 4.45 4 Japan 551 -27.8 4.6 4.46 6 United Kingdom 480 -24.2 3.8 3.87 7 Netherlands 446 -23.3 3.5 3.58 8 Italy 410 -26.0 3.4 3.29 13 Hong Kong 353 -10.2 2.4 2.8
10 9 Belgium 351 -25.3 2.8 2.811 11 Canada 330 -21.2 2.5 2.612 10 South Korea 323 -25.8 2.6 2.613 12 Spain 290 -31.0 2.6 2.314 15 Singapore (2) 246 -23.1 1.9 1.915 17 India 244 -24.1 1.9 1.916 14 Mexico 242 -24.1 1.9 1.917 16 Russia (3) 192 -34.3 1.8 1.518 18 Taiwan 175 -27.4 1.5 1.419 21 Australia 165 -17.4 1.2 1.320 23 Switzerland 156 -15.1 1.1 1.2
Total 20 countries 9,045 -22.9 71.2 71.5
World (1) 12,647 -23.3 100.0 100.0
(1) Includes substantial flows of imports for re-export.
(2) For Singapore, defined as imports minus re-exports.
(3) Imports calculated FOB.
Source: Based on WTO data
ICE Report 2009-2010 - Summary. Italy in the World Economy32
Table 1.6 - Inward foreign direct investment: main recipient countriesAmounts in billions of dollars at current prices
RankCountry
Flows Stocks
(2008 flows)Amount Amount % composition
mean 00-06 2007 2008 2009 (1) 2007 2008 2007 2008
1 United States 154 271 316 135 2,110 2,279 13.5 15.32 France 54 158 118 65 950 991 6.1 6.63 China 57 84 108 90 (2) 327 378 2.1 2.54 United Kingdom 86 183 97 7 1,264 983 8.1 6.65 Russia 11 55 70 41 491 214 3.1 1.46 Spain 31 28 66 26 605 635 3.9 4.37 Hong Kong 32 54 63 36 1,177 836 7.5 5.68 Belgium 27 111 60 35 593 519 3.8 3.59 Australia 11 44 47 …. 342 272 2.2 1.810 Brazil 19 35 45 23 310 288 2.0 1.911 Canada 30 108 45 …. 497 412 3.2 2.812 Sweden 14 22 44 15 290 254 1.9 1.713 India 8 25 42 34 105 123 0.7 0.814 Saudi Arabia 5 24 38 …. 76 114 0.5 0.815 Germany 58 56 25 35 676 700 4.3 4.716 Japan 5 23 24 11 133 203 0.8 1.417 Singapore 16 32 23 18 303 326 1.9 2.218 Mexico 22 27 22 13 273 295 1.7 2.019 Nigeria 4 12 20 …. 63 83 0.4 0.620 Turkey 6 22 18 8 158 70 1.0 0.5… … … … … … … … … …22 Italy 19 40 17 30 365 343 2.3 2.3
WORLD 938 1,979 1,697 1,040 15,660 14,909 100.0 100.0
(1) Provisional data (data available at January 2010).
(2) Financial sector not included.
Source: Based on UNCTAD data
Table 1.7 - Outward foreign direct investment: main investor countriesAmounts in billions of dollars at current prices
RankCountry
Flows Stocks
(2008 flows)Amount Amount % composition
mean 00-06 2007 2008 2007 2008 2007 2008
1 United States 152 378 312 2,917 3,162 18.0 19.52 France 94 225 220 1,292 1,397 8.0 8.63 Germany 49 180 156 1,294 1,451 8.0 9.04 Japan 37 74 128 543 680 3.3 4.25 United Kingdom 95 275 111 1,841 1,511 11.3 9.36 Switzerland 34 50 86 658 725 4.1 4.57 Canada 35 60 78 522 520 3.2 3.28 Spain 51 96 77 591 602 3.6 3.79 Belgium 24 94 68 748 588 4.6 3.610 Hong Kong 30 61 60 1,011 776 6.2 4.811 Netherlands 61 29 58 877 844 5.4 5.212 Russia 10 46 52 370 203 2.3 1.313 China 7 22 52 96 148 0.6 0.914 Italy 23 91 44 520 517 3.2 3.215 Sweden 22 38 37 327 319 2.0 2.016 Australia 5 17 36 290 195 1.8 1.217 Denmark 7 18 29 143 193 0.9 1.218 Austria 8 33 28 156 153 1.0 0.919 Norway 10 16 28 143 171 0.9 1.120 British Virgin Islands 14 23 22 155 177 1.0 1.1
WORLD 895 2,147 1,858 16,227 16,206 100.0 100.0
Source: Based on UNCTAD data
33The Italian economy and the recovery of world trade
Table 1.8 - Shares of world trade(1) and trade balancesPercentage shares and amounts in billions of ecus/euros
2000 2001 2002 2003 2004 2005 2006 2007 2008 2009
European Union (2)
Export share (%) 17.4 18.6 19.0 19.2 18.0 17.1 16.4 16.4 15.8 16.2Import share (%) 17.9 18.0 17.7 18.3 18.0 17.8 18.0 18.3 18.2 17.2Trade balance -91.4 -42.6 8.1 -13.1 -62.5 -112.1 -172.2 -192.5 -258.5 -105.3Normalized trade balance (3) -4.6 -2.1 0.4 -0.7 -3.1 -5.0 -6.8 -7.2 -9.0 -4.6
United States
Export share (%) 15.6 15.3 13.9 12.6 12.2 11.6 11.3 11.1 10.6 11.2Import share (%) 23.6 23.0 22.7 21.3 21.4 21.0 20.2 18.8 17.2 16.5Trade balance -516.9 -502.5 -536.3 -511.2 -571.4 -668.5 -710.5 -636.4 -599.7 -392.1Normalized trade balance (3) -23.4 -23.6 -26.8 -28.5 -30.4 -31.6 -30.3 -27.5 -25.5 -20.6
Japan
Export share (%) 9.6 8.5 8.4 8.2 8.4 7.6 7.1 6.9 6.5 6.2Import share (%) 7.1 6.8 6.4 6.2 6.4 6.3 6.1 5.8 6.0 5.7Trade balance 108.0 60.7 84.1 78.6 89.3 63.6 53.9 67.2 13.3 21.6Normalized trade balance (3) 11.6 7.2 10.5 10.4 10.9 7.1 5.5 6.9 1.3 2.7
China
Export share (%) 5.0 5.6 6.6 7.6 8.9 9.8 10.7 11.8 11.8 12.8Import share (%) 4.2 4.8 5.6 6.7 7.9 8.0 8.4 8.9 9.0 10.4Trade balance 26.1 25.2 32.2 22.5 25.8 82.0 141.4 192.6 202.7 140.4Normalized trade balance (3) 5.1 4.4 4.9 3.0 2.8 7.2 10.1 12.1 11.6 8.9
World (4)
Exports 5,424 5,309 5,256 5,099 5,384 6,266 7,211 7,564 8,245 6,758Imports 5,785 5,713 5,601 5,419 5,742 6,632 7,546 7,849 8,593 6,959
(1) Excludes intra-EU trade.
(2) Refers to EU-15 up to 2003, EU-25 from 2004 to 2006 and EU-27 from 2007 on.
(3) Trade balance as a percentage of the sum of exports and imports
(4) Excludes intra-EU trade. The difference between exports is due to statistical discrepancies.
Sources: Based on WTO and Eurostat-Comext data
ICE Report 2009-2010 - Summary. Italy in the World Economy34
Table 2.1 - Italy's balance of payments Millions of euros
2003 2004 2005 2006 2007 2008 2009
Current account -17,351 -13,077 -23,647 -38,346 -37,714 -56,835 -49,361
Capital account 2,251 1,700 1,347 1,826 2,261 834 624
Financial account 17,318 9,024 20,898 25,404 26,212 49,613 17,147Direct investment 6,507 -1,970 -17,568 -2,254 -36,953 -18,305 -9,634
abroad -8,037 -15,512 -33,628 -33,532 -66,326 -29,928 -31,612in Italy 14,544 13,542 16,060 31,278 29,373 11,623 21,978
Portfolio investment 3,369 26,449 43,389 44,342 18,106 118,459 24,864abroad -51,068 -21,064 -87,036 -50,130 -656 76,662 -36,342in Italy 54,437 47,513 130,425 94,472 18,762 41,797 61,206
Other investment 13,676 -19,550 -8,055 -16,711 46,198 -51,755 -9,260Financial derivatives -4,827 1,834 2,323 -416 385 6,788 11,097Change in reserve assets -1,407 2,261 809 443 -1,524 -5,574 80Errors and omissions -2,218 2,353 1,402 11,116 9,241 6,388 31,591
Current account: balance
2003 2004 2005 2006 2007 2008 2009
Goods (FOB-FOB) 9,922 8,854 538 -10,203 3,204 -2,129 1,748
Services -2,362 1,179 -541 -1,272 -7,115 -9,639 -11,067Transport -4,972 -4,935 -5,247 -5,163 -7,050 -7,940 -6,868Foreign travel 9,386 12,150 10,452 11,968 11,169 10,168 8,841Other services -6,776 -6,036 -5,746 -8,077 -11,234 -11,867 -13,040
Income -17,811 -14,817 -13,624 -13,573 -19,586 -29,393 -26,744labor income -1,126 -213 -554 -316 -108 -355 -878investment income -16,685 -14,604 -13,070 -13,257 -19,479 -29,038 -25,866
Transfers -7,101 -8,293 -10,020 -13,298 -14,216 -15,673 -13,299private -1,554 -1,477 -1,676 -5,473 -6,811 -7,012 -7,675
workers' remittances -912 -2,478 -3,668 -4,281 -5,792 -6,188 -6,549other -642 1,001 1,992 -1,192 -1,019 -824 -1,126
public -5,547 -6,816 -8,344 -7,825 -7,405 -8,661 -5,624EU accounts -6,289 -6,537 -8,166 -8,144 -8,433 -9,905 -6,980other 742 -279 -178 319 1,028 1,244 1,356
CURRENT ACCOUNT -17,351 -13,077 -23,647 -38,346 -37,714 -56,835 -49,361
Source: Bank of Italy
35The Italian economy and the recovery of world trade
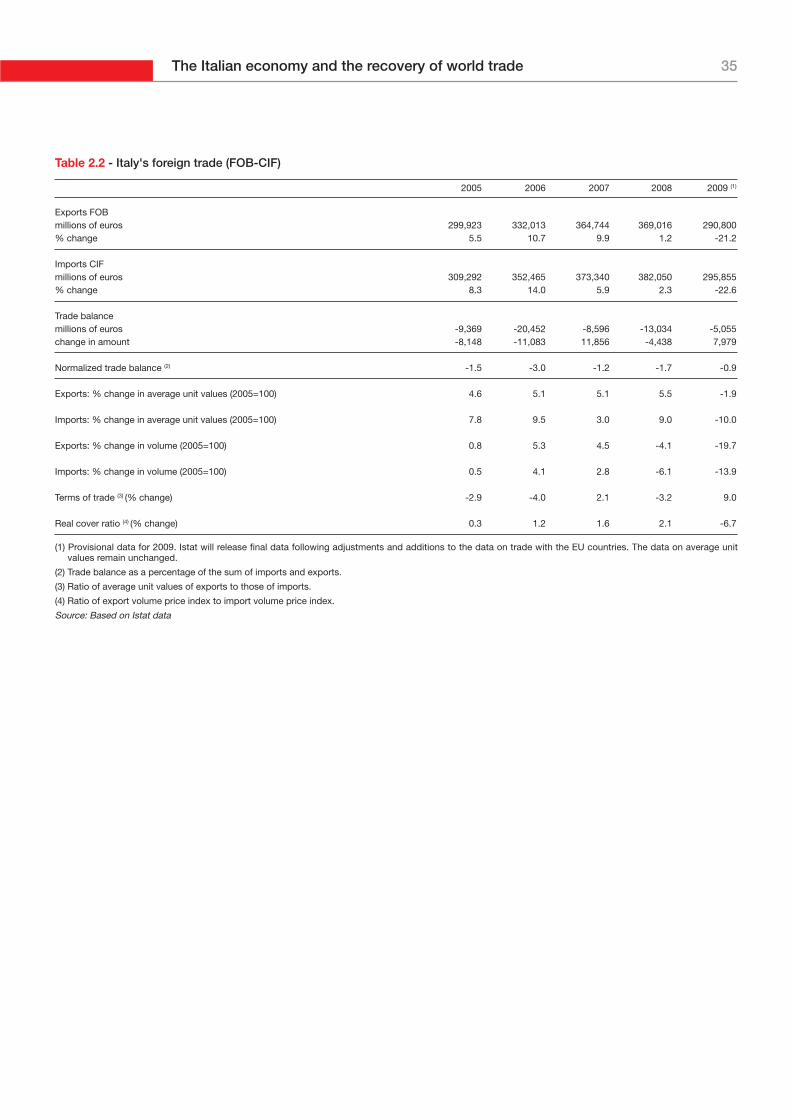
Table 2.2 - Italy's foreign trade (FOB-CIF)
2005 2006 2007 2008 2009 (1)
Exports FOBmillions of euros 299,923 332,013 364,744 369,016 290,800% change 5.5 10.7 9.9 1.2 -21.2
Imports CIFmillions of euros 309,292 352,465 373,340 382,050 295,855% change 8.3 14.0 5.9 2.3 -22.6
Trade balancemillions of euros -9,369 -20,452 -8,596 -13,034 -5,055change in amount -8,148 -11,083 11,856 -4,438 7,979
Normalized trade balance (2) -1.5 -3.0 -1.2 -1.7 -0.9
Exports: % change in average unit values (2005=100) 4.6 5.1 5.1 5.5 -1.9
Imports: % change in average unit values (2005=100) 7.8 9.5 3.0 9.0 -10.0
Exports: % change in volume (2005=100) 0.8 5.3 4.5 -4.1 -19.7
Imports: % change in volume (2005=100) 0.5 4.1 2.8 -6.1 -13.9
Terms of trade (3) (% change) -2.9 -4.0 2.1 -3.2 9.0
Real cover ratio (4) (% change) 0.3 1.2 1.6 2.1 -6.7
(1) Provisional data for 2009. Istat will release final data following adjustments and additions to the data on trade with the EU countries. The data on average unitvalues remain unchanged.
(2) Trade balance as a percentage of the sum of imports and exports.
(3) Ratio of average unit values of exports to those of imports.
(4) Ratio of export volume price index to import volume price index.
Source: Based on Istat data
ICE Report 2009-2010 - Summary. Italy in the World Economy36
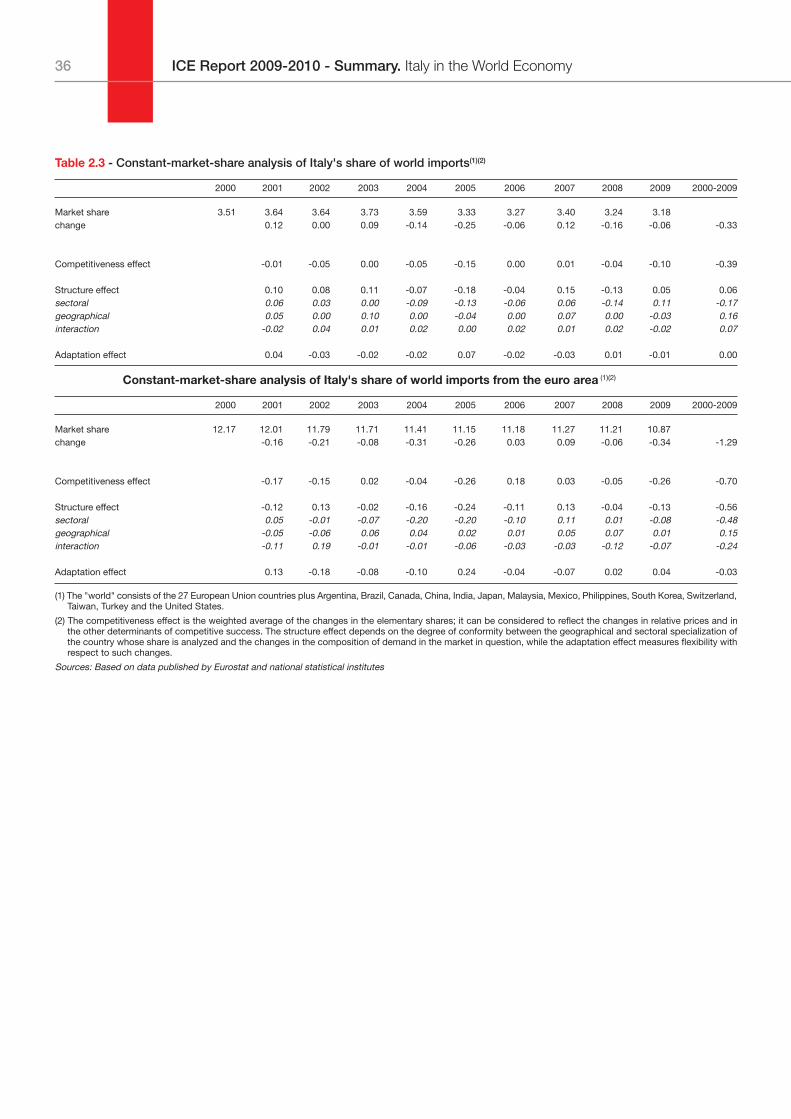
Table 2.3 - Constant-market-share analysis of Italy's share of world imports(1)(2)
2000 2001 2002 2003 2004 2005 2006 2007 2008 2009 2000-2009
Market share 3.51 3.64 3.64 3.73 3.59 3.33 3.27 3.40 3.24 3.18change 0.12 0.00 0.09 -0.14 -0.25 -0.06 0.12 -0.16 -0.06 -0.33
Competitiveness effect -0.01 -0.05 0.00 -0.05 -0.15 0.00 0.01 -0.04 -0.10 -0.39
Structure effect 0.10 0.08 0.11 -0.07 -0.18 -0.04 0.15 -0.13 0.05 0.06sectoral 0.06 0.03 0.00 -0.09 -0.13 -0.06 0.06 -0.14 0.11 -0.17geographical 0.05 0.00 0.10 0.00 -0.04 0.00 0.07 0.00 -0.03 0.16interaction -0.02 0.04 0.01 0.02 0.00 0.02 0.01 0.02 -0.02 0.07
Adaptation effect 0.04 -0.03 -0.02 -0.02 0.07 -0.02 -0.03 0.01 -0.01 0.00
Constant-market-share analysis of Italy's share of world imports from the euro area (1)(2)
2000 2001 2002 2003 2004 2005 2006 2007 2008 2009 2000-2009
Market share 12.17 12.01 11.79 11.71 11.41 11.15 11.18 11.27 11.21 10.87change -0.16 -0.21 -0.08 -0.31 -0.26 0.03 0.09 -0.06 -0.34 -1.29
Competitiveness effect -0.17 -0.15 0.02 -0.04 -0.26 0.18 0.03 -0.05 -0.26 -0.70
Structure effect -0.12 0.13 -0.02 -0.16 -0.24 -0.11 0.13 -0.04 -0.13 -0.56sectoral 0.05 -0.01 -0.07 -0.20 -0.20 -0.10 0.11 0.01 -0.08 -0.48geographical -0.05 -0.06 0.06 0.04 0.02 0.01 0.05 0.07 0.01 0.15interaction -0.11 0.19 -0.01 -0.01 -0.06 -0.03 -0.03 -0.12 -0.07 -0.24
Adaptation effect 0.13 -0.18 -0.08 -0.10 0.24 -0.04 -0.07 0.02 0.04 -0.03
(1) The "world" consists of the 27 European Union countries plus Argentina, Brazil, Canada, China, India, Japan, Malaysia, Mexico, Philippines, South Korea, Switzerland,Taiwan, Turkey and the United States.
(2) The competitiveness effect is the weighted average of the changes in the elementary shares; it can be considered to reflect the changes in relative prices and inthe other determinants of competitive success. The structure effect depends on the degree of conformity between the geographical and sectoral specialization ofthe country whose share is analyzed and the changes in the composition of demand in the market in question, while the adaptation effect measures flexibility withrespect to such changes.
Sources: Based on data published by Eurostat and national statistical institutes
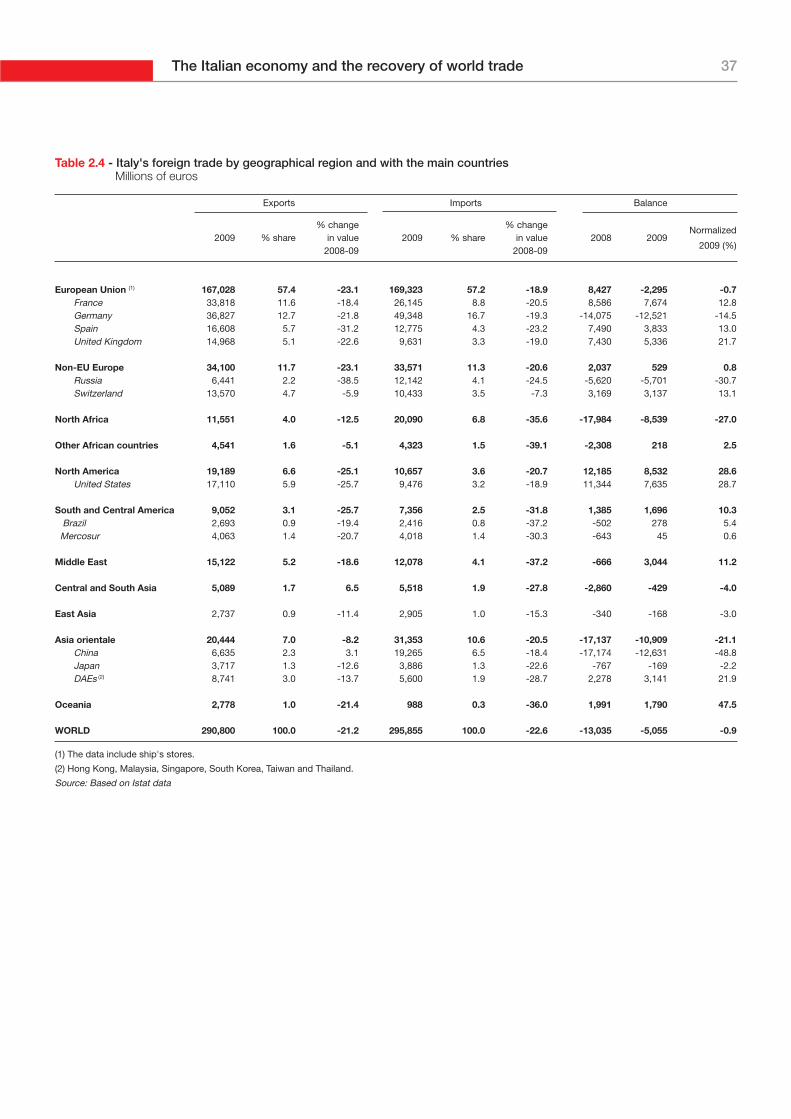
37The Italian economy and the recovery of world trade
Table 2.4 - Italy's foreign trade by geographical region and with the main countries Millions of euros
Exports Imports Balance
% change % change Normalized 2009 % share in value 2009 % share in value 2008 2009
2008-09 2008-09 2009 (%)
European Union (1) 167,028 57.4 -23.1 169,323 57.2 -18.9 8,427 -2,295 -0.7France 33,818 11.6 -18.4 26,145 8.8 -20.5 8,586 7,674 12.8Germany 36,827 12.7 -21.8 49,348 16.7 -19.3 -14,075 -12,521 -14.5Spain 16,608 5.7 -31.2 12,775 4.3 -23.2 7,490 3,833 13.0United Kingdom 14,968 5.1 -22.6 9,631 3.3 -19.0 7,430 5,336 21.7
Non-EU Europe 34,100 11.7 -23.1 33,571 11.3 -20.6 2,037 529 0.8Russia 6,441 2.2 -38.5 12,142 4.1 -24.5 -5,620 -5,701 -30.7Switzerland 13,570 4.7 -5.9 10,433 3.5 -7.3 3,169 3,137 13.1
North Africa 11,551 4.0 -12.5 20,090 6.8 -35.6 -17,984 -8,539 -27.0
Other African countries 4,541 1.6 -5.1 4,323 1.5 -39.1 -2,308 218 2.5
North America 19,189 6.6 -25.1 10,657 3.6 -20.7 12,185 8,532 28.6United States 17,110 5.9 -25.7 9,476 3.2 -18.9 11,344 7,635 28.7
South and Central America 9,052 3.1 -25.7 7,356 2.5 -31.8 1,385 1,696 10.3Brazil 2,693 0.9 -19.4 2,416 0.8 -37.2 -502 278 5.4
Mercosur 4,063 1.4 -20.7 4,018 1.4 -30.3 -643 45 0.6
Middle East 15,122 5.2 -18.6 12,078 4.1 -37.2 -666 3,044 11.2
Central and South Asia 5,089 1.7 6.5 5,518 1.9 -27.8 -2,860 -429 -4.0
East Asia 2,737 0.9 -11.4 2,905 1.0 -15.3 -340 -168 -3.0
Asia orientale 20,444 7.0 -8.2 31,353 10.6 -20.5 -17,137 -10,909 -21.1China 6,635 2.3 3.1 19,265 6.5 -18.4 -17,174 -12,631 -48.8Japan 3,717 1.3 -12.6 3,886 1.3 -22.6 -767 -169 -2.2DAEs (2) 8,741 3.0 -13.7 5,600 1.9 -28.7 2,278 3,141 21.9
Oceania 2,778 1.0 -21.4 988 0.3 -36.0 1,991 1,790 47.5
WORLD 290,800 100.0 -21.2 295,855 100.0 -22.6 -13,035 -5,055 -0.9
(1) The data include ship's stores.
(2) Hong Kong, Malaysia, Singapore, South Korea, Taiwan and Thailand.
Source: Based on Istat data
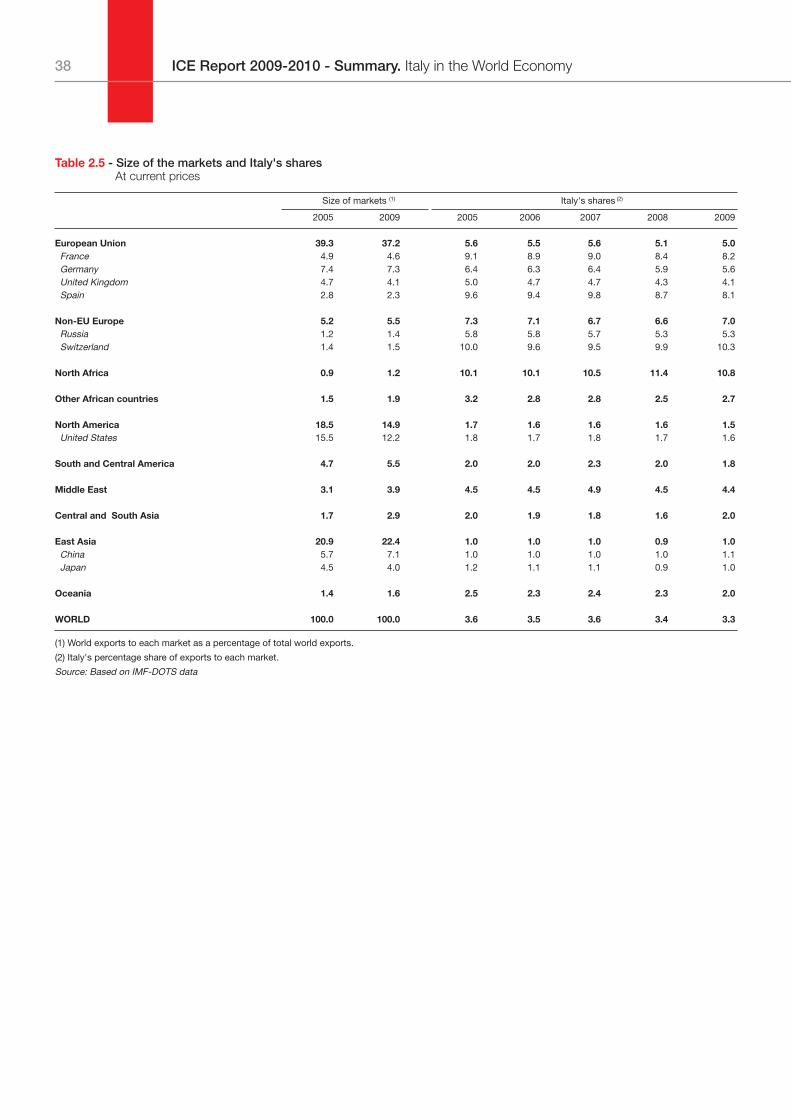
ICE Report 2009-2010 - Summary. Italy in the World Economy38
Table 2.5 - Size of the markets and Italy's sharesAt current prices
Size of markets (1) Italy's shares (2)
2005 2009 2005 2006 2007 2008 2009
European Union 39.3 37.2 5.6 5.5 5.6 5.1 5.0France 4.9 4.6 9.1 8.9 9.0 8.4 8.2Germany 7.4 7.3 6.4 6.3 6.4 5.9 5.6United Kingdom 4.7 4.1 5.0 4.7 4.7 4.3 4.1Spain 2.8 2.3 9.6 9.4 9.8 8.7 8.1
Non-EU Europe 5.2 5.5 7.3 7.1 6.7 6.6 7.0Russia 1.2 1.4 5.8 5.8 5.7 5.3 5.3Switzerland 1.4 1.5 10.0 9.6 9.5 9.9 10.3
North Africa 0.9 1.2 10.1 10.1 10.5 11.4 10.8
Other African countries 1.5 1.9 3.2 2.8 2.8 2.5 2.7
North America 18.5 14.9 1.7 1.6 1.6 1.6 1.5United States 15.5 12.2 1.8 1.7 1.8 1.7 1.6
South and Central America 4.7 5.5 2.0 2.0 2.3 2.0 1.8
Middle East 3.1 3.9 4.5 4.5 4.9 4.5 4.4
Central and South Asia 1.7 2.9 2.0 1.9 1.8 1.6 2.0
East Asia 20.9 22.4 1.0 1.0 1.0 0.9 1.0China 5.7 7.1 1.0 1.0 1.0 1.0 1.1Japan 4.5 4.0 1.2 1.1 1.1 0.9 1.0
Oceania 1.4 1.6 2.5 2.3 2.4 2.3 2.0
WORLD 100.0 100.0 3.6 3.5 3.6 3.4 3.3
(1) World exports to each market as a percentage of total world exports.
(2) Italy's percentage share of exports to each market.
Source: Based on IMF-DOTS data
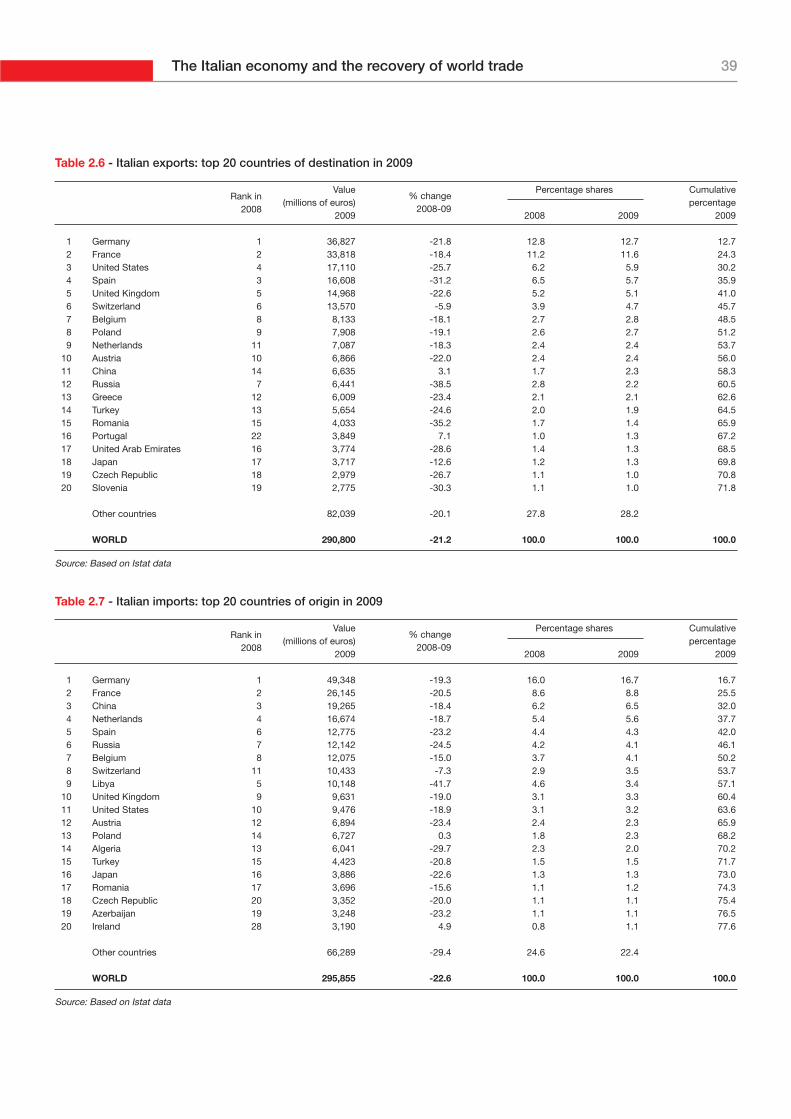
39The Italian economy and the recovery of world trade
Table 2.6 - Italian exports: top 20 countries of destination in 2009
Rank inValue Percentage shares Cumulative
2008(millions of euros)
% changepercentage
20092008-09
2008 2009 2009
1 Germany 1 36,827 -21.8 12.8 12.7 12.72 France 2 33,818 -18.4 11.2 11.6 24.33 United States 4 17,110 -25.7 6.2 5.9 30.24 Spain 3 16,608 -31.2 6.5 5.7 35.95 United Kingdom 5 14,968 -22.6 5.2 5.1 41.06 Switzerland 6 13,570 -5.9 3.9 4.7 45.77 Belgium 8 8,133 -18.1 2.7 2.8 48.58 Poland 9 7,908 -19.1 2.6 2.7 51.29 Netherlands 11 7,087 -18.3 2.4 2.4 53.7
10 Austria 10 6,866 -22.0 2.4 2.4 56.011 China 14 6,635 3.1 1.7 2.3 58.312 Russia 7 6,441 -38.5 2.8 2.2 60.513 Greece 12 6,009 -23.4 2.1 2.1 62.614 Turkey 13 5,654 -24.6 2.0 1.9 64.515 Romania 15 4,033 -35.2 1.7 1.4 65.916 Portugal 22 3,849 7.1 1.0 1.3 67.217 United Arab Emirates 16 3,774 -28.6 1.4 1.3 68.518 Japan 17 3,717 -12.6 1.2 1.3 69.819 Czech Republic 18 2,979 -26.7 1.1 1.0 70.820 Slovenia 19 2,775 -30.3 1.1 1.0 71.8
Other countries 82,039 -20.1 27.8 28.2
WORLD 290,800 -21.2 100.0 100.0 100.0
Source: Based on Istat data
Table 2.7 - Italian imports: top 20 countries of origin in 2009
Rank inValue Percentage shares Cumulative
2008(millions of euros)
% changepercentage
20092008-09
2008 2009 2009
1 Germany 1 49,348 -19.3 16.0 16.7 16.72 France 2 26,145 -20.5 8.6 8.8 25.53 China 3 19,265 -18.4 6.2 6.5 32.04 Netherlands 4 16,674 -18.7 5.4 5.6 37.75 Spain 6 12,775 -23.2 4.4 4.3 42.06 Russia 7 12,142 -24.5 4.2 4.1 46.17 Belgium 8 12,075 -15.0 3.7 4.1 50.28 Switzerland 11 10,433 -7.3 2.9 3.5 53.79 Libya 5 10,148 -41.7 4.6 3.4 57.1
10 United Kingdom 9 9,631 -19.0 3.1 3.3 60.411 United States 10 9,476 -18.9 3.1 3.2 63.612 Austria 12 6,894 -23.4 2.4 2.3 65.913 Poland 14 6,727 0.3 1.8 2.3 68.214 Algeria 13 6,041 -29.7 2.3 2.0 70.215 Turkey 15 4,423 -20.8 1.5 1.5 71.716 Japan 16 3,886 -22.6 1.3 1.3 73.017 Romania 17 3,696 -15.6 1.1 1.2 74.318 Czech Republic 20 3,352 -20.0 1.1 1.1 75.419 Azerbaijan 19 3,248 -23.2 1.1 1.1 76.520 Ireland 28 3,190 4.9 0.8 1.1 77.6
Other countries 66,289 -29.4 24.6 22.4
WORLD 295,855 -22.6 100.0 100.0 100.0
Source: Based on Istat data
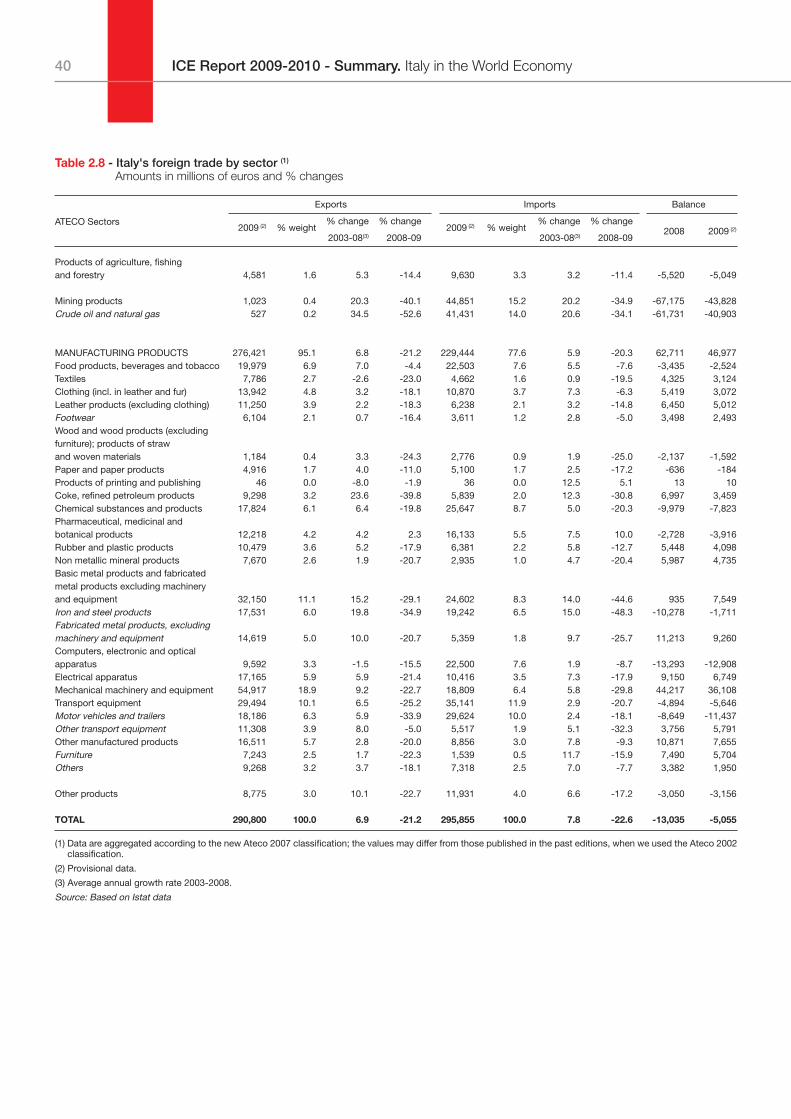
ICE Report 2009-2010 - Summary. Italy in the World Economy40
Table 2.8 - Italy's foreign trade by sector (1)
Amounts in millions of euros and % changes
ATECO Sectors
Exports Imports Balance
2009 (2) % weight% change % change
2009 (2) % weight% change % change
2003-08(3) 2008-09 2003-08(3) 2008-092008 2009 (2)
Products of agriculture, fishing and forestry 4,581 1.6 5.3 -14.4 9,630 3.3 3.2 -11.4 -5,520 -5,049
Mining products 1,023 0.4 20.3 -40.1 44,851 15.2 20.2 -34.9 -67,175 -43,828Crude oil and natural gas 527 0.2 34.5 -52.6 41,431 14.0 20.6 -34.1 -61,731 -40,903
MANUFACTURING PRODUCTS 276,421 95.1 6.8 -21.2 229,444 77.6 5.9 -20.3 62,711 46,977Food products, beverages and tobacco 19,979 6.9 7.0 -4.4 22,503 7.6 5.5 -7.6 -3,435 -2,524Textiles 7,786 2.7 -2.6 -23.0 4,662 1.6 0.9 -19.5 4,325 3,124Clothing (incl. in leather and fur) 13,942 4.8 3.2 -18.1 10,870 3.7 7.3 -6.3 5,419 3,072Leather products (excluding clothing) 11,250 3.9 2.2 -18.3 6,238 2.1 3.2 -14.8 6,450 5,012Footwear 6,104 2.1 0.7 -16.4 3,611 1.2 2.8 -5.0 3,498 2,493Wood and wood products (excluding furniture); products of straw and woven materials 1,184 0.4 3.3 -24.3 2,776 0.9 1.9 -25.0 -2,137 -1,592Paper and paper products 4,916 1.7 4.0 -11.0 5,100 1.7 2.5 -17.2 -636 -184Products of printing and publishing 46 0.0 -8.0 -1.9 36 0.0 12.5 5.1 13 10Coke, refined petroleum products 9,298 3.2 23.6 -39.8 5,839 2.0 12.3 -30.8 6,997 3,459Chemical substances and products 17,824 6.1 6.4 -19.8 25,647 8.7 5.0 -20.3 -9,979 -7,823Pharmaceutical, medicinal and botanical products 12,218 4.2 4.2 2.3 16,133 5.5 7.5 10.0 -2,728 -3,916Rubber and plastic products 10,479 3.6 5.2 -17.9 6,381 2.2 5.8 -12.7 5,448 4,098Non metallic mineral products 7,670 2.6 1.9 -20.7 2,935 1.0 4.7 -20.4 5,987 4,735Basic metal products and fabricated metal products excluding machinery and equipment 32,150 11.1 15.2 -29.1 24,602 8.3 14.0 -44.6 935 7,549Iron and steel products 17,531 6.0 19.8 -34.9 19,242 6.5 15.0 -48.3 -10,278 -1,711Fabricated metal products, excluding machinery and equipment 14,619 5.0 10.0 -20.7 5,359 1.8 9.7 -25.7 11,213 9,260Computers, electronic and optical apparatus 9,592 3.3 -1.5 -15.5 22,500 7.6 1.9 -8.7 -13,293 -12,908Electrical apparatus 17,165 5.9 5.9 -21.4 10,416 3.5 7.3 -17.9 9,150 6,749Mechanical machinery and equipment 54,917 18.9 9.2 -22.7 18,809 6.4 5.8 -29.8 44,217 36,108Transport equipment 29,494 10.1 6.5 -25.2 35,141 11.9 2.9 -20.7 -4,894 -5,646Motor vehicles and trailers 18,186 6.3 5.9 -33.9 29,624 10.0 2.4 -18.1 -8,649 -11,437Other transport equipment 11,308 3.9 8.0 -5.0 5,517 1.9 5.1 -32.3 3,756 5,791Other manufactured products 16,511 5.7 2.8 -20.0 8,856 3.0 7.8 -9.3 10,871 7,655Furniture 7,243 2.5 1.7 -22.3 1,539 0.5 11.7 -15.9 7,490 5,704Others 9,268 3.2 3.7 -18.1 7,318 2.5 7.0 -7.7 3,382 1,950
Other products 8,775 3.0 10.1 -22.7 11,931 4.0 6.6 -17.2 -3,050 -3,156
TOTAL 290,800 100.0 6.9 -21.2 295,855 100.0 7.8 -22.6 -13,035 -5,055
(1) Data are aggregated according to the new Ateco 2007 classification; the values may differ from those published in the past editions, when we used the Ateco 2002classification.
(2) Provisional data.
(3) Average annual growth rate 2003-2008.
Source: Based on Istat data
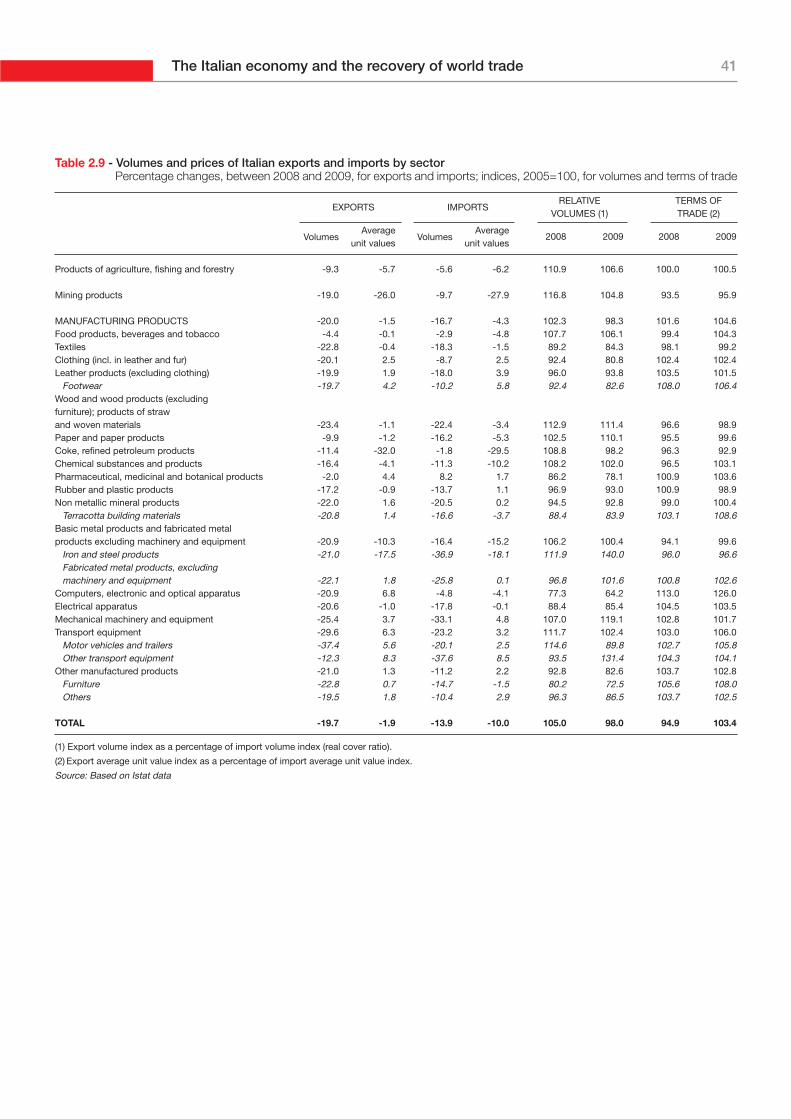
41The Italian economy and the recovery of world trade
Table 2.9 - Volumes and prices of Italian exports and imports by sectorPercentage changes, between 2008 and 2009, for exports and imports; indices, 2005=100, for volumes and terms of trade
EXPORTS IMPORTSRELATIVE TERMS OF
VOLUMES (1) TRADE (2)
VolumesAverage
VolumesAverage
unit values unit values2008 2009 2008 2009
Products of agriculture, fishing and forestry -9.3 -5.7 -5.6 -6.2 110.9 106.6 100.0 100.5
Mining products -19.0 -26.0 -9.7 -27.9 116.8 104.8 93.5 95.9
MANUFACTURING PRODUCTS -20.0 -1.5 -16.7 -4.3 102.3 98.3 101.6 104.6Food products, beverages and tobacco -4.4 -0.1 -2.9 -4.8 107.7 106.1 99.4 104.3Textiles -22.8 -0.4 -18.3 -1.5 89.2 84.3 98.1 99.2Clothing (incl. in leather and fur) -20.1 2.5 -8.7 2.5 92.4 80.8 102.4 102.4Leather products (excluding clothing) -19.9 1.9 -18.0 3.9 96.0 93.8 103.5 101.5
Footwear -19.7 4.2 -10.2 5.8 92.4 82.6 108.0 106.4Wood and wood products (excluding furniture); products of straw and woven materials -23.4 -1.1 -22.4 -3.4 112.9 111.4 96.6 98.9Paper and paper products -9.9 -1.2 -16.2 -5.3 102.5 110.1 95.5 99.6Coke, refined petroleum products -11.4 -32.0 -1.8 -29.5 108.8 98.2 96.3 92.9Chemical substances and products -16.4 -4.1 -11.3 -10.2 108.2 102.0 96.5 103.1Pharmaceutical, medicinal and botanical products -2.0 4.4 8.2 1.7 86.2 78.1 100.9 103.6Rubber and plastic products -17.2 -0.9 -13.7 1.1 96.9 93.0 100.9 98.9Non metallic mineral products -22.0 1.6 -20.5 0.2 94.5 92.8 99.0 100.4
Terracotta building materials -20.8 1.4 -16.6 -3.7 88.4 83.9 103.1 108.6Basic metal products and fabricated metal products excluding machinery and equipment -20.9 -10.3 -16.4 -15.2 106.2 100.4 94.1 99.6
Iron and steel products -21.0 -17.5 -36.9 -18.1 111.9 140.0 96.0 96.6Fabricated metal products, excluding machinery and equipment -22.1 1.8 -25.8 0.1 96.8 101.6 100.8 102.6
Computers, electronic and optical apparatus -20.9 6.8 -4.8 -4.1 77.3 64.2 113.0 126.0Electrical apparatus -20.6 -1.0 -17.8 -0.1 88.4 85.4 104.5 103.5Mechanical machinery and equipment -25.4 3.7 -33.1 4.8 107.0 119.1 102.8 101.7Transport equipment -29.6 6.3 -23.2 3.2 111.7 102.4 103.0 106.0
Motor vehicles and trailers -37.4 5.6 -20.1 2.5 114.6 89.8 102.7 105.8Other transport equipment -12.3 8.3 -37.6 8.5 93.5 131.4 104.3 104.1
Other manufactured products -21.0 1.3 -11.2 2.2 92.8 82.6 103.7 102.8Furniture -22.8 0.7 -14.7 -1.5 80.2 72.5 105.6 108.0Others -19.5 1.8 -10.4 2.9 96.3 86.5 103.7 102.5
TOTAL -19.7 -1.9 -13.9 -10.0 105.0 98.0 94.9 103.4
(1) Export volume index as a percentage of import volume index (real cover ratio).
(2) Export average unit value index as a percentage of import average unit value index.
Source: Based on Istat data
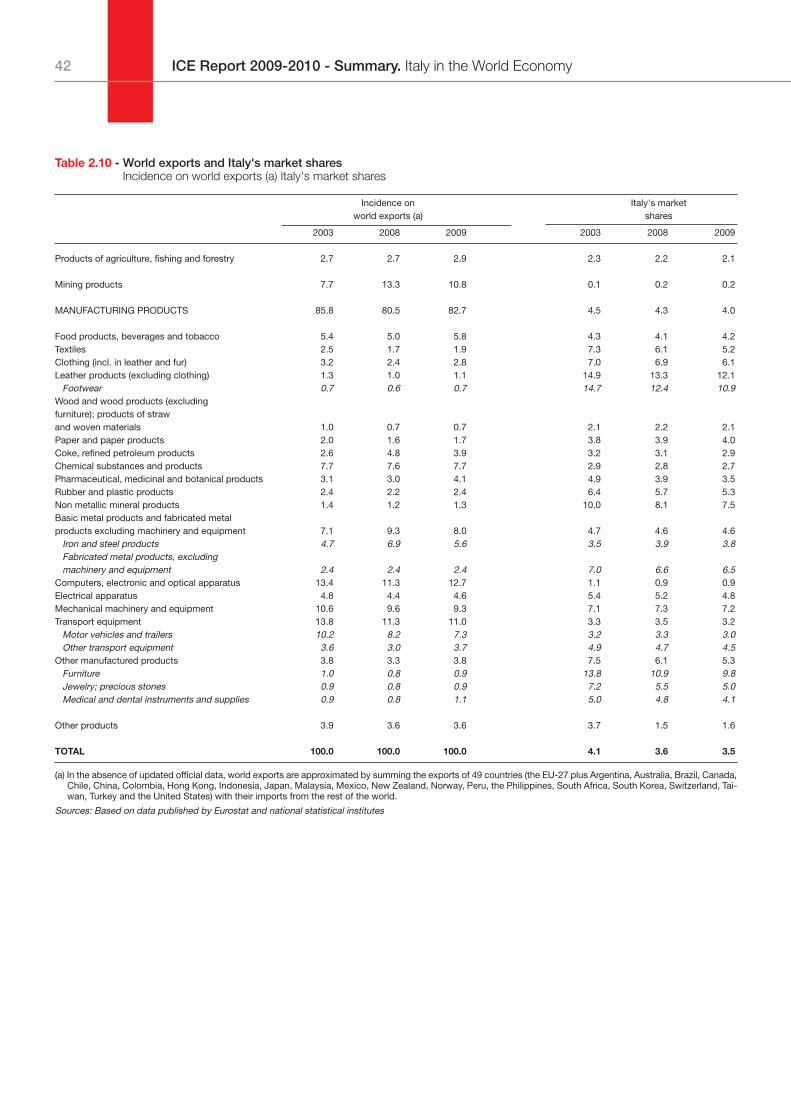
ICE Report 2009-2010 - Summary. Italy in the World Economy42
Table 2.10 - World exports and Italy's market sharesIncidence on world exports (a) Italy's market shares
Incidence on Italy's market world exports (a) shares
2003 2008 2009 2003 2008 2009
Products of agriculture, fishing and forestry 2.7 2.7 2.9 2.3 2.2 2.1
Mining products 7.7 13.3 10.8 0.1 0.2 0.2
MANUFACTURING PRODUCTS 85.8 80.5 82.7 4.5 4.3 4.0
Food products, beverages and tobacco 5.4 5.0 5.8 4.3 4.1 4.2Textiles 2.5 1.7 1.9 7.3 6.1 5.2Clothing (incl. in leather and fur) 3.2 2.4 2.8 7.0 6.9 6.1Leather products (excluding clothing) 1.3 1.0 1.1 14.9 13.3 12.1
Footwear 0.7 0.6 0.7 14.7 12.4 10.9Wood and wood products (excluding furniture); products of straw and woven materials 1.0 0.7 0.7 2.1 2.2 2.1Paper and paper products 2.0 1.6 1.7 3.8 3.9 4.0Coke, refined petroleum products 2.6 4.8 3.9 3.2 3.1 2.9Chemical substances and products 7.7 7.6 7.7 2.9 2.8 2.7Pharmaceutical, medicinal and botanical products 3.1 3.0 4.1 4.9 3.9 3.5Rubber and plastic products 2.4 2.2 2.4 6.4 5.7 5.3Non metallic mineral products 1.4 1.2 1.3 10.0 8.1 7.5Basic metal products and fabricated metal products excluding machinery and equipment 7.1 9.3 8.0 4.7 4.6 4.6
Iron and steel products 4.7 6.9 5.6 3.5 3.9 3.8Fabricated metal products, excluding machinery and equipment 2.4 2.4 2.4 7.0 6.6 6.5
Computers, electronic and optical apparatus 13.4 11.3 12.7 1.1 0.9 0.9Electrical apparatus 4.8 4.4 4.6 5.4 5.2 4.8Mechanical machinery and equipment 10.6 9.6 9.3 7.1 7.3 7.2Transport equipment 13.8 11.3 11.0 3.3 3.5 3.2
Motor vehicles and trailers 10.2 8.2 7.3 3.2 3.3 3.0Other transport equipment 3.6 3.0 3.7 4.9 4.7 4.5
Other manufactured products 3.8 3.3 3.8 7.5 6.1 5.3Furniture 1.0 0.8 0.9 13.8 10.9 9.8Jewelry; precious stones 0.9 0.8 0.9 7.2 5.5 5.0Medical and dental instruments and supplies 0.9 0.8 1.1 5.0 4.8 4.1
Other products 3.9 3.6 3.6 3.7 1.5 1.6
TOTAL 100.0 100.0 100.0 4.1 3.6 3.5
(a) In the absence of updated official data, world exports are approximated by summing the exports of 49 countries (the EU-27 plus Argentina, Australia, Brazil, Canada,Chile, China, Colombia, Hong Kong, Indonesia, Japan, Malaysia, Mexico, New Zealand, Norway, Peru, the Philippines, South Africa, South Korea, Switzerland, Tai-wan, Turkey and the United States) with their imports from the rest of the world.
Sources: Based on data published by Eurostat and national statistical institutes
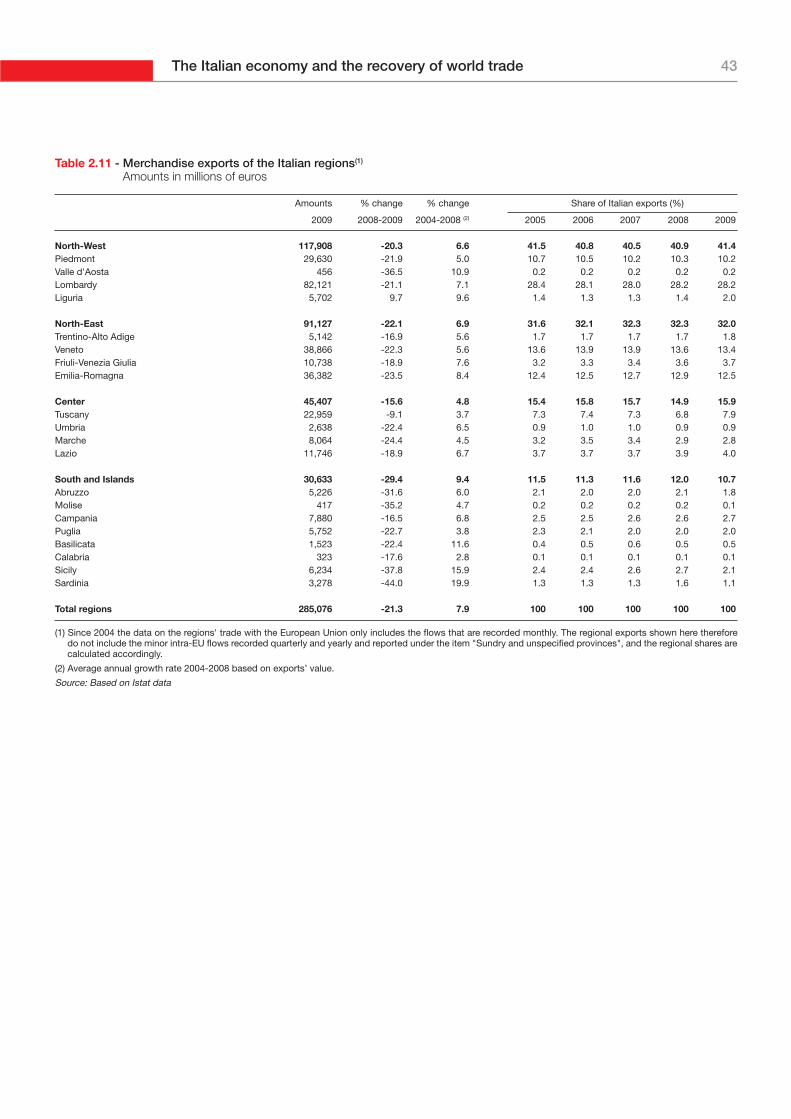
43The Italian economy and the recovery of world trade
Table 2.11 - Merchandise exports of the Italian regions(1)
Amounts in millions of euros
Amounts % change % change Share of Italian exports (%)
2009 2008-2009 2004-2008 (2) 2005 2006 2007 2008 2009
North-West 117,908 -20.3 6.6 41.5 40.8 40.5 40.9 41.4Piedmont 29,630 -21.9 5.0 10.7 10.5 10.2 10.3 10.2Valle d'Aosta 456 -36.5 10.9 0.2 0.2 0.2 0.2 0.2Lombardy 82,121 -21.1 7.1 28.4 28.1 28.0 28.2 28.2Liguria 5,702 9.7 9.6 1.4 1.3 1.3 1.4 2.0
North-East 91,127 -22.1 6.9 31.6 32.1 32.3 32.3 32.0Trentino-Alto Adige 5,142 -16.9 5.6 1.7 1.7 1.7 1.7 1.8Veneto 38,866 -22.3 5.6 13.6 13.9 13.9 13.6 13.4Friuli-Venezia Giulia 10,738 -18.9 7.6 3.2 3.3 3.4 3.6 3.7Emilia-Romagna 36,382 -23.5 8.4 12.4 12.5 12.7 12.9 12.5
Center 45,407 -15.6 4.8 15.4 15.8 15.7 14.9 15.9Tuscany 22,959 -9.1 3.7 7.3 7.4 7.3 6.8 7.9Umbria 2,638 -22.4 6.5 0.9 1.0 1.0 0.9 0.9Marche 8,064 -24.4 4.5 3.2 3.5 3.4 2.9 2.8Lazio 11,746 -18.9 6.7 3.7 3.7 3.7 3.9 4.0
South and Islands 30,633 -29.4 9.4 11.5 11.3 11.6 12.0 10.7Abruzzo 5,226 -31.6 6.0 2.1 2.0 2.0 2.1 1.8Molise 417 -35.2 4.7 0.2 0.2 0.2 0.2 0.1Campania 7,880 -16.5 6.8 2.5 2.5 2.6 2.6 2.7Puglia 5,752 -22.7 3.8 2.3 2.1 2.0 2.0 2.0Basilicata 1,523 -22.4 11.6 0.4 0.5 0.6 0.5 0.5Calabria 323 -17.6 2.8 0.1 0.1 0.1 0.1 0.1Sicily 6,234 -37.8 15.9 2.4 2.4 2.6 2.7 2.1Sardinia 3,278 -44.0 19.9 1.3 1.3 1.3 1.6 1.1
Total regions 285,076 -21.3 7.9 100 100 100 100 100
(1) Since 2004 the data on the regions' trade with the European Union only includes the flows that are recorded monthly. The regional exports shown here thereforedo not include the minor intra-EU flows recorded quarterly and yearly and reported under the item "Sundry and unspecified provinces", and the regional shares arecalculated accordingly.
(2) Average annual growth rate 2004-2008 based on exports’ value.
Source: Based on Istat data
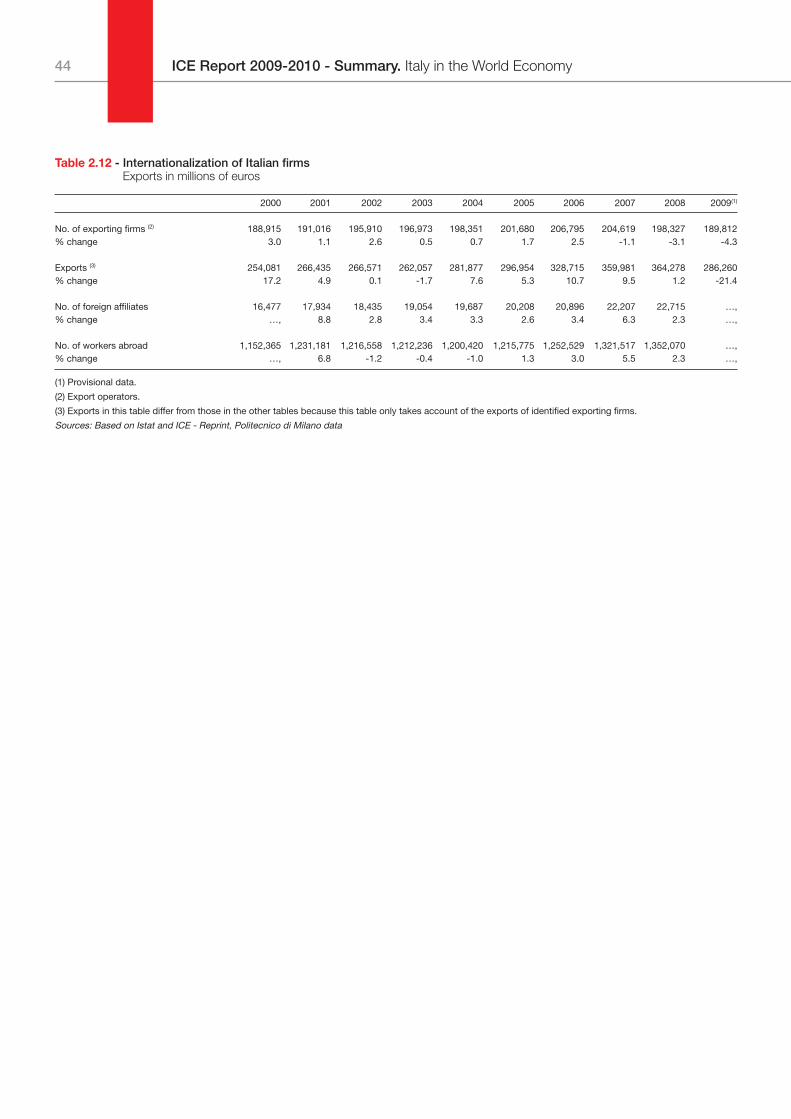
Table 2.12 - Internationalization of Italian firmsExports in millions of euros
2000 2001 2002 2003 2004 2005 2006 2007 2008 2009(1)
No. of exporting firms (2) 188,915 191,016 195,910 196,973 198,351 201,680 206,795 204,619 198,327 189,812% change 3.0 1.1 2.6 0.5 0.7 1.7 2.5 -1.1 -3.1 -4.3
Exports (3) 254,081 266,435 266,571 262,057 281,877 296,954 328,715 359,981 364,278 286,260% change 17.2 4.9 0.1 -1.7 7.6 5.3 10.7 9.5 1.2 -21.4
No. of foreign affiliates 16,477 17,934 18,435 19,054 19,687 20,208 20,896 22,207 22,715 …,% change …, 8.8 2.8 3.4 3.3 2.6 3.4 6.3 2.3 …,
No. of workers abroad 1,152,365 1,231,181 1,216,558 1,212,236 1,200,420 1,215,775 1,252,529 1,321,517 1,352,070 …,% change …, 6.8 -1.2 -0.4 -1.0 1.3 3.0 5.5 2.3 …,
(1) Provisional data.
(2) Export operators.
(3) Exports in this table differ from those in the other tables because this table only takes account of the exports of identified exporting firms.
Sources: Based on Istat and ICE - Reprint, Politecnico di Milano data
44 ICE Report 2009-2010 - Summary. Italy in the World Economy
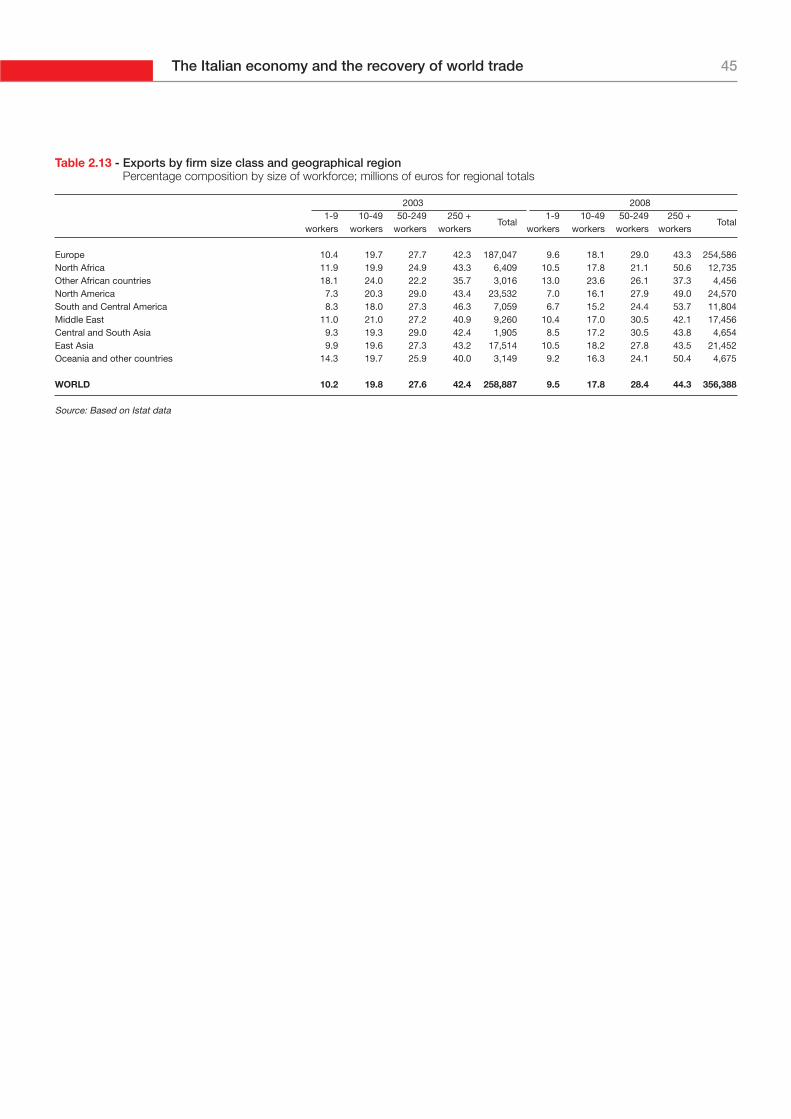
45The Italian economy and the recovery of world trade
Table 2.13 - Exports by firm size class and geographical regionPercentage composition by size of workforce; millions of euros for regional totals
2003 20081-9 10-49 50-249 250 + 1-9 10-49 50-249 250 +
workers workers workers workersTotal
workers workers workers workersTotal
Europe 10.4 19.7 27.7 42.3 187,047 9.6 18.1 29.0 43.3 254,586North Africa 11.9 19.9 24.9 43.3 6,409 10.5 17.8 21.1 50.6 12,735Other African countries 18.1 24.0 22.2 35.7 3,016 13.0 23.6 26.1 37.3 4,456North America 7.3 20.3 29.0 43.4 23,532 7.0 16.1 27.9 49.0 24,570South and Central America 8.3 18.0 27.3 46.3 7,059 6.7 15.2 24.4 53.7 11,804Middle East 11.0 21.0 27.2 40.9 9,260 10.4 17.0 30.5 42.1 17,456Central and South Asia 9.3 19.3 29.0 42.4 1,905 8.5 17.2 30.5 43.8 4,654East Asia 9.9 19.6 27.3 43.2 17,514 10.5 18.2 27.8 43.5 21,452Oceania and other countries 14.3 19.7 25.9 40.0 3,149 9.2 16.3 24.1 50.4 4,675
WORLD 10.2 19.8 27.6 42.4 258,887 9.5 17.8 28.4 44.3 356,388
Source: Based on Istat data
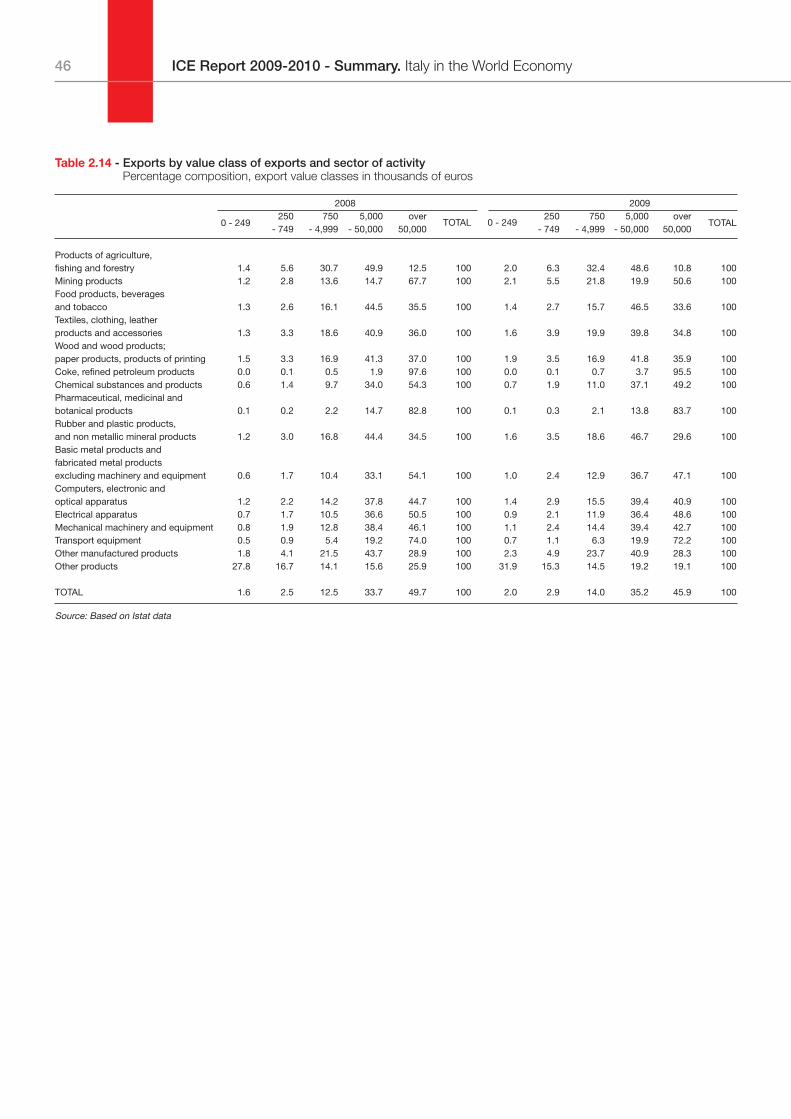
ICE Report 2009-2010 - Summary. Italy in the World Economy46
Table 2.14 - Exports by value class of exports and sector of activityPercentage composition, export value classes in thousands of euros
2008 2009
0 - 249250 750 5,000 over 250 750 5,000 over
TOTAL- 749 - 4,999 - 50,000 50,000
TOTAL 0 - 249- 749 - 4,999 - 50,000 50,000
Products of agriculture, fishing and forestry 1.4 5.6 30.7 49.9 12.5 100 2.0 6.3 32.4 48.6 10.8 100 Mining products 1.2 2.8 13.6 14.7 67.7 100 2.1 5.5 21.8 19.9 50.6 100 Food products, beverages and tobacco 1.3 2.6 16.1 44.5 35.5 100 1.4 2.7 15.7 46.5 33.6 100 Textiles, clothing, leather products and accessories 1.3 3.3 18.6 40.9 36.0 100 1.6 3.9 19.9 39.8 34.8 100 Wood and wood products;paper products, products of printing 1.5 3.3 16.9 41.3 37.0 100 1.9 3.5 16.9 41.8 35.9 100 Coke, refined petroleum products 0.0 0.1 0.5 1.9 97.6 100 0.0 0.1 0.7 3.7 95.5 100 Chemical substances and products 0.6 1.4 9.7 34.0 54.3 100 0.7 1.9 11.0 37.1 49.2 100 Pharmaceutical, medicinal and botanical products 0.1 0.2 2.2 14.7 82.8 100 0.1 0.3 2.1 13.8 83.7 100 Rubber and plastic products, and non metallic mineral products 1.2 3.0 16.8 44.4 34.5 100 1.6 3.5 18.6 46.7 29.6 100 Basic metal products and fabricated metal products excluding machinery and equipment 0.6 1.7 10.4 33.1 54.1 100 1.0 2.4 12.9 36.7 47.1 100 Computers, electronic and optical apparatus 1.2 2.2 14.2 37.8 44.7 100 1.4 2.9 15.5 39.4 40.9 100 Electrical apparatus 0.7 1.7 10.5 36.6 50.5 100 0.9 2.1 11.9 36.4 48.6 100 Mechanical machinery and equipment 0.8 1.9 12.8 38.4 46.1 100 1.1 2.4 14.4 39.4 42.7 100 Transport equipment 0.5 0.9 5.4 19.2 74.0 100 0.7 1.1 6.3 19.9 72.2 100 Other manufactured products 1.8 4.1 21.5 43.7 28.9 100 2.3 4.9 23.7 40.9 28.3 100 Other products 27.8 16.7 14.1 15.6 25.9 100 31.9 15.3 14.5 19.2 19.1 100
TOTAL 1.6 2.5 12.5 33.7 49.7 100 2.0 2.9 14.0 35.2 45.9 100
Source: Based on Istat data


Printed in September 2010Tipolitografia C.S.R. - Via di Pietralata, 157 - 00158 Rome
Tel. 064182113 r.a. - Fax 064506671

Italy in theWorld EconomyICE Report 2009-2010 - Summary
Italian National Statistical SystemItalian Institute for Foreign Trade