It Takes a Village - IHIapp.ihi.org/FacultyDocuments/Events/Event-2491/Presentation-11215/...It...
35
11/25/2014 1 It Takes a Village: Lessons Learned Along the Journey Towards Reducing 30‐day Readmissions 1 These presenters have nothing to disclose Session: C29 December 9, 2014 Learning Objectives 2 • Understand the importance of a systematic, performance improvement approach in developing targeted solutions to reduce readmissions • Learn from the lessons learned by a large, Academic Medical Center in its pursuit of reducing 30‐day readmissions • Understand the power of partnering with independent healthcare delivery organizations to reduce readmissions • Understand the approach by which the relationships with these community partners were developed and fostered over time • Learn about the power and limitations of predictive analytics in its ability to support clinicians target readmissions reductions strategies
Transcript of It Takes a Village - IHIapp.ihi.org/FacultyDocuments/Events/Event-2491/Presentation-11215/...It...
11/25/2014
1
It Takes a Village:Lessons Learned Along the Journey Towards
Reducing 30‐day Readmissions
1
These presenters have nothing to disclose
Session: C29
December 9, 2014
Learning Objectives
2
• Understand the importance of a systematic, performance improvement approach in developing targeted solutions to reduce readmissions
• Learn from the lessons learned by a large, Academic Medical Center in its pursuit of reducing 30‐day readmissions
• Understand the power of partnering with independent healthcare delivery organizations to reduce readmissions
• Understand the approach by which the relationships with these community partners were developed and fostered over time
• Learn about the power and limitations of predictive analytics in its ability to support clinicians target readmissions reductions strategies

11/25/2014
2
Outline
3
Topic Presenter Approx. Duration
Approach to Target Readmissions
Reductions Omkar Kulkarni, MPH Manager, Performance Improvement
10 minutes
Learning from Failures 10 minutes
Partnering with Home Health Agencies
Neil Romanoff, MDAssociate Chief Medical Officer
20 minutes
The Enhanced Care Program: SNF Collaborative Neema Haria, MHSA
Lead PI Consultant, Population Health
10 minutes
Predictive Analytics 10 minutes
Setting the Stage
4
11/25/2014
3
Cedars‐Sinai Health System
5
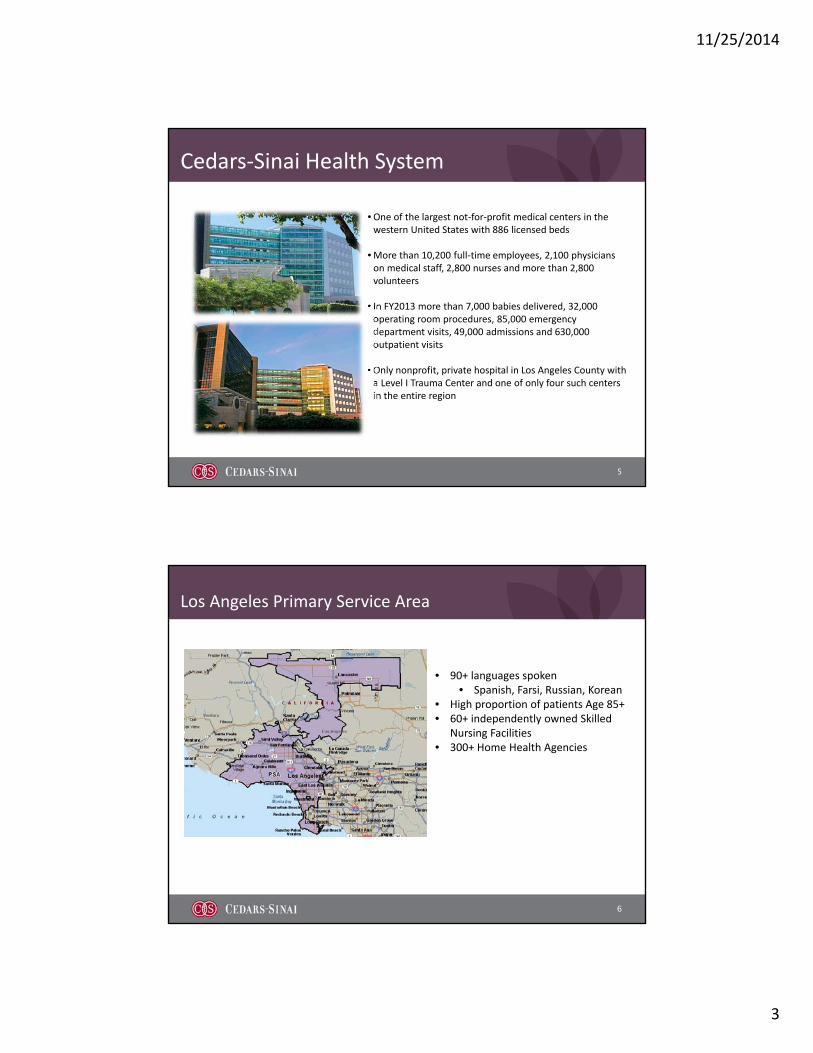
•One of the largest not‐for‐profit medical centers in the western United States with 886 licensed beds
•More than 10,200 full‐time employees, 2,100 physicians on medical staff, 2,800 nurses and more than 2,800 volunteers
• In FY2013 more than 7,000 babies delivered, 32,000 operating room procedures, 85,000 emergency department visits, 49,000 admissions and 630,000 outpatient visits
•Only nonprofit, private hospital in Los Angeles County with a Level I Trauma Center and one of only four such centers in the entire region
Los Angeles Primary Service Area
6
• 90+ languages spoken• Spanish, Farsi, Russian, Korean
• High proportion of patients Age 85+• 60+ independently owned Skilled
Nursing Facilities• 300+ Home Health Agencies
11/25/2014
4
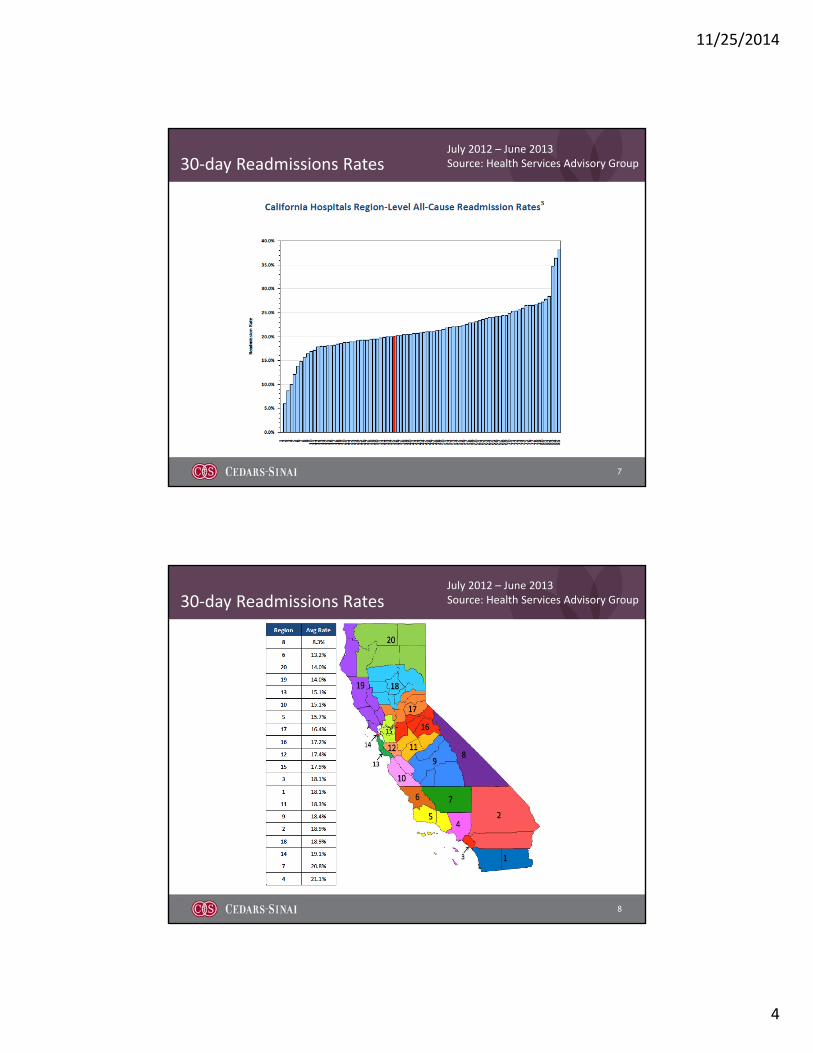
30‐day Readmissions Rates
7
July 2012 – June 2013Source: Health Services Advisory Group
30‐day Readmissions Rates
8
July 2012 – June 2013Source: Health Services Advisory Group
11/25/2014
5
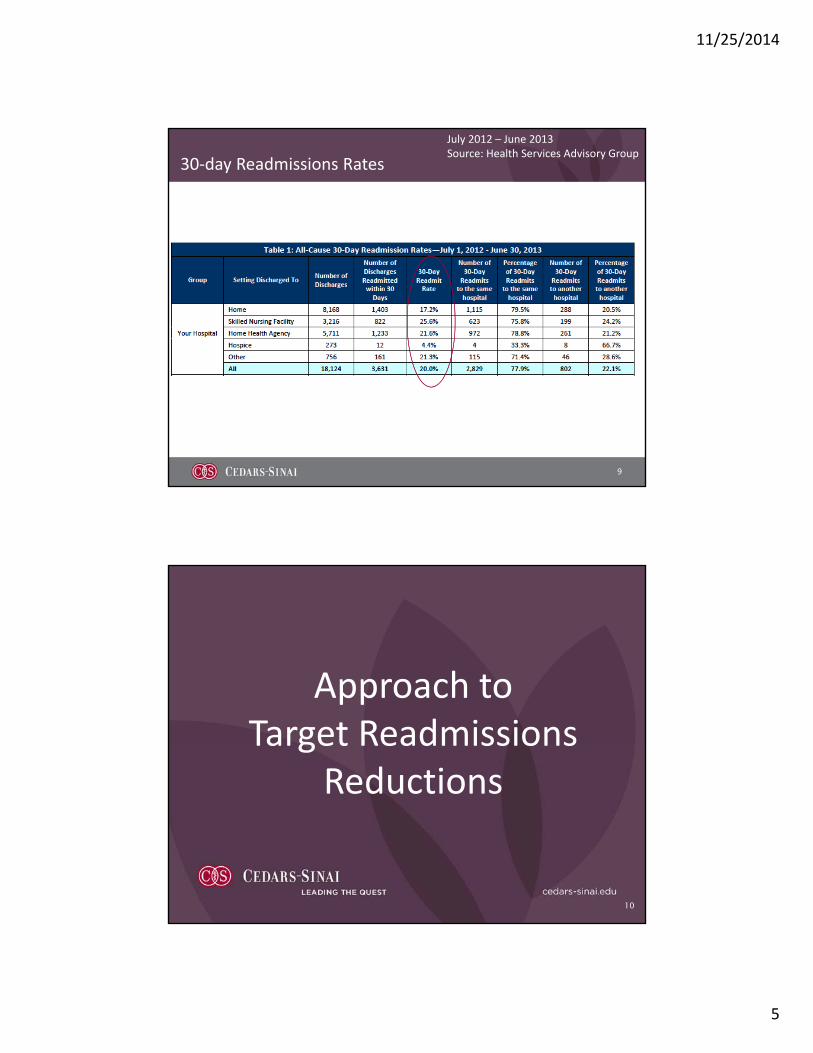
30‐day Readmissions Rates
9
July 2012 – June 2013Source: Health Services Advisory Group
Approach to Target Readmissions
Reductions
10

11/25/2014
6
CSHS Approach to Reducing Readmissions
11
CSHS Approach to Reducing Readmissions
12
Setting the Table
• Understand & empathize with our customers• Empathy Interviews
• Validate the data measurement system• Readmissions vs. Acute Care Encounters (ACEs)
• Study analogous situations, industries to learn other perspectives• Car mechanics, restaurants
• Develop a project charter with key stakeholders• Define the problem• Setting S.M.A.R.T. goals• Agreeing upon the Scope

11/25/2014
7
CSHS Approach to Reducing Readmissions
13
Collect and Analyze Data
• Conduct questionnaires, surveys to understand the current state
• Review patient records to determine modifiable root causes for readmissions
• Identify root causes that closely link with high % of readmissions
• Conduct a Pareto assessment to focus on high yield targets that will help achieve goals
CSHS Approach to Reducing Readmissions
14
Design Creative, Targeted Solutions
• With a focus on the high yield ‘root causes’, generate ideas from customers, stakeholders and thought leaders (suppliers, vendors).
• First test ideas in small, controlled patient populations.
• Expand tests that suggest potential opportunity, ensuring a significant sample size.
• Validate effective strategies using proportion testing (p‐tests)

11/25/2014
8
CSHS Approach to Reducing Readmissions
15
Implement and Sustain Gains
• Identify process owners to lead the deployment and long‐term sustainment of successful interventions
• Use historic data to build control limits that serve as thresholds to help process owners manage and prevent drift.
CSHS Approach to Reducing Readmissions
16
What We Try to Avoid
• Implementing strategies simply because other hospitals have implemented them.
• Testing strategies without data to support that there is a problem that requires fixing.
• Avoid testing strategies that can not be measured
• Implementing strategies for which there is no designated process owner.

11/25/2014
9
Learning from Failures
17
Paramedic Transitions Coach
18
The Intervention• A paramedic, trained as a Coleman Transitions Coach, helped transition
hospitalized HF patients from the hospital to the home, when he was off‐duty . • He visited the patients at home, called them every week and would contact
their doctor when problems arose.
The ResultsAfter helping transition 46 patients, the 30‐day readmission rate was nearly 40%, higher than the historical 24% baseline rate.
Why it Failed• We never engaged Primary Care physicians in the process• The protocols that were laid out were loosely followed• The paramedic was not dedicated fully to this project.

11/25/2014
10
Post‐Discharge Clinic
19
The Intervention• Hospitalized Heart Failure patients were asked to return to the hospital campus,
48 hours after discharge, for a 90 minute, coordinated outpatient clinic visit with a pharmacist, nurse and dietitian to review self‐care instructions, medications and follow‐up appointments.
The ResultsThe first five patients who had agreed to attend the clinic, were all no‐shows. Attempts to reschedule the appointment also failed.
Why it Failed• We did not talk to the patients when designing this intervention
• Patients later told us they didn’t want to have drive all the way back to the hospital, just 48 hours after discharge.
Telephone Hotline
20
The Intervention• Hospitalized patients were given a phone number and were instructed to call
the phone number whenever they had any questions about their self‐care instructions or medications.
The ResultsTo date, there have been zero phone calls to the hotline.
Why it Failed• We didn’t talk to the patients when designing this intervention
• Patients later told us that they would feel more comfortable calling their doctor with questions, rather than a nurse from the hospital.

11/25/2014
11
Post‐Discharge Phone Calls
21
The Intervention• 48‐72 hours after discharge, a floor nurse called a discharged HF patient,
verifying that the patient could teach‐back information about their self‐care instructions (diet, exercise, fluid overload, weight mgt., appointments, medications). When questions would arise, the nurse asked the patient to call their doctor.
The ResultsAfter calling and speaking with 375 HF patients, the readmission rate remained unchanged.
Why it Failed• We asked the patient to call their doctor when there was a question, instead of
answering it immediately. • Patients answering the phone were likely not the ones at highest risk for
readmission.
Partnering with Home Health Agencies
22

11/25/2014
12
.
Baseline Data (January 2012 to December 2012)
23
Where we started: Enhanced Home Health Pilot
24
Four high volume Home Health agencies tested the ‘Enhanced Home Health’
bundle during a 6‐week period in February & March 2012.
A total of 396 patients were enrolled.
Home Health Agency
BASELINE% 30‐day ReadmissionsFeb 2011‐ Jan 2012
TEST OF CHANGE% 30‐day ReadmissionsFeb 15‐Mar 31 2012
# enrolled in TOCFeb 15‐Mar 31 2012
Agency 1 12.7% 10.3% 121
Agency 2 12.1% 7.8% 103
Agency 3 14.7% 11.8% 110
Agency 4 17.3% 6.4% 62
35%Reduction
11/25/2014
13
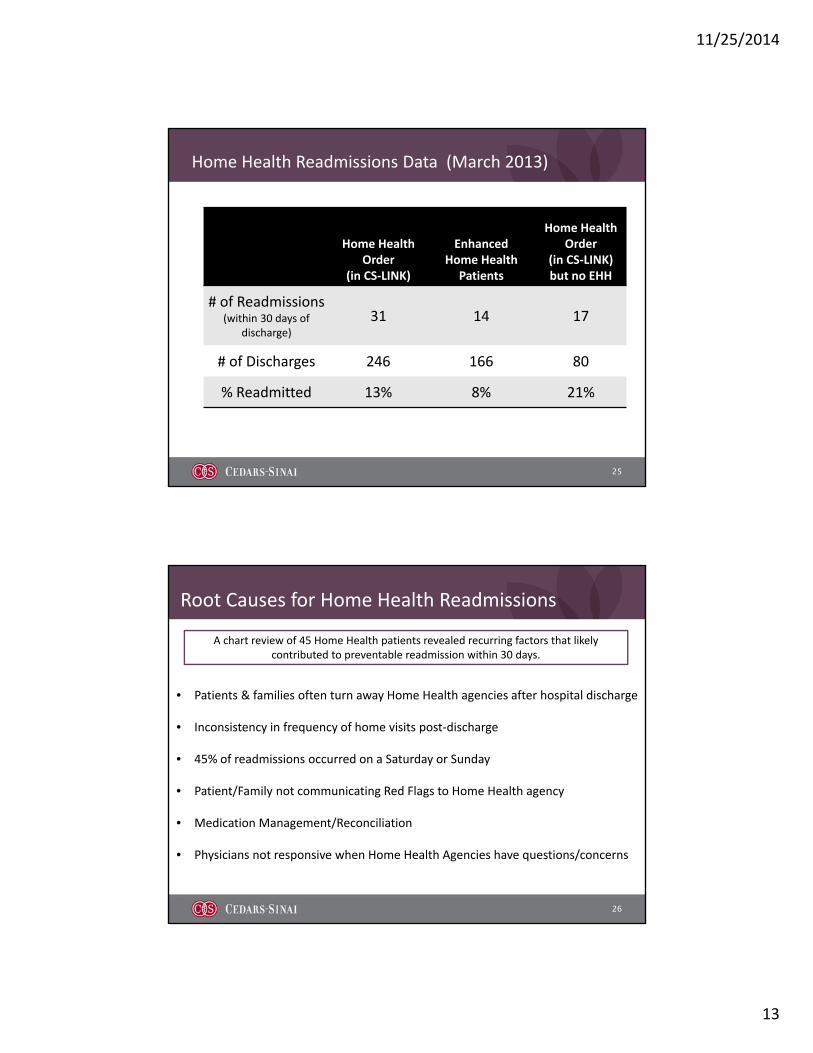
25
Home Health Readmissions Data (March 2013)
Home Health Order
(in CS‐LINK)
Enhanced Home Health
Patients
Home Health Order
(in CS‐LINK) but no EHH
# of Readmissions (within 30 days of
discharge)
31 14 17
# of Discharges 246 166 80
% Readmitted 13% 8% 21%
Root Causes for Home Health Readmissions
26
• Patients & families often turn away Home Health agencies after hospital discharge
• Inconsistency in frequency of home visits post‐discharge
• 45% of readmissions occurred on a Saturday or Sunday
• Patient/Family not communicating Red Flags to Home Health agency
• Medication Management/Reconciliation
• Physicians not responsive when Home Health Agencies have questions/concerns
A chart review of 45 Home Health patients revealed recurring factors that likely contributed to preventable readmission within 30 days.
11/25/2014
14
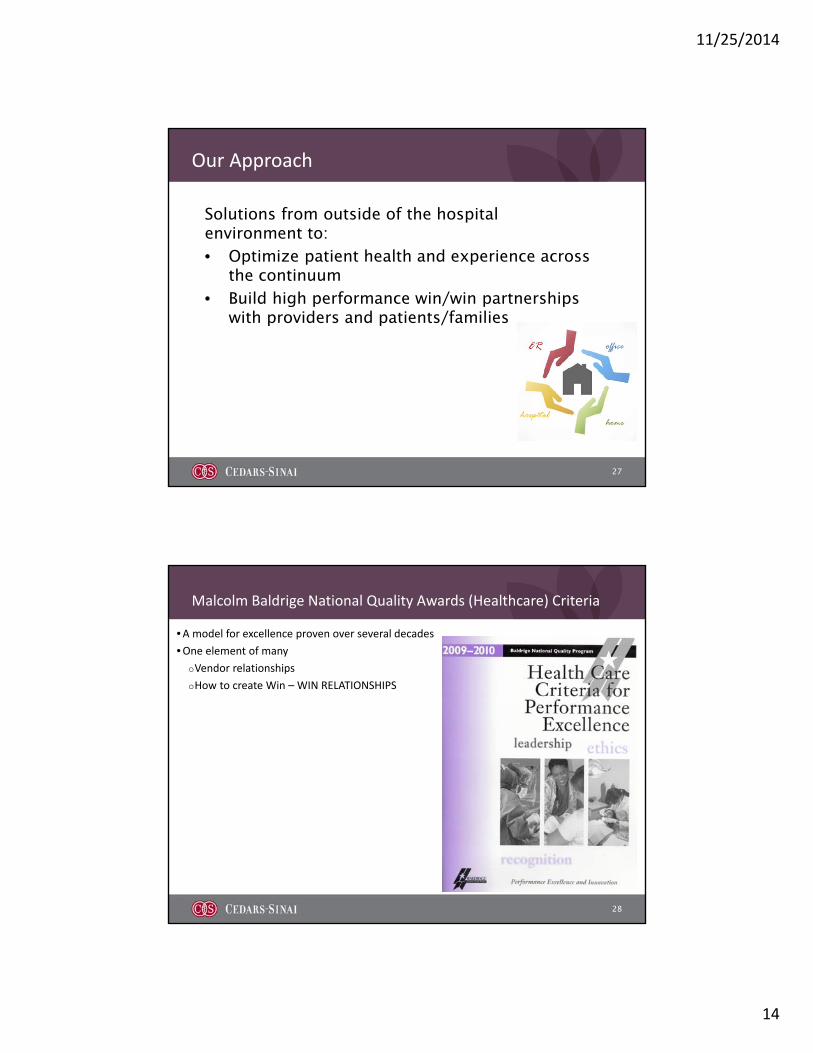
Solutions from outside of the hospital environment to:• Optimize patient health and experience across
the continuum• Build high performance win/win partnerships
with providers and patients/families
Our Approach
27
28
Malcolm Baldrige National Quality Awards (Healthcare) Criteria
•A model for excellence proven over several decades
•One element of many
Vendor relationships
How to create Win – WIN RELATIONSHIPS

11/25/2014
15
• To improve coordination, quality & safety of care and reduce readmissions
• Define mutual expectations and accountabilities for prospective HHA partners and CSHS
Objectives & Deliverables
29
Components of EHH 2.0
30

11/25/2014
16
Enhanced Home Health Protocol Touch points to occur within the first two weeks of discharge
24 – 48 Hours prior to discharge
Day after discharge
1st weekend patient is at home
Pre-Discharge Hospital Visit
with Home Health Liaison
Home visit• Med rec• Safety check• Assessment &
education• Identify other
disciplines that may be needed
Home visit (2-3 in first week)
• Med compliance• Vitals
assessment• Schedule next
home visit
Tuck-in Phone call
• Identify red flags• Schedule next
home visit• MD Follow up
appointment?
2nd weekend that patient is at home
1st Friday patient is at home
Home visit• Med compliance• Vitals• Well-being
assessment
Monday-Thursday Minimum of 1 home
visit
Home visit• Med compliance• Vitals• Well-being assessment
Tuck-in Phone call
• Address questions• Schedule next home
visit
Week 1
Week 2-4
2nd Friday patient is at home
Tuck-in Phone call
• Address questions• Schedule next home
visit
Weekly 15-30 days post discharge
Intro Phone Call
• Identify red flags
• Address questions/anxiety
Evening of Discharge
31
32
Proposed Pre-discharge visit: Home Health Liaison
Home Health Liaison complete the following on site, prior to discharge:
• Patient contact information
• Caregiver contact information
• MRN and ACCT ID Number
Verify the following in CS‐Link
• EHH fact sheet to set expectations
• Review when to call 911
Review Cedars‐Branded Patient Education Materials with patient and family
• Preferred language
• Preferred time of day
• Presence of a caregiver (if applicable)
Identify patient preferences
• Speak with Attending Physician and identify the MD who will be following the patient in the post‐discharge setting
• Call identified MD and ensure they are on board with post‐discharge plan
Identify post‐discharge MD follow‐up
• Data CollectionTool
• CS‐Link (long‐term)
Documentation and Data Collection

11/25/2014
17
33
24/7 On-Call Clinical Support
How might hospitals, home health agencies and doctors work together to ensure the availability
of 24/7 support to patients to prevent unnecessary visits to the Emergency Department?
Agency Selection Process
34

11/25/2014
18
35
Interview Criteria
•Clinical Quality
•Service
•Technology
•Willingness to Partner
36

11/25/2014
19
Status Update
37
• 5 Home Health Agencies identified on March 1, 2014.
• Since March, nearly 1500 patients have been enrolled into Enhanced Home Health
• Represents 50‐65% of all Home Health referrals
• 17% reduction in re‐hospitalizations (either inpatient or observation)• Statistically significant (p < 0.05) reduction
• Variation in re‐hospitalization rate between agencies
• Patients who receive the entire intervention (all 7 touch‐points) had a readmission rate 40% lower than the historical baseline.
A Deeper Dive into the Data
38
11/25/2014
20
39
40
Next Steps

11/25/2014
21
Keys to Success
41
Reframing the Relationship to Build a Partnership
42

11/25/2014
22
Customer Service
43
EMR Access & Data Sharing
44

11/25/2014
23
45
Using Core Values of Baldrige Health Care Criteria to Build Partnerships
Visionary LeadershipVisionary Leadership
Organizational and Personal LearningOrganizational and Personal Learning
Focus on the Future
Focus on the Future
Value Workforce Membership and
Partners
Value Workforce Membership and
Partners
Managing for innovation
Managing for innovation
Management by Fact
Management by Fact
Focus on Results and Creating ValueFocus on Results and Creating Value
AgilityAgilitySocietal
Responsibility and Community Health
Societal Responsibility and Community Health
System PerspectiveSystem
PerspectivePatient‐Focused
ExcellencePatient‐Focused
Excellence
THE ENHANCED CARE PROGRAM (ECP):
A Cedars-Sinai and Skilled Nursing Facilities Collaborative

11/25/2014
24
ECP Background—why the focus on SNFs?
47
• These patients are high‐risk.
• Approximately 30% of Medicare discharges from acute care
hospitals are sent to a skilled nursing facility (SNF).
• CMS is penalizing hospitals based on 30‐day readmission rates.
• Cedars‐Sinai is working on improving care transitions and
reducing 30‐day readmissions.
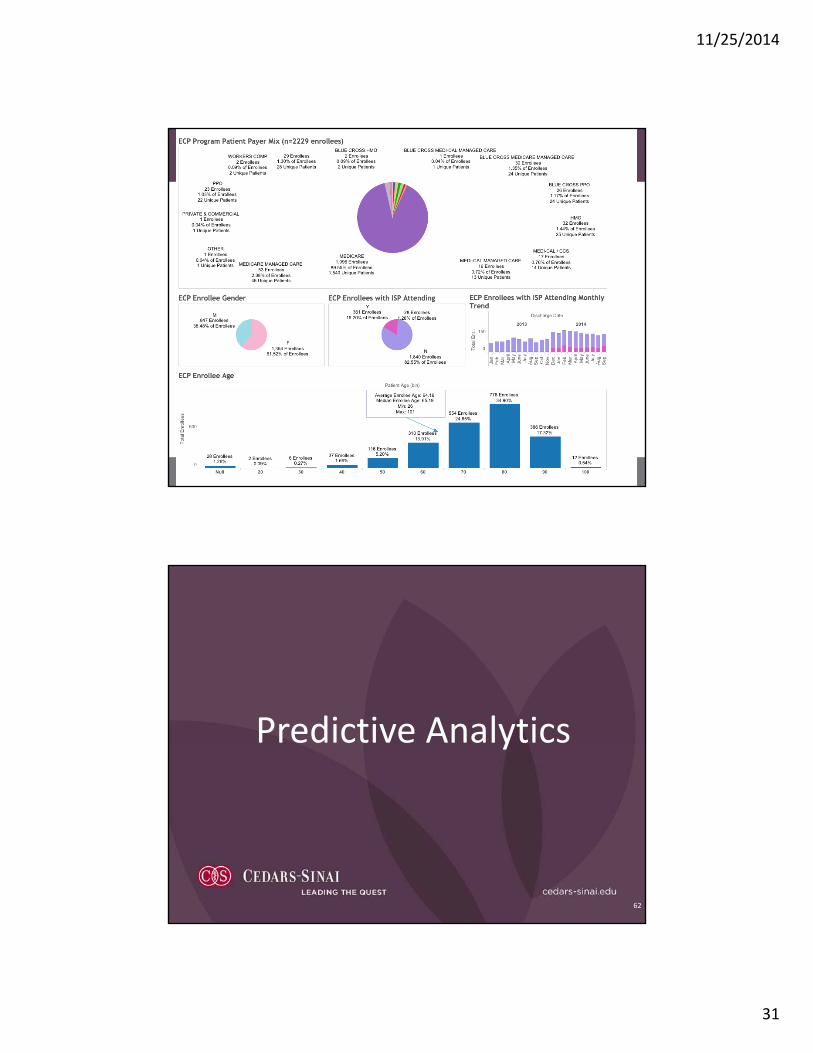
ECP Overview
48
Readmissions Oversight Committee initiative
Launched in 2012
Nurse Practitioner‐driven program
Enrollment of over 1,600 Cedars discharges thus far
Collaborative effort with 7 SNFs and over 110 private MDs in the community

11/25/2014
25
Deploying NPs to SNFs– A 2011 test of changewith Private physicians
49
• Based on success with working with a NP to round on SNF
patients.
• TOC: All pts transferring to a SNF were eligible.
• All first calls from SNF went to NP, who then worked with
Attending MD and SNF staff to manage patient.
• Data and feedback tracked by PI team, results reviewed.
Program Overview
• If enrolled, NP would see patient at the SNF within 24 hours of transfer and then 1‐2 times/week + as‐needed.
•Medication Reconciliation with Pharmacist occurs within 24‐48 hours
•NP participates in Interdisiplinary Team Program at SNFs to manage patients
•Dedicated Attending MD ‘SNF‐ologist” available for MDs who are not following their patients in the SNF
•Patients that are part of the Foundation receive a Tuck‐in Visit NP House Call upon discharge from SNF
50

11/25/2014
26
ECP EnrollmentJuly 2013 through June 2014
72
90
6678 81
127 132
174161 157 157
143
0
20
40
60
80
100
120
140
160
180
200
1‐Jul 1‐Aug 1‐Sep 1‐Oct 1‐Nov 1‐Dec 1‐Jan 1‐Feb 1‐Mar 1‐Apr 1‐May 1‐Jun
V
o
l
u
m
e
ECP Patients ECP Average Enrollment
51
110 private Attending MDs have agreed to participate with ECP since inception
Daily ECP census: 200‐250 patientsat 7 local SNFs
ECP Pharmacy Medication Reconciliation
52
Patient Discharged from
hospital, admitted to SNF
SNF MAR created with Attending MD, SNF staff faxes MAR to ECP
pharmacy team
ECP pharmacy team reconciles SNF MAR with
hospital discharge list
If potential discrepancies identified,
Pharmacist will contact ECP NP
CY 2013
# of Patients 1034
# of Serious/ Significant Drug‐Related Problems
(DRPs) Identified910
% of Patients Requiring Intervention
45% (469 pts)

11/25/2014
27
53
Incorrect Dose/Dose Adjustments
30%
Omission of Medication
17%Recommended
Initiation of Therapy16%
Recommended Discontinuation of
Therapy16%
Other16%
Duplication5%
Types of Drug‐Related Problems (n=910)
*Other: Includes categories of NP Consult, Drug‐Drug Interaction, Drug Level Monitoring, Wrong Instructions, Medication Substitution, and Extraneous Medication
*
54
Get Vaccinated
Wash Your Hands
Cover Your Cough and Sneeze
11/25/2014
28
55
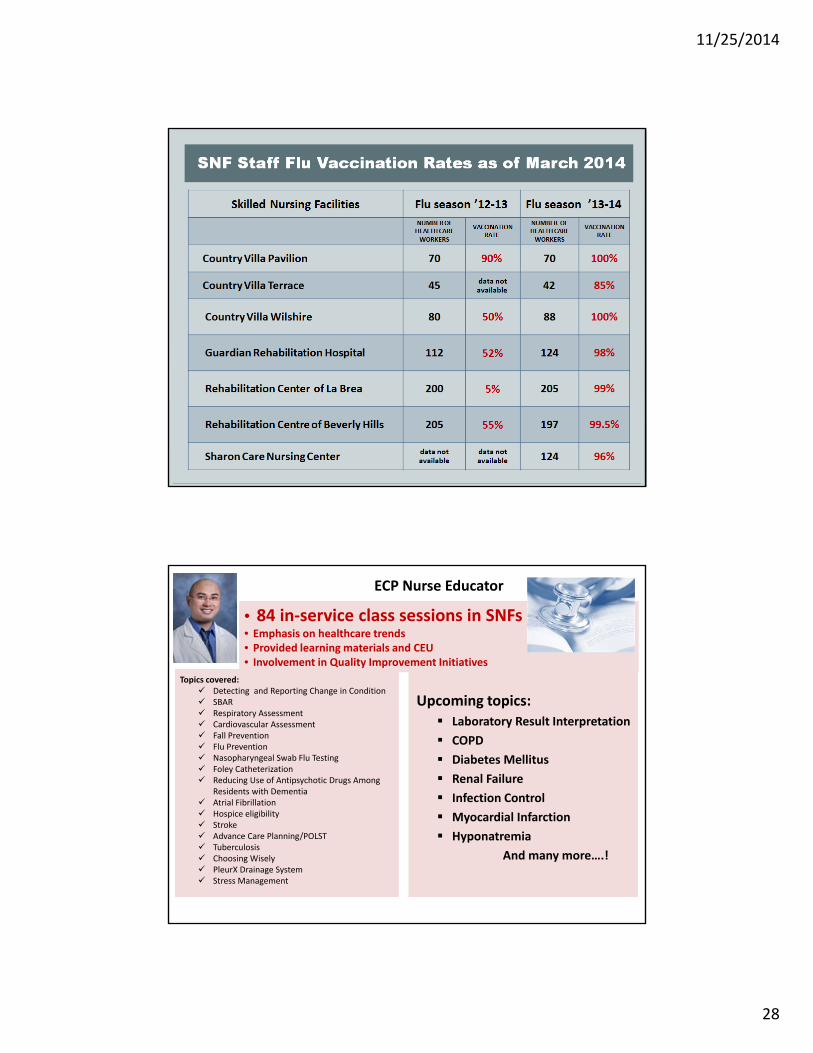
SNF Staff Flu Vaccination Rates as of March 2014
Flu season ’12-13 Flu season ’13-14
ECP Nurse Educator
56
• 84 in‐service class sessions in SNFs• Emphasis on healthcare trends• Provided learning materials and CEU• Involvement in Quality Improvement Initiatives
• 84 in‐service class sessions in SNFs• Emphasis on healthcare trends• Provided learning materials and CEU• Involvement in Quality Improvement Initiatives
Topics covered: Detecting and Reporting Change in Condition SBAR Respiratory Assessment Cardiovascular Assessment Fall Prevention Flu Prevention Nasopharyngeal Swab Flu Testing Foley Catheterization Reducing Use of Antipsychotic Drugs Among
Residents with Dementia Atrial Fibrillation Hospice eligibility Stroke Advance Care Planning/POLST Tuberculosis Choosing Wisely PleurX Drainage System Stress Management
Upcoming topics: Laboratory Result Interpretation
COPD
Diabetes Mellitus
Renal Failure
Infection Control
Myocardial Infarction
Hyponatremia
And many more….!
Upcoming topics: Laboratory Result Interpretation
COPD
Diabetes Mellitus
Renal Failure
Infection Control
Myocardial Infarction
Hyponatremia
And many more….!

11/25/2014
29
Expedited Blood Transfusions—ED avoidance
57
Outpatient transfusions , thereby avoiding an ED transfer (and possible readmission)
• Coordinated effort btw ECP, blood bank, hospital lab, Procedure Center, registration
End of Life issues are of paramount importance—more Advance Care Planning needed!
Greater collaboration with dialysis centers and nephrologists may help reduce readmissions of ESRD patients, better optimize and coordinate their care.
Weekend Attending MD coverage can be a challenge.
The Hospital‐to‐SNF and SNF‐to‐Home transitions need greater standardization and coordination.
Quantifying true impact of the intervention
Challenges and Opportunities
58

11/25/2014
30
Results
59
• Evaluating metrics to drive Performance Improvement
• SNF LOS• Provider touch points as
driver of better outcomes?
• Comparing outcome metrics BY SNF
Leveraging Analytics to Drive Program Evaluation
60
11/25/2014
31
61
Predictive Analytics
62

11/25/2014
32
Predictive Analytics
63
Predictive Analytics uses quantitative methods to derive insights from the data and to provide estimates of future events. It guides an organization’s resource use so it can be more efficient in realizing its business goals and objectives.
64
Background
•Assess predictive performance of the retrospective HOSPITAL Model* applied to Cedars‐Sinai Medical population
•HOSPITAL Model performance consistent with publication
•Opportunity to enhance predictive performance by creating a retrospective CSHS Readmission Model
*Donze J, Aujesky D, et al. Potentially Avoidable 30-Day Hospital Readmissions in Medical Patients. JAMA Intern Med 2013; Online March 25, 2013
11/25/2014
33
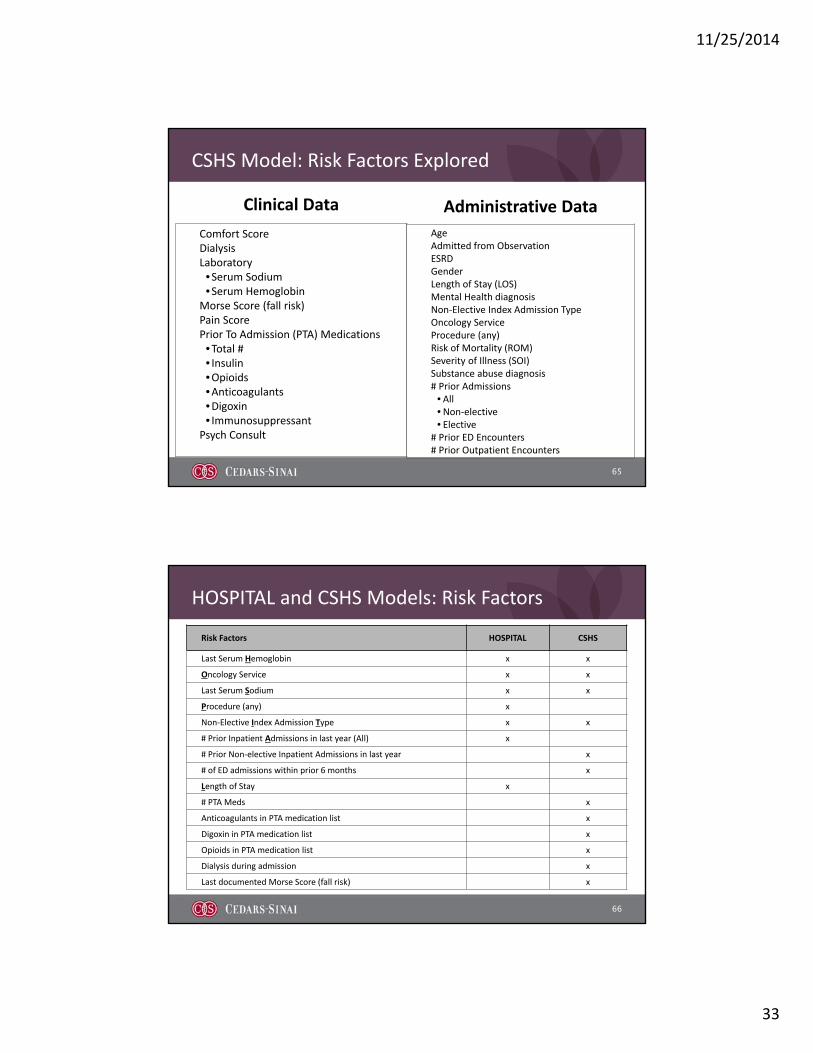
CSHS Model: Risk Factors Explored
65
Clinical Data
Comfort ScoreDialysisLaboratory•Serum Sodium•Serum Hemoglobin
Morse Score (fall risk)Pain ScorePrior To Admission (PTA) Medications•Total #• Insulin•Opioids•Anticoagulants•Digoxin• Immunosuppressant
Psych Consult
Administrative Data
AgeAdmitted from ObservationESRDGenderLength of Stay (LOS)Mental Health diagnosisNon‐Elective Index Admission Type Oncology ServiceProcedure (any)Risk of Mortality (ROM)Severity of Illness (SOI)Substance abuse diagnosis# Prior Admissions
• All•Non‐elective• Elective
# Prior ED Encounters# Prior Outpatient Encounters
HOSPITAL and CSHS Models: Risk Factors
66
Risk Factors HOSPITAL CSHS
Last Serum Hemoglobin x x
Oncology Service x x
Last Serum Sodium x x
Procedure (any) x
Non‐Elective Index Admission Type x x
# Prior Inpatient Admissions in last year (All) x
# Prior Non‐elective Inpatient Admissions in last year x
# of ED admissions within prior 6 months x
Length of Stay x
# PTA Meds x
Anticoagulants in PTA medication list x
Digoxin in PTA medication list x
Opioids in PTA medication list x
Dialysis during admission x
Last documented Morse Score (fall risk) x

11/25/2014
34
HOSPITAL and CSHS Models: Predictive Performance*
67
Measure HOSPITAL CSHS
Cases flagged for readmission risk 3,811 3,191
Captured by Model:True Readmission correctly flagged for readmission risk
1,085 1,074
Missed by Model:True Readmission not flagged for readmission risk
1,701 1,712
SensitivityPercent of readmissions correctly flagged as readmission
38.9% 38.5%
SpecificityPercent of non‐readmissions identified as non‐readmission cases
84.0% 87.6%
Positive Predictive ValuePercent of cases flagged for readmission risk that are actually readmitted
28.5% 33.7%
Medical Unplanned Readmission rate if all readmissions identified were prevented
8.6% 8.6%
Medical Unplanned Readmission rate if nothing is done 14.1% 14.1%
Cases flagged for readmission/day 10.4 8.7
True readmission cases flagged for readmission/day 3.0 2.9
*Medical population FY 2013: 19,814 admissions
68
Conclusion
Retrospective CSHS Model is more efficient than the HOSPITAL Model: it requires review of fewer cases to achieve the same potential reduction in readmission rate.

11/25/2014
35
Current Application: Daily Report From Census
69
Unit RoomHighRis
kRisk Score Patient_Name
AttendingMD
AdmitDate
LOS TDNumber_of_Meds_PTA
OpioidsAnticoagulants
DialysisED_ADMIT_FL
G
Any_Oncology
InPTAdmits in 365
ED_ADMITS180_CNT
3N‐UNIV 1 Y 50 Patient 1 MD 1 11/16/14 5 20 N N N Y Y 6 2
3N‐UNIV 2 Y 43 Patient 2 MD 2 11/19/14 2 11 Y N N Y N 4 2
3N‐UNIV 3 Y 27 Patient 3 MD 3 10/10/14 42 1 N N N Y Y 1 1
3N‐UNIV 4 N 21 Patient 4 MD 4 11/20/14 1 15 N N N Y N 3 0
3N‐UNIV 5 N 21 Patient 5 MD 5 11/8/14 13 15 Y N N Y N 2 0
3N‐UNIV 6 N 20 Patient 6 MD 6 11/20/14 1 7 N N N Y N 2 0
3N‐UNIV 7 N 19 Patient 7 MD 7 11/17/14 4 4 N N N Y N 1 0
3N‐UNIV 8 N 10 Patient 8 MD 8 10/27/14 25 7 N N Y N N 0 0
3N‐UNIV 9 N 9 Patient 9 MD 9 11/17/14 4 7 N N N Y N 0 0
3N‐UNIV 10 N 6 Patient 10 MD 10 11/17/14 4 1 N N N Y N 0 0
3S‐UNIV 11 Y 27 Patient 11 MD 11 11/18/14 3 15 N N N Y Y 4 0
3S‐UNIV 12 N 21 Patient 12 MD 12 11/17/14 4 16 N N N Y N 3 0
3S‐UNIV 13 N 20 Patient 13 MD 13 11/14/14 7 14 Y N Y Y N 1 0
3S‐UNIV 14 N 19 Patient 14 MD 14 11/13/14 8 11 Y N Y Y N 1 0
3S‐UNIV 15 N 18 Patient 15 MD 15 11/19/14 2 10 N N N Y N 1 0
3S‐UNIV 16 N 11 Patient 16 MD 16 11/19/14 2 8 Y N N Y N 1 0
3S‐UNIV 17 N 10 Patient 17 MD 17 11/15/14 6 17 N N N Y N 0 1
3S‐UNIV 18 N 9 Patient 18 MD 18 11/17/14 4 0 N N Y Y N 0 0
Recap
70
Topic
Setting the Stage
Approach to Target Readmissions Reductions
Learning from Failures
Collaborating with Skilled Nursing Facilities
Partnering with Home Health Agencies
Predictive Analytics