
It takes a village: Scaling your vision
35
It takes a Village: Scaling your Vision Rashmi Sinha & Jon Boutelle SlideShare
-
Upload
jon-boutelle -
Category
Business
-
view
2.675 -
download
0
Transcript of It takes a village: Scaling your vision

It takes a Village: Scaling your Vision
Rashmi Sinha & Jon Boutelle
SlideShare
Began with a Vision
•Share all presentations in the world
• A free, truly useful service
•Build community around presentations
•Use YouTube as a metaphor / design guide
• Hit the same gaming dynamics (the leaderboard game) & distribution channels (embeds drive new users to site)
Driven by Design
•Founders believed in importance of user experience
•Early engineers very UX-focused

Where Everybody knows your Name

What led us to Metrics
•Becoming more disciplined about how to grow
•Hard to scale by vision as team grew
•Define a direction so team-members can independently execute against it
•Launch of paid features


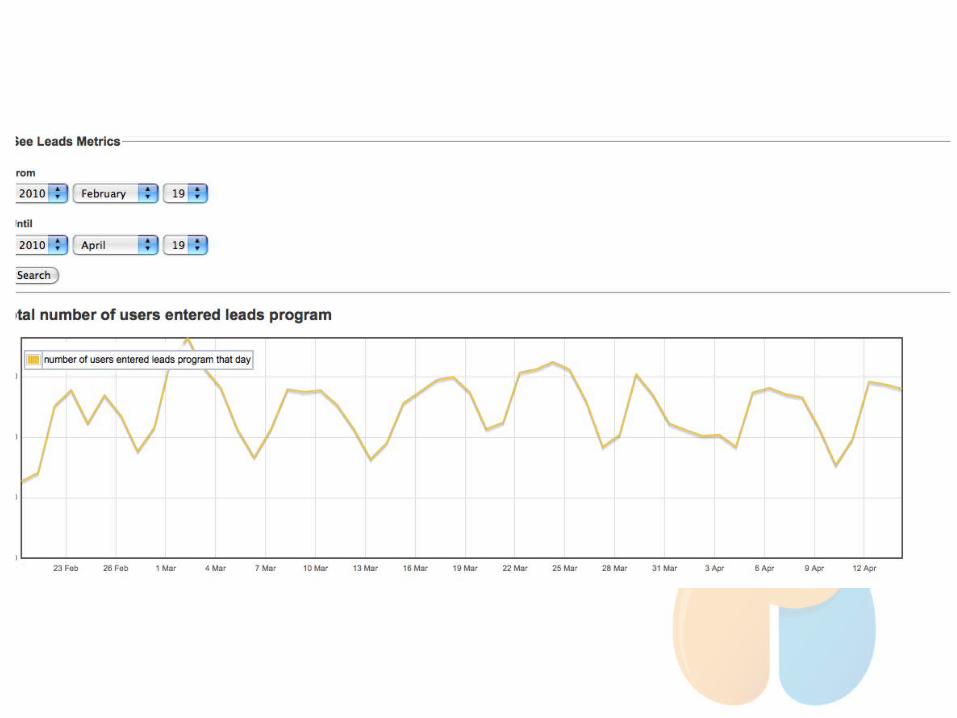
Metrics Version 1
•Individual devs, individual metrics.
•Built a web-based dashboard, with charting.
•Highly configurable, inspired by Slide.
•Highly visual: humans great at visual processing, pattern-matching


#fail

#epicfail

Why?
Metrics

Metrics are not sexy

Metrics need a Social Context
•Making sense of metrics takes time. No social process around iterating based on metrics
•No person in team who was driving metrics
• Developers often not right for this role. May see as distraction from code
•Metrics also need iteration!
•Developers may resist being judged by the behavior of users

We are all Spoiled now

Metrics Axed my Favorite Feature
•Metrics make implicit prioritizations explicit. Some people (including founders) used to making decisions based on intuition
•Reveal that some beloved features might be useless!
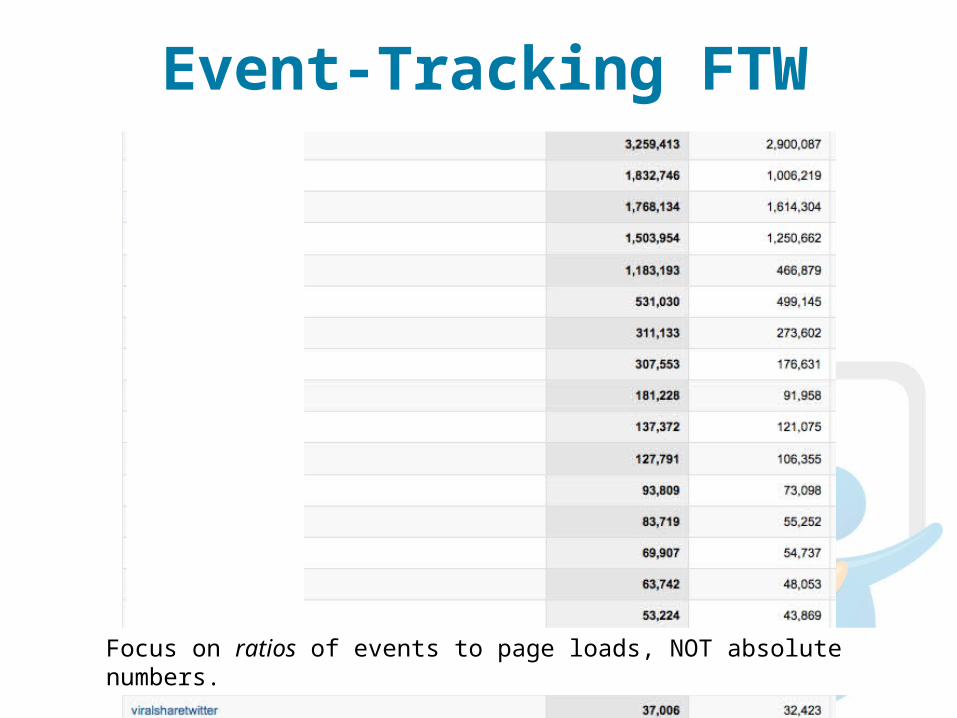
Event-Tracking FTW
Focus on ratios of events to page loads, NOT absolute numbers.

Metrics Version 2
•Email reports on a daily basis, showing numbers for a trailing range of days.
• Everyone working on project gets in their inbox (data comes to you)
•Lots of numbers (provide context). But one number identified as one to focus on

Social Process around Metrics
•Weekly meetings for each team
•Review what shipped, review impact / lack of impact on numbers, plan next week
•Always one person in product manager role: i.e. deep in metrics, shallow on code

Email!
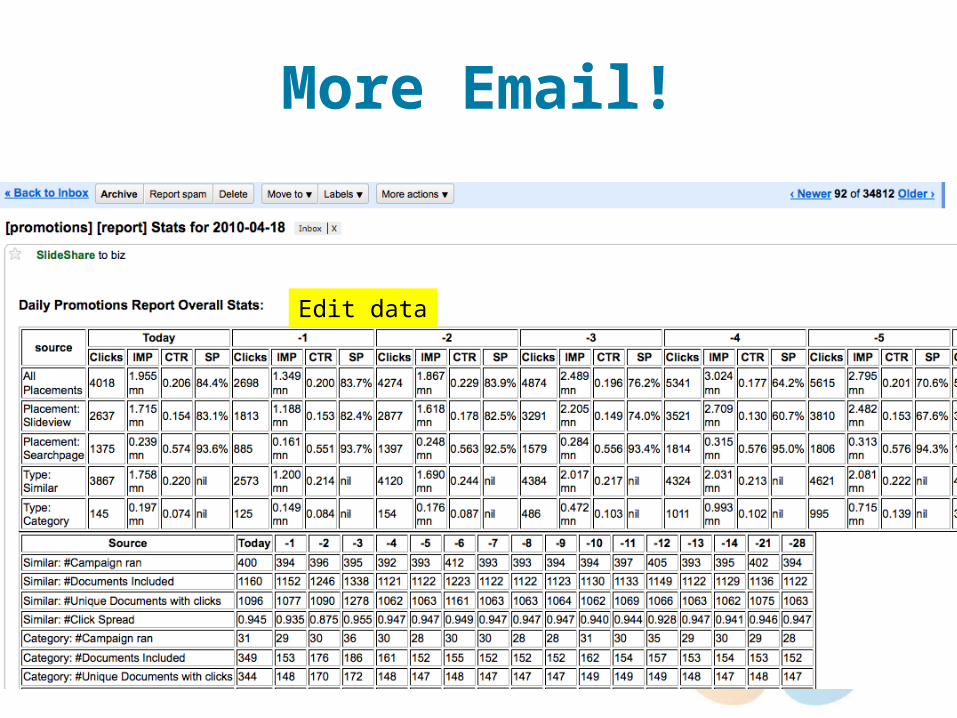
More Email!
Edit data

Case Study: 4x growth of leads collected
•For newly launched business features
• One number the main focus. Other periphery numbers
•Daily email reports worked well. Weekly meetings to plan for next week
•Change paths every few weeks

Case Study: Metrics, Clean Code & Visual
Design•Main page: Slideview page
• Complaints of clutter, page load time.
• Page performed well
• Code underneath the page also fugly
•Solution: periodic refactorings / design cleanups. “Clean it up without trying changing to effect numbers”
• Visual tweaks while monitoring metrics
• Balance: engagement vs. virality

Hitting Local Maxima
Stable metrics. Tweaks no longer lead to growth. Growth will come new ideas, directions, vision
Why Version 2 Works
•Push rather than pull
•One number to focus on
•Social context and process around the metrics
•Warning: REALLY EASY to drown in metrics

How to Frame Team Goals
•Tasks: “Move this number using copy, creative, and simple design changes”
• Use any means necessary
•Success: Moving the number OR learning something interesting

Operational Metrics: an Interlude
•Site uptime, average speed of page load
•Conversion: Ave time for conversion for each document, ave wait time for user
•Apdex:
• Blended read of page load time
• Page load time


Why not use this neat charting for real time
user data?


Using Infrastructure as a Service

What Would we do Differently
•Start in same way
•Start paid services earlier
•Hire non-engineers (who help drive by metrics) earlier
•Nurture metrics mindset in team earlier