IT Strategic Alignment: The Core of Strategic Planning (242402302)

IT Process Institute
IT Strategic Alignment Benchmark
This report was prepared for:
Joann ChizlettDirector of Information TechnologyOrlando-Orange County Expressway Authority
The IT Process Institute (ITPI) is an independent research organization that exists to support the membership of IT audit,security, and operations professionals. www.itpi.org.
Advancing the Science of IT Management
This benchmark is based on the findings and analysis of the IT Process Institute IT Strategic Alignment research study. Theresearch findings are also summarized in an Executive Snapshot white paper.
The research and the development of this benchmark were made possible by the generous support of our Managing Sponsors-- Protiviti, and CA.
Page 1 of 19

Research Study Summary
The development of a winning business strategy requires the thoughtful alignment of market forces, competitive offerings,organizational strengths and weaknesses, and deep understanding of customer needs. However, the execution of a winingbusiness strategy depends on an organization’s capabilities being aligned with strategy key success factors.
The IT Process Institute Strategic Alignment study offers data that supports a breakthrough in thinking about IT businessalignment that rejects the notion of generic IT. Specific technologies, IT strategies, and industry best practices do not applyequally well to all IT organizations -- because all IT organizations are not created equal.
What the business needs from IT is different for each organization. For example, cost reduction and resource utilization aregenerally recognized goals for all IT organizations. But these goals do not help support winning business strategies whereagility and speed drive competitive advantage, or where more costly and less efficient technology solutions may provide betterdifferentiation for a niche product or service.
Instead of viewing IT as a generic resource, it is more empowering to recognize different types of IT organizations that havedifferent core purposes designed to deliver different kinds of business value. IT value archetypes provide common profiles ofvarious IT organization attributes that logically group together. The assessment and understanding of different archetypeshelps highlight that core purpose and capabilities of an IT organization should align with and enable key success factorsoutlined in a business strategy. The assessment of archetypes also helps identify specific practices also enable ongoingalignment of each archetype.
The IT Process Institute conducted a study 269 North American IT organizations of various sizes and from various industries,to determine specific practices that enable strategic alignment success. The survey collected data on nine organizationalattributes that identify the primary IT value archetype, as well as five categories of strategic alignment practices and fivecategories of alignment performance measures. Statistical analysis revealed a short list of specific practices that enable thehighest levels of alignment performance for three different IT value archetypes identified in the study.
Data collected on nine different attributes revealed the profiles of three different IT value archetypes including utilityprovider, process optimizer, and revenue enabler.Practices and performance for three groups reveals building block competencies for each. Organizations need to buildon baseline competencies in order to shift to higher value archetype.There are different practices that enable the highest levels of strategic alignment performance for each archetype. However, IT having clear understanding of business objectives and what IT can do to delivery business value -- moststrongly predict top levels of alignment performance for the organizations studied.
Using This Benchmark
This benchmark is designed to help you:
Determine the IT Value Archetype of your organization. Your archetype should align with what is needed to execute yourbusiness strategy.
1.
Determine if nine organizational attributes fit your archetype.2.Determine if you are using the specific strategic alignment practices that are shown to optimize alignment for yourarchetype.
3.
Use of this benchmark may identify changes that improve how IT enables and supports your business strategy.
Page 2 of 19

Benchmark Executive DashboardThis benchmark is developed based on the analysis and data from 269 organizations that participated in the study. It isdesigned to identify and assess the attributes of your IT value archetype, and compare your use of key performance driversand performance to organizations from each archetype.
ArchetypeWhat type of IT organization do you have?
Your archetype should align with what is needed to enable your business strategy.
Our model predicts with 93% confidence that your IT organization is:
Process Optimizer
Nine Attribute AlignmentThere is no "pure" archetype. Rather the 9 questions in this 3 pillar framework
highlight a mix of attributes that logically group together.
Are all nine elements of your archetype groups in alignment? The graph at right
compares your average scores for nine attributes to the three archetype groups.
Look at how well each of 9 attributes align with averages for your archetype
groups on page 10.
Key Performance Drivers You ThemWe used regression models to identify specific practices that best predict ongoing
alignment for each of three archetype groups.
Is your organization using strategic alignment practices that are shown to enable
ongoing alignment for your archetype?
A detailed assessment of your use of key performance drivers is on page 4.
Utility Providers 7.3 5.9
Process Optimizers 6.8 7.0
Revenue Enablers 7.4 7.34
Strategic Alignment Performance Performance Area You This benchmark measures your strategic alignment performance across 16
measures in 5 areas.
A detailed assessment of your alignment performance is on page 6.
Business Alignment 5.7
Service Delivery 6.7
Cost Effectiveness 7.5
Agility 6.3
Innovation 7.0
Page 3 of 19

Key Performance Driver DetailsUsing a framework of IT value archetypes in this model (that builds on archetype work of Forrester and McKensey), IT strategicalignment efforts can be focused on building and optimizing a specific IT value archetype that best fits a business strategy.Identifying an archetype that fits a specific business strategy is something that should be done at multi-year intervals or whenbusiness strategy changes. Building and managing an IT organization with characteristics of a particular archetype is aneffective way to enable overall business strategy execution success.
However, optimizing strategic alignment on an ongoing basis can be accomplished by implementing specific practices andprocedures. Ongoing optimization can be accomplished by understanding unique challenges and key enablers for each type,and implementing and following key performance drivers that have been shown to drive top performance for a particulararchetype.
This archetype model contains building block competencies. Process Optimizers must have Utility Provider competencies inaddition to business unit and application aligned competencies. Revenue Enablers must have Utility Provider competenciesplus Process Optimizer capabilities, plus capabilities that create technology enabled products and services.
Comparison:Our analysis of archetypes revealed specific practices that best predict top performance for each of the three groups. Wedeveloped a regression model for each group, and analyzed all 49 practices with a balance performance measure that equallyweighted all 16 performance measures. The practices that best predict top strategic alignment performance for each group areshown below compared to your answer.
Utility Provider Key Performance Drivers YourScore
UtilityProvider(Average)
Purpose: provide common infrastructure and capabilities that support basic
information and transaction management.
Key Enabler:
Communication and access with business management,
customers, suppliers
Key Challenge:
Business units “go around” IT limits and controls
Key measures:
Availability
Cost containment
Resource utilization
Security
Actively identifies opportunities to use emerging technology. 7 6.2
Has an effective process and methodology for justifying and
prioritizing IT investment decisions. 7 6.1
Develops and enforces enterprise infrastructure standards. 7 7.1
Have a project management office function to provide oversight to
business prioritized IT projects.8 4.4
Page 4 of 19

Process Optimizer Key Performance Drivers YourScore
UtilityProvider(Average)
Purpose: Utility Provider objectives PLUS enable business unit specific
objectives and capabilities by implementing applications that optimize key
business functions and processes.
Key Enabler:
Business is involved with IT planning and strategy
Key Challenge:
Balance standardization with unique business requirements
Key measures:
Business unit executive satisfaction
Business process efficiency and effectiveness
Actively identifies opportunities to use emerging technology 7 6.7
Develops and enforces enterprise infrastructure standards 7 7.4
IT investments are justified primarily by business process optimization
that enables competitive advantage.6 6.5
Understanding business needs is pervasive at the IT executive and VP
level.7 7.4
Revenue Enabler Key Performance Drivers YourScore
UtilityProvider(Average)
Purpose: Utility Provider and Process Optimizer objectives PLUS enable
unique products/services that allow the organization to enter markets that
wouldn’t be possible without IT-enabled offerings.
Key Enabler:
Operational excellence and efficiency enables focus on business
agility
Key Challenge:
Pace of business change mismatch IT pace of change
Key measures:
Agility
Revenue contribution
Proactively educates all IT personnel on business objectives so that
everyone in IT understands how IT adds value to the business. 7 7.6
IT acts in concert with the business when setting IT strategy and
priorities.7 7.2
Have a strong track-record of rejecting bad projects. 8 7.0
The IT organization has a formal periodic process for identifying what
is needed by the business.7 7.5
IT budget cycle is part of the business unit budgeting process. 8 7.4
Page 5 of 19

Practice Dashboard
This table compares your average score for all strategic alignment practices in five areas to the average scores for the three ITvalue archetype groups in the study. A graphical representation of your scores is shown at right (center = 0, outer ring = 10),and the comparison graphs of the three groups below.
Practice Areas Your Score Utility Provider Process Optimizer Revenue EnablerYour Scores
Average for each group
Strategy and Communication 5.4 5.4 5.9 7.0
Business Linked Metrics 3.6 4.8 5.4 7.0
Governance 6.4 5.2 6.0 7.2
Architecture 7.5 6.2 6.5 7.5
Business Skills 5.2 5.2 6.1 7.6
Utility Providers Process Optimizers Revenue Enablers
Performance Dashboard
This table compares your average score for all strategic alignment performance in five areas to the average scores for thethree IT value archetype groups in the study. A graphical representation of your scores is shown at right (center = 0, outer ring= 10), and the comparison graphs of the three groups below.
Performance Areas Your Score Utility Provider Process Optimizer Revenue EnablerYour Scores
Average for each group
Business Alignment 5.7 6.7 7.2 7.7
Service Delivery 6.7 6.7 7.2 7.3
Cost Effectiveness 7.5 6.8 6.9 7.1
Agility 6.3 6.8 6.8 7.3
Innovation 7.0 6.5 6.7 7.5
Utility Providers Process Optimizers Revenue Enablers
Page 6 of 19
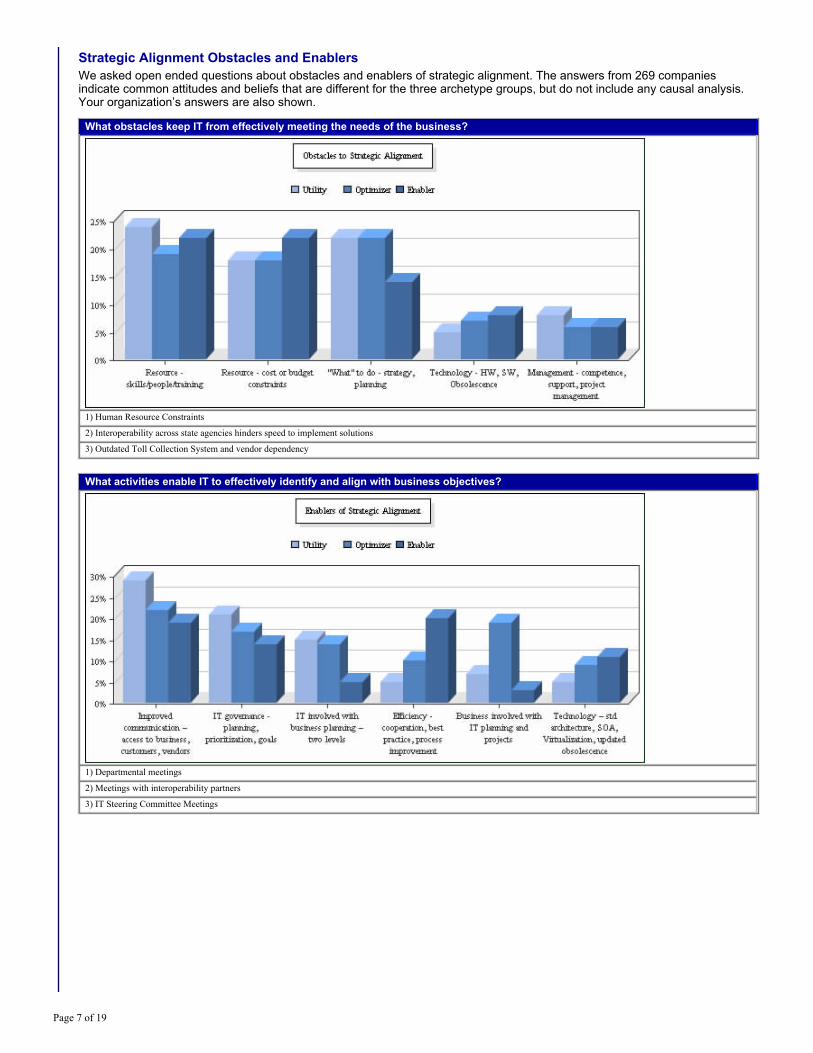
Strategic Alignment Obstacles and EnablersWe asked open ended questions about obstacles and enablers of strategic alignment. The answers from 269 companiesindicate common attitudes and beliefs that are different for the three archetype groups, but do not include any causal analysis.Your organization’s answers are also shown.
What obstacles keep IT from effectively meeting the needs of the business?
1) Human Resource Constraints
2) Interoperability across state agencies hinders speed to implement solutions
3) Outdated Toll Collection System and vendor dependency
What activities enable IT to effectively identify and align with business objectives?
1) Departmental meetings
2) Meetings with interoperability partners
3) IT Steering Committee Meetings
Page 7 of 19

Budget and Demographic Comparison
Performance Measure Your Score Utility Providers Process Optimizers Revenue EnablersDemographics 25th to 75th percentile
Revenue ($M) 36 150 – 2,000 262 – 4,500 250 – 2,000
Employees 58 490 - 5,000 825 - 9,750 680 - 10,000
IT Budget ($M) 4 2 – 40 3 – 52 3 - 39
IT Employees (FTE) 18 11 - 165 15 - 300 35 - 175
Key Ratios 25th to 75th percentile
IT Budget / Revenue (%) 0.1 1.0 – 3.4 0.8 – 3.1 0.5 – 4.0
Employees / IT Staff 3.2 17 – 73 15 - 73 5 - 46
Other 25th to 75th percentile
Budget rate of change (% annual) 2 0 – 5 0 – 9 2 - 12
% Budget under IT Control 100 57 - 100% 40 - 95% 30 - 80%
Your allocation of total IT budget (capital and operating budget) spent on existing IT systems versus new initiatives is comparedbelow.
Your allocation of new project budget to common infrastructure, business unit specific objectives, and technology enabledproducts and services is compared below.
You indicated that your organization’s business strategy is Cost leader. The table below indicates the percentage of eachPage 8 of 19

You indicated that your organization’s business strategy is Cost leader. The table below indicates the percentage of eacharchetype that have different business strategies. Note that Revenue Enablers are most likely to be Market Focused, andProcess Optimizers are most likely to have a differentiation strategy. Utility Providers are most likely to have a mixed strategy.
Business Strategy UtilityProvider
ProcessOptimizer
RevenueEnabler
Cost leader – my firm strives to drive down costs in order to gain cost advantage over our competitors. 15% 15% 17%
Differentiation – my firm strives to offer products or services that are unique from our competitors, in ways that are widely
valued by our customers.19% 20% 13%
Market niche – my firm strives to focus on the needs of a narrow market segment or group of buyers. 23% 26% 30%
Mix – my firm has various business units which may each have different general strategies listed above. 44% 35% 30%
You indicated that your business steering committee meets twice a year. The table below indicates the percentage of eacharchetype that meet at different intervals. Note that Revenue Enablers and Process Optimizers are most likely to meet monthlyor quarterly. Utility Providers are most likely to not have a business steering committee.
Business Strategy UtilityProvider
ProcessOptimizer
RevenueEnabler
Weekly 7.5% 12.1% 18.9%
Monthly 31.3% 36.4% 43.3%
Quarterly 26.3% 29.3% 22.2%
Bi-annually 5.0% 3.0% 4.4%
Annually 2.5% 7.1% 3.3%
We don’t have a business steering committee 27.5% 12.1% 7.8%
Your performance measurement priorities (total 100) are compared below. Note that Revenue Enablers have more balancedpriorities with higher importance given to agility and innovation.
Page 9 of 19

Value Archetype Details
This section compares your answers to nine attribute questions, to the answers for the three archetype groups. Look for areaswhere your answer is significantly different than the others in your archetype groups. Significant differences highlight an areawhere your organization may need to change an attribute to better align with what is typical for others in your archetype group.
PurposeThe primary way that my IT organization
supports the overall business strategy is.
…provide common infrastructure and
basic information management
applications.
…enable business unit specific objectives
and optimize key business processes.
…enable unique products/services that
allow the organization to enter markets.
Your answers: 13 47 40
Page 10 of 19

Technology RequirementsTechnology requirements are determined
by…
…cost efficiency, general information
management objectives and ongoing
infrastructure excellence.
…specific business function requirements
and quest for business process
optimization.
…enabling unique product or service with
lasting market differentiation.
Your answers: 17 56 27
CIO RoleThe CIO's primary role is… …managing effective IT operations—with
core competencies in the areas of resource
management and execution. May be closely
involved with major IT projects such as ERP
implementation.
…as a business manager—with core
competencies in the areas of leadership,
communication, and BU executive
relationships. May also manage other
corporate functions.
…as a participant in setting corporate
strategy—with core competencies in the
areas of vision, new business initiatives
and change. May delegate operations and
technology.
Your answers: 43 40 17
Page 11 of 19

CIO ReportingThe CIO reporting and governance focus
at my organization is…
…our top IT executive reports to the CFO
or COO, and focus on operating
efficiency and asset utilization.
…our top IT executive reports to Business
Unit Executives, and focus on project
management success and business process
optimization.
…our top IT executive reports to the CEO,
and focuses on IT portfolio management
and strategic investment mix.
Your answers: 32 50 18
FundingDuring the IT funding cycle at my
organization…
…IT budgets are funded independently as
a shared service.
…IT is funded as part of business unit
budget cycle.
…IT is funded as part of enterprise
strategic planning.
Your answers: 11 53 36
Page 12 of 19

MetricsMy IT organization uses success
metrics that focus on…
…operating performance SLAs like
availability, help desk responsiveness,
user satisfaction scores, that indicate
ongoing efficiency gains.
…business unit executive satisfaction about
application functionality and whether projects
are on time and on budget , that indicate that IT
is delivering what’s wanted when needed.
…enterprise level revenue contribution,
that indicate IT’s linkage to new sources
of revenue.
Your answers: 28 62 10
Business Strategy ParticipationIT executive's participation in setting
business strategy…
…IT focuses on information issues – and
is not involved in determining business
goals and strategy.
…IT collaborates with business unit
executives to help set and meet business
function goals.
…IT assesses technology trends and
competitive landscape to play proactive
role in shaping business strategy.
Your answers: 16 66 18
Page 13 of 19

Competitive AdvantageIT helps create competitive advantage by… …cutting costs, reducing inefficiencies,
and enabling better decision making
through optimized information
management.
…optimizing business functions and
business processes to differentiate
products and services to better compete in
existing markets.
…creating unique products and services
that change rules of game in existing
markets, or enable participation in new
markets.
Your answers: 21 65 14
Investment JustificationIT investments are justified… …by potential for cost savings and
business process efficiency gain.
…with customer facing revenue or market
share gains from existing products and
services.
…based on increased revenue that is
generated by entering new markets.
Your answers: 60 34 6
Page 14 of 19

Strategic Alignment Practices - Details
This section compares your score on 49 strategic alignment practices tested, to the three archetype groups. Those identified askey performance drivers are bold font.
* Key Performance Driver
Strategy and Communication. Your Score UtilityProvider
ProcessOptimizer
RevenueEnabler
AverageThe business clearly identifies and communicates business strategy, key success factors,
competitive advantage, goals and objectives (what the business is trying to accomplish)—so
that IT has clear guidance
7 5.5 6.4 7.2
* The IT organization has a formal periodic process for identifying what is needed by the
business7 5.5 6.6 7.5
The IT organization has an informal or ad hoc approach to understanding what is needed by the
business4 6.4 6.0 7.0
* Understanding business needs is pervasive at the IT executive and VP level 7 6.4 7.4 7.8
Understanding business needs is pervasive at all levels of the IT organization 7 5.7 6.3 7.4
IT acts independently from the business when setting IT strategy and priorities 3 4.3 4.2 6.3
* IT acts in concert with the business when setting IT strategy and priorities 7 6.6 7.1 7.2
The IT organization has a formal approach for sharing IT strategy and priorities to get buy-in
from the business (enterprise-wide and business unit specific executives)7 5.7 6.6 7.0
The IT organization has an informal or ad hoc approach for sharing IT strategy to get buy-in
from the business (enterprise-wide and business unit specific executives)3 5.5 5.5 6.8
The IT organization doesn’t share IT strategy to get buy-in from the business 2 2.7 2.5 5.4
Average: 5.4 5.4 5.9 7.0
Business Linked Metrics. Your Score UtilityProvider
ProcessOptimizer
RevenueEnabler
We have a balanced set of IT performance metrics that include business-linked measures such
as business process efficiency, market share gains, revenue growth
2 4.4 4.9 6.8
IT service levels are measured at the system level (i.e., server availability) 1 6.4 6.6 7.1
IT service levels are measured at the application level (i.e., transaction monitoring) 4 5.2 6.1 7.0
IT service levels are measured at the business process level (i.e., completed orders) 6 4.7 5.2 7.0
My IT organization benchmarks our operating performance against other IT organizations 4 4.3 4.6 6.5
We regularly assess the IT capabilities of our competition to identify areas for potential IT
enable product or service differentiation.
5 4.6 4.6 6.9
We have continuous improvement program that involves business managers to help set and
achieve performance goals for key IT processes.
1 4.8 5.5 7.2
IT participants in business process improvement programs to help identify ways that IT can
help achieve business process performance goals.
8 5.3 6.2 7.4
We tie executive bonus and promotion to customer satisfaction and retention, revenue or other
customer facing business metric – in order to focus IT executives on business drivers.
1 3.4 4.5 7.3
Average: 3.6 4.8 5.4 7.0
Page 15 of 19

Governance. Your Score UtilityProvider
ProcessOptimizer
RevenueEnabler
IT executives are involved in business strategic planning. 7 5.0 7.2 7.7
Business executives are involved in IT strategic planning 7 5.9 6.4 7.3
Our IT budget cycle is independent of business unit or enterprise budget approval. 2 4.0 2.9 6.0
* Our IT budget cycle is part of the business unit budgeting process. 8 6.4 7.6 7.4
Our IT budget cycle is part of enterprise strategic planning and funding. 7 6.8 8.0 7.7
* We have an effective process and methodology for justifying and prioritizing IT
investment decisions.
7 6.1 6.4 7.6
Our IT investments are justified primarily by cost reduction and efficiency gain. 6 6.6 6.5 6.8
* Our IT investments are justified primarily by business process optimization that
enables competitive advantage.
6 5.1 6.3 7.3
Our IT investments are justified primarily by strategic revenue opportunities. 6 3.9 4.7 7.1
Our process and methodology for justifying and prioritizing IT investment decisions addresses
both shared service and business unit specific requirements.
7 5.5 6.4 7.3
IT has an executive role with primary job responsibility as liaison with the business to foster
two-way communication of business needs and IT priorities and results.
7 5.1 6.9 7.6
IT hosts a cross-business steering committee to prioritize and allocate IT resources. 8 5.0 5.6 7.1
We utilize investment portfolio management practices to manage a strategy mix of IT
investments.
4 3.6 4.1 6.8
We conduct regular resource allocation post-mortems to identify improvements on our IT
strategy process.
6 4.0 4.9 7.1
* We have a strong track-record of rejecting bad projects. 8 4.8 5.4 7.0
Average: 6.4 5.2 6.0 7.2
Architecture. Your Score UtilityProvider
ProcessOptimizer
RevenueEnabler
* My IT organization develops and enforces enterprise infrastructure standards 7 7.1 7.4 7.6
My IT organization has enterprise standard definitions for IT roles and responsibilities 8 6.4 7.2 7.9
My IT organization has criteria and process to determine how to balance enterprise
architecture standards with the unique business needs that may require the use of non-standard
infrastructure.
7 5.8 6.4 7.6
We systematically and aggressively integrate acquired companies into our enterprise standard
architecture with very few exceptions.
8 4.9 4.4 6.6
We actively define approved configurations and enforce compliance with standard
configurations.
8 6.5 6.9 7.7
* We actively identify opportunities to use emerging technology to reduce costs, optimize
business processes, enable new sources of revenue.
7 6.2 6.7 7.7
Average: 7.5 6.2 6.5 7.5
Business Skills. Your Score UtilityProvider
ProcessOptimizer
RevenueEnabler
We put significant efforts into developing project management skills and processes to ensure
business prioritized IT projects are delivered on time and on budget.
6 5.8 6.5 7.5
* We have a project management office function to provide oversight to business
prioritized IT projects.
8 4.4 5.1 7.1
All IT employees attend training to develop attitudes and culture to enable change readiness. 2 4.2 5.2 7.1
IT executives cross over and manage other business functions. 1 2.9 3.9 6.7
Our IT organization has a process culture where following documented processes and
procedures is a normal job expectation and not following standard procedures has consequences
8 5.0 5.7 7.2
We have made significant effort to identify functions we can outsource or utilize 3rd party
service providers that match our business objectives.
7 5.2 5.8 6.8
IT has dedicated finance personnel to help evaluate prioritization and resource allocation
decisions.
1 4.2 4.5 6.9
* We proactively educate all IT personnel on our overall business strategy, goals, key
success factors, and competitive advantage – so everyone in IT has business context to
help make daily decisions.
7 5.2 6.1 7.6
We proactively educate all IT personnel on our IT strategy including how IT helps meet
business objectives – so that everyone in IT understands how IT adds value to the business.
7 5.1 6.4 7.6
Average: 5.2 4.7 5.5 7.2
Page 16 of 19

Strategic Alignment Performance Measures - Details
Business Alignment. How well your IT organization prioritizes IT resources based on both overall enterprise and specificbusiness unit needs.
Business Alignment. Your Score UtilityProvider
ProcessOptimizer
RevenueEnabler
My IT organization consistently and effectively identifies what is needed by the business –
including business strategy, key success factors, and goals and objectives
6 6.3 7.1 7.6
My IT organization consistently and effectively develops IT strategies and objectives that are
designed to meet the needs of the business
7 7.0 7.5 7.8
Our overall IT spending mix (capital and operating budgets) on applications, infrastructure,
human resources and 3rd party services -- is very well aligned with the needs of the business
4 6.8 7.0 7.5
Average: 5.7 6.7 7.2 7.7
Service delivery. How well your IT organization delivers services needed by the business—both centralized shared servicesand business specific IT capabilities.
Service Delivery. Your Score UtilityProvider
ProcessOptimizer
RevenueEnabler
IT services and capabilities are predictable and consistent across locations and business units 6 7.2 6.9 6.7
IT service and support levels consistently meet or exceed business prioritized service level
requirements
6 7.1 7.1 7.4
My IT organization is proficient at managing IT systems and applications to optimize
availability, performance and security at a level required for our business
8 7.7 7.8 7.7
Average: 6.7 7.3 7.2 7.3
Cost effectiveness. How well your IT organization delivers IT capabilities at a reasonable and/or competitive cost.
Cost Effectiveness. Your Score UtilityProvider
ProcessOptimizer
RevenueEnabler
We manage costs by consolidating and simplifying our infrastructure, including data center
consolidation, architecture standardization and configuration simplification
7 7.3 7.4 7.1
We manage costs by optimizing the overall IT and business application portfolio to minimize
redundant applications that perform the same or similar functions
8 6.8 7.0 7.4
We manage costs by sourcing 3rd party services while maintaining in-house services that
optimize unique business capability
7 5.7 5.9 6.5
Overall, we provide IT capabilities to the business at or below average cost as compared to our
competition
8 7.4 7.2 7.5
Average: 7.5 6.8 6.9 7.1
Agility. How well your IT organization is able to respond to changing business needs.
Agility Your Score UtilityProvider
ProcessOptimizer
RevenueEnabler
We consistently deliver business prioritized projects on time, on budget and with the
functionality that was requested to meet desired business results
5 6.9 6.6 7.0
We proactively and effectively balance unique and specific business requirements with the
need for enterprise-wide IT architecture standards and capabilities
7 7.0 7.0 7.2
Overall, enterprise-level and business unit level executives give IT high marks for being able to
respond to and address changing business needs.
7 6.5 6.9 7.5
Average: 6.3 6.8 6.8 7.3
Innovation. How well your IT organization is able to innovate or leverage new technology to meet changing business needs.
Innovation. Your Score UtilityProvider
ProcessOptimizer
RevenueEnabler
My IT organization consistently and effectively finds new ways to help the business meet cost,
competitive advantage, and new product/service objectives
7 6.6 6.7 7.2
My IT organization focuses innovation efforts on specific business objectives and minimizes
efforts to simply stay on the technology treadmill
7 6.5 6.6 7.5
Overall, my IT organization is more effective than our competitors at introducing new
technology to meet business priorities
7 6.3 6.7 7.6
Average: 7.0 6.5 6.7 7.5
Page 17 of 19

Participant Demographics Overview
269 North American based IT managers and executives completed a web-based survey in October 2007. A broad range ofindustries as shown below, with most in the financial and insurance, and manufacturing industries are represented.
Page 18 of 19

Additional Resources:
Visit the ITPI website for more information on the IT Strategic Alignment performance study.
http://www.itpi.org/home/research_reports.php
For questions or comments about this benchmark, please contact:
Kurt MilneManaging DirectorIT Process [email protected]
Reference Materials:
Debunking Alignment Nirvana,Forrester research report, June 18, 2007Laurie M. Orlov
Divide and Conquer: Rethinking IT StrategyMcKensey Quarterly Web Exclusive August 2006.David Craig and Ranjit Tinaikar
Avoiding the Alignment Trap in ITBain and Company, September 5, 2007David Shpilberg, Steve Berez, Rudy Puryear, Sachin Shah
Identification of factors affecting the maturity of IT-Business Strategic AlignmentProceedings, Americas Conference on Information Systems, August 2004,Jeffy Luftman, Deb Sledgianowski, Richard R. Reilly
State of the CIO 2007: Beyond ExecutionCIO Magazine, March 2007Christopher Koch
Page 19 of 19