Wesleyan Financial System Kickoff Meeting for WFS Implementation June 10, 2008.
Upload
hp-software-solutionsCategory
view
2.118download
3description

1 ©2010 Hewlett-Packard Development Company, L.P. The information contained herein is subject to change without notice
IT Financial Management kickoff
Mark Bradley
Technical Product Marketing Manager

2
Optimizing resources to deliver highest value to business
IT Financial Management
Capital and r
eso
urc
es
Financial year
Capex
Opex
Now
How to govern IT investments?
Change the business
Run the business
How to account for IT spend?
How to predict IT costs?
GovernanceEffective management of the IT investment planning process, cost/benefit (ROI) determination, data integrity
AccountabilityReporting & analysis of IT spend, assessment of IT service costs, cost allocation and recovery
PredictabilityAccurate forecasting of resource & capital requirements, continuous tracking of IT spending & resource consumption
CIO
3
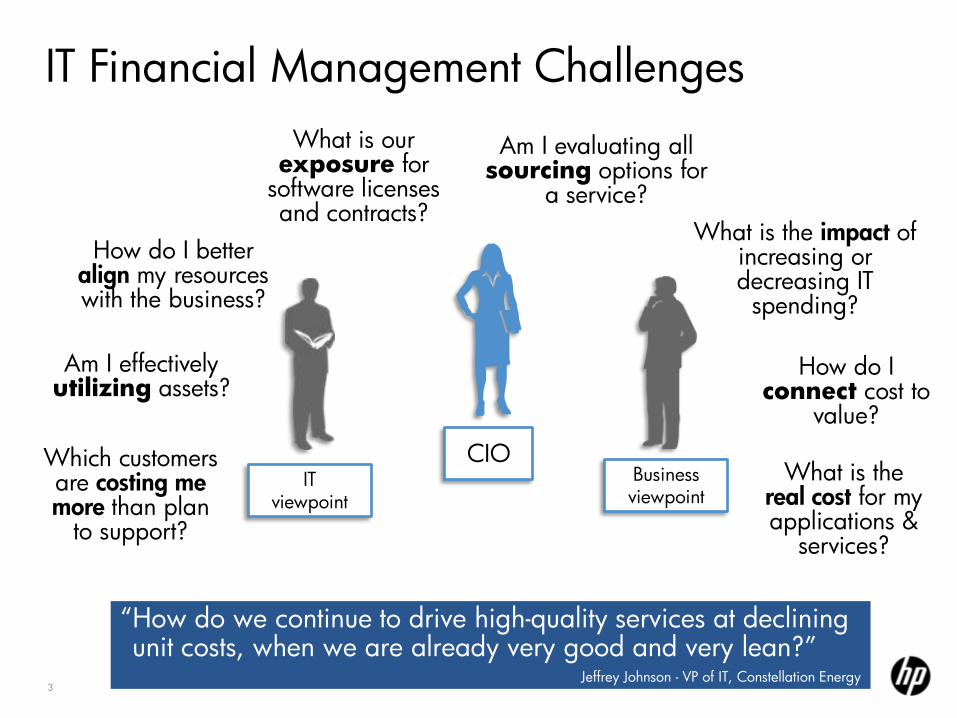
How do I better align my resources with the business?
Which customers are costing me more than plan
to support?
How do I connect cost to
value?
What is the real cost for my applications &
services?
What is the impact of increasing or decreasing IT
spending?
CIOBusinessviewpoint
ITviewpoint
―How do we continue to drive high-quality services at declining unit costs, when we are already very good and very lean?‖
Jeffrey Johnson - VP of IT, Constellation Energy
Am I evaluating all sourcing options for
a service?
Am I effectively utilizing assets?
What is our exposure for
software licenses and contracts?
IT Financial Management Challenges

4
Business
IT Financial Management Challenges
Immature investment decisions
Operational inefficiencies
No actionablecost information
―IT has weaker internal management systems today than manufacturing had in 1982‖
IDC Industry Insights, 2008
Only 36% of the average CIO‘s budget can be devoted to providing new capabilitiesCIO Magazine ―The State of the CIO‖ online
survey, January 2008
―The IT organization cannot be credible unless it can have meaningful conversations in the language of business. This means having the right information to guide business decisions.‖
Barbara Gomolski, Research VP, GartnerCIO

5
Financial Management Current State
Visibility
Process
Data
PMO
SpreadsheetsCorporatefinancial
data
Ops
Configurationdata
Businessunitdata
Projectdetails
Apps
Weak discontinuous
processes
Limited visibility into IT financials
Many unsynchronized data feeds
Governance
Service pricing and charge-backs
Planning and budgeting
Cost accounting
Financial analysis
6
Externaldatafeeds
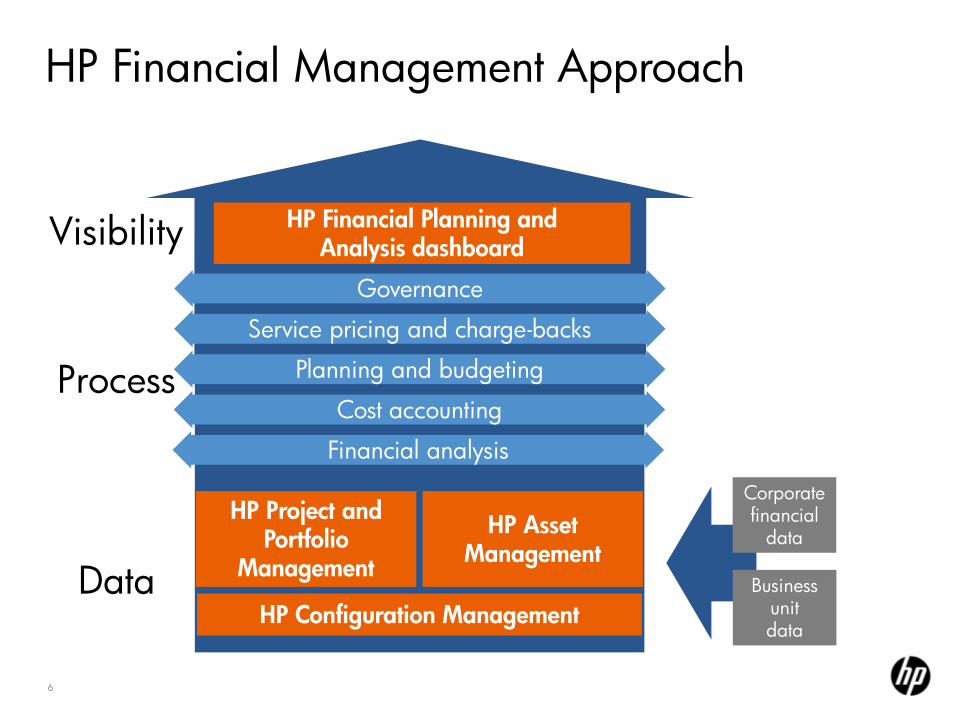
Full visibility, control and
accountability
Governance
Service pricing and charge-backs
Planning and budgeting
Cost accounting
Financial analysis
HP Financial Planning andAnalysis dashboard
HP Project and Portfolio
Management
HP Asset Management
HP Configuration Management
Corporatefinancial
data
Businessunitdata
Automated consolidation of
budgets and costs
Automated cost allocation
Visibility
Process
Data
HP Financial Management Approach
7
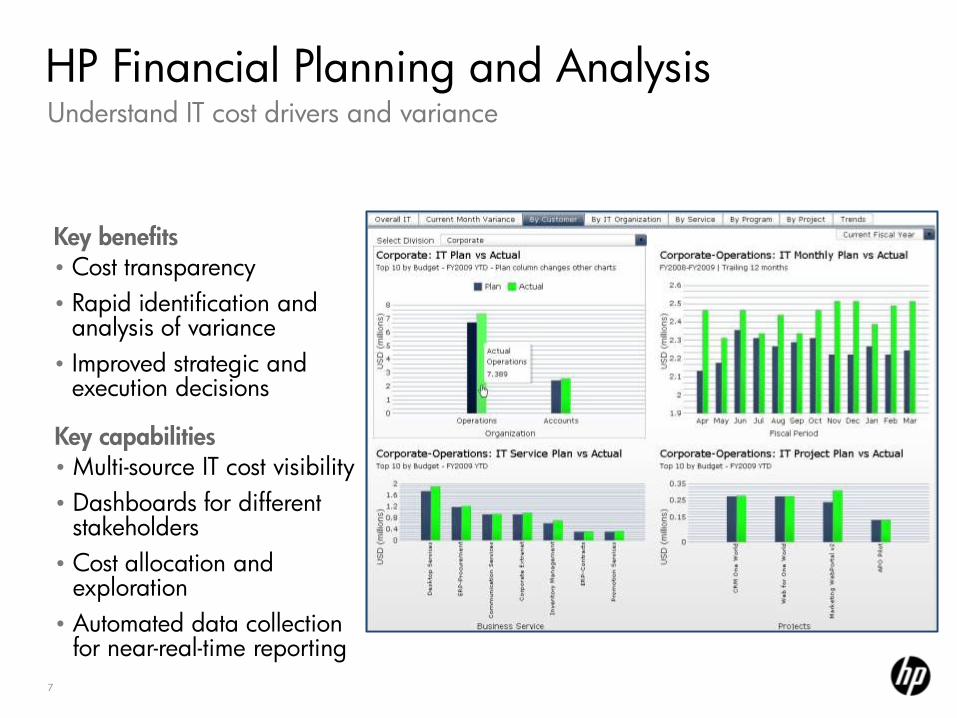
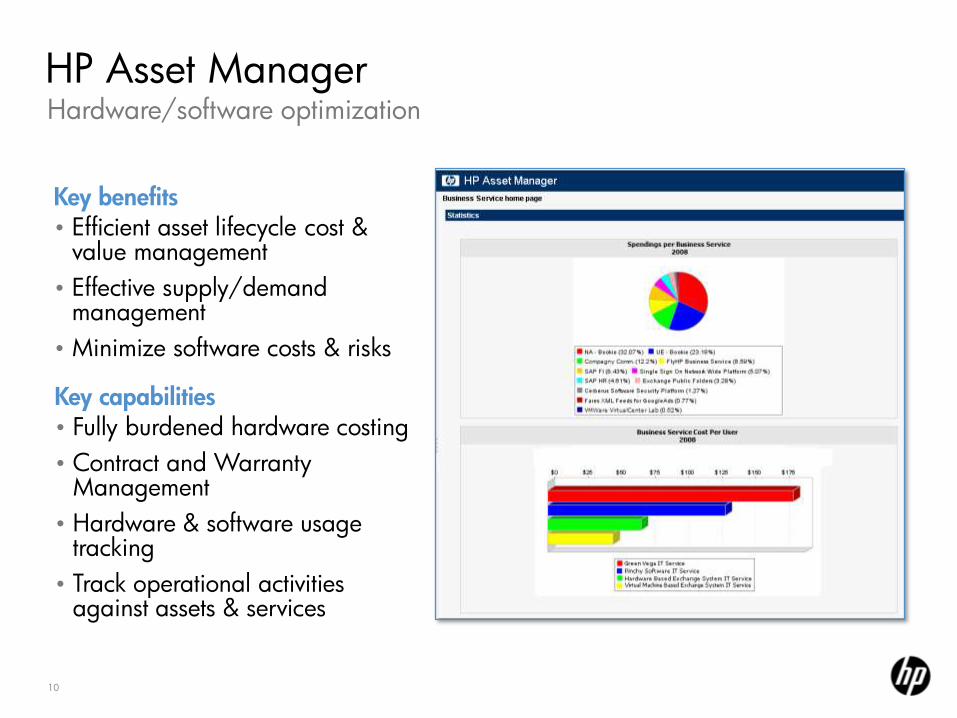
Key benefits
• Cost transparency
• Rapid identification and analysis of variance
• Improved strategic and execution decisions
Key capabilities
• Multi-source IT cost visibility
• Dashboards for different stakeholders
• Cost allocation and exploration
• Automated data collection for near-real-time reporting
Understand IT cost drivers and variance
HP Financial Planning and Analysis

8
Consolidated and Actionable
Project and Portfolio Management
Asset Management
CostsCosts
ProjectsProjects
LocationsRegion
Organizations Department
– Automating large parts of the data gathering process
– Encouraging better behavior as people see the results of their actions
Financial Planning andAnalysis dashboard
User Employee

9
Key benefits
• Informed investment management
• Process automation
• Portfolio analysis
• Leading indicators of cost variance
Key capabilities
• Consolidated demand management
• Integrated investment, resource, time and project management
• Lifecycle investment visibility
HP Project and Portfolio Management CenterProject and portfolio alignment/control
10
Key benefits
• Efficient asset lifecycle cost & value management
• Effective supply/demand management
• Minimize software costs & risks
Key capabilities
• Fully burdened hardware costing
• Contract and Warranty Management
• Hardware & software usage tracking
• Track operational activities against assets & services
Hardware/software optimization
HP Asset Manager

11
Delivering Value Along the Journey
Improve Base InformationEstablish a clear understanding of all IT costs, cost drivers, and variance sources across budget, portfolio and assets.
1
Add Depth to Improve DecisionsEffectively manage the entire scope of IT investments—budget, resource, time, and capacity to align spending with business objectives.
2
3Optimize valueLink value to cost to make intelligent business decisions that will focus resources on innovation, improve efficiency and maximize business outcomes.
Maximizedsupport
forinnovation
Strategic investment portfolio
Inventoryand asset tracking
Resourceand time
management
Assetcapacity
management
IT businessvalue
optimization2
1 2
3
IT service management`
Costvisibility
Costmanagement1 2 3
3
1
HP Project Portfolio Management
HP Asset management
HP Financial Planning and Analysis

12
HP Project & Portfolio Management
Delivering Value
• IT project scope changes dropped by 57% - Large food retailer and distributor
• The IT demand queue reduced by 67.1% -Large food retailer and distributor
• Immediately identified and stopped $8 million in projects determined unlikely to delivery expected business value – Xcel Energy
Aggregate Demand
• Project funding process reduced from 6 1 wk(s) – Large commercial airline
• IT budget accuracy improved 100%: planned budget exactly tied to actual IT expenditures for the year – Large food retailer and distributor
• Saved $3.7 million by avoiding investment in non-viable projects –Xcel Energy
Optimize the portfolio
• Increase project team productivity by 30% –Birlasoft
• Reduce ‗at risk‘ projects from 50% 14% -Autotrader.com
• Cost overruns reduced to 0%, recouping 2% ($1.5M) of annual IT Budget - Large food retailer and distributor
• Decreased time spent on schedule tracking and updating by 50%. –Packaging firm
Execute projects and other work
13
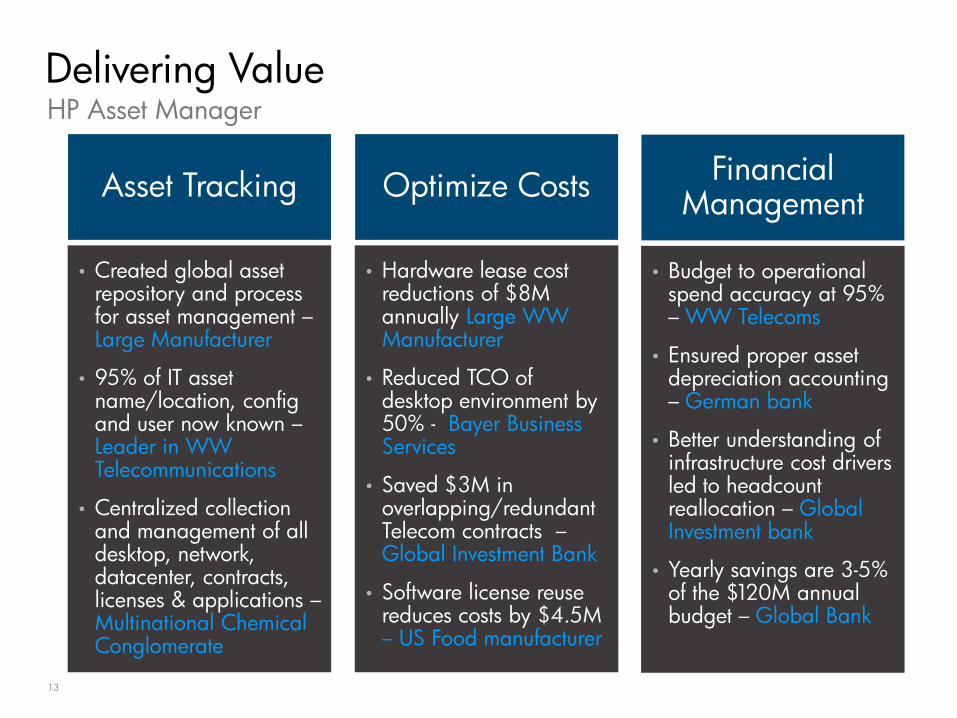
HP Asset Manager
Delivering Value
• Created global asset repository and process for asset management –Large Manufacturer
• 95% of IT asset name/location, configand user now known –Leader in WW Telecommunications
• Centralized collection and management of all desktop, network, datacenter, contracts, licenses & applications –Multinational Chemical Conglomerate
Asset Tracking
• Hardware lease cost reductions of $8M annually Large WW Manufacturer
• Reduced TCO of desktop environment by 50% - Bayer Business Services
• Saved $3M in overlapping/redundant Telecom contracts –Global Investment Bank
• Software license reuse reduces costs by $4.5M – US Food manufacturer
Optimize Costs
• Budget to operational spend accuracy at 95% – WW Telecoms
• Ensured proper asset depreciation accounting – German bank
• Better understanding of infrastructure cost drivers led to headcount reallocation – Global Investment bank
• Yearly savings are 3-5% of the $120M annual budget – Global Bank
Financial Management

14
―With HP IT Financial Management, we‘re driving the financial accountability of our technology organization.
We‘ve benchmarked our IT spending in relationship to our operational expenses, and it is substantially lower than our peers.
As its business users become more cognizant of their technology consumption, they find ways to use technology more efficiently
Our unit costs – meaning cost per desktop, per server, per gigabyte of storage – have dropped 14 percent.‖
Jeffrey Johnson – Deputy CIO and VP of Operations and Infrastructure, Constellation Energy

15
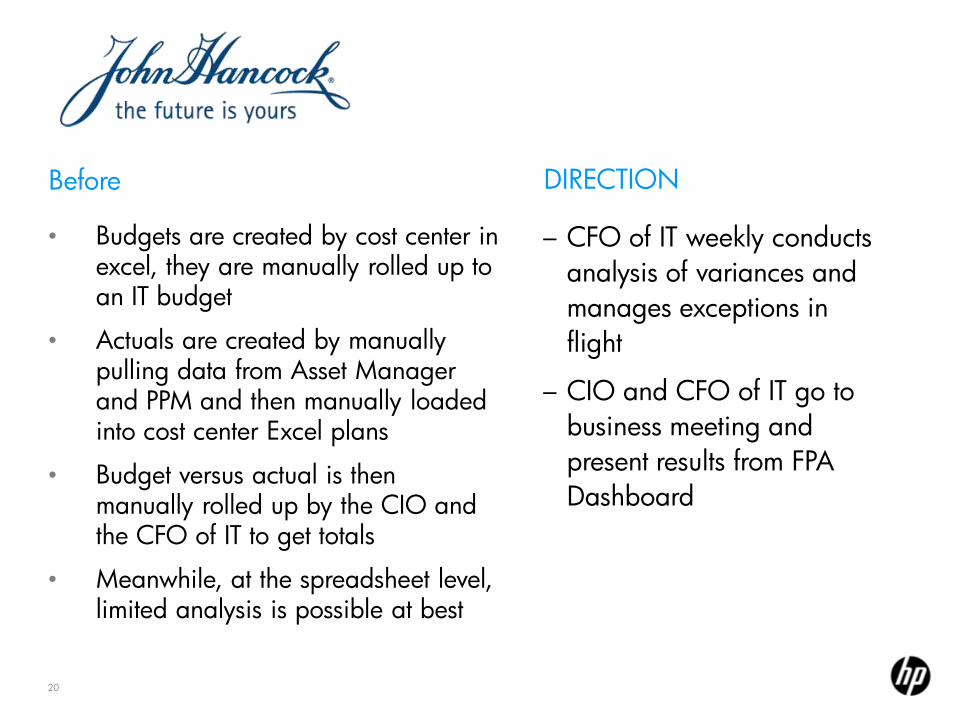
Before
– Fragmented processes and tools, succeeding through ―pure heroism‖
– Met objectives because we had smart people working very hard
– Not scalable
CASE STUDY
Approach
• Adaptation of ITIL v3
• Started with HP Project & Portfolio Management to understand portfolio investments
• HP Asset manager to help decommission large assets
• HP uCMDB led to better understanding of risks and conflicts associated changes
• HP Discovery and Dependency Mapping to help define the business value of technology assets and resources
• HP Service Manager where escalations reduced by half e.g. thanks to better access to problem data
16
Business
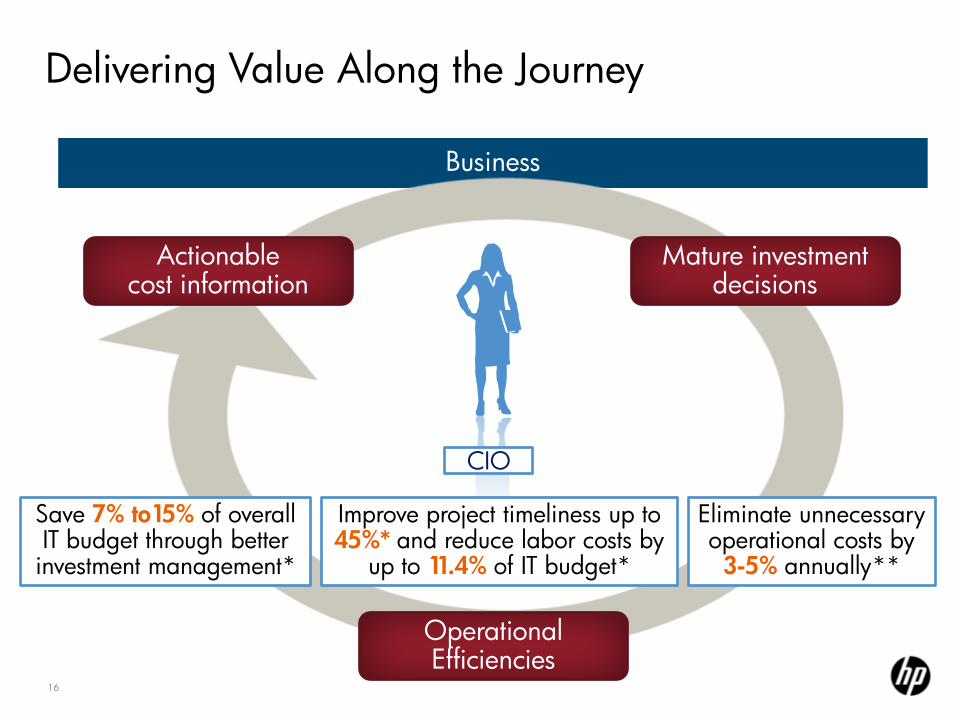
Mature investment decisions
Operational Efficiencies
Actionablecost information
CIO
Delivering Value Along the Journey
Eliminate unnecessary operational costs by
3-5% annually**
Save 7% to15% of overall IT budget through betterinvestment management*
Improve project timeliness up to 45%* and reduce labor costs by
up to 11.4% of IT budget*

17
Ledger will tell you 100 laptops were purchased three months ago
Actionable Information
But to understand the business perspective you need:
– Deployment project costs
– Unit hardware costs
– Software license information
– Cost of ongoing support
– Deployment rate

18
** Asset Management ROI Study
• Analyze cost drivers to effectively reduce waste
• Eliminate unnecessary operational costs by 3-5% annually**
• Reallocate budget and staff resources to more strategic projects
Transform cost data into
actionable information
• Ensure on-time, on-budget completion of projects and programs
• Evaluate asset, resource, warranty ,contract, and license utilization
• Match resource and asset supply and demand for lean service delivery and support
• Improve project timeliness by up to 45%* and reduce labor by up to 11.4 % of IT budget*
Efficiently manage IT execution
• Gain insight through complete IT demand aggregation
• Save an average of 7.8% of the annual IT budget by avoiding non-strategic projects*
• Enable traceability, accountability, and process improvement
Improve IT investment decisions
Delivering Value Along the Journey
Maximize IT contribution to business innovation and manage IT like a business
* Gantry Group HP PPM Center customer benchmark study Feb 2008

19
"HP is helping us enhance operational and strategic
decision making by identifying ways to drive more
value to our business while driving out
inefficiencies.
Our IT organization is better able to attract internal
capital for investment by managing itself like a business in
a transparent, fact-based manner.―
Allan Hackney – CIO, John Hancock Financial Services
20
CASE STUDY
Before
– CFO of IT weekly conducts
analysis of variances and
manages exceptions in
flight
– CIO and CFO of IT go to
business meeting and
present results from FPA
Dashboard
• Budgets are created by cost center in excel, they are manually rolled up to an IT budget
• Actuals are created by manually pulling data from Asset Manager and PPM and then manually loaded into cost center Excel plans
• Budget versus actual is then manually rolled up by the CIO and the CFO of IT to get totals
• Meanwhile, at the spreadsheet level, limited analysis is possible at best
DIRECTION

21
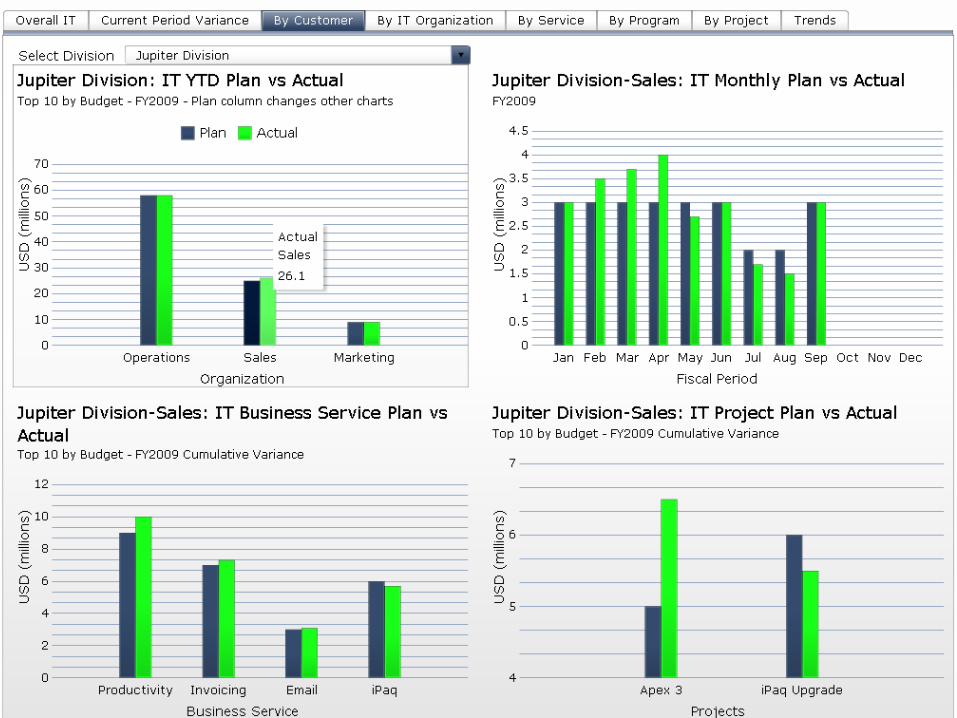
Financial Management Visualization
IT Provider
Infrastructure
Department
Geography
Business Unit
Projects
Plan
Actual
OPEX
CAPEX
IT FinanceCIO
Lines of Business
IT managers
CFO
VP Applications
VP Operations
ResourcesLabor
AssetsHardware/Software
FinancialsProject portfolio management
Asset management
Organizational view Component view
―Free your people up from just data collection and collating to actually analyzing the data for gaps, areas of improvements, etc. You turn your financial analysts into analysts that can help managers.‖
– VP IT Finance, Large Insurance Company
3rd Party Data Sources
Financial Planning & Analysis

22
23

24
HP Financial Planning & Analysis Allocation Engine

25

26
Where to Start?
– Financial Planning & Analysis
• Already have a mature PPM and/or AM deployment
• Customize data gathering from equivalent products
• No PPM/AM? Collate data into FPA-ready spreadsheet template
• Focus is on views of financials for stakeholders or cost allocation
– Project and Portfolio Management
• Do not already have a portfolio perspective
• Inefficient or routinely cancelled projects is a pain point
• Difficulty keeping track of demand for investments
• No current view of labor costs (e.g. time recording)
– Asset Management (and uCMDB)
• Not currently tracking assets
• No real link between assets and business services
• Issues with software licensing and compliance
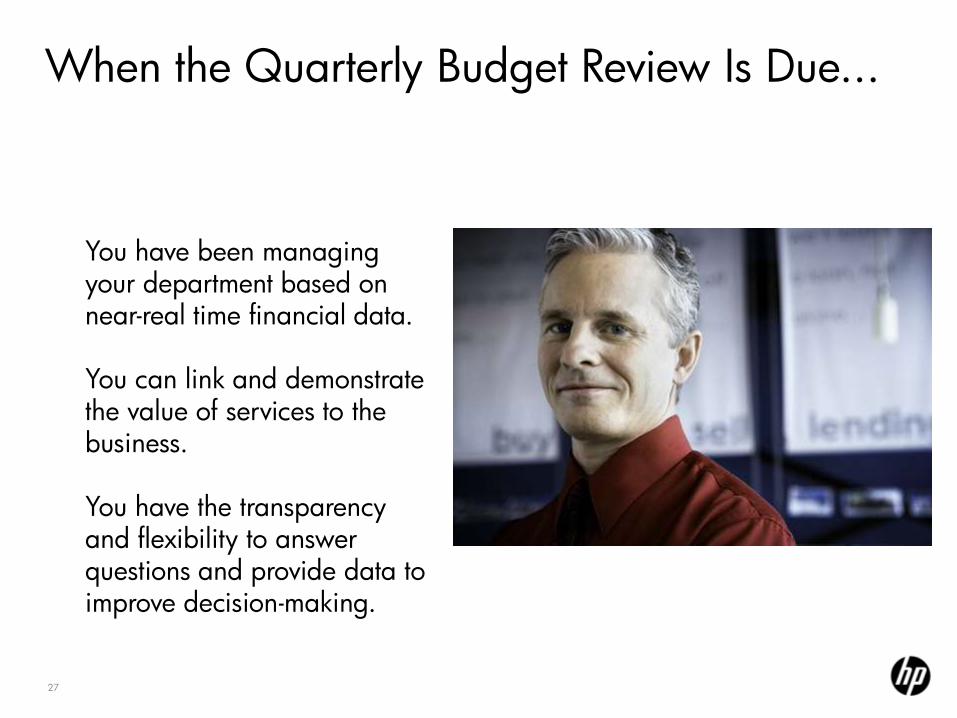
27
You have been managing your department based on near-real time financial data.
You can link and demonstrate the value of services to the business.
You have the transparency and flexibility to answer questions and provide data to improve decision-making.
When the Quarterly Budget Review Is Due...

28
What Is ITFM?
IT Financial Management (ITFM) plans, accounts and
controls spending on resources used in providing IT
services aligned to business entities.
―The aim of Financial Management for IT Services is to give accurate
and cost effective stewardship of IT assets and resources used in
providing IT Services. It is used to plan, control and recover costs
expended in providing the IT Service negotiated and agreed to in the
Service Level Agreements (SLA).‖ (ITIL V3)

29
IT Financial Framework
•Budgeting
•Forecasting
• Value Assessment
Planning Accounting Control
• Financial Accounting• Asset Management• Cost Management
• IT Spending Visibility
•Variance analysis
•Performance Management
•Reporting
A framework describes the processes of an industry or enterprise domain, and defines the boundaries and requirements for the business components and services which support those processes. Frameworks provide a common starting point for every organization from sales through delivery.

30
ITFM—Functional View
DemandManagement
CapacityManagement
PortfolioManagement
Forecasts•Cost Center•Service• Portfolio
Revenue & Expenses
•Cost Pools•Cost Center•Category•Object Code•Service•Portfolio
Budgets•Cost Center•Service•Portfolio
Cost ManagementCost DriversAllocation to ServicePrepare Chargeback Invoice
Asset CostsHW, SW, Supplies, ContractsBy Cost Center
AssetService
Visibility•Dimensions Drill Down•Dashboards•Green IT
Reporting-Standard-Custom
AnalysisVariance•Time•Measure•Scenario
Financial Management Process
ConfigurationManagement
Value•Cost Center•Service•Portfolio
AssetManagement
Financial Management Solution
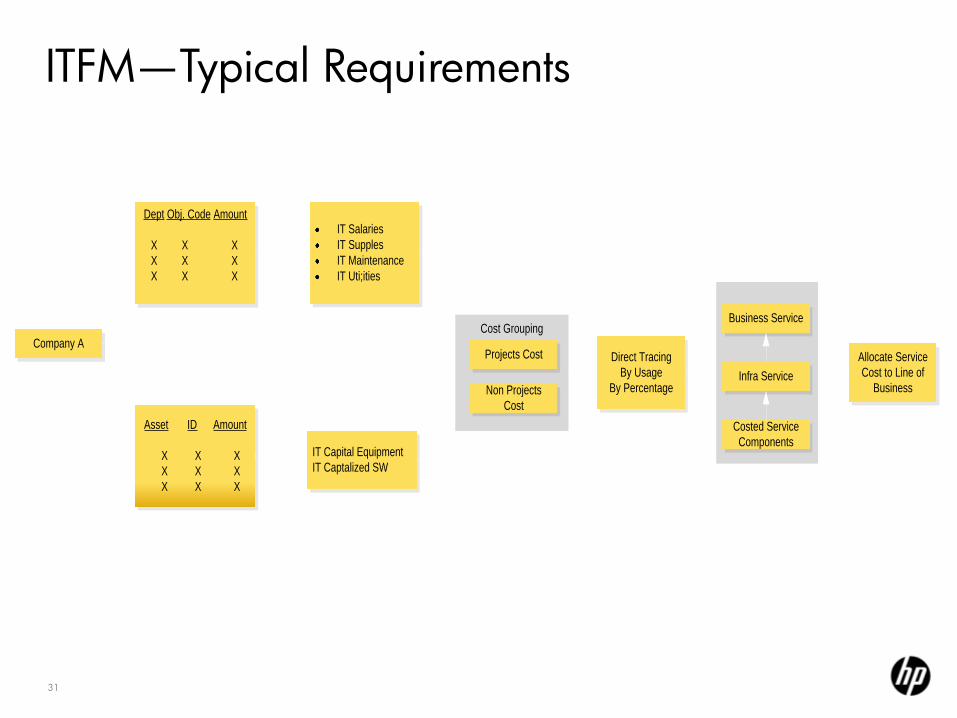
31
ITFM—Typical Requirements
Cost GroupingCompany A
Dept Obj. Code Amount
X X X
X X X
X X X
IT Salaries
IT Supples
IT Maintenance
IT Uti;ities
IT Capital Equipment
IT Captalized SW
Projects Cost
Non Projects
Cost
Business Service
Asset ID Amount
X X X
X X X
X X X
Operating Exp
Capital Exp
Object Code Description
Infra Service
Direct Tracing
By Usage
By Percentage
Allocate Service
Cost to Line of
Business
Costed Service
Components
Allocation Method
Cost Objects
Service Cost
Objects

32
UCMDB
Services and Relationships
PPM
AM
FPA
Demand Management
Project Management
Asset Financials
Allocation Engine
Order Service
BRM
Data: Project, Resource Costs , Planned/Actual(ETL)
1 2
4
People LegendCM… Configuration ManagerBRM…Business Relationshp ManagerPPM…Project Portfolio ManagerPM...Project ManagerAM…Asset ManagerFA…Financial Analyst
Portfolio Management
PPM
Product LegendUCMDB… Universal CMDBPPM…Project Portfolio ManagerAM…Asset ManagerFPA…Financial Planning and Analysis
AM
FA
ITFM End to End Solution
CM
Cost Explorer
Data: Asset Cost, Asset BudgetBusiness Services (ETL)
Data: Business Services
1 n
Interaction Legend
Process Step…
Allocate Costs By Standard and Usage to Service
DDM
ITAM Trusted Sources Data: CI Data
DDMi
Business Services and
AssetsDashboard
OLAP Engine: Reports By Dimension
Add Portfolio Item
3 Add Project w/resource and cost details
Data: Projects, Services
Relate Assets, Costs and Services
5
PM6
7
Consolidate Costs

33
SM
Services and Relationships
PPM
AM
FPA
Demand Management
Project Management
Asset Financials
Allocation Engine
Order Service
BRM
Data: Project, Resource Costs , Planned/Actual(ETL)
1 2
4
People LegendCM… Configuration ManagerBRM…Business Relationshp ManagerPPM…Project Portfolio ManagerPM...Project ManagerAM…Asset ManagerFA…Financial Analyst
Portfolio Management
PPM
Product LegendSM… Service ManagerPPM…Project Portfolio ManagerAM…Asset ManagerFPA…Financial Planning and Analysis
AM
FA
ITFM End to End Solution
CM
Cost Explorer
Data: Asset Cost, Asset BudgetBusiness Services (ETL)
Data: Business Services, Infrastructure Services, CIs
1 n
Interaction Legend
Process Step…
Allocate Costs By Standard and Usage to Service
DDM
ITAM Trusted Sources Data: CI Data
DDMi
Business Services and
AssetsDashboard
OLAP Engine: Reports By Dimension
Add Portfolio Item
3 Add Project w/resource and cost details
Data: Projects, Services
Relate Assets, Costs and Services
5
PM6
7
Consolidate Costs
UCMDB

34
HP BTO Data Model (BDM): Conceptual ModelBusiness Enablement
Application & Services
Software
Infrastructure
Facilities
IT Processes
Opera
tions
Financi
al/
Ass
et
PM
OD
eve
lopm
ent
DependsOn
DependsOn
LocatedAt
Virtualzes
RunsOn
InstalledOn
Business Activity
Business Service Business Process
SLA HasA DependsOn
Business
TransactionApplication
Contains
Infrastructure
Service
Running Software InstalledSoftware
Web Server Database Application ServerHypervisor
Realizes
Cluster SoftwareMessaging Server
Node
Node Element
Contains
Interface File SystemLogical Volume
Communication
End Point
Cluster
Mounts
IP AddressCluster Resource
Group
Fail Over Cluster
isBoundTo
Physical Port Hardware Board
Application
System
DirectorySystem
Location
Incident
Problem
Change
KPI
Request For
Change
CostCenter
Asset
Purchase Order
CostCategory
..
Project
Resource
Skill Set
..
Defects
..
Area of future development=
34
HP Proprietary & Confidential

35
ITFM Services
Solution Discovery Workshop
An Assessment and Roadmap Service
Service Costing Consulting Service
Creating a Cost Model :
Identify Service Model Define Cost ObjectsChoose DriversChoose Data SourcesDesign to Requirements
Technology Implementation
Service
Implementation:
Install FPAIntegrate AM and
PPM with FPAConsider other Data SourcesExtend ETL as
needed

36
hp.com/go/itfm
Questions?

37 ©2010 Hewlett-Packard Development Company, L.P.
To learn more on this topic, and to connect with your peers after
the conference, visit the HP Software Solutions Community:
www.hp.com/go/swcommunity

38