It Feels Like We™re Thinking: The Rationalizing Voter and ...
74
It Feels Like Were Thinking: The Rationalizing Voter and Electoral Democracy Christopher H. Achen Department of Politics and Center for the Study of Democratic Politics Princeton University Princeton, NJ 08544 [email protected] Larry M. Bartels Department of Politics and Woodrow Wilson School of Public and International A/airs Center for the Study of Democratic Politics Princeton University Princeton, NJ 08544 [email protected] Prepared for presentation at the Annual Meeting of the American Political Science Association, Philadelphia, August 30-September 3, 2006. Copyright by the American Political Science Association. August 28, 2006
Transcript of It Feels Like We™re Thinking: The Rationalizing Voter and ...

It Feels Like We�re Thinking: The RationalizingVoter and Electoral Democracy
Christopher H. AchenDepartment of Politics and
Center for the Study of Democratic PoliticsPrinceton UniversityPrinceton, NJ [email protected]
Larry M. BartelsDepartment of Politics and
Woodrow Wilson School of Public and International A¤airsCenter for the Study of Democratic Politics
Princeton UniversityPrinceton, NJ [email protected]
Prepared for presentation at the Annual Meeting of theAmerican Political Science Association, Philadelphia,August 30-September 3, 2006. Copyright by the
American Political Science Association.
August 28, 2006

Abstract
The familiar image of rational electoral choice has voters weighing the com-peting candidates� strengths and weaknesses, calculating comparative dis-tances in issue space, and assessing the president�s management of foreigna¤airs and the national economy. Indeed, once or twice in a lifetime, anational or personal crisis does induce political thought. But most of thetime, the voters adopt issue positions, adjust their candidate perceptions,and invent facts to rationalize decisions they have already made. The im-plications of this distinction� between genuine thinking and its day�to�daycounterfeit� strike at the roots of both positive and normative theories ofelectoral democracy.

The primary use of party is to create public opinion.
� Philip C. Friese (1856, 7)
Cognitive Consistency, Partisan Inference, and Is-
sue Perceptions1
The rise of scholarly interest in �issue voting�in the 1960s and �70s prompted
concern about the implications of partisan inference for statistical analyses
of the relationship between issue positions and vote choices. The spatial
theory of voting (Downs 1957; Enelow and Hinich 1984) cast �issue prox-
imity�as both the primary determinant of voters�choices and the primary
focus of candidates�campaign strategies. The proliferation of issue scales in
the Michigan (later, National Election Study) surveys provided ample raw
material for naïve regressions of vote choices on �issue proximities� calcu-
lated by comparing respondents� own positions on these issue scales with
the positions they attributed to the competing candidates or parties.
The ambiguity inherent in empirical relationships of this sort was clear to
scholars of voting behavior by the early 1970s. Brody and Page (1972) out-
lined three distinct interpretations of the positive correlation between �issue
proximity�and vote choice. The �rst, �Policy Oriented Evaluation,�corre-
sponds to the conventional interpretation of issue voting �prospective voters
observe the candidates�policy positions, compare them to their own policy
preferences, and choose a candidate accordingly. The second, �Persuasion,�
involves prospective voters altering their own issue positions to bring them
into conformity with the issue positions of the candidate or party they favor.
The third, �Projection,� involves prospective voters convincing themselves
that the candidate or party they favor has issue positions similar to their
1We wish to thank the Department of Politics and the Woodrow Wilson School atPrinceton University for research support. Colleagues in the Center for the Study ofDemocratic Politics, both faculty and students, provided helpful advice and criticism.Markus Prior let us see some of his unpublished �ndings from experiments. We alsothank Toby Cook and Dorothy McMurtery for helping us think about how personal life�histories a¤ect political views.
1

own (and, perhaps, also that disfavored candidates or parties have dissimilar
issue positions) whether or not this is in fact the case.
Having laid out persuasion and projection as alternatives to the standard
interpretation of issue voting, Brody and Page (1972, 458) wrote:
The presence of these two �alternate�processes in the electoral
system makes it inappropriate to declare policy-oriented evalu-
ations the cause of the correspondence between issue proximity
and voting behavior. We need some means for examining the
potential for �persuasion�and for �projection�and of estimating
them as separate processes.
They proposed simultaneous equation estimation procedures employing
�independent causal factors� identi�ed on the basis of our theories of be-
havior and our knowledge about the act of voting. However di¢ cult it is to
specify such causal factors, that is exactly where the problem is. If the esti-
mation of policy voting is important to the understanding of the role of the
citizen in a democracy �and theorists of democracy certainly write as if it
is �then any procedure which fails to control for projection and persuasion
will be an undependable base upon which to build our understanding.
Brody and Page�s clear warning was followed by some resourceful at-
tempts to resolve the causal ambiguity they identi�ed (Jackson 1975; Markus
and Converse 1979; Page and Jones 1979; Franklin and Jackson 1983). Un-
fortunately, those attempts mostly served to underline the extent to which
the conclusions drawn from such analyses rested on fragile and apparently
untestable statistical assumptions. Perhaps most dramatically, back-to-back
articles by Markus and Converse (1979) and Page and Jones (1979) in the
same issue of the American Political Science Review estimated simultaneous
equation models relating partisanship, issue proximity, and assessments of
candidates�personalities using the same NES data, but came to very di¤er-
ent conclusions about the bases of voting behavior. If two teams of highly
competent analysts asking essentially similar questions of the same data
could come to such di¤erent conclusions, it seemed clear that the results of
2

simultaneous equation estimation must depend at least as much on the an-
alysts�theoretical preconceptions and associated statistical assumptions as
on the behavior of voters. Pending stronger theory or better data, the search
for causal order in voting behavior seemed to have reached an unhappy dead
end.
In the face of this apparent impasse, most scholars of voting behavior
have adopted a simple expedient� reverting to single-equation models of
vote choice, but with sample mean perceptions of the candidates�issue po-
sitions substituted for respondents�own perceptions (e.g., Aldrich, Sullivan,
and Borgida 1989; Erikson and Romero 1990; Alvarez and Nagler 1998).
This approach has the considerable virtue of reducing biases due to projec-
tion. On the other hand, it sacri�ces a good deal with respect to theoretical
coherence, since it is very hard to see how or why voters would compare their
own issue positions to sample mean perceptions of the candidates�positions,
ignoring their own perceptions of the candidates�positions. Moreover, this
approach does nothing to mitigate biases due to Brody and Page�s (1972)
persuasion e¤ect; to the extent that voters adopt issue positions consistent
with those of parties or candidates they support for other reasons, they will
still (misleadingly) appear to be engaged in issue voting.
Recent work by Lenz (2006) examining the basis of apparent priming
e¤ects suggests that persuasion may play a large role in accounting for ob-
served correlations between issue positions and vote choices. Using panel
data from a variety of cases in which previous analysts found (or could have
found) apparent priming e¤ects, Lenz showed that increases in the strength
of the relationship between issue positions and vote intentions were driven
almost entirely by the subset of respondents who learned the candidates�
issue positions between survey waves. Moreover, the increased consistency
between their own issue preferences and their vote intentions was mostly
due to shifts in their issue positions to match their vote intentions, not to
shifts in their vote intentions to match their issue positions. For example,
in the 2000 presidential campaign, people who supported investing Social
Security funds in the stock market and then learned the candidates�posi-
tions on that issue became no more likely than they had been to support
3

George Bush; but people who supported Bush and then learned the can-
didates�positions became signi�cantly more likely to favor investing Social
Security funds in the stock market. As with earlier work by Abramowitz
(1978), Lenz�s work provides much more evidence of vote-driven changes
in issue positions� persuasion� than of issue-driven changes in candidate
preferences.
In this paper, we take up the topic of voter rationalization, aiming to
give it a more nuanced and rigorous foundation by tying it to Bayesian
models of voter rationality. In most respects, our theoretical agenda is very
much in the spirit of Feldman and Conover (1983), who proposed what they
referred to as �an inference model of political perception.�They noted that
the patterns of rationalization typically interpreted as re�ecting cognitive
dissonance reduction could also be interpreted as rational inference in the
face of uncertainty:
Rather than being motivated by a need to reduce inconsistency,
people may simply learn that certain aspects of the social and
political world are, in fact, constructed in a consistent fashion . . .
[I]n the absence of information to the contrary, an individual�s
assumption that certain types of consistency exist may be an
e¢ cient way of perceiving the world.
Feldman and Conover (1983, 813) noted that �a theoretical focus on
cognitive inference provides more than just a reinterpretation of consistency
e¤ects; it suggests a basis for developing a more general explanation of po-
litical perception.�Their more general explanation involved accounting for
perceptions of candidates�issue stands by reference to a variety of plausibly
relevant political cues, including respondents�own issue positions and their
perceptions of political parties and ideological groups. In subsequent work
(Conover and Feldman 1989) they put a similar framework to particularly
striking e¤ect in accounting for the crystallization of perceptions of Jimmy
Carter over the course of the 1976 presidential campaign. Using panel data
gathered over the course of the election year, they showed that most people
were quite uncertain of Carter�s issue positions during the primary season,
4

but shifted markedly toward associating him with the positions of the De-
mocratic Party after he became the Democratic nominee.
Unlike Feldman and Conover, our focus is on a single potential source
of political cues: party identi�cation. On the other hand, we explore the
rami�cations of partisan inference for a variety of politically relevant percep-
tions, including matters of fact, perceptions of issue proximity, and people�s
own positions on speci�c political issues. Our model of rationalization sug-
gests that all of these politically relevant perceptions should be subject to
essentially similar processes of partisan inference.
Our approach also di¤ers from Feldman and Conover�s in drawing more
explicitly upon the logic of Bayesian updating to structure our model of par-
tisan inference. Feldman and Conover (1983, 817) stressed the importance
of prior beliefs and noted that �the adjustment or change in the prior beliefs
resulting from the perception of new information may be slight�in the case
of well-known candidates and more substantial in the case of candidates who
are relatively unknown. However, for any given candidate they represented
issue perceptions as a linear function of the various relevant political cues
provided by parties, ideological groups, and the respondents�own issue posi-
tions. In contrast, we derive a model of partisan inference in which Bayesian
updating implies theoretically and politically signi�cant non-linearities.
The resulting non-linear model bears important mechanical similarities
to the non-linear model of issue perceptions proposed by Brady and Snider-
man (1985). In their model, people attribute policy positions to political
groups in an e¤ort to balance two distinct psychological objectives: a desire
for accuracy and �a strain to consistency�between perceptions and feelings
(Brady and Sniderman 1985, 1068). On one hand, people are assumed to
want to minimize the distance between their perception of the group�s posi-
tion and the group�s actual position. On the other hand, they are assumed
to want to minimize the distance between their perception of the group�s
position and where they would like the group to stand, given their own pol-
icy position and their general attitude toward the group. As a result, their
perception represents a weighted average of the group�s actual and hoped-for
positions.
5

Perceptions in our model may likewise be interpreted as weighted aver-
ages of components representing reality and partisan considerations. How-
ever, we di¤er from Brady and Sniderman in thinking of the latter as re-
�ecting Feldman and Conover�s process of �cognitive inference�rather than
the sort of �wishful thinking�suggested by Brady and Sniderman�s a¤ective
language. Our perceivers draw upon partisan considerations in an e¤ort to
improve the accuracy of their perceptions, not in an e¤ort �to bring percep-
tions in line with feelings�(Brady and Sniderman 1985, 1068).
The Model
Our model of voter inference makes the following assumptions (following
Achen 1992; Bartels 2002; and others):
� At time n; a citizen is inferring two things � his expected future netutility di¤erence between the parties un+1 (which may be interpreted
in a stable party system as party identi�cation) and second, his esti-
mated net di¤erence � between the parties on some new issue, mea-
sured on a survey item scale common to all respondents.
� The citizen�s current PID un is a weighted average of k previous issuescale scores �j : un =
Pkj=1 �j�j ; where the �j convert the scale scores
to utilities. The conventionPkj=1 �j = 1 sets the utility units:
2 Thus
un corresponds to the citizen�s average partisan balance on the �rst k
issues, weighted by the importance of the issue. It is thus scored on
the same scale as the issue scales.
� Before considering the new issue, the citizen knows that at the nextperiod his actual new utility will be un+1 = un + �k+1�k+1, and he
wishes to estimate this quantity as accurately as possible. Since only
�k+1 and �k+1 appear in the following discussion, we denote them
simply by � and �:
2These �issues� might include economic retrospections, parental socialization, andother factors. As an analytic simpli�cation, we treat all the old �j (j � k) as known.
6

� At time n; the citizen begins with his posterior distribution from the
previous period for the utility di¤erence on the old issues. The pos-
terior is normally distributed with mean un and variance !2n > 0.
� On the new issue �, apart from any relationship to his PID, the citizen�sprior is � v N(�0; �20): This prior may not be entirely uninformative,as when the citizen uses past experience on related issues to forecast.
(�I don�t know what the current de�cit is, but it�s usually getting
worse, so I�ll guess that it�s gotten worse lately, too.�) The citizen
may also have encountered some reported information about this issue
�y, with likelihood �y v N(�; �2=n); where �2 is known. We interpret
�2 as the variance in the reports themselves, while n is the amount of
communication the citizen has received.3 We assume that �20 >> �2;
so that if substantial information about the new issue is known to the
citizen, it rapidly swamps the prior. However, some issues may be
hard to learn about, making the prior relevant for all but the most
informed respondents.
� The citizen also has to learn the relevance of the new issue to his par-tisanship. Let = �� un: Thus the parameter measures �partisandeviance�: The larger it is, the less similar is the scale score of the new
issue to the citizen�s PID. Since political parties organize the political
issues, the variance of across issues, denoted �2; is relatively small.
However, the citizen has to learn that. Based on his experience that
most topics in life do not correlate with partisanship, he begins with
a prior �2 v ��2k0 (s20), in which s
20 is large. In addition, the citizen
may have experience with the deviation of k other issues from parti-
sanship, summarized by the likelihood statistic s2 v �2k�1( �2): By
standard Bayesian arguments, this prior and likelihood yield a poste-
3Even if the reports are purely factual, subjective variance in the utility of the issuemight arise from a variety of sources. The citizen may be concerned that elites with viewsdi¤erent from his own are inadvertently or deliberately misleading him, or the �facts�might be urban legends or reporting errors. Reported facts might also be correct butirrelevant to partisan utility calculations, as would occur if WMDs are absent from Iraqbut have been hidden in Syria, as some Republican survey respondents currently believe.
7

rior for �2 v ��2k0+k�1(�2k); where �
2k = [k0s
20+(k� 1)s2]=(k0+ k� 1).4
Thus as the citizen gets more information k, typically more weight in
the posterior will be placed on the smaller number s2; meaning that
political issues are seen as tied more closely to partisanship. Thus the
citizen�s mean estimate of partisan relevance for issues will rise.
� The citizen may also have some direct personal information �x about�; with �x v N(�; s2=m), such as having had an abortion herself whenshe answers a question about abortion or being gay when the topic is
gay marriage: In such cases, s2 may be very small, and this personal
information may swamp everything else. For most citizens thinking
about most political issues, however, their only information is derived
from the statements of other people and groups, so that they have
no direct personal information and m = 0: Hence we set aside this
information source for now.
� Finally, all these distributions are taken to be jointly independent:Sampling errors on other issues are not correlated with those on the
current issue, for instance, and an issue with, say, an unusual true
mean does not disturb the citizen�s random sampling to learn about
it. Similarly, priors are independent across parameters.
Now the citizen needs to estimate what he should think about the utility
balance on the new issue �: Second, he needs to estimate what his new
estimated PID un+1 should be.
We proceed in four steps:
1. As an estimate of �; un is approximately unbiased with a posterior vari-
ance of !2n+ �2k; where as before, �
2k = [k0s
20+ (k� 1)s2]=(k0+ k� 1):
(That is, the �rst term of the variance is the error in estimating the
4This likelihood would result if the citizen has taken a sample of k prior issues, eacha draw from a normally distributed sample of issues whose utility is centered at the truepartisanship u; and then had computed s2 =
P(�j � ��)2=(k � 1); where �� is the mean of
the �j and where E(�j) = u: We adopt this approximation, recognizing that for a varietyof reasons including parental socialization, partisanship is not identical in practice to themean of a citizen�s issue views.
8

true un; and the second is the variance of � around un: Those two er-
rors are independent and so the variances add.) The statement holds
approximately because we have conditioned on the mean of the pos-
terior for �2 rather than integrating it out from the joint distribution
with u.5
2. Hence to this order of approximation and by the usual Bayes normal
theory with known variances, the citizen�s best estimate of his position
on the issue is:
�j�y � �0=�20 + un=(!
2n + �
2k) + n�y=�
2
(1=�20) + 1=(!2n + �
2k) + (n=�
2)(1)
With a common prior, and for a �xed level of information and PID
strength, this equation gives current issue position as a linear function
of the prior issue mean �0; the PID un; and issue information �y. Note
that if partisan deviance �2k falls quickly with information, the weight
on un will rise more rapidly than that on �y: Hence when the poorly
informed prior is neutral but the new information �y di¤ers from par-
tisanship, the relationship between issue opinion and information will
be curvilinear: �rst neutral, then tending toward the partisan posi-
tion, then �nally turning away from partisanship toward the value of
the new information.
3. For the citizen�s best estimate of his new PID, we need to incorporate
both the weighting � and the posterior variance of �, and similarly for
un: Taking the previous Equation (1) as exact and using standard
Bayesian calculations (see appendix) gives:
un+1j�y = un + �(�j�y) +(!2n � ��2=n)(�y � un)!2n + �
2k + �
2=n(2)
This equation expresses the cross-lagged regression of current PID on
5The same result follows to the same degree of approximation from the formal Bayesianapproach of considering the joint distribution of un and �; and then integrating out themarginal distribution for �:
9

lagged PID and the new issue. Note that even if � = 0 (nothing about
the new issue itself is incorporated into future PID), the coe¢ cient on
lagged PID is not necessarily unity nor the coe¢ cient on the issue zero.
Particularly if �2k is small (high partisan relevance), the new issue is
informative about partisanship even if it does not a¤ect PID directly.
Furthermore, setting �un+1 = un+1j�y � un; we obviously have:
�un+1 = �(�j�y) +(!2n � ��2=n)(�y � un)!2n + �
2k + �
2=n(3)
so that for a �xed level of information and PID strength, the change in
PID from the prior period depends linearly on two things� �rst, the
new issue position, and second, the deviation of the new information
about the issue from the prior PID.
4. The citizen�s best estimate of the old issues is also updated (see ap-
pendix).
Some intuition about these mathematical results can be obtained by
looking at extreme cases. Assuming that k and n rise with more informa-
tion, we have the following results, beginning with the least informed voters
and proceeding to the most informed:
No PID, no information Here n = 0; and �2k � 1. Hence from Equa-
tion (1), the voter responds with the vague prior mean �0:
PID present, little information or partisan relevance Then k and nare small, making �2k large, and so the prior �0 will matter. There
will be relatively little rationalization even though the voter needs
help knowing what to think about the issue, and PID will be virtually
unchanged. Thus su¢ ciently poorly informed partisans will not di¤er
much in their opinions from similarly uninformed partisans.
PID and partisan relevance, no issue information Then (!2n+ �2k) is
much smaller than �20, and n = 0: It follows that � � un and un+1 �
10

un: Thus nearly the entire issue response is rationalization, and PID
is almost completely undisturbed.
Strong PID and partisan relevance, some information Then !2n and
�2 are small, and if they are jointly su¢ ciently smaller than �2=n, then
un will dominate the evaluation of the issue and also the revised PID.
Partisanship will be largely retained and rationalization will be sub-
stantial, even though the voter is fairly well informed. This case ap-
plies particularly to those issues where the partisan relevance is more
easily learned than the issue information, e.g., when the name of the
president or his party is mentioned as part of the question.
High information Here n and k are both large, but since �2k is bounded
below and !2n is �xed at time n, n eventually dominates. Hence the
voter reports something close to �y as his opinion, and updates his PID
toward �y by an amount dependent on how much he cares about the
issue (�)and the malleability of his PID (!2n).
Very high concern, high information (race?) Then � ! 1 and n �1: It follows that in the limit, � = y and un+1 = y: (Partisan relevancedoes not matter asymptotically, though it can speed the updating when
present.) Thus asymptotically, the only force at work is a (dramatic)
rational updating of PID, and no rationalization of the issue position
occurs. Less dramatically, people who care more will update PID
more, as will those who have more information.
Partisan Inference and Perceptions of Fact
In principle, the processes of inference we have identi�ed should a¤ect per-
ceptions of issues, candidates, and a wide variety of other political objects.
However, the workings and implications of our model may be illustrated
most clearly in the context of purely factual perceptions, where we have
some hope of discerning the impact of a shared reality transcending the
partisan inferences that color di¤erent individuals�views. Thus, we begin
11

our empirical analysis by applying our model of inference to straightforward
perceptions of fact.
It is worth noting that very few politically consequential facts are sub-
ject to direct, personal veri�cation. If an ordinary citizen is asked whether
the president is a crook, whether the unemployment rate is 4% or 8%, or
whether a distant regime possesses weapons of mass destruction, her re-
sponse will re�ect a judgment cobbled together from various more or less
pertinent and trustworthy sources, including news accounts, water-cooler
conversation, campaign propaganda, and folk wisdom about the way the
world works. It will be perfectly rational for her assessment of the inherent
plausibility of alternative states of the world to be based, in part, on how
well they square with her partisan predispositions.
Put in these terms, partisan inference sounds like a helpful heuristic �
and sometimes it is a helpful heuristic. However, we believe it is unwise
to jump from the premise that relying on inference processes is �rational
in the sense of cutting costs and making a best guess about reality� to
the conclusion that �the general contribution of inference processes to vote
choice is a positive one�(Feldman and Conover 1983, 837). When partisan
inferences pertain to matters of subjective value, it is hard to know how
one might weigh the bene�ts and costs of constructing a logically consistent
worldview. By observing the process of partisan inference at work in the
realm of purely factual matters, we can see more clearly whether and how
it actually contributes to the development of accurate perceptions.
We consider two factual questions included in the 1996 National Election
Study survey.6 One asked respondents whether �the size of the yearly budget
de�cit increased, decreased, or stayed about the same during Clinton�s time
as President?�The correct answer was that the budget de�cit had declined
dramatically during Clinton�s �rst term �by more than 90%. However, as
the survey responses summarized in Table 1 make clear, only one-third of
the public recognized that the de�cit had decreased, while 40% said it had
6Data from the NES surveys employed here, along with information about thedesign and implementation of the studies, are available from the NES website,http://www.electionstudies.org.
12

increased. Republicans were especially clueless: half said that the de�cit
had increased, while only one-fourth said that it had decreased.7
*** Table 1 ***
Responses to the budget de�cit question are unusually well-suited to
shed light on the processes of political rationalization that are our focus
here. First, the question is straightforwardly factual; it would be very hard
to argue that Republicans and Democrats have di¤erent views about the
meaning of the phrase �yearly budget de�cit�or di¤erent standards for as-
sessing whether the de�cit had increased or decreased. Thus, any di¤erence
in responses must logically be attributable to some process of rationalization
or partisan inference rather than to di¤erences in ideologies or values. Sec-
ond, the actual trend in the budget de�cit was well-publicized, and remark-
ably clear during this period: after increasing substantially under George H.
W. Bush, the de�cit shrank steadily and substantially during Clinton�s �rst
term �from $255 billion in FY 1993 to $203 billion in FY 1994, $164 billion
in FY 1995, $108 billion in FY 1996, and $22 billion in FY 1997.8 Third,
because the 1996 NES survey included some respondents �rst interviewed in
1992, it is possible to categorize these people, as we have in Table 1, on the
basis of partisan predispositions established before Clinton even took o¢ ce,
thus ruling out the possibility that their partisanship was an e¤ect rather
than a cause of their perceptions about the budget de�cit.
For purposes of comparison, we also examine responses to another factual
question in the 1996 NES survey, which asked respondents whether �over the
past year the nation�s economy has gotten better, stayed the same or gotten
worse?�Responses to this question are summarized in Table 2. Here there
seems to have been somewhat more consensus than on the budget de�cit,
with more than three-quarters of the respondents saying that the economy
was somewhat better or the same. The responses also seem to be a good deal
7Here and elsewhere, we classify �leaners�on the traditional NES 7-point party iden-ti�cation scale as independents rather than as partisans.
8The very next question in the 1996 NES survey provides a good example of a factualquestion for which the correct answer is far from obvious. The question asked whether�the federal income tax paid by the average working person has increased, decreased, orstayed about the same during Clinton�s time as President?�
13

more accurate than for the budget de�cit question. Real disposable personal
income per capita grew by 1.8% in 1996, while real GNP per capita increased
by 2.5%; the unemployment rate was 5.4%. All of these �gures represented
improvements over the preceding year (1.6% real income growth, 1.4% real
GNP growth, and 5.6% unemployment) and over the average �gures for the
preceding decade (1.3% real income growth, 1.7% real GNP growth, and
6.2% unemployment.) Thus, while it would have been unduly pessimistic to
say that the economy had �stayed the same,�saying that it was �somewhat
better�would seem quite reasonable.
*** Table 2 ***
On the other hand, there is considerable evidence of partisan bias in the
responses summarized in Table 2, as there was in Table 1.9 Whereas half
the Democratic respondents said that the nation�s economy had improved,
only one-third of the Republicans did. Meanwhile, Republicans were almost
twice as likely as Democrats were to say that the economy had gotten worse.
Previous research has documented signi�cant partisan biases in a variety
of perceptions and evaluations of political �gures, issues, and conditions
(Fischle 2000; Bartels 2002a; 2002b; Erikson 2004). Thus, the fact that such
biases appear in Tables 1 and 2 should not be surprising. What we hope to
add here is a more detailed explanation of the nature of those biases derived
from our model of partisan inference. Since our model implies speci�c, non-
obvious principles for integrating objective information and partisan cues
in formulating judgments about the political world, it o¤ers some promise
of providing both a more accurate account and a deeper interpretation of
partisan biases.
A primary focus of our analysis is on the complex role of political infor-
mation in partisan inferences. While it may seem intuitive to suppose that
�Rationalization is probably greater for less-informed citizens�(Aldrich, Sul-
livan, and Borgida 1989, 132), recent work by Shani (2006) has provided a
good deal of evidence to the contrary. Her analysis of responses to a variety
9As in Table 1, our classi�cation of partisanship in Table 2 is based on responsesfrom the 1992 NES survey. Obviously, it is impossible for these responses to have beenin�uenced by perceptions of economic performance in 1996.
14

of factual questions produced �a clear bottom line: political knowledge does
not correct for partisan bias in perception of �objective�conditions, nor does
it mitigate the bias. Instead, and unfortunately, it enhances the bias; party
identi�cation colors the perceptions of the most politically informed citizens
far more than the relatively less informed citizens�(Shani 2006, 31).10
Our account of partisan inference implies that partisan predispositions
and political information are likely to interact in complicated ways in any
given case. For example, it suggests that well-informed Republicans should
be especially con�icted on the issue of the budget de�cit, since they were
most likely to be exposed to objective information about the dramatic down-
ward trend in the de�cit (larger n), but also most likely to recognize the rel-
evance of their broader political convictions for assessing the plausibility of a
dramatic improvement in the de�cit under a Democratic president (smaller
�2). The relative magnitude of these e¤ects is by no means obvious from
the model. Either one may dominate at di¤erent levels of information. It
turns out that they do.
Direct examination of how the responses of Republicans and Democrats
varied with levels of political information provides additional grounds for
caution. Figure 1 summarizes perceptions of the budget de�cit among Re-
publican and Democratic identi�ers (classi�ed on the basis of their responses
to the 1992 NES survey) with varying levels of political information.11 The
e¤ect of information within each partisan group is clearly non-linear, as is
the partisan bias represented by the gap in perceptions between the two
10Shani�s analysis included eight factual questions in the 2000 NES survey, includingthe budget de�cit and national economy questions examined here. In seven of the eightcases she found substantial (and statistically signi�cant) increases in partisan bias amongwell-informed respondents. These di¤erences were largely una¤ected by the introductionof statistical controls for di¤ering political values or plausible demographic correlates ofdi¤ering personal experiences.11The curves presented in Figure 1 are derived from locally weighted (lowess) regressions
using 30% of the data (50-60 survey responses) at each information level. Our measureof political information cumulates responses to a variety of factual questions (identifyingprominent political �gures, knowing which party controlled Congress, and so on) in eachwave of the 1992-94-96 NES panel. Classifying respondents on the basis of party identi-�cation measured in 1996 produces very similar curves, suggesting that parallel analyseswith cross-sectional data are unlikely to go too far astray.
15

groups for any given level of information. This provides a sharp contrast
with most discussions of rationalization in the political science literature,
which almost uniformly assume monotonic relationships� the more of X,
the more of Y. Explicit theorizing demonstrates the limitations of intuition
and directs attention to those aspects of the data where surprises can be
found.
*** Figure 1 ***
Among the least well-informed respondents, neither objective reality nor
partisan bias seems to have provided much structure to perceptions of the
budget de�cit. Uninformed Republicans and Democrats were slightly, and
about equally, more likely to say that the de�cit had increased than that it
had decreased. Perhaps this tendency re�ects a murky understanding that
the budget de�cit increased at some point in the past; perhaps it is a bit
of prejudice based on folk wisdom. In any case, the views of Republicans
and Democrats diverge as we move from the bottom to the middle of the
distribution of political information; partisan inference seems to dominate
throughout this range, since the widening gap owes at least as much to
Republicans moving further from the objectively correct answer as to De-
mocrats moving closer to it. The pull of objective reality only begins to
become apparent among respondents near the top of the distribution of po-
litical information. Among the best-informed 10 or 20% of the public, even
Republicans were slightly more likely to say that the de�cit had decreased
than that it had increased, and Democrats �untroubled by any contradic-
tion between the facts and their partisan expectations �were very likely to
recognize at least some decrease.
Figure 2, which summarizes the interaction of partisanship and political
information for perceptions of the national economy, provides a rather di¤er-
ent picture. As in Figure 1, there appears to be rather little structure in the
perceptions of very uninformed people. The average perceptions of the most
informed partisans are also fairly similar in the two �gures, with Democrats
quite likely to recognize an improvement and Republicans close to the neu-
tral midpoint of the scale. However, the patterns between these extremes
show little similarity. Perceptions of the national economy generally display
16

less evidence of partisan bias among relatively uninformed people, but as
much or more evidence of partisan bias among those in the upper half of
the distribution of political information. For Democrats, the most notable
learning seems to have occurred around the middle of the information scale,
rather than in the upper third of the scale as in Figure 1. For Republicans,
the marked non-monotonicity evident in Figure 1 is entirely absent from
Figure 2, except for a slight downturn in perceptions at the very top of the
information scale.
*** Figure 2 ***
To what extent can these complexities in the responses to the budget
de�cit and national economy questions be accounted for by our mathemat-
ical model of partisan inference? If we take n and k as proportional to
Information and 1=!2n as proportional to Age, and if we denote E(�y) (the
judgment of informed opinion) by Actuality (measured on the same scale
as PID), then the nonlinear regression equation implied by Equation (1) is
approximately:
Opinion =A+ PID/(B0 +B1=Age +B2=Info)+ C(Info)
DActuality
1 + 1=(B0 +B1=Age +B2=Info)+ C(Info)D
(4)
This setup assumes that �no information�is coded zero.
Table 3 presents the results of our non-linear regression analyses of re-
sponses to the budget de�cit and national economy questions using this
speci�cation. Each analysis includes six parameters capturing important
aspects of the model of inference set out in Equation (1). The �rst of these
parameters, A, corresponds to the prior belief �0 in Equation (1), expressed
on the same scale as the observed survey responses.12 B0, B1, and B2 rep-
resent the variance (!2+�2) of the partisan inference based on un. Since we
expect the uncertainty of partisanship, !2, to decline with age, we include
the reciprocal of age with weight B1. Similarly, since we expect uncertainty
about the relevance of partisanship, �2, to decline with information, we
12Since multiplying each of the variance terms �2; !2; �2, and �2 in Equation (1) by anarbitrary constant would leave � unchanged, we normalize the model by setting �2 equalto 1.0.
17

include the reciprocal of information with weight B2.13
*** Table 3 ***
The constant weight B0 is intended to capture other sources of uncer-
tainty in partisan inferences, including prior uncertainty about � , k0s20; and
any o¤sets necessitated by our simple operationalizations of the age and
information e¤ects.14 In light of our model, we expect B1 and B2 to be
positive; in addition, logical consistency requires that the overall variance
(B0 + B1/Age + B2/Information) be positive.15 Finally, the parameters C
and D capture the extent to which better-informed people hear and compre-
hend a greater volume of information about the value of �. The parameter
C represents the greater exposure of better-informed people to the �ow of
information represented by n (or, more precisely, n�2/�2) in Equation (1),
while the parameter D allows for non-linearity in the relationship between
the �ow of information on a particular issue and our general measure of
political information. We rescale the information scores to range between 0
and 1; thus, the impact of information always ranges from 0 for the least
informed people to C for the most informed people, regardless of the value
of D. However, lower values of D imply more learning at lower information
levels, while higher values of D imply that learning is concentrated near the
top of the information scale.
Our estimation strategy also requires us to specify a priori an appro-
13We attempted to estimate the functional form of the relationship between politicalinformation and the partisan relevance parameter �2 using an exponential speci�cationsimilar to the one employed for the relationship between political information and thelearning parameter n. However, our data were uninformative about the precise form ofthis relationship: the estimated exponent was 1.64 with a standard error of 2.40. In lightof this uncertainty, and for the sake of simplicity, we dropped the exponent, leaving us withreciprocal speci�cations for the e¤ects of both age and information on partisan inference.14For example, our simple reciprocal functional form implies that the uncertainty of
partisanship declines by the same amount between the ages of 20 and 25 as between theages of 50 and 100. If younger people learn more quickly or more slowly than this, relativeto older people, the inaccuracy of our speci�cation will be partly absorbed in B0:15All of the parameter estimates reported below satisfy this logical constraint for every
respondent, with one exception. The parameter estimates in the third column of Table3 imply a slightly negative estimated partisan variance for one respondent. He was inthe 99th percentile of the information distribution, 21 years old in 1992, and a strong(Republican) partisan.
18

priate value for �y, which represents the relevant content of the objective
information to which citizens were exposed.16 In the case of the budget
de�cit question, the fact that the de�cit declined by more than 90% during
President Clinton�s �rst term obviously implies that the objectively correct
response was �decreased a lot,� corresponding to a value of +50 on our
budget de�cit scale. Thus, our model implies that each respondent�s per-
ception of the budget de�cit will be some weighted average of the constant
(but unknown) prior belief A, her partisan predisposition (ranging from -50
for strong Republicans to +50 for strong Democrats), and the objectively
correct value +50.
The parameter estimates presented in the �rst and third columns of
Table 3 are based on the subset of respondents in the 1996 NES survey
who were also interviewed in 1992, providing us with a baseline measure of
partisanship unclouded by any consideration of Bill Clinton�s performance
as president. The parameter estimates presented in the second and fourth
columns of the table are based on all the 1996 respondents, using their
partisanship as measured in 1996. While we doubt that the potential bias
in the latter approach is large enough to outweigh the greater precision due
to having more than twice as many respondents, we present both sets of
parameter estimates for purposes of comparison.
For the question about the budget de�cit, the primary di¤erence between
the two sets of results presented in the �rst and second columns of Table 3
is that the weight attached to partisanship varied more with age and infor-
mation for partisanship measured in 1992 than for partisanship measured in
1996. In other respects, the results are quite similar. In both sets of results,
there is a fairly modest but clear negative bias evident in prior beliefs about
the budget de�cit; absent any other considerations, people�s perceptions
tended to fall about halfway between the �stayed about the same�and �in-
creased a little�responses. In both sets of results, older and better-informed
people seem to have relied more heavily on their partisan predispositions
16 In principle, we could attempt to estimate �y along with the other parameters of ourmodel. In practice, however, �y and C are so nearly collinear that we see little hope ofpersuading our data to distinguish between them.
19

to gauge the de�cit�s trajectory than younger and less-informed people did.
And in both sets of results, the actual trajectory of the budget de�cit clearly
received some weight from well-informed respondents. The estimates of C
imply that people who scored at the top of the information scale gave the
positive reality (+50 on our 100-point scale) about 50% more weight than
the negative prior belief (-10 or -13). However, the large positive estimates
for the exponent D imply that the weight of reality increased very slowly
over most of the range of our political information scale: for example, the
implied weight for people at the midpoint of the scale was less than half of
one percent of the implied weight for people at the top of the scale, while
the implied weight for people in the 80th percentile of the distribution of
information was less than 20% of the implied weight for people at the top
of the scale. These results suggest quite strongly that very little real infor-
mation about the trajectory of the budget de�cit reached people below the
very top reaches of our information scale.
Figure 3 provides a graphical representation of the extent to which the
NES respondents seem to have incorporated the actual trajectory of the
budget de�cit into their responses to the question asking whether the de�cit
increased, decreased, or stayed the same during Clinton�s �rst term. For each
respondent, the �gure shows the relative weight of real information implied
by the parameter estimates in the �rst column of Table 3. For respondents
in the bottom two-thirds of the distribution of political information this
weight is e¤ectively zero. For those in the upper third of the distribution it
ranges upward to almost one-half.17
*** Figure 3 ***
Figure 4 provides a similar graphical representation of the extent to
which respondents based their perceptions of the budget de�cit on their par-
tisan predispositions. As with the weights for reality, the range of weights
here is from close to zero to about one-half. However, the distribution of
17The variation in weights for respondents at the same information level re�ects theimpact of age on the complementary weights attached to partisanship through the B1parameter. The estimates imply that older respondents at each information level attachmore weight to partisanship, and thus less weight to real information about the budgetde�cit.
20

weights is quite di¤erent. For one thing, the estimated weights are much
more variable at any given point on the information scale, re�ecting the sub-
stantial impact of age on the apparent precision of partisan predispositions.
In addition, whereas reality seems to have had virtually no e¤ect on the
responses of people in the bottom two-thirds of the information scale, many
of these people �especially in the middle third of the scale �attached ap-
preciable weight to partisanship in formulating their views about what had
happened to the budget de�cit.18 On the other hand, the average relative
weight of partisanship was actually less for people near the top of the in-
formation scale �those who responded appreciably to the actual trajectory
of the budget de�cit �than for those in the upper-middle range. People in
the latter group seem to have known enough to recognize the relevance of
their partisan predispositions for formulating responses to a question about
how the budget de�cit changed under President Clinton, but not enough to
recognize how the budget de�cit actually did change.
*** Figure 4 ***
Finally, we note that our non-linear model accounts for responses to the
budget de�cit question better than an analogous linear regression model
employing the same explanatory variables and the same number of parame-
ters.19 It also captures much of the non-linearity evident in the relationship
between partisanship, political information, and perceptions of the budget
de�cit in Figure 1. That fact is evident from Figure 5, which compares the
average predicted responses implied by the parameter estimates in the �rst
column of Table 3 with the actual average responses of Republicans and
18The average estimated weights for people in the bottom third of the information scaleare 10% for partisanship and 0.002% for reality. The corresponding estimates for peoplein the middle third of the information scale are 21% for partisanship and 1.1% for reality.In each case, the remaining weight was attached to the general prior prejudice representedby the parameter A in Table 3.19The standard error of the non-linear regression (with six parameters) presented in the
�rst column of Table 3 is 27.47, and the R2 statistic is .13; the corresponding averageerror in the same dependent variable for a linear regression including party identi�cation,age, political information, and interactions between party identi�cation and age and partyidenti�cation and political information (and a constant, for a total of six parameters) is28.44, with an R2 statistic of .09. The other three non-linear regression models presentedin Table 3 also produce better �ts to the data than analogous linear regression models.
21
Democrats at each point on the information scale. There is some indication
here that our non-linear model understates the extent of partisan inference
among Republicans in the middle portion of the information scale and (cor-
respondingly) the steepness of the upturn in the top third of the information
scale. However, the model does seem to account with reasonable accuracy
for the non-obvious patterns in the data.
*** Figure 5 ***
The parameter estimates presented in the third and fourth columns of
Table 3 are derived from applying the same non-linear model to percep-
tions of the national economy in the 1996 NES survey. Again, we must
specify an appropriate value for �y, the content of the objective information
about national economic conditions available to the NES respondents. As
we suggested above, available economic indicators suggest that the economy
in 1996 was �somewhat better�than it had been a year earlier; thus, we set
�y equal to +25.20
As with perceptions of the budget de�cit, we report separate results us-
ing 1992 partisanship (for respondents �rst interviewed in 1992) and 1996
partisanship (for both panel and fresh cross-section respondents in the 1996
survey). As with perceptions of the budget de�cit, using the contemporane-
ous measure of partisanship reduces the apparent variation among respon-
dents in the inferential weight of partisanship. However, in other respects
the two sets of results are generally similar.
As with perceptions of the budget de�cit, the estimates of the prior belief
parameter A suggest that there was a slight pessimistic bias in perceptions
of the state of the economy. However, the parameter estimates for parti-
20We examined the implications of this assumption by repeating the analysis reported inthe third column of Table 3 with a variety of di¤erent values of �y. Higher values (implyingthat objective economic conditions were better than �somewhat better�) improved the �tof the model; but these improvements were so slight (reducing the average error by no morethan one-tenth of one percent) that we see no reason to abandon our a priori judgmentregarding the substantively appropriate value of �y. For readers who may disagree, we notethat the main e¤ect of adopting a higher value of �y is to reduce the apparent impact ofobjective information on perceptions of national economic conditions. That should not besurprising, since the perceptions reported in Table 2 are, on average, overly pessimisticeven by comparison with our �somewhat better�standard.
22

san inference suggest a considerably larger information e¤ect (B2) and a
considerably smaller (indeed, slightly negative) age e¤ect (B1) for percep-
tions of the national economy by comparison with perceptions of the budget
de�cit. Finally, and more importantly, the information e¤ects implied by
the estimated values of the C and D parameters are markedly di¤erent for
the two questions. Information had a fairly modest impact on perceptions
of the budget de�cit, and that impact was highly concentrated among the
best-informed respondents. By comparison, information about the actual
state of the economy seems to have di¤used much more broadly through the
public. On one hand, the much larger value of the C parameter suggests
that the weight of reality for the best-informed respondents was considerably
greater than in the case of the budget de�cit. On the other hand, the much
smaller value of the D parameter suggests that less-informed respondents
absorbed a much larger fraction of available information than in the case of
the budget de�cit.
The implications of these di¤erences are very evident in Figure 6, which
plots the implied weight of reality in perceptions of the national economy
by information level using the parameter estimates in the third column of
Table 3. The contrast with the analogous pattern in Figure 3 is striking.
Whereas the actual trajectory of the budget de�cit had virtually no impact
on the perceptions of people below the top reaches of the information scale,
the actual state of the national economy appears to have had a substantial
impact on all but the least-well-informed respondents. For people at the
middle of the scale, the estimated weight of reality is almost exactly equal
to the estimated weight of uninformed prior beliefs; by comparison, for the
same people on the budget de�cit question uninformed prior beliefs received
more than 100 times as much weight as the actual trajectory of the budget
de�cit.
*** Figure 6 ***
The apparent weight of reality in Figure 6 increases almost linearly over
most of the information scale, but declines noticeably among people in the
top quartile. The explanation for that decline is suggested by Figure 7,
which provides a similar graphical representation of the extent to which re-
23

spondents based their perceptions of the national economy on their partisan
predispositions. Here there is a noticeable upturn among the best-informed
respondents corresponding to the noticeable downturn in Figure 6. Again,
the contrast with the pattern for the budget de�cit is striking. Figure 4 sug-
gested that the relative weight of partisanship on perceptions of the budget
de�cit peaked among moderately well-informed respondents, but declined
as the weight of reality increased among those at the very top of the scale.
For perceptions of the national economy, Figure 7 suggests a generally sim-
ilar pattern, but with an upturn rather than a downturn among people in
the top quartile of the distribution of political information.21 One plausible
explanation for this di¤erence is that the national economy question made
no explicit reference to partisan politics or to President Clinton, requiring
respondents to supply that connection themselves in order to bring partisan
inferences to bear. On the other hand, the budget de�cit question asked
about �Clinton�s time as President,� which may have encouraged people
below the top reaches of the political information scale to connect their
responses to their partisan predispositions.
*** Figure 7 ***
The Rami�cations of a Partisan Shock: Reactions
to Watergate
Having examined partisan inferences in a particularly simple setting where
inferences focus on straightforward matters of fact, we turn next to doc-
umenting the impact of partisan inferences on a broader constellation of
political perceptions. Our model implies that people�s views about a wide
range of speci�c political issues will be signi�cantly in�uenced by their parti-
san predispositions. Unfortunately, cross-sectional data can shed little light
on this hypothesis, since partisanship may be in�uenced by more speci�c
21A comparison of Figures 4 and 7 also clearly shows less variation in the estimatedweight of partisanship among respondents at any given information level for perceptions ofthe national economy than for perceptions of the budget de�cit. This di¤erence re�ects themuch smaller impact of age on partisan inferences about the national economy (capturedby the parameter B1 in Table 3).
24

political views as well as in�uencing them. Even panel data may be of lit-
tle help, since both partisanship and speci�c political views are likely to be
quite stable over months or even years, aside from measurement error. And
when they do change, considerable care is required to provide cogent causal
interpretations for those shifts (Miller 2000).
In an e¤ort to make headway in the face of these inferential di¢ culties,
we focus here on an unusually dramatic sequence of political events that
upset the existing equilibrium between partisanship and speci�c political
views �the Watergate scandal. Fortuitously, for our purposes, the scandal
was largely unrelated to substantive political issues of the day; there was no
obvious reason, aside from partisanship, for people�s responses to Watergate
to be related to their views about school busing or government employment
programs. Equally fortuitously, a large-scale NES panel survey bracketed
the major events of the Watergate era, allowing us to observe how a variety
of speci�c political views evolved in response to the escalating scandal, be-
ginning with the run-up to the 1972 presidential election, continuing in the
immediate aftermath of President Nixon�s resignation in 1974, and ending
with the 1976 election cycle.
Our model implies that if PID changed due to some external opinion
shock unrelated to opinion on a second issue, then updating on the second
issue will occur via the e¤ect of PID on opinion. The latter e¤ect will be
small for those with low information (because they did not hear about the
shock or did not grasp its partisan relevance). The impact of PID will be
larger for those with more information.22
Our aim is to demonstrate that the shock to established partisan attach-
ments created by the Watergate scandal reverberated in just the way our
model suggests it should have. People�s views about a variety of speci�c
issues changed in ways that were statistically related �albeit logically un-
related �to their attitudes about the scandal. Moreover, these e¤ects were
concentrated among people who were especially well-informed about politics
22Only on issue such as abortion, where many well informed people have substantialpersonal information, would we expect no issue movement. The issues we consider do nothave that character.
25

� in the top third of the distribution of political information. Those who
responded most negatively to Watergate moved signi�cantly to the left, and
saw themselves signi�cantly closer to the Democratic Party, on a variety of
issues by 1976.
The 1974 NES survey included a variety of questions tapping respon-
dents� reactions to the Watergate scandal, including whether they were
pleased or displeased by Nixon�s resignation,23 whether they viewed the
House Judiciary Committee�s impeachment hearings as fair or unfair,24
whether the media�s coverage of Watergate was fair or unfair,25 and whether
the president�s resignation was good or bad for the country.26 We use re-
sponses to these four questions to construct a simple additive scale of Water-
gate attitudes, with scores ranging from -50 (for the most extreme pro-Nixon
responses to all four questions) to +50 (for the most extreme anti-Nixon re-
sponses to all four questions). The scale has a mean value of 20.1, a standard
deviation of 26.9, and an alpha reliability coe¢ cient of .68.
Not surprisingly, reactions to the Watergate scandal were shaped in sig-
ni�cant part by pre-existing partisan attachments. The mean Watergate
scale value (in 1974) for people who had called themselves strong Repub-
licans in the fall of 1972, when the origins of the break-in were still quite
murky and the broader outlines of the scandal were not yet evident, was
0.6; the corresponding mean value for people who called themselves strong
Democrats in 1972 was 29.3. On the other hand, there was also a good deal
of variation in responses within each partisan camp. For example, almost
one-third of the people who were strong Republican identi�ers in 1972 had
23�Thinking back a few months to when Richard Nixon resigned from o¢ ce, do youremember if you were pleased or displeased about his resignation, or didn�t you care verymuch one way or the other?�24�As you probably know, before Richard Nixon resigned, the Judiciary Committee was
holding hearings to decide whether he should be impeached, that is, brought to trial inthe Senate for possible wrongdoings. Would you say that these hearings were very fair,somewhat fair, somewhat unfair, or very unfair, or didn�t you pay much attention to this?�25�How fair would you say that the television and newspaper coverage of the Nixon
administration�s involvement in the Watergate a¤air was? Would you say it was very fair,somewhat fair or not very fair, or didn�t you follow this very closely?�26�Do you think that President Nixon�s resignation was a good thing or a bad thing for
the country?�
26

Watergate scale values below -20 in 1974, while another one-third had scale
values above 20. Thus, it should be possible to distinguish the speci�c e¤ects
of reactions to Watergate from more general partisan di¤erences.
We begin by examining the impact of Watergate attitudes on perceptions
of relative proximity to the Democratic and Republican parties on a variety
of political issues included in the 1972-74-76 NES panel �a summary liberal-
conservative scale,27 government jobs and income maintenance,28 school bus-
ing,29 rights of accused criminals,30 and government aid to minorities.31 We
focus on these issues because self-placements and party placements were
included in the 1972-74-76 NES panel.32
In order to test our assertion that partisan inferences should be con-
centrated among people su¢ ciently well-informed to recognize the poten-
tial rami�cations of their partisan predispositions, the analyses reported in
Table 4 are limited to respondents in the upper third of the overall dis-
27�We hear a lot of talk these days about liberals and conservatives. I�m going to showyou a 7-point scale on which the political views that people might hold are arranged fromextremely liberal to extremely conservative. Where would you place yourself on this scale,or haven�t you thought much about this?�28�Some people feel that the government in Washington should see to it that every
person has a job and a good standard of living. Others think the government shouldjust let each person get ahead on his own. And, of course, other people have opinionssomewhere in between. Where would you place yourself on this scale, or haven�t youthought much about this?�29�There is much discussion about the best way to deal with racial problems. Some
people think achieving racial integration of schools is so important that it justi�es busingchildren to schools out of their own neighborhoods. Others think letting children go totheir neighborhood schools is so important that they oppose busing. Where would youplace yourself on this scale, or haven�t you thought much about this?�30�Some people are primarily concerned with doing everything possible to protect the
legal rights of those accused of committing crimes. Others feel that it is more importantto stop criminal activity even at the risk of reducing the rights of the accused. Wherewould you place yourself on this scale, or haven�t you thought much about this?�31�Some people feel that the government in Washington should make every possible
e¤ort to improve the social and economic position of blacks and other minority groups.Others feel that the government should not make any special e¤ort to help minoritiesbecause they should help themselves. Where would you place yourself on this scale, orhaven�t you though much about it?�32Our research design requires that we be able to compare responses before and after
the Watergate scandal. In addition, the fact that these items were included in all threewaves of the NES panel facilitates estimation of the statistical reliability of the responses.
27

tribution of political information.33 Our parameter estimates are derived
from errors-in-variables regression models, using estimates of the reliability
of each explanatory variable within this high-information group.34 To facili-
tate interpretation of the results, we also present precision-weighted averages
of the parameter estimates across all �ve issues.
*** Table 4 ***
The �rst row of parameter estimates in Table 4 represents the impact of
Watergate attitudes on changes in perceived issue proximity among highly
informed respondents. The dependent variable in each case is perceived
relative proximity in 1976 (ranging from -50 for people who perceived the
Republican Party�s position as identical to their own and the Democratic
Party�s position at the opposite end of the 7-point scale to +50 for people
who perceived the Democratic Party�s position as identical to their own
and the Republican Party�s position at the opposite end of the scale). The
explanatory variables include the same relative issue proximity in 1972, party
identi�cation in 1972, and Watergate attitudes.35
The positive parameter estimates for Watergate attitudes indicate that,
as expected, people who reacted especially strongly to the scandal tended
to see themselves as closer to the Democratic Party, and further from the
33This division of the sample partly re�ects our sense of the di¢ culty of the partisaninferences we are attempting to document here. However, it also represents a practicalconcession to the limitations of the NES data. Less-informed people were less likely toanswer the issue questions we are analyzing here, and they were signi�cantly more likelyto drop out of the panel between 1972 and 1976. Thus, a more natural-looking division ofthe sample into two equal halves would leave too few usable cases in the bottom half toprovide any realistic hope of �nding Watergate e¤ects among less-informed people even ifthey existed.34For Watergate attitudes, our estimates of reliability are the alpha reliability coe¢ cients
derived from the correlations among responses to the four distinct survey items comprisingour Watergate scale. For party identi�cation, perceived issue proximity, and respondents�own issue positions, our estimates of reliability are derived from the correlations amongresponses to each item in the three waves of the NES panel using the measurement errormodel proposed by Wiley and Wiley (1970).35We include lagged party identi�cation to allow for the possibility that partisan pre-
dispositions in place by the time of the 1972 survey produced partisan rationalization onspeci�c issues between 1972 and 1976. However, since our model does not specify the tim-ing of the inferential processes we posit, we have no strong reason to expect such e¤ects.In contrast, the timing of the Watergate scandal virtually ensures that its e¤ects, if any,will be visible within the compass of the four-year NES panel.
28

Republican Party, on every issue by 1976. On the other hand, people who
were relatively sympathetic to President Nixon in the immediate wake of
his resignation tended to see themselves increasingly close to the Republi-
can Party and far from the Democratic Party.36 These estimates are fairly
consistent across the �ve issues for which data are available, and in three
of the �ve cases they are too large to be plausibly attributable to sampling
error. Moreover, the implied e¤ects are large enough to be politically con-
sequential. For example, a di¤erence of 35 points on the Watergate scale �
roughly the di¤erence between respondents at the 25th and 75th percentiles
of the distribution �would correspond to a reduction in perceived distance
from the Democratic Party of between two and six points on each of the
100�point issue proximity scales. (By comparison, the average total shifts
on these scales from 1972 to 1976, including measurement error, ranged from
11 to 17 points.)
The changes in perceived issue proximity documented in the top panel
of Table 4 could be attributable to either or both of the two processes of
rationalization distinguished by Brody and Page (1972). On one hand, new
(or more committed) Democrats may have projected their own issue pref-
erences onto the party, while viewing Republican positions with a more
dispassionate, or even actively critical, eye. On the other hand, they may
have been persuaded to change their own issue positions, bringing them into
closer alignment with their revised partisan sensibilities. The bottom panel
of Table 4 focuses speci�cally on the latter possibility, estimating the impact
of Watergate attitudes on respondents�own positions on the various issue
scales included in the 1972-74-76 NES panel. The dependent variable in
each case is respondents� issue positions in 1976, coded to range from -50
for the most conservative position on the 7-point scale to +50 for the most
36The negative intercepts in these regression models imply that people with scores of zeroon the Watergate scale generally saw themselves as increasingly close to the RepublicanParty by 1976. That may seem odd, given that the Democratic presidential nominee in1972 was widely viewed as being more ideologically extreme than usual. However, it isworth bearing in mind that a score of zero on the Watergate scale actually represents arelatively sympathetic response; only one-�fth of all respondents, and only half of strongRepublicans, had negative scale values.
29

liberal position. The explanatory variables include the same issue position
in 1972, party identi�cation in 1972, and Watergate attitudes.
Here, too, there is surprisingly strong evidence that Watergate attitudes
reverberated in seemingly unrelated corners of the political landscape. Those
respondents who were most critical of Nixon gravitated to the left on gov-
ernment job guarantees, the rights of accused criminals, and school busing,
while those who sympathized with him (or were critical of his critics in
Congress and the media) became more conservative on those issues. As
with the shifts in perceptions of issue proximity, the magnitudes of these
shifts are considerable; a di¤erence of one standard deviation in Watergate
attitudes translated into a di¤erence of from two to six points in the vari-
ous 1976 issue positions. (By comparison, the average total shifts on these
scales from 1972 to 1976, including measurement error, ranged from 12 to
25 points.)37
Table 5 provides analogous parameter estimates for respondents in the
bottom two-thirds of the distribution of political information. In marked
contrast to Table 4, there is very little evidence here of partisan inferences
in the wake of the Watergate scandal. For perceptions of issue proximity
(in the top panel of Table 5), only one of the �ve separate estimates (for
school busing) is comparable in magnitude to the average estimated e¤ect
for well-informed respondents, and it is perversely negative. The average
estimated e¤ect for all �ve issues is almost exactly zero. For respondents�
own issue positions (in the bottom panel of the table), there is one sizable
positive estimate (for aid to minorities), but the average estimated e¤ect
across all �ve issues is only about one-third as large as the corresponding
average estimated e¤ect for people in the high-information stratum, and
even that e¤ect is too imprecisely estimated to be considered reliable.
37As the parameter estimates for 1972 issue positions in Table 4 make clear, well-informed respondents� views about government jobs were considerably less stable thantheir views about other issue positions between 1972 and 1976. We interpret this instabil-ity as re�ecting a shift in the debate about whether the government should try to provideevery person with �a job and a good standard of living,� from McGovern�s controversialproposal to give $1000 annual grants to every man, woman, and child in 1972 to discussionsof more modest public works programs in 1976.
30

*** Table 5 ***
In short, just as our formal model suggests, less-informed people seem
to have lacked the contextual knowledge necessary to translate the partisan
shock of Watergate into partisan inferences about the seemingly unrelated
issues we have examined here. Unlike people in the high information group,
those in the low information group apparently saw no reason to revise their
understanding of speci�c political issues in response to the unmaking of the
president.
The most obvious potential objection to the evidence presented in Tables
4 and 5 is that the same people who were most a¤ected by the Watergate
scandal might have become more liberal between 1972 and 1976 for en-
tirely other reasons. Reactions to the scandal were correlated with a variety
of characteristics beyond partisanship and ideology; for example, better-
educated people were especially pleased to see President Nixon go, whereas
southerners were somewhat more critical than non-southerners were of the
House Judiciary Committee and the news media. If better-educated people
were becoming more liberal during this period, or southerners were becom-
ing more conservative, their views about Watergate may have been only
spuriously related to those ideological shifts. To assess that possibility, we
replicated the regression analyses presented in Tables 4 and 5 including a
variety of demographic characteristics � including age, education, income,
race, region, gender, marital status, home ownership, union membership,
and church attendance �as additional control variables. The key results of
these elaborated analyses are presented in Table 6, along with the parallel
results from Tables 4 and 5.38
*** Table 6 ***
The results presented in Table 6 generally con�rm those presented in
Tables 4 and 5. Not surprisingly, the parameter estimates from the elabo-
rated regression models are somewhat less precise than those presented in
the earlier tables. Nevertheless, both the magnitude and the consistency of
our apparent Watergate e¤ects hold up nicely in the presence of these exten-
sive demographic controls. As in the simpler analyses presented in Table 5,38Complete results of these analyses are available from the authors.
31

there is rather little evidence here of changes in issue positions or perceived
issue proximity among people in the bottom two-thirds of the distribution of
information about the political world. Our data are not su¢ ciently powerful
to rule out the possibility that these relatively uninformed people engaged
in partisan inference to some modest extent. For the most part, however,
the contextual grasp of politics necessary to make an inferential leap from
Watergate to economic and social policy seems to have eluded them.
On the other hand, as in the simpler analyses presented in Table 4, there
is a good deal of evidence in Table 6 that well-informed people changed both
their perceptions of issue proximity and their own views about a variety of
logically unrelated issues in response to the Watergate scandal. If anyone
had asked these well-informed citizens to explain the changes in their think-
ing about school busing or government employment programs, we suspect
that they would have provided rationalizations of exactly the sort posited
by Rahn, Krosnick, and Breuning (1994, 592), �mentioning reasons that
sound rational and systematic and that emphasize the object being evalu-
ated, while overlooking more emotional reasons and factors other than the
object�s qualities.� The overlooked factor in this case, we argue, was the
exogenous partisan shock of a Republican president�s disgrace and forced
resignation. The observable rami�cations of that exogenous partisan shock
among politically attentive people were surprisingly broad and consistent,
and thus provide considerable empirical support for the theory of partisan
inference we have set out here.
The Dynamics of Abortion Attitudes
In 1973, a divided U.S. Supreme Court ruled that American states could
not forbid a woman to have an abortion during the �rst trimester of her
pregnancy. The Court also decided that states could regulate abortion
during the second trimester and could forbid it during the �nal three months.
This famous case, Roe v. Wade, and related judgments rati�ed what many
states had already done (Rosenberg, 1991), but were well ahead of public
opinion in others.
32

Liberalized abortion laws set o¤ a backlash among cultural and moral
traditionalists, including many conservative Catholics, but eventually em-
bracing many Protestant evangelicals as well (Hanna 1979, chap. 5; Balmer
2000). A counter�mobilization by abortion liberals ensued. Bitter strug-
gles in courts and legislatures began, along with struggles to win over public
opinion.
Initially, the Democratic and Republican parties were both internally
divided on the issue. However, the legal battles began to polarize the
leadership and activists of the political parties in the late Seventies and early
Eighties (Adams 1997; Carmines and Woods 1997). The 1976 Republican
platform, with some wa ing, began to lean in the pro�life direction, and
the 1980 version clearly declare its opposition to abortion. Subsequent
GOP platforms strengthened the language.39 By the late Nineties, the
abortion opinions of ordinary Democrats and Republicans diverged as well.
For example, in the Youth�Parent Socialization Panel Study (Jennings and
Niemi 1991) of people who were high school seniors in the spring of 1965 , the
correlation between abortion attitudes and party identi�cation was only .07
in 1982, but it rose to .22 in 1997. Among the best�informed citizens during
the same period, the correlation rose from .04 to .36.40 (A broad�ranging
391976: �The Republican Party favors a continuance of the public dialogue on abortionand supports the e¤orts of those who seek enactment of a constitutional amendment torestore protection of the right to life for unborn children.�1980: �While we recognize di¤ering views on this question among Americans in general�
and in our own Party�we a¢ rm our support of a constitutional amendment to restoreprotection of the right to life for unborn children. We also support the Congressionale¤orts to restrict the use of taxpayers�dollars for abortion.�1984: �The unborn child has a fundamental individual right to life which cannot be
infringed. We therefore rea¢ rm our support for a human life amendment to the Con-stitution, and we endorse legislation to make clear that the Fourteenth Amendment�sprotections apply to unborn children. We oppose the use of public revenues for abortionand will eliminate funding for organizations which advocate or support abortion.�Subsequent years have used language close to that of 1984, with the most recent adding
a condemnation of �partial birth abortion.�40�Party identi�cation� is the seven�point Michigan scale. �Abortion attitude� is the
respondent�s choice among four alternatives ranging from forbidding abortion entirely toallowing abortion on demand. �Best�informed�denotes those who scored 5 or 6 on thesix�point interviewer�s assessment of political knowledge. Lastly, the original coding ofthe abortion scale was reversed: Here positive correlations indicate that respondents�abortion positions tend to be compatible with their PIDs.
33

review of the empirical research is Jelen and Wilcox 2003.)
Almost uniquely among issues, abortion attitudes are remarkably stable
over time. They easily stand comparison with party identi�cation, the cus-
tomary gold standard for attitudinal stability. In the Youth�Parent sample,
for example, party identi�cation correlates .63 between 1982 and 1997, while
abortion attitudes correlate at .59 over the same �fteen�year period. More-
over, among 935 respondents, just nine people lacked an abortion opinion
in 1982, and only twelve in 1997, remarkably low for political attitudes.
The number who lacked an abortion opinion at both time periods was zero.
Where abortion is concerned, the overwhelming majority of people know
what it means, they know what they think, and drastic change is rare. No
surprise, then, that as the parties have polarized on the issue, it has come
to play a prominent role in election campaigns. Catholic Democratic politi-
cians often face criticism from local bishops when they embrace pro�choice
positions.
Thus the causal link from abortion attitudes to voting and party ID
seems obvious to observers of American politics, and the many of the cus-
tomary tests seem to con�rm it (see the review in Jelen and Wilcox 2003,
294-296). However, as we explained earlier, these tests confound issue
voting and rationalization. Do people vote Republican because they are
conservative on abortion? Or are they conservative on abortion because
they are Republicans? No one doubts that there is some issue voting where
abortion is concerned, but how much after rationalization has been removed?
Few have considered the possibility that abortion attitudes are attitudes like
other attitudes, and thus are in�uenced by wishful thinking and cognitive
dissonance reduction.
Thus abortion raises an important challenge for those who want to ex-
plain the inter-relationship between party identi�cation and issues. Unlike
the factual questions we have discussed, abortion attitudes are not novel
subjects about which most citizens are only mildly informed. Nor are they
perceptions of candidate or party positions, where carefully cultivated am-
biguity by the objects of perception make rationalization easy. Instead,
abortion attitudes are well formed. Thus if we can �nd evidence that party
34

membership changes abortion attitudes, the argument of this paper will be
con�rmed in a challenging case. For that �nding would demonstrate that
people are taking ethical advice about well known, painfully di¢ cult moral
problems from politicians, hardly the customary source for wisdom of that
kind. And in turn if that is so, then the optimistic interpretation of learning
from party cues (as in Page and Jones 1979 or Feldman and Conover 1983)
would need serious rethinking.
Students of public opinion and voting behavior have been documenting
patterns of partisan inference for more than half a century. Berelson, Lazars-
feld, and McPhee (1954) showed that �social distance�colored perceptions
of group voting norms (chap. 5), that partisanship colored perceptions of
candidates� issue positions (chap. 10), and that exposure to like-minded
family members, friends, and co-workers reinforced partisan voting predis-
positions (chap. 7). (For the speci�c impact of party ID on issues, the
corresponding source is Cambell et al. 1960, especially chap. 6.) In re-
cent years, abortion attitudes have also been interpreted as caused in part
by party membership (Layman and Carsey 2001; Wilcox 2001). However,
prior work has used lengthy statistical speci�cations with all variables hav-
ing linear, additive e¤ects constant across individuals. While much can be
learned from explorations with such speci�cations, we argue here that the
causal e¤ects are di¤erent in di¤erent groups, not only in size but in shape.
Above all, they are not all linear. Hence a di¤erent statistical approach
is needed, one that relies heavily on the inferential structure provided by
model building.
Before beginning, we mention two considerations arising in studying
abortion attitudes. The �rst is that Catholics di¤er from other Christians
on this topic. The Roman Catholic Church has long opposed abortion, and
when Roe v. Wade was handed down, most Catholics were more conserva-
tive on the issue than the average Protestant. As evangelicals have taken
up the abortion issue, however, the average Protestant has moved somewhat
right and many Catholics well to the left, so that the two groups have now
become similar (Jelen and Wilcox 2003, 492). A well de�ned theological and
political left and right wing have developed within Catholicism, a division
35

that goes unmeasured in standard survey questions about denominational
membership. Divisions on abortion are correlated with departures from
Catholicism, making membership in the Catholic Church endogenous. (See
Figure 8.) Pro�life Catholics have dropped out of the Church, whether for
that reason or for reasons correlated with it. The consequence for our pur-
pose is that the causal paths for Catholic abortion attitudes are unique in
complex ways, and so we study only non�Catholics in the following graphs.
Catholics deserve a separate study.41
*******Figure 8*******
Second, even a cursory look at abortion attitudes quickly uncovers the
greater stability and coherence of women�s opinions relative to men�s. Even
among the best informed, women are more stable. In the 1992-1994-1996
NES panel study, for example, non�Catholic men who fall in the upper
30% of the population for general political knowledge have, according to the
Wiley�Wiley model for measurement error in over�time attitudes, abortion
attitudes with a reliability of .84. The corresponding reliability for well�
informed women is .97.42 Hence in the following tables, we analyze men
and women separately.
How can we sort out the direction of causation between abortion atti-
tudes and PID? Simultaneous equation estimation is not likely to work well
here for lack of suitable instruments. Cross�lagged regressions are also un-
appealing in this context (see Appendix 2). Hence we proceed di¤erently,
exploiting the implications of our model to get leverage.
Under our model, for an issue like abortion, where partisan divisions
became more salient during the Eighties, we should see greater movement
between parties among well informed women than among well informed
men, since in that case opinion a¤ects PID in proportion to how much the
41We found much weaker e¤ects of this kind for �neo�fundamentalist�denominations,as the Jennings�Niemi study characterizes them. To the extent that these denominationsoverlap with evangelical churches (and of course the two groups are related but quitedistinct theological categories), grouping evangelicals with other non�Catholics is saferstatistically than including Catholics. Similarly, although black Democrats sometimesexpress �rm pro�life attitudes, probably for reasons related in part to race, we found thatexcluding them generally made little di¤erence.42Gender di¤erences are smaller at lower levels of information.
36

citizen cares about the issue. By contrast, we should see changes to accord
with party position more among men than among women when both are
moderately informed, since women are better informed and better able to
resist the partisan rationalization. There should be little or no gender
di¤erence among the poorly informed.43
To illustrate our logic, we begin by setting out the simple bivariate re-
lationships between PID and abortion attitudes in the Parent�Child Social-
ization panel. Abortion opinions were not asked until the 1982 and 1997
waves, so we analyze those years exclusively. Figure 9 shows the percentage
of 1982 non�Catholic Republicans (strong or weak identi�ers on the classic
Michigan scale) who remained Republican in 1997, displayed as a function of
their 1982 abortion attitudes. Men and women are shown separately. The
two most conservative positions on the abortion scale (�never�and �rarely�)
have been combined because �never�is chosen by just 4% of this group.44
******Figure 9*******
The �gure suggests a simple interpretation: Both male and female Re-
publicans were more likely to leave the party if they held liberal abortion
views, but the issue was more important to women, they understood the
party�s stand better, and it a¤ected them more. The impact is not small.
Almost half of 1982 pro�choice non�Catholic Republicans had disappeared
from the party by 1997.
The importance of political knowledge can be seen in Figure 10, where
the same information is displayed, this time limited to those in the upper
30% of the political information scale.45 Here the sample sizes are small (41
43Note that our approach here is consistent with the model set out above. In theYouth�Parent dataset, everyone is the same age, which proxies for stability of PID !2n(Converse 1969). Hence if we examine homogeneous groups of citizens whose PID unis the same, and if we take partisan relevance �2k and information about abortion �
2 asmonotonic functions of general political knowledge, then Equation (1) for abortion opinionreduces to just a function of information levels.44There are 98 women and 87 men represented in Figure 13, roughly equally distributed
across the three categories of abortion opinion. This implies that as a rule of thumb,di¤erences between cells are statistically signi�cant at conventional levels when they reachseven percentage points or more.45We use the six�point information scale from the 1982 Parent�Child Socialization
Study.
37

men and 18 women), so that the results can be only tentative. However,
there is a suggestion here that well informed men act like the average women
when it comes to abortion: They see the connection to party and act
accordingly. This e¤ect is the �rst factor making the parties more consistent
internally on abortion.
******Figure 10*******
The more interesting question is the reverse e¤ect: How does party
membership a¤ect abortion attitudes? In particular, we would like to as-
sess whether moderately informed and well informed men (who are nonethe-
less more poorly informed than the corresponding women) behave like the
rationalizing Republicans assessing Clinton�s de�cit numbers we discussed
above. Women, on the other hand, should be more stable and less persuad-
able. Note that this is the reverse of the earlier �nding, in which women
were changing more than men.
With attitudes generally trending to the left in the society, those who
are already pro�choice in 1982 will tend to stay put. Republicans will face
two balanced forces� the society and their party�while Democrats will be
subject only to pro�choice pressures. Neither is likely to move very much.46
Thus the question can be addressed more easily among 1982 pro�life citizens,
where Democrats will tend to move away and Republicans to remain where
they were. Independents should be in the middle. And least obviously, if
our model is correct, the movement for Democratic men should be larger.
Of course, there will be some pseudo�movement due to measurement error,
so that no group will be entirely stable. But the basic pattern should hold.
Figure 11 shows opinion change to pro�choice views (�sometimes� or
�always�) among those with 1982 pro�life opinions (�never� or �rarely�),
expressed as a function of their 1982 party ID. The �gure shows exactly
what one would expect from the model: Democrats move away from their
old views the most, then Independent, and Republicans the least. Moreover,
the e¤ect is larger for men than for women, just as expected.47 Again the46There is some movement among 1982 pro�choice Republican women toward pro�life
positions by 1997, but we have not yet been able to determine whether this is more thanthe measurement error in their 1982 views averaging out in subsequent years.47There are few 1982 non�Catholic, non�African�American Democrats in the pro�life
38

e¤ects are not small. More than half of 1982 male pro�life Democrats had
become pro�choice by 1997. This e¤ect is the second factor explaining the
growing partisan division on abortion.
******Figure 11*******
In summary, the abortion data from one long�term panel show the pat-
terns expected from our model. Women know more about abortion and
care more. Hence when the parties diverge, they will disproportionately
tend to change their parties rather than their views. Well informed men
will act the same. Men as a whole, however, will have lower levels of infor-
mation and will be more susceptible to rationalization and thus to in�uence
by their parties. They will disproportionately tend to change their views
rather than their parties. Now of course, most people in each gender stay
put on both party and abortion views. And plenty of people in each gender
exhibit each pattern. But the disproportionate e¤ects are just what one
would expect if rationalization plays a large role
The Rationalizing Voter and Electoral Democracy
The literature on �heuristics� in political science is an odd stepchild of
the corresponding literature in psychology. Psychologists devote exhaustive
attention to the biases in judgment produced by reliance on identi�able
heuristics. For example, the classic collection of essays edited by Kahneman,
Slovic, and Tversky (1982) includes reports on �belief in the law of small
numbers,��shortcomings in the attribution process,��egocentric biases in
availability and attribution,��the illusion of control,�and �overcon�dence
in case-study judgments,� among other topics. It also includes a series of
essays on �corrective procedures� intended to mitigate the e¤ects of these
various biases and shortcomings.
Political scientists, on the other hand, typically view �heuristics� as a
boon to democracy, helping ordinary people �achieve a kind of rationality
categories� just 14 men and 14 women. Hence percentages for Democrats must be inter-preted with care. We hope to develop additional evidence in a subsequent draft, includinga modi�cation of our nonlinear model to cope with multiple stages of Bayesian updating.
39

generally adequate to the tasks of citizens,�as Kuklinski and Quirk (2000,
153-154) wrote in a penetrating critique of this literature. What accounts
for the disciplinary di¤erence? We suspect that it has much to do with the
fact that �the notion of a competent citizenry is normatively attractive. It
buttresses e¤orts to expand citizen participation and credits the citizenry for
some of American democracy�s success�(Kuklinski and Quirk 2000, 154).
The work we have reviewed here on the bases of political perceptions
conveys a good deal of enthusiasm for the �e¢ ciency,��consistency,��rea-
sonableness,�and �rationality�of the perceptions resulting from processes
of partisan inference. For example, Brady and Sniderman (1985, 1075) con-
clude their study of attitude attribution by acknowledging that
The mass public surely does not command much abstract knowledge of
politics and as a rule does not even pay much attention to it. It seems
implausible, therefore, to suppose that the general public is able, or at any
rate willing, to assemble complex cognitive hierarchies of political ideas. In
contrast, likes and dislikes are easy to form and, even more important, easy
to remember. Accordingly, a¤ect can be a quite e¢ cient way of encoding
and storing what is after all the most vital political information: who and
what one is for or against.
E¢ cient, perhaps. What is striking, though, is that Brady and Snider-
man have very little to say about the implications of this e¢ ciency for the
accuracy of people�s perceptions of the political landscape. At one point
(1985, 107) they assert that �the mass public is remarkably accurate in at-
tributing positions to strategic groups on major issues�; but this assertion
appears to refer to the average attributions of the public as a whole rather
than to the judgments of individuals. In any case, it is far from clear what
contribution, if any, their �likeability heuristic�makes to the accuracy of
issue perceptions.
Brady and Sniderman reported estimates of the relative weight of �like-
ability�from 34 separate regression models, each focusing on perceptions of
a particular group on a particular issue. Their results suggest that people�s
perceptions of disliked groups were relatively accurate, on average, but that
perceptions of favored groups were strongly biased by people�s desire to see
40

those groups as close to themselves. Indeed, for a typical favored group,
people�s own issue positions received about one-third as much weight as the
group�s actual position in shaping people�s perceptions of where the group
stood.48
It is worth emphasizing, too, that Brady and Sniderman�s results are
based on perceptions of very salient groups (liberals and conservatives,
blacks and whites, Republicans and Democrats) on major political issues
of the day. It seems safe to assume that projection e¤ects would loom
even larger for less familiar groups or candidates and for less prominent
issues. Indeed, an analysis along similar lines of perceived issue positions
of candidates in presidential primaries (Bartels 1988, 98-107) does suggest
even larger projection e¤ects, especially early in the primary season and
for candidates who are relatively unknown. For example, Bartels estimated
that Democrats in the 1984 primary campaign perceived frontrunner Walter
Mondale as about 20% closer, on average, to their own issue positions than
he really was; but the corresponding distortion for challenger Gary Hart was
about 40% at the beginning of the campaign, only gradually declining to a
similar 20% level. For people who were particularly enthusiastic about Hart,
for whatever reason, the estimated projection e¤ect was even larger. People
who gave Hart the warmest possible rating on the NES �feeling thermome-
ter�at the beginning of the primary season managed to see him as almost
75% closer than he actually was to their own issue positions.
More straightforward evidence of the consequences of partisan inference
appears in Figure 12, which provides a simple tabulation of the average per-
ceptions of issue proximity for Republicans and Democrats on the spend-
48Brady and Sniderman�s model includes two terms measuring projection: a �falseconsensus� e¤ect applying to all groups regardless of whether they are liked or disliked,and a �more focused, or partisan, e¤ect�pulling perceptions of favored groups toward one�sown position and pushing perceptions of disfavored groups away from that position. Theaverage magnitudes of Brady and Sniderman�s statistical estimates are .185 for the falseconsensus e¤ect and .550 for the di¤erential projection e¤ect. Assuming a di¤erence of 25points between favored and disfavored groups on the NES feeling thermometer (roughlythe observed average di¤erence between the groups Brady and Sniderman considered), thecombined e¤ect is minimal for disfavored groups (+.05) but considerable for favored groups(+.31) by comparison with the e¤ect of groups�actual positions, which is normalized to1.0.
41

ing/services scale in the 2004 NES survey.49 Obviously, if perceptions of the
parties�positions were unbiased, the curves in Figure 8 for Republican and
Democratic identi�ers would overlap perfectly. Instead, they are markedly
divergent, especially for people whose own positions do not happen to fall at
the midpoint of the 7-point scale. Even in the absence of any real knowledge
about where the parties actually stood on this issue, it is very clear from
the �gure that someone�s heuristics have gone badly astray.
*** Figure 12 ***
Table 7 provides a tabulation of the average perceived proximity for De-
mocrats, Independents, and Republicans at each point on the 7-point scale.
The partisan di¤erences between Democrats and Republicans, in the last
column of the table, range from one to six points, implying errors of percep-
tion for one or both parties�positions amounting to a considerable fraction
of the total length of the scale. As a result, even people who should have seen
marked con�icts between their own issue positions and their partisan attach-
ments seldom did. For example, Republican identi�ers who placed them-
selves in one of the two most liberal positions on the spending/services scale
still saw themselves as closer to the Republican Party than to the Demo-
cratic Party, on average, while Democratic identi�ers who placed themselves
in one of the two most conservative positions nevertheless saw themselves
as closer, on average, to the Democratic Party.50 Are biases of this sort
conducive to e¤ective electoral democracy? We see no reason to think so.
*** Table 7 ***
Not every issue produces errors in perception as large as those displayed
in Figure 12. It should not be surprising that the issue of abortion provides
a notable contrast in this respect. The impact of partisanship on percep-
tions of issue proximity for that issue is displayed in Figure 13, and the
corresponding tabulations of partisan di¤erences appear in Table 8. There
49�Some people think the government should provide fewer services, even in areas suchas health and education, in order to reduce spending. Other people feel that it is importantfor the government to provide many more services even if it means an increase in spending.Where would you place yourself on this scale, or haven�t you thought much about this?�50The average proximity scores for these groups are +.49 (with a t-statistic of +2.7)
and -1.38 (with a t-statistic of -1.9), respectively.
42

is certainly evidence of partisan bias here, especially for people whose own
positions were on the pro-life side of the issue. Nevertheless, most pro-choice
Republicans and (by a narrower margin) most pro-life Democrats managed
to recognize that their views put them closer to the opposing party than to
their own party on this issue.
*** Figure 13 ***
*** Table 8 ***
Lest readers wonder which of these two patterns is more common, we
can report that analogous �gures for a variety of other issues and years look
qualitatively similar to the pattern presented in Figure 12 and Table 7. For
example, Figure 14 and Table 9 summarize perceptions of relative proximity
for 13,647 NES respondents who placed themselves and the Democratic and
Republican parties on the 7-point liberal-conservative scale at some point
between 1972 and 2004. Just as in Figure 12, there is a dramatic divergence
in perceptions between Republican and Democratic party identi�ers on both
ends of the ideological spectrum. Liberal Republicans saw the Republican
Party�s position as no less satisfactory than the Democratic Party�s position,
while conservative Democrats perceived the Democratic Party as just as
close to their own positions as the Republican Party.51
*** Figure 14 ***
*** Table 9 ***
We see no reason to doubt that these perceptions are the product of
partisan inference processes similar in kind to those we have examined here.
However, their patent inaccuracy seems to us to belie the �encouraging�con-
clusion that �the general contribution of inference processes to vote choice
is a positive one�(Feldman and Conover 1983, 837). Voters may indeed �do
the best they can,�as Feldman and Conover put it, but their �e¢ cient and
reasonable response to ambiguity�leaves them depressingly far from having
even roughly accurate perceptions of the political world.
51Adding year-speci�c intercepts to allow for movement in the actual positions of theparties on the liberal-conservative scale does little to alter the picture.
43
Conclusion
Most of the time, the voters are merely rea¢ rming their partisan and group
identities at the polls. They do not reason very much or very often. What
they do is rationalize. Every election, they sound as though they were
thinking, and they feel as if they were thinking, as do we all. The unwary
scholarly devotee of democratic romanticism is thereby easily misled. But
in fact, while the voters may be consistent, and while they may be rational in
the thin economic sense of the term, they behave in what Lippmann (1922,
10) referred to as a �pseudo-environment�only loosely connected to
the real environment where action eventuates. If the behavior is
not a practical act, but what we call roughly thought and emo-
tion, it may be a long time before there is any noticeable break
in the texture of the �ctitious world. But when the stimulus of
the pseudo-fact results in action on things or other people, con-
tradiction soon develops. Then comes the sensation of butting
one�s head against a stone wall, of learning by experience, and
witnessing Herbert Spencer�s tragedy of the murder of a Beau-
tiful Theory by a Gang of Brutal Facts, the discomfort in short
of a maladjustment.
For many people, of course, the discomfort of maladjustment never
comes, either because they never emerge from the world of political thought
and emotion into the world of practical action, or because the concrete con-
sequences of their misperceptions are too indirect for them to apprehend.
Are they to be congratulated for living comfortably and e¢ ciently in their
pseudo-environments?
It is an unfortunate error, in our view, to confuse �rationality�in the thin
mathematical sense of logical consistency with �the notion of a competent
citizenry� held up for examination by Kuklinski and Quirk. Competence
requires not only logical consistency and cognitive e¢ ciency, but also some
modicum of accuracy in perception and receptiveness to new and, perhaps,
discon�rming evidence.
44

Consider, once again, the example of the federal budget de�cit. Hansen
(1998) provided a detailed analysis of data from a 1995 NES pilot survey
in which respondents were invited to favor or oppose a variety of possible
departures from current �scal policy � raising taxes to reduce the budget
de�cit, increasing the budget de�cit to fund increases in spending on do-
mestic programs, and so forth. He found very few logical inconsistencies in
responses to these questions (for example, people who wanted to increase
the budget de�cit in order to increase domestic spending, but also wanted to
cut domestic spending in order to reduce the budget de�cit). On the basis of
his analysis Hansen concluded (1998, 519) that �The public has the ability
to make budget policy choices with reasonable discernment. . . . They have
well-formed and well-behaved preferences.�
One would hardly guess that these are the same people who, one year
later, were largely oblivious to the fact that the federal budget de�cit had
declined by more than 90% over the preceding four years. Could people so
blatantly unaware of such a salient and politically consequential fact possibly
�make budget policy choices with reasonable discernment�? Hansen�s (1998,
526) assertion that �American democracy does not want for the competence
of its citizens�strikes us as hasty, to say the least.
We have suggested here that the average citizen�s perception of the fed-
eral budget de�cit is constructed of four parts folk wisdom, one part partisan
inference, and a trace element of reality. For perceptions of national eco-
nomic conditions the mix is somewhat more edifying: say, three parts folk
wisdom, one part inference, and three parts reality.
We do not contest the notion that ordinary citizens are doing their best
to construct consistent, subjectively plausible perceptions of a complex po-
litical world. We merely wish to note that their best should be troubling to
enthusiasts of democracy �especially when, as Lippmann (1922, 14) put it
more than 80 years ago, �these �ctions determine a very great part of men�s
political behavior.�
45
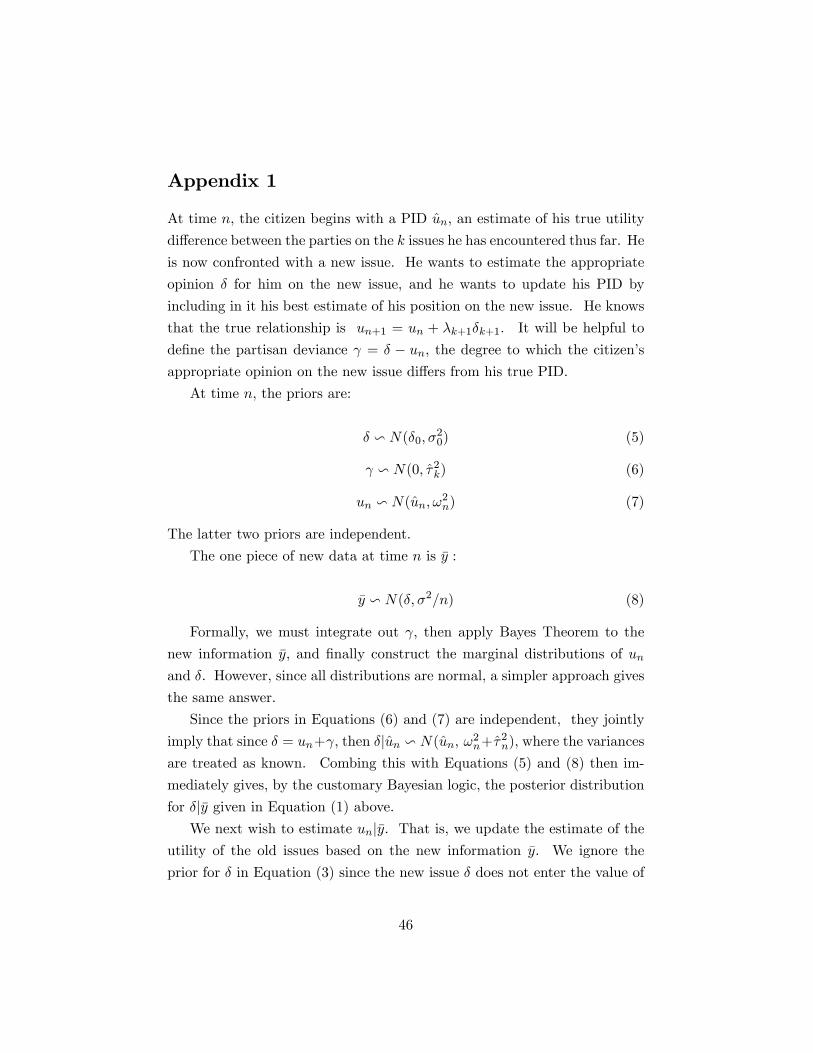
Appendix 1
At time n, the citizen begins with a PID un; an estimate of his true utility
di¤erence between the parties on the k issues he has encountered thus far. He
is now confronted with a new issue: He wants to estimate the appropriate
opinion � for him on the new issue, and he wants to update his PID by
including in it his best estimate of his position on the new issue. He knows
that the true relationship is un+1 = un + �k+1�k+1. It will be helpful to
de�ne the partisan deviance = � � un; the degree to which the citizen�sappropriate opinion on the new issue di¤ers from his true PID.
At time n, the priors are:
� v N(�0; �20) (5)
v N(0; �2k) (6)
un v N(un; !2n) (7)
The latter two priors are independent.
The one piece of new data at time n is �y :
�y v N(�; �2=n) (8)
Formally, we must integrate out ; then apply Bayes Theorem to the
new information �y; and �nally construct the marginal distributions of unand �: However, since all distributions are normal, a simpler approach gives
the same answer.
Since the priors in Equations (6) and (7) are independent, they jointly
imply that since � = un+ ; then �jun v N(un; !2n+�2n); where the variancesare treated as known. Combing this with Equations (5) and (8) then im-
mediately gives, by the customary Bayesian logic, the posterior distribution
for �j�y given in Equation (1) above.We next wish to estimate unj�y: That is, we update the estimate of the
utility of the old issues based on the new information �y: We ignore the
prior for � in Equation (3) since the new issue � does not enter the value of
46

un directly, and since by assumption, �20 is very large and thus �0 contains
almost no indirect information about un via the relationship � = un + :
It follows that the relevant information for estimating unj�y is given byEquations (6), (7), and (8), where �y is informative about u with variance
given by the sum of its sampling variance �2=n plus the variance of � around
u; namely �2k . Then by the usual logic, the posterior is normally distributed
with mean:
E(unj�y) =(�2k + �
2=n)un + !2n�y
�2k + (�2=n) + !2n
(9)
Finally, we need an updated estimate of un+1 = un+��; where � is �xed.
But since unj�y and �j�y both have normally distributed posteriors, it followsfrom Equations (1) and (9) that (ignoring the small amount of information
about u in the prior for �):
E(un+1j�y) =(�2k + �
2=n)un + !2n�y
�2k + (�2=n) + !2n
+ ��2un=n+ (!
2n + �
2k)�y
(�2=n) + !2n + �2k
(10)
=[(�2k + (1 + �)�
2=n)]un + [�2k + (1 + �)!
2n]�y
!2n + �2k + �
2=n(11)
which after rearrangement yields Equation (2) above.
Appendix 2: Why Not Cross-Lagged Regressions?
Cross�lagged regressions are commonly used to cope with reciprocal causa-
tion. Their �rst di¢ culty for the study of abortion, however, is that the
relationships are not linear. For example, the usual version of cross�lagging
with a dummy variable for gender would assume that the two lines in Figure
9 were each straight and parallel to each other. They are not.
Equally importantly, the model we have developed in this paper demon-
strates that the cross�lagged relationship between current PID and abortion
attitudes with those at a prior period should fail to be linear and additive in
just the way that Figure 9 illustrates. The model implies that updating at
time 2 will proceed in the same way as described in Equation (1), where now
�0 and �20 are interpreted as the one�period lagged opinion and its posterior
47

variance, respectively, and �y is the new information that has arrived since
the previous period. That amount of new information will di¤er for di¤erent
groups of people, invalidating the cross-lagged speci�cation.
To see the problem at its most drastic, consider those people thinking
about abortion at time 2 for whom no new information has arrived since time
1. (Presumably, many well informed middle�aged people �t this description,
having heard no new arguments, pro or con, for a decade or more.) Suppose,
too, that the time between periods is su¢ ciently short that PID will not have
strengthened with age. Then Equation (1) will determine their attitude at
both time periods by assigning partial in�uence to all three explanatory
variables� their prior when they came of age, what they have learned from
then to time 1, and their party ID. Whatever the relative weights of these
factors, since nothing has changed between time periods 1 and 2, these
citizens will express the same opinion at time 2 as at time 1.52 Hence time
2 opinion is perfectly predictable from time 1 opinion. The cross�lagged
regression will therefore give a coe¢ cient of 1.0 to the lagged opinion and
0.0 to their party ID.
When we tried using the Wiley�Wiley model in the 1992-1994-1996 panel
to estimate error variances for PID and abortion attitudes, then substituted
these into a standard errors�in�variables model for cross�lagged regressions,
the e¤ect of PID was negligible (near zero or negative) under all plausible
assumptions about its error variance. The lagged value of abortion atti-
tudes, on the other hand, received coe¢ cients depending on the reliabilities.
Since these undoubtedly vary somewhat by information level, and since we
lack the number of observations needed to estimate them reliably, we can-
not be sure precisely what the true lagged coe¢ cient is. However, the most
plausible values for its error variance gave lag coe¢ cients of .8 or higher,
often near 1.0. We conclude, then, that PID has relatively little impact
on changing the average person�s abortion views, while true abortion views
52We temporarily set aside the measurement error problem for the purposes of thishypothetical argument. The reader concerned about it may insert �after statistical biasesdue to measurement error are corrected� in each sentence without altering any of theconclusions.
48

themselves are highly stable over time.53 All this is conventional wisdom.
Now in one sense, this is the right answer: From time period 1 to period
2, party ID had no additional impact on opinion. However, as we have
argued, for some individuals in the right situations (for example, many men
during 1982-1997), party ID may be in�uencing their opinion at both time
periods. However, and this is the point, it may be doing so no more at time
2 than at time 1. Then PID adds nothing at time 2, but neither does it
lose anything: It matters at both time periods. But it will not receive a
coe¢ cient from the cross�lag.
Note that this would not be the usual interpretation of a cross�lagged
regressions with a zero coe¢ cient for PID Instead, the vanishing coe¢ cient
would conventionally be seen as absence of causation. But as Equation (1)
shows, this is just wrong. The problem is that the lagged opinion is en-
dogenous but has no real causal e¤ect. Hence it �over-controls,�arti�cially
diminishing the apparent causal impact of PID (Achen 2002). Similar
concerns apply to Equation (2) for PID.
References
[1] Abramowitz, Alan I. 1978. The Impact of a Presidential Debate onVoter Rationality. American Journal of Political Science 22: 680-690.
[2] Abramson, Paul R., John H. Aldrich, and David W. Rohde. 2006.Change and Continuity in the 2004 Elections. Washington, DC: CQPress.
[3] Achen, Christopher H. 1992. Social Psychology, Demographic Variables,and Linear Regression. Political Behavior 14,3 (Sept.): 195-211.
[4] Achen, Christopher H. 2002. Why Lagged Dependent Variables CanSuppress the Explanatory Power of Other Independent Variables. Man-uscript, Princeton University.
[5] Adams, Greg D. 1997. Abortion: Evidence of an Issue Evolution.American Journal of Political Science 41,3 (Jul.): 718-737.
53That is, people are somewhat con�icted, but their answers vary in a stable patternaround a �xed mean over time.
49

[6] Aldrich, John H., John L. Sullivan, and Eugene Borgida. 1989. ForeignA¤airs and Issue Voting: Do Presidential Candidates �Waltz Before aBlind Audience?�American Political Science Review 83: 123-141.
[7] Alvarez, R. Michael, and Jonathan Nagler. 1998. Economics, Entitle-ments, and Social Issues: Voter Choice in the 1996 Presidential Elec-tion. American Journal of Political Science 42: 1349-1363.
[8] Ansolabehere, Stephen, Jonathan Rodden, and James M. Snyder, Jr.2006. Issue Preferences and Measurement Error. Unpublished paper,Department of Political Science, Massachusetts Institute of Technology.
[9] Balmer, Randall. 2000. Mine Eyes Have Seen the Glory, 3rd ed. Ox-ford: Oxford University Press.
[10] Bartels, Larry M. 1988. Presidential Primaries and the Dynamics ofPublic Choice. Princeton, NJ: Princeton University Press.
[11] Bartels, Larry M. 2002a. Beyond the Running Tally: Partisan Bias inPolitical Perceptions. Political Behavior 24: 117-150.
[12] Bartels, Larry M. 2002b. The Impact of Candidate Traits in AmericanPresidential Elections. In Anthony King, ed., Leaders� Personalitiesand the Outcomes of Democratic Elections. Oxford: Oxford UniversityPress.
[13] Berelson, Bernard R., Paul F. Lazarsfeld, and William N. McPhee.1954. Voting: A Study of Opinion Formation in a Presidential Cam-paign. Chicago: University of Chicago Press.
[14] Brady, Henry E., and Paul M. Sniderman. 1985. Attitude Attribut-ion: A Group Basis for Political Reasoning. American Political ScienceReview 79: 1061-1078.
[15] Brody, Richard A., and Benjamin I. Page. 1972. Comment: The Assess-ment of Policy Voting. American Political Science Review 66: 450-458.
[16] Campbell, Angus, Philip E. Converse, Warren E. Miller, and DonaldE. Stokes. 1960. The American Voter. New York: John Wiley.
[17] Carmines, Edward G., and James Woods. 1997. The Role of PartyActivists in the Evolution of the Abortion Issue. Political Behavior 24,4(Dec.): 361-377.
50

[18] Conover, Pamela Johnston, and Stanley Feldman. 1989. CandidatePerception in an Ambiguous World: Campaigns, Cues, and InferenceProcesses. American Journal of Political Science 33: 912-940.
[19] Converse, Philip. E. 1969. Of Time and Partisan Stability. ComparativePolitical Studies 2: 139-171.
[20] Downs, Anthony. 1957. An Economic Theory of Democracy. New York:Harper.
[21] Enelow, James M., and Melvin J. Hinich. 1984. The Spatial Theory ofVoting: An Introduction. Cambridge: Cambridge University Press.
[22] Erikson, Robert S. 2004. Economic Voting: Micro vs. Macro Perspec-tives. Presented at the Political Methodology Summer Meeting, Stan-ford University.
[23] Erikson, Robert S., and David W. Romero. 1990. Candidate Equilib-rium and the Behavioral Model of the Vote. American Political ScienceReview 84: 1103-1126.
[24] Feldman, Stanley, and Pamela Johnston Conover. 1983. Candidates,Issues and Voters: The Role of Inference in Political Perception. Journalof Politics 45: 810-839.
[25] Fischle, Mark. 2000. Mass Response to the Lewinsky Scandal: Moti-vated Reasoning or Bayesian Updating? Political Psychology 21: 135-159.
[26] Franklin, Charles H., and John E. Jackson. 1983. The Dynamics ofParty Identi�cation. American Political Science Review 77: 957-973.
[27] Friese, Philip C. 1856. An Essay on Party. New York: Fowler andWells.
[28] Gaines, Brian J., James H. Kuklinski, Paul J. Quirk, Buddy Peyton,and Jay Verkuilen. 2006. Facts, Interpretations, and Partisan Ratio-nalizations of Attitudes. Unpublished paper, Department of PoliticalScience, University of Illinois at Urbana-Champaign.
[29] Hanna, Mary T. 1979. Catholics and American Politics. Cambridge,Massachusetts: Harvard University Press.
51

[30] Hansen, John Mark. 1998. Individuals, Institutions, and Public Pref-erences over Public Finance. American Political Science Review 92:513-531.
[31] Hochschild, Jennifer L. 2001. Where You Stand Depends on What YouSee: Connections among Values, Perceptions of Fact, and Political Pre-scriptions. In James H. Kuklinski, ed., Citizens and Politics: Perspec-tives from Political Psychology. New York: Cambridge University Press.
[32] Jackson, John E. 1975. Issues, Party Choices, and Presidential Votes.American Journal of Political Science 19: 161-185.
[33] Jacobson, Gary C. 2006. Public Opinion and the War in Iraq. Paperprepared for delivery at the Annual Meeting of the American PoliticalScience Association, Philadelphia.
[34] Jelen, Ted G., and Clyde Wilcox. 2003. Causes and Consequences ofPublic Attitudes toward Abortion. Political Research Quarterly 56,4(Dec.): 489-500.
[35] Jennings, M. Kent, and Richard G. Niemi. 1981. Generations and Pol-itics. Princeton: Princeton University Press.
[36] Kahneman, Daniel, Paul Slovic, and Amos Tversky, eds. 1982. Judg-ment Under Uncertainty: Heuristics and Biases. Cambridge: Cam-bridge University Press.
[37] Kuklinski, James H., and Paul J. Quirk. 2000. Reconsidering the Ratio-nal Public: Cognition, Heuristics, and Mass Opinion. In Arthur Lupia,Mathew D. McCubbins, and Samuel L. Popkin, eds., Elements of Rea-son: Cognition, Choice, and the Bounds of Rationality. Cambridge:Cambridge University Press.
[38] Layman, Geo¤rey C., and Thomas M. Carsey. 2002. Party Polarizationand Party Structuring of Policy Attitudes. Political Behavior 24(3):199-236.
[39] Lenz, Gabriel. 2006. What Politics Is About. Ph.D. dissertation, De-partment of Politics, Princeton University.
[40] Lippmann, Walter. 1922. Public Opinion. New York: Penguin Books,1946.
52

[41] Markus, Gregory B., and Philip E. Converse. 1979. A Dynamic Simulta-neous Equation Model of Electoral Choice. American Political ScienceReview 73: 1055-1070.
[42] Miller, Warren E. 2000. Temporal Order and Causal Inference. PoliticalAnalysis 8: 119-140.
[43] Page, Benjamin I., and Richard A. Brody. 1972. Policy Voting and theElectoral Process: The Vietnam War Issue. American Political ScienceReview 66: 979-995.
[44] Page, Benjamin I., and Calvin C. Jones. 1979. Reciprocal E¤ects ofPolicy Preferences, Party Loyalties and the Vote. American PoliticalScience Review 73: 1071-1089.
[45] Program on International Policy Attitudes. 2006. Iraq:The Separate Realities of Republicans and Democrats.http://www.worldpublicopinion.org/pipa/. March 28.
[46] Rahn, Wendy M. 1993. The Role of Partisan Stereotypes in InformationProcessing about Political Candidates. American Journal of PoliticalScience 37: 472-496.
[47] Rahn, Wendy M., Jon A. Krosnick, and Marijke Breuning. 1994. Ra-tionalization and Derivation Processes in Survey Studies of PoliticalCandidate Evaluation. American Journal of Political Science 38: 582-600.
[48] Rosenberg, Gerald. 1991. The Hollow Hope. Chicago: University ofChicago Press.
[49] Shani, Danielle. 2006. Knowing Your Colors: Can Knowledge Correctfor Partisan Bias in Political Perceptions? Paper presented at the an-nual meeting of the Midwest Political Science Association, Chicago.
[50] Wiley, David E., and James A. Wiley. 1970. The Estimation of Measure-ment Error in Panel Data. American Sociological Review 35: 112-117.
[51] Zaller, John R. 1992. The Nature and Origins of Mass Opinion. Cam-bridge: Cambridge University Press.
53

Table 1: Perceptions of Budget Deficit by Party Identification, 1996
“Would you say that the size of the yearly budget deficit increased, decreased, or stayed about the same during Clinton’s time as President? Would you say it has increased [decreased] a lot or a little?”
1992 Democrats
1992 Independents
1992 Republicans
Total
Increased a lot (−50) 6.7% 15.8% 22.6% 14.8% Increased a little (−25) 25.6% 22.1% 29.7% 25.2%
Stayed about the same (0) 28.5% 29.7% 23.5% 27.7% Decreased a little (+25) 32.0% 24.2% 20.4% 25.6% Decreased a lot (+50) 7.3% 8.1% 3.8% 6.7%
N 185 235 156 576 Source: 1992-94-96 NES panel.
Table 2: Perceptions of National Economy by Party Identification, 1996
“How about the economy? Would you say that over the past year the nation’s economy has gotten better, stayed the same or gotten worse? Would you say much better [worse] or somewhat better [worse]?”
1992 Democrats
1992 Independents
1992 Republicans
Total
Much better (−50) 12.4% 5.0% 4.1% 7.1% Somewhat better (−25) 38.6% 36.2% 28.4% 34.9%
Stayed the same (0) 36.0% 46.2% 47.1% 43.2% Somewhat worse (+25) 9.7% 9.5% 18.3% 11.8%
Much worse (+50) 3.3% 3.0% 2.2% 2.9% N 188 244 159 591
Source: 1992-94-96 NES panel.

Table 3: Partisanship, Political Information, and Perceptions of Budget Deficit and National Economy, 1996
Least squares regression parameter estimates (with standard errors in parentheses) for non-linear
model of inference: Perception = A + Partisanship /(BB0+B1B /Age+BB2/Information) + (Reality)*C*InformationD
/(1 + 1/(BB0+B1B /Age+BB2/Information) + C*InformationD
Perceived Budget Deficit Perceived National Economy
1992 Partisanship
1996 Partisanship
1992 Partisanship
1996 Partisanship
Prior Belief A −10.11
(2.11) −13.03 (1.55)
−5.83 (2.78)
−3.26 (1.91)
Partisan Inference BB0 −2.98
(2.02) .02
(1.51) −1.83 (1.09)
.04 (1.01)
BB1 212.1 (112.6)
90.3 (64.1)
−20.0 (13.6)
−33.3 (20.4)
BB2 1.07 (.92)
.70 (.55)
2.56 (.87)
1.66 (.50)
Information C 1.45
(.57) 1.54 (.42)
5.98 (2.28)
3.56 (.94)
D 8.21 (2.69)
8.59 (1.95)
2.62 (.68)
2.34 (.52)
Std err of reg 27.47 28.45 20.12 20.51 R2 .13 .14 .26 .21 N 576 1261 591 1304
Source: 1992-94-96 NES panel.

Table 4: The Impact of Watergate Attitudes on the Issue Perceptions and Preferences of Well-Informed Respondents, 1972-76
Errors-in-variables regression parameter estimates (with standard errors in parentheses) for
respondents in the top one-third of the distribution of political information. Dependent variables are 1976 perceived issue proximities (−50 = closer to Republican Party; +50 =
closer to Democratic party) and issue positions (−50 = extreme conservative; +50 = extreme liberal).
Liberal-
conservative Government
jobs School busing
Rights of accused
Aid to minorities
Weighted average
Perceived issue proximity
Watergate attitudes
.153 (.061)
.060 (.079)
.174 (.083)
.180 (.064)
.080 (.073)
.134 (.070)
1972 party identification
.108 (.043)
.059 (.048)
.027 (.044)
.044 (.035)
.049 (.036)
.056 (.040)
1972 issue proximity
.648 (.095)
.829 (.152)
.490 (.096)
.627 (.127)
.855 (.139)
.648 (.113)
Intercept −7.50 (1.57)
−5.41 (2.28)
−5.04 (2.44)
−4.21 (1.61)
−2.99 (1.83)
−5.13 (1.83)
Std err of reg 13.02 14.97 16.07 12.38 13.29 --- R2 .54 .44 .31 .40 .45 --- N 316 309 279 268 313 ---
Issue positions
Watergate attitudes
.085 (.063)
.228 (.104)
.125 (.064)
.161 (.110)
.077 (.101)
.122 (.078)
1972 party identification
.017 (.038)
.100 (.056)
−.040 (.036)
−.165 (.059)
−.018 (.047)
−.017 (.044)
1972 issue position
.850 (.062)
.458 (.070)
.807 (.042)
.897 (.091)
.840 (.074)
.775 (.059)
Intercept −7.38 (1.60)
−12.13 (2.71)
−7.67 (2.21)
−9.40 (2.64)
−8.00 (2.36)
−8.43 (2.13)
Std err of reg 13.34 23.97 15.63 24.29 20.98 --- R2 .66 .29 .63 .42 .48 --- N 325 348 356 344 353 ---
Source: 1972-74-76 NES panel.

Table 5: The Impact of Watergate Attitudes on the Issue Perceptions and Preferences of Uninformed Respondents, 1972-76
Errors-in-variables regression parameter estimates (with standard errors in parentheses) for
respondents in the bottom two-thirds of the distribution of political information. Dependent variables are 1976 perceived issue proximities (−50 = closer to Republican Party; +50 =
closer to Democratic party) and issue positions (−50 = extreme conservative; +50 = extreme liberal).
Liberal-
conservative Government
jobs School busing
Rights of accused
Aid to minorities
Weighted average
Perceived issue proximity
Watergate attitudes
.032 (.054)
.049 (.057)
−.131 (.066)
.041 (.050)
.004 (.051)
.008 (.055)
1972 party identification
.163 (.043)
.091 (.051)
.206 (.045)
.102 (.037)
.129 (.036)
.137 (.041)
1972 issue proximity
.590 (.116)
.491 (.117)
.467 (.096)
.447 (.127)
.397 (.128)
.481 (.114)
Intercept −.87 (1.47)
−1.41 (1.54)
3.71 (1.79)
−.52 (1.24)
−1.33 (1.29)
−.40 (1.42)
Std err of reg 13.81 16.39 15.54 13.14 13.43 --- R2 .42 .24 .32 .22 .19 --- N 286 323 268 275 303 ---
Issue positions
Watergate attitudes
−.085 (.061)
.040 (.076)
.078 (.055)
.076 (.079)
.155 (.077)
.044 (.067)
1972 party identification
.079 (.039)
.098 (.054)
−.021 (.040)
−.061 (.056)
.006 (.054)
.024 (.046)
1972 issue position
.832 (.096)
.660 (.074)
.830 (.069)
.881 (.078)
.705 (.068)
.774 (.075)
Intercept .47 (1.69)
−6.53 (2.06)
−4.44 (3.27)
−3.98 (2.05)
−8.76 (2.02)
−4.20 (2.04)
Std err of reg 16.61 26.79 21.27 27.56 26.36 --- R2 .38 .28 .36 .39 .33 --- N 343 456 509 451 448 ---
Source: 1972-74-76 NES panel.
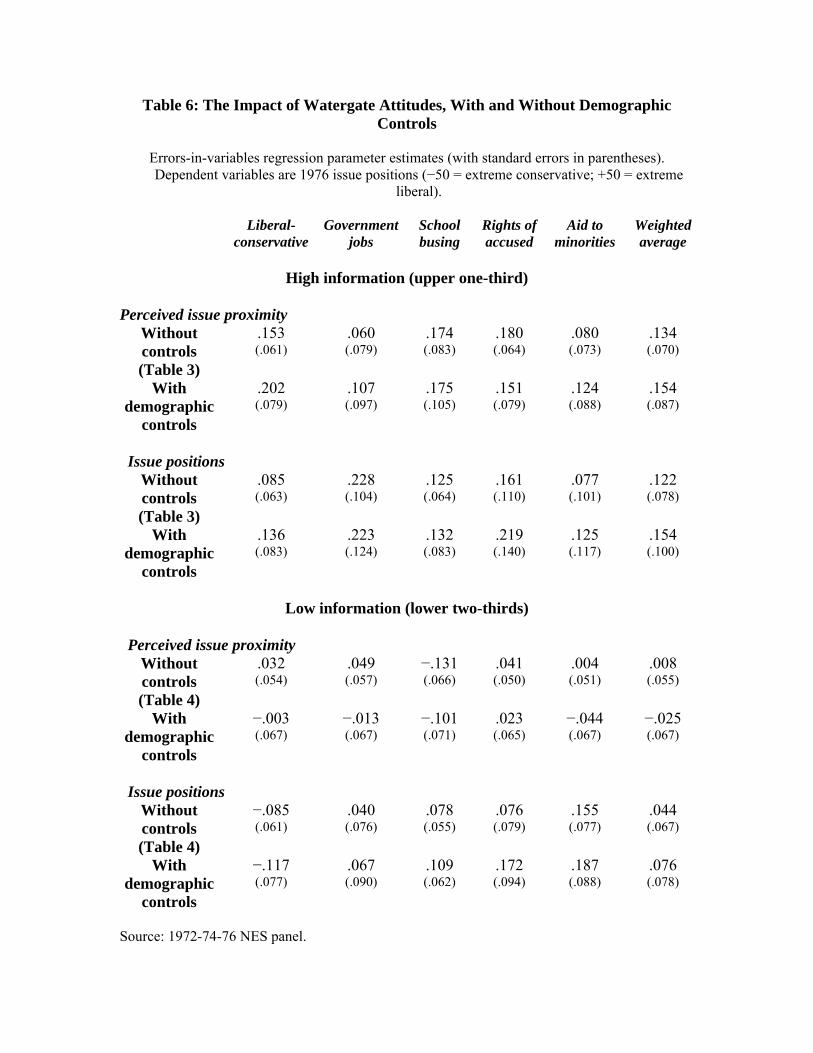
Table 6: The Impact of Watergate Attitudes, With and Without Demographic Controls
Errors-in-variables regression parameter estimates (with standard errors in parentheses). Dependent variables are 1976 issue positions (−50 = extreme conservative; +50 = extreme
liberal).
Liberal-conservative
Governmentjobs
School busing
Rights of accused
Aid to minorities
Weighted average
High information (upper one-third)
Perceived issue proximity
Without controls (Table 3)
.153 (.061)
.060 (.079)
.174 (.083)
.180 (.064)
.080 (.073)
.134 (.070)
With demographic
controls
.202 (.079)
.107 (.097)
.175 (.105)
.151 (.079)
.124 (.088)
.154 (.087)
Issue positions
Without controls (Table 3)
.085 (.063)
.228 (.104)
.125 (.064)
.161 (.110)
.077 (.101)
.122 (.078)
With demographic
controls
.136 (.083)
.223 (.124)
.132 (.083)
.219 (.140)
.125 (.117)
.154 (.100)
Low information (lower two-thirds)
Perceived issue proximity
Without controls (Table 4)
.032 (.054)
.049 (.057)
−.131 (.066)
.041 (.050)
.004 (.051)
.008 (.055)
With demographic
controls
−.003 (.067)
−.013 (.067)
−.101 (.071)
.023 (.065)
−.044 (.067)
−.025 (.067)
Issue positions
Without controls (Table 4)
−.085 (.061)
.040 (.076)
.078 (.055)
.076 (.079)
.155 (.077)
.044 (.067)
With demographic
controls
−.117 (.077)
.067 (.090)
.109 (.062)
.172 (.094)
.187 (.088)
.076 (.078)
Source: 1972-74-76 NES panel.

Table 7: Party Identification and Perceptions of Party Proximity for Spending/Services, 2004
Average relative perceived proximities (with standard errors in parentheses). Positive numbers
imply that the Republican Party is perceived as closer; negative numbers imply that the Democratic Party is perceived as closer.
Self-Placement
Democrats
Independents
Republicans Partisan
Difference 1
(many more services; increase spending a lot; N = 132)
−3.15 (.28)
−1.33 (.35)
+.84 (.49)
+3.99 (.57)
2 (N = 133)
−2.66 (.21)
−1.66 (.23)
+.97 (.37)
+3.63 (.43)
3 (N = 225)
−1.44 (.15)
−.78 (.14)
+.18 (.17)
+1.62 (.23)
4 (N = 254)
−.24 (.13)
+.05 (.10)
+.83 (.12)
+1.07 (.18)
5 (N = 119)
+.22 (.33)
+.91 (.23)
+2.42 (.20)
+2.20 (.38)
6 (N = 68)
−.53 (.92)
+2.51 (.47)
+3.07 (.30)
+3.60 (.97)
7 (many fewer services; reduce
spending a lot; N = 47)
−2.71 (1.23)
+1.78 (.48)
+3.20 (.42)
+5.91 (1.30)
Source: 2004 NES survey.
Table 8: Party Identification and Perceptions of Abortion Proximity, 2004
Average relative perceived proximities (with standard errors in parentheses). Positive numbers imply that the Republican Party is perceived as closer; negative numbers imply that the
Democratic Party is perceived as closer.
Self-Placement
Democrats
Independents
Republicans
Partisan Difference
1 (always a personal choice; N = 340)
−1.60 (.11)
−1.51 (.10)
−1.11 (.15)
+.50 (.19)
2 (after need clearly established; N = 153)
−.81 (.15)
−.43 (.12)
−.13 (.13)
+.69 (.20)
3 (only rape, incest, life endangered; N = 264)
+.02 (.12)
+.48 (.09)
+1.23 (.09)
+1.22 (.15)
4 (should never be permitted; N = 115)
+.42 (.23)
+.89 (.25)
+1.52 (.17)
+1.10 (.29)
Source: 2004 NES survey.

Table 9: Party Identification and Perceptions of Party Proximity on Liberal-Conservative Scale, 1972-2004
Average relative perceived proximities (with standard errors in parentheses). Positive numbers
imply that the Republican Party is perceived as closer; negative numbers imply that the Democratic Party is perceived as closer.
Self-Placement
Democrats
Independents
Republicans Partisan
Difference 1
(extreme liberal; N = 425) −3.20 (.10)
−2.16 (.14)
+.43 (.56)
+3.63 (.43)
2 (N = 1933)
−2.85 (.05)
−1.88 (.08)
−.41 (.23)
+2.44 (.17)
3 (N = 2454)
−1.83 (.04)
−1.35 (.05)
−.49 (.10)
+1.34 (.10)
4 (N = 6547)
−.37 (.02)
−.14 (.02)
+.14 (.03)
+.51 (.03)
5 (N = 3766)
+.15 (.05)
+1.13 (.04)
+1.66 (.03)
+1.51 (.06)
6 (N = 3450)
−.16 (.11)
+1.90 (.07)
+3.14 (.03)
+3.30 (.09)
7 (extreme conservative; N = 581)
−.86 (.25)
+1.25 (.23)
+3.59 (.10)
+4.46 (.25)
Source: 1972-2004 NES surveys.

Figure 1Perceptions of Budget Deficit
by Party and Information Level, 1996
-50
-25
0
25
50
0 10 20 30 40 50 60 70 80 90 100
Political information (percentile)
Perc
eive
d im
prov
emen
t in
budg
et d
efic
it (-
50 in
crea
sed
a lo
t; +5
0 de
crea
sed
a lo
t)
Democrats Republicans

Figure 2Perceptions of National Economy
by Party and Information Level, 1996
-50
-25
0
25
50
0 10 20 30 40 50 60 70 80 90 100
Political information (percentile)
Perc
eive
d ch
ange
in p
revi
ous y
ear
(-50
got
ten
muc
h w
orse
; +50
got
ten
muc
h be
tter)
Democrats Republicans

Figure 3Implied Weight of Reality in Perceptionsof Budget Deficit, by Information Level
0.0
0.1
0.2
0.3
0.4
0.5
0.6
0.7
0.8
0.9
1.0
0 10 20 30 40 50 60 70 80 90 100
Political information (percentile)

Figure 4Implied Weight of Partisanship in Perceptions
of Budget Deficit, by Information Level
0.0
0.1
0.2
0.3
0.4
0.5
0.6
0.7
0.8
0.9
1.0
0 10 20 30 40 50 60 70 80 90 100
Political information (percentile)

Figure 5Non-Linear Model Fit for
Perceptions of Budget Deficit
-50
-25
0
25
50
0 10 20 30 40 50 60 70 80 90 100
Political information (percentile)
Perc
eive
d im
prov
emen
t in
budg
et d
efic
it (-
50 in
crea
sed
a lo
t; +5
0 de
crea
sed
a lo
t)
Democrats Republicans

Figure 6Implied Weight of Reality in Perceptions
of National Economy, by Information Level
0.0
0.1
0.2
0.3
0.4
0.5
0.6
0.7
0.8
0.9
1.0
0 10 20 30 40 50 60 70 80 90 100
Political information (percentile)

Figure 7Implied Weight of Partisanship in Perceptions
of National Economy, by Information Level
0.0
0.1
0.2
0.3
0.4
0.5
0.6
0.7
0.8
0.9
1.0
0 10 20 30 40 50 60 70 80 90 100
Political information (percentile)

Figure 8. Retention of 1965 Catholics in 1982
0
10
20
30
40
50
60
70
80
90
100
never rarely sometimes always
1982 abortion attitude
1982
per
cent
Cat
holic
Figure 9: Retention of 1982 GOP Identifiers in 1997
0
10
20
30
40
50
60
70
80
90
100
never/rarely sometimes always
1982 abortion opinion
perc
ent R
epub
lican
199
7
menwomen

Figure 10: Retention of Well Informed 1982 Republicans in 1997
0
10
20
30
40
50
60
70
80
90
100
never/rarely/sometimes always
1982 abortion opinion
perc
ent R
epub
lican
199
7
menwomen
Figure 11: Conversion to 1997 Pro-Choice Views by 1982 Pro-Life Respondents
0
10
20
30
40
50
60
Democrats Independents Republicans
1982 Party Identification
perc
ent s
witc
hing
menwomen

Figure 12Party Identification and Perceptions of Issue
Proximity for Spending/Services, 2004
-6
-5
-4
-3
-2
-1
0
1
2
3
4
5
6
0 1 2 3 4 5 6 7
Spending/Services Self-Placement("many more services" to "reduce spending a lot")
Perc
eive
d R
elat
ive
Prox
imity
to R
epub
lican
Par
tyRepublicans Democrats

Figure 13Party Identification and Perceptions of
Abortion Proximity, 2004
-3
-2
-1
0
1
2
3
0 1 2 3 4
Abortion Self-Placement("personal choice" to "should never be permitted")
Perc
eive
d R
elat
ive
Prox
imity
to R
epub
lican
Par
tyRepublicans Democrats

Figure 14Party Identification and Perceptions of
Ideological Proximity, 1984-2004
-6
-5
-4
-3
-2
-1
0
1
2
3
4
5
6
0 1 2 3 4 5 6 7
Ideological Self-Placement(Extreme Liberal to Extreme Conservative)
Perc
eive
d R
elat
ive
Prox
imity
to R
epub
lican
Par
tyRepublicans Democrats