IT-Business Strategic Alignment Maturity · IT-Business Strategic Alignment Maturity 9/23/10...
27
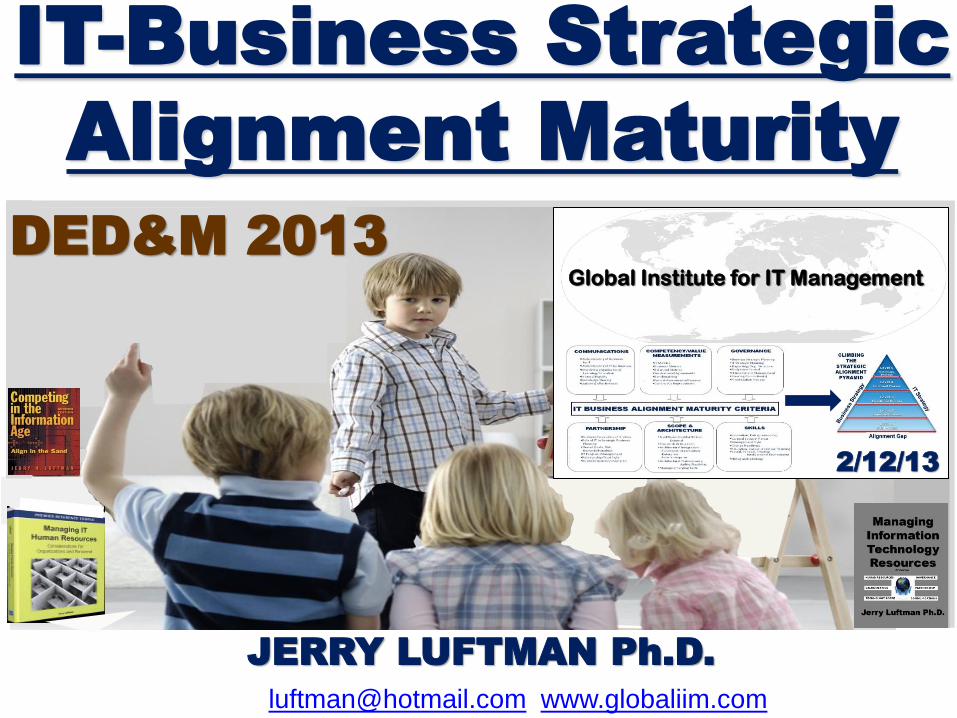
IT-Business Strategic Alignment Maturity 2/12/13 JERRY LUFTMAN Ph.D. [email protected] www.globaliim.com Global Institute for IT Management DED&M 2013
Transcript of IT-Business Strategic Alignment Maturity · IT-Business Strategic Alignment Maturity 9/23/10...
IT-Business Strategic
Alignment Maturity
9/23/10 2/12/13
JERRY LUFTMAN Ph.D.
[email protected] www.globaliim.com
Global Institute for IT Management
DED&M 2013
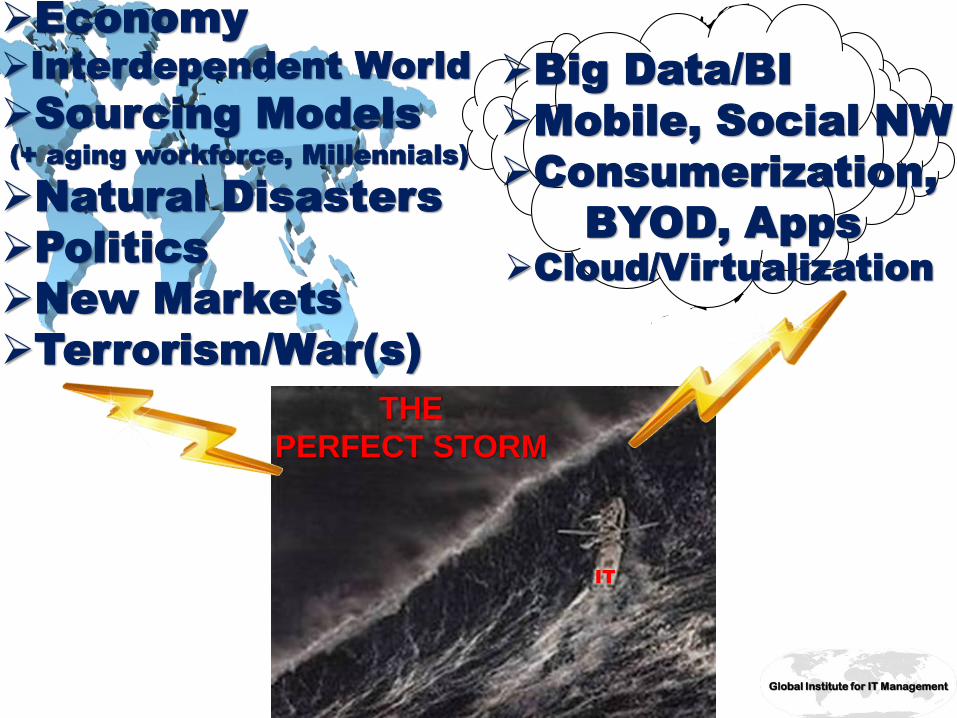
Economy
Interdependent World
Sourcing Models
(+ aging workforce, Millennials)
Natural Disasters
Politics
New Markets
Terrorism/War(s)
Big Data/BI
Mobile, Social NW
Consumerization,
BYOD, Apps
Cloud/Virtualization
THE
PERFECT STORM
IT
Global Institute for IT Management

6 IT HEADLINES
1. Focus on Swiftly Reducing Business Expenses &
Revenue Generating Applications
4. Increased Attention to IT Infrastructure
Spending
5. Growing Cloud & Consumerization of IT
2. Budgets, Hiring, & Salaries More Cautious;
Uncertainty vs Less Certain
3. Domestic Hiring & Outsourcing Declining
Offshore Hiring & Outsourcing on the Rise
6. IT Business Alignment Fundamental
IT-Business Strategic
Alignment Maturity
Global Institute for IT Management

What is strategic alignment?
Global Institute for IT Management

Why is it taking so long to
address?
Global Institute for IT Management
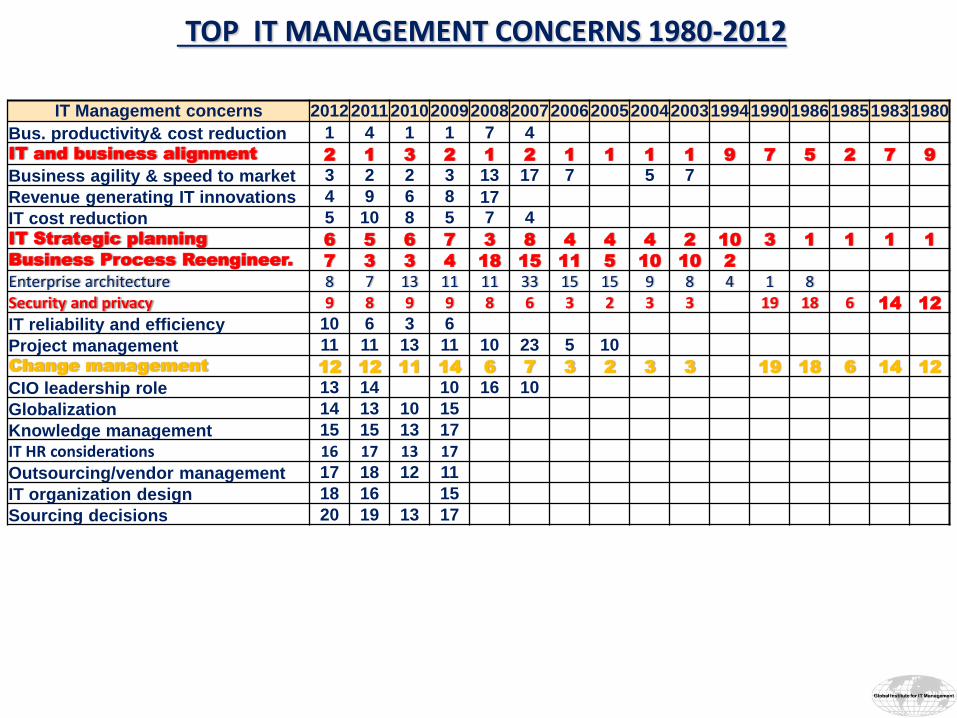
TOP IT MANAGEMENT CONCERNS 1980-2012
IT Management concerns 2012 2011 2010 2009 2008 2007 2006 2005 2004 2003 1994 1990 1986 1985 1983 1980
Bus. productivity& cost reduction 1 4 1 1 7 4 IT and business alignment 2 1 3 2 1 2 1 1 1 1 9 7 5 2 7 9
Business agility & speed to market 3 2 2 3 13 17 7 5 7
Revenue generating IT innovations 4 9 6 8 17
IT cost reduction 5 10 8 5 7 4 IT Strategic planning 6 5 6 7 3 8 4 4 4 2 10 3 1 1 1 1
Business Process Reengineer. 7 3 3 4 18 15 11 5 10 10 2
Enterprise architecture 8 7 13 11 11 33 15 15 9 8 4 1 8
Security and privacy 9 8 9 9 8 6 3 2 3 3 19 18 6 14 12
IT reliability and efficiency 10 6 3 6
Project management 11 11 13 11 10 23 5 10 Change management 12 12 11 14 6 7 3 2 3 3 19 18 6 14 12
CIO leadership role 13 14 10 16 10
Globalization 14 13 10 15
Knowledge management 15 15 13 17
IT HR considerations 16 17 13 17
Outsourcing/vendor management 17 18 12 11
IT organization design 18 16 15
Sourcing decisions 20 19 13 17
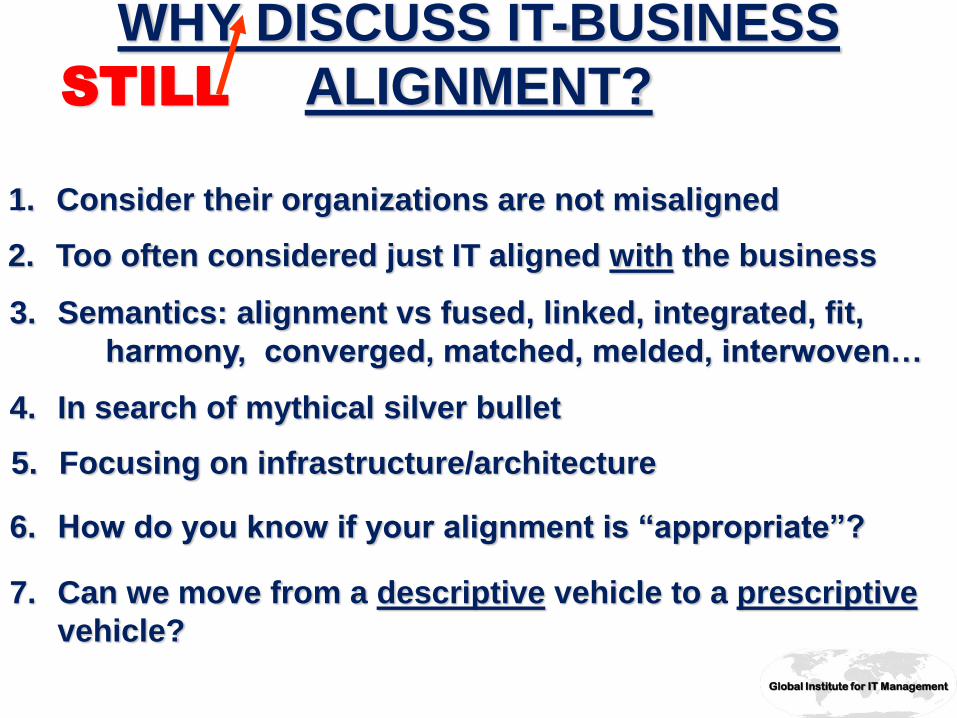
WHY DISCUSS IT-BUSINESS
ALIGNMENT? STILL
6. How do you know if your alignment is “appropriate”?
7. Can we move from a descriptive vehicle to a prescriptive
vehicle?
4. In search of mythical silver bullet
2. Too often considered just IT aligned with the business
3. Semantics: alignment vs fused, linked, integrated, fit,
harmony, converged, matched, melded, interwoven…
5. Focusing on infrastructure/architecture
1. Consider their organizations are not misaligned
Global Institute for IT Management
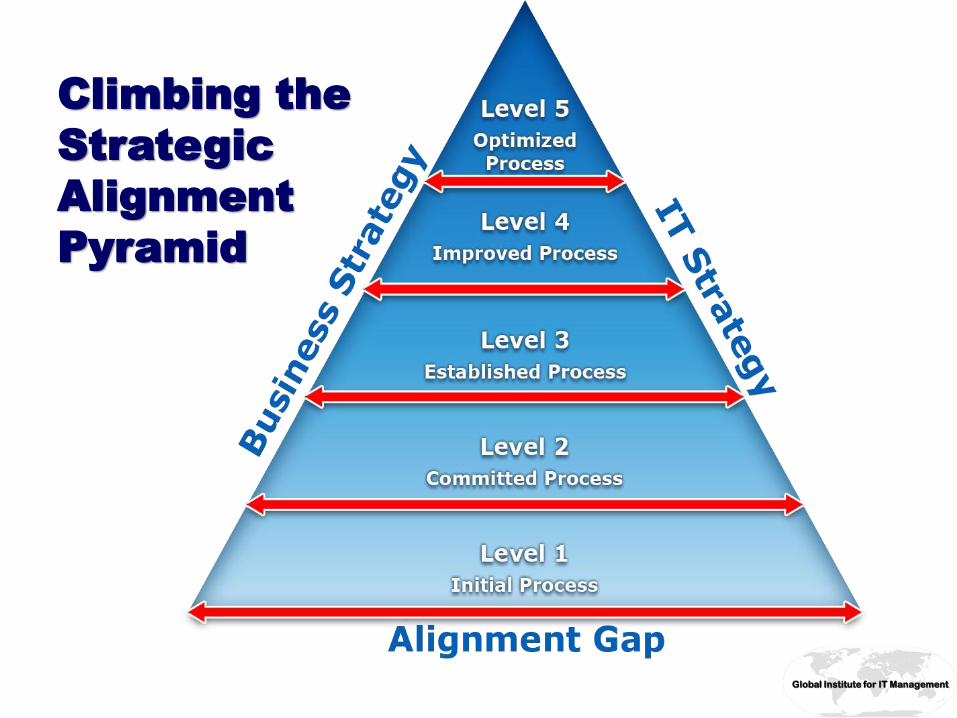
Climbing the
Strategic
Alignment
Pyramid
Global Institute for IT Management
·
·
·
·
·
·
-
·
-
-
- Inter -
-
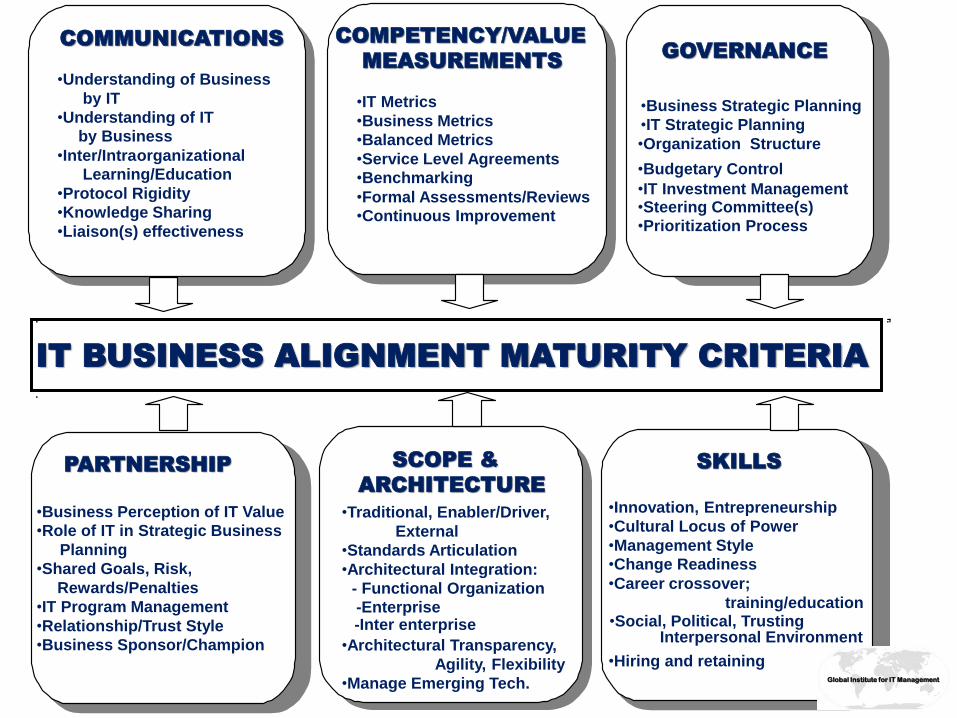
IT BUSINESS ALIGNMENT MATURITY CRITERIA
PARTNERSHIP
•Business Perception of IT Value
•Role of IT in Strategic Business
Planning
•Shared Goals, Risk,
Rewards/Penalties
•IT Program Management
•Relationship/Trust Style
•Business Sponsor/Champion
SCOPE &
ARCHITECTURE
•Traditional, Enabler/Driver,
External
•Standards Articulation
•Architectural Integration:
- Functional Organization
-Enterprise -Inter enterprise
•Architectural Transparency,
Agility, Flexibility
•Manage Emerging Tech.
SKILLS
by Business
•Liaison(s) effectiveness
COMMUNICATIONS
•Understanding of Business
by IT
•Understanding of IT
•Inter/Intra organizational
Learning/Education
•Protocol Rigidity
•Knowledge Sharing
COMPETENCY/VALUE
MEASUREMENTS
•IT Metrics
•Business Metrics
•Balanced Metrics
•Service Level Agreements
•Benchmarking
•Formal Assessments/Reviews
•Continuous Improvement
GOVERNANCE
•Organization Structure
•IT Investment Management
•Prioritization Process
•Business Strategic Planning
•IT Strategic Planning
•Budgetary Control
•Steering Committee(s)
•Cultural Locus of Power
•Change Readiness
•Innovation, Entrepreneurship
•Management Style
•Career crossover;
training/education
•Hiring and retaining
Interpersonal Environment •Social, Political, Trusting
Global Institute for IT Management
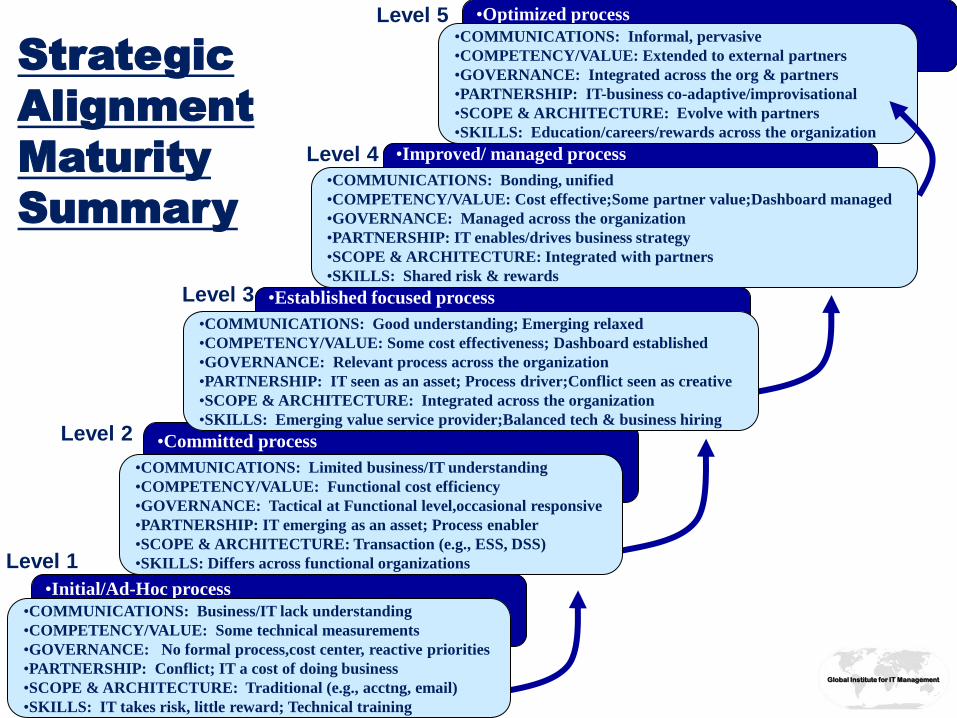
•Improved/ managed process
•COMMUNICATIONS: Bonding, unified
•COMPETENCY/VALUE: Cost effective;Some partner value;Dashboard managed
•GOVERNANCE: Managed across the organization
•PARTNERSHIP: IT enables/drives business strategy
•SCOPE & ARCHITECTURE: Integrated with partners
•SKILLS: Shared risk & rewards
•Established focused process
Strategic
Alignment
Maturity
Summary
•Initial/Ad-Hoc process
•Committed process
•Optimized process
Level 2
Level 1
Level 3
Level 4
Level 5
•COMMUNICATIONS: Good understanding; Emerging relaxed
•COMPETENCY/VALUE: Some cost effectiveness; Dashboard established
•GOVERNANCE: Relevant process across the organization
•PARTNERSHIP: IT seen as an asset; Process driver;Conflict seen as creative
•SCOPE & ARCHITECTURE: Integrated across the organization
•SKILLS: Emerging value service provider;Balanced tech & business hiring
•COMMUNICATIONS: Business/IT lack understanding
•COMPETENCY/VALUE: Some technical measurements
•GOVERNANCE: No formal process,cost center, reactive priorities
•PARTNERSHIP: Conflict; IT a cost of doing business
•SCOPE & ARCHITECTURE: Traditional (e.g., acctng, email)
•SKILLS: IT takes risk, little reward; Technical training
•COMMUNICATIONS: Limited business/IT understanding
•COMPETENCY/VALUE: Functional cost efficiency
•GOVERNANCE: Tactical at Functional level,occasional responsive
•PARTNERSHIP: IT emerging as an asset; Process enabler
•SCOPE & ARCHITECTURE: Transaction (e.g., ESS, DSS)
•SKILLS: Differs across functional organizations
•COMMUNICATIONS: Informal, pervasive
•COMPETENCY/VALUE: Extended to external partners
•GOVERNANCE: Integrated across the org & partners
•PARTNERSHIP: IT-business co-adaptive/improvisational
•SCOPE & ARCHITECTURE: Evolve with partners
•SKILLS: Education/careers/rewards across the organization
Global Institute for IT Management

Communications •Customer Understanding
of Provider
•Provider Understanding
of Customer
•Organizational Learning
& Knowledge Sharing
•Customer-Provider Liaison
Value
Measurements •Customer & Provider Metrics
(tech. & bus.) for services
•SLA & Management Process
•Benchmarks
•Formal Assessments &
Improvement Reviews
Governance •Use of Joint Strategic,
Tactical & Operational
Committees
•Formal/Informal Mechanisms
•Prioritization Process
•Resource Allocation Process
•Statutory & Regulatory
Requirements
Partnership •Role of Provider in Customer
Strategy & Planning
•Shared Goals, Risks,
Rewards/Penalties
•Mutual Trust
•Formal & Informal
Agreements
• Joint Sponsor & Champions
Scope &
Architecture •Architectural Agility,
Transparency, Flexibility
•Standards Adherence
•Impact of Provider
Services on Customer &
its Partners
Human Resources &
Skills •Technical & Business Skills
of Customer & Provider
•Cultural Match
•Change Readiness
•Cross Training/Education
•Hiring/Retaining; Skills
Management & Portfolio
CUSTOMER-PROVIDER ALIGNMENT MATURITY CRITERIA
Global Institute for IT Management
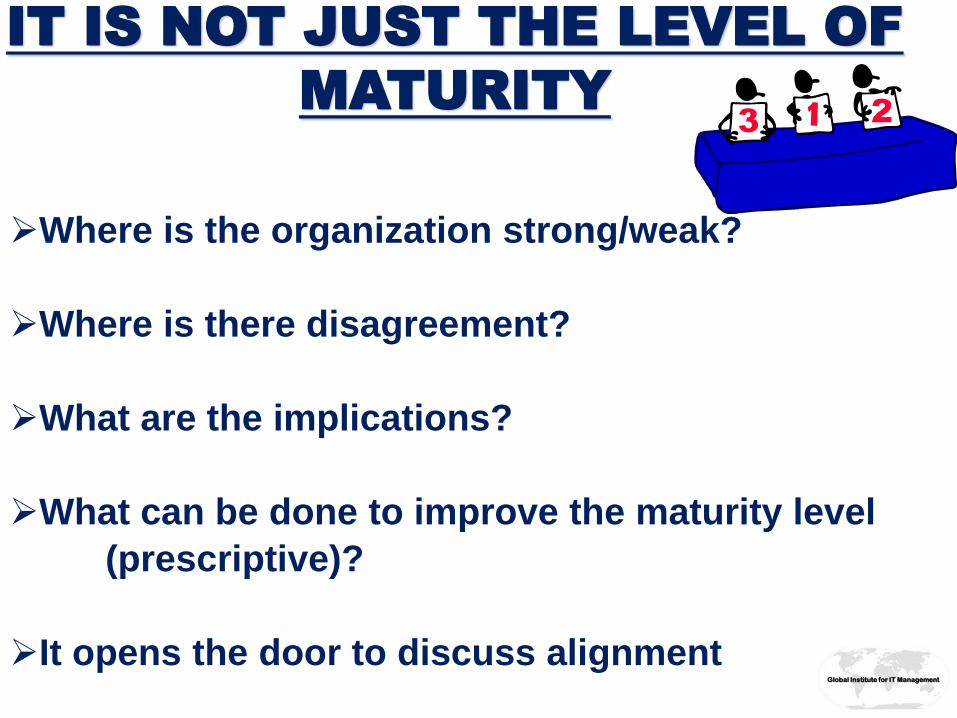
Where is the organization strong/weak?
Where is there disagreement?
What are the implications?
What can be done to improve the maturity level
(prescriptive)?
It opens the door to discuss alignment
IT IS NOT JUST THE LEVEL OF
MATURITY
Global Institute for IT Management
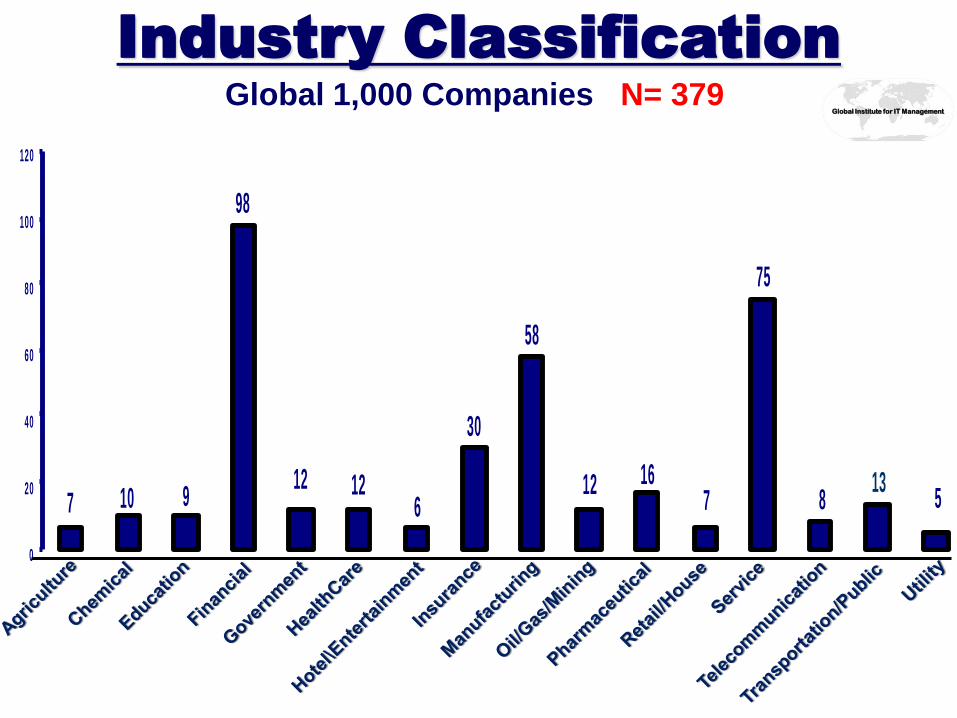
7 10 9
98
12 126
30
58
12 167
75
813
5
0
20
40
60
80
100
120
Industry Classification
Global 1,000 Companies N= 379
Global Institute for IT Management
0
100
200
300
400
500
600
700
800
900
1000
1100
1200
1300
1400
1500
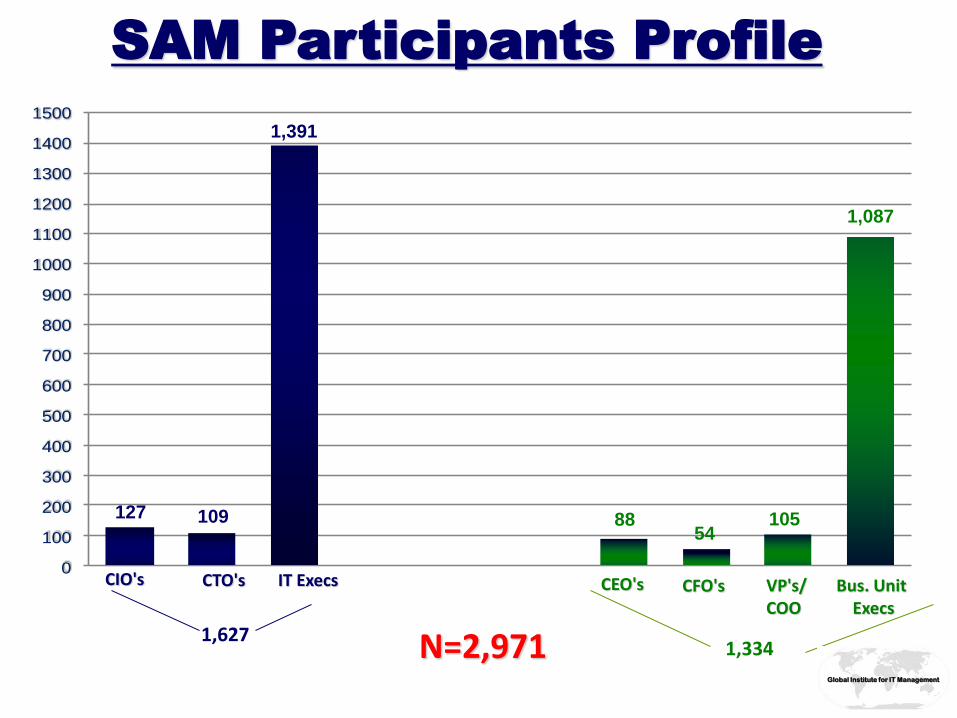
SAM Participants Profile
CIO's CEO's CFO's VP's/ COO
Bus. Unit Execs
CTO's IT Execs
1,627 1,334 N=2,971
1,391
127 109 88 54
105
1,087
Global Institute for IT Management

SAM Geographic Participation
Total Number Of Companies = 378 Global Institute for IT Management

2.50
2.70
2.90
3.10
3.30
3.50U
nder
stan
ding
of B
usin
ess
by IT
Inte
r/In
tra
Org
aniz
atio
nal L
earn
ing
Kno
wle
dge
Shar
ing
busi
ness
str
ateg
ic p
lann
ing
Bud
geta
ry C
ontr
ol
Stee
ring
com
mtte
reac
t/res
pond
busi
ness
per
cept
ion
of IT
val
ue
shar
ed ri
sks
and
rew
ards
rela
tions
hip/
trus
t sty
le
IT
Governance
Avg. Score: 3.21
Partnership
Avg. Score:
3.14
Scope & Architecture Avg. Score: 3.14
Skills
Avg. Score: 2.97
Communications
Avg. Score: 3.03
Value Metrics
Avg. Score: 3.03
Overall SAM Assessment Maturity
2 1 2 4 4 6
Average BUS
B
usin
es
s S
tra
teg
ic P
lan
nin
g
IT
Str
ate
gic
Pla
nn
ing
Bu
dg
eta
ry C
ontr
ol
IT
In
ve
stm
ent M
ana
ge
me
nt
S
teerin
g C
om
mitte
es
P
rio
riti
za
tio
n P
roc
es
s
R
ole
of
IT i
n S
tra
teg
ic B
us P
lan
nin
g
Share
d G
oals
, R
isk, R
ew
ard
s/P
enaltie
s
Bu
sin
ess P
erc
ep
tio
n o
f IT
Va
lue
IT
Pro
gra
m M
an
ag
em
en
t
R
ela
tion
ship
/Tru
st S
tyle
B
usin
es
s S
po
nso
r/C
ham
pio
n
Sc
op
e o
f IT
Sys
tem
s
A
rch
ite
ctu
ral In
teg
rati
on
Bu
sin
es
s &
IT
Ch
an
ge
Ma
na
ge
me
nt
In
fra
str
uc
ture
F
lex
ibilit
y
Sta
nd
ard
s A
rtic
ula
tion
& C
om
plia
nce
In
no
va
tion
, E
ntr
epre
ne
urs
hip
L
ocu
s o
f P
ow
er
C
are
er
cro
ss
ove
r
E
du
cati
on
, C
ros
s-T
rain
ing
So
cia
l, P
olit
ica
l, T
rusting
In
terp
ers
ona
l
Att
rac
t &
Re
tain
bes
t ta
len
t
Ch
an
ge
Rea
din
es
s
IT
Me
tric
s
Bu
sin
ess M
etr
ics
Ba
lan
ce
d M
etr
ics
S
erv
ice
Le
ve
l A
gre
em
ents
Be
nc
hm
ark
ing
F
orm
al A
sse
ssm
en
ts/R
evie
ws
Co
nti
nu
ou
s Im
pro
ve
me
nt
De
mo
ns
tra
ted
Co
ntr
ibu
tio
n o
f IT
to
Bu
s
In
ter/
Intr
a-o
rga
niz
ati
on
al le
arn
ing
U
nd
ers
tan
din
g o
f B
usin
ess b
y I
T
Pro
toc
ol R
igid
ity
Kn
ow
led
ge
Sh
ari
ng
Un
de
rsta
nd
ing
of
IT b
y B
us
ine
ss
Lia
iso
ns B
read
th/E
ffe
ctive
ne
ss
Re
ac
t/R
esp
on
d q
uic
kly
Overall Alignment Average Score: 3.09 * *
Global Institute for IT Management
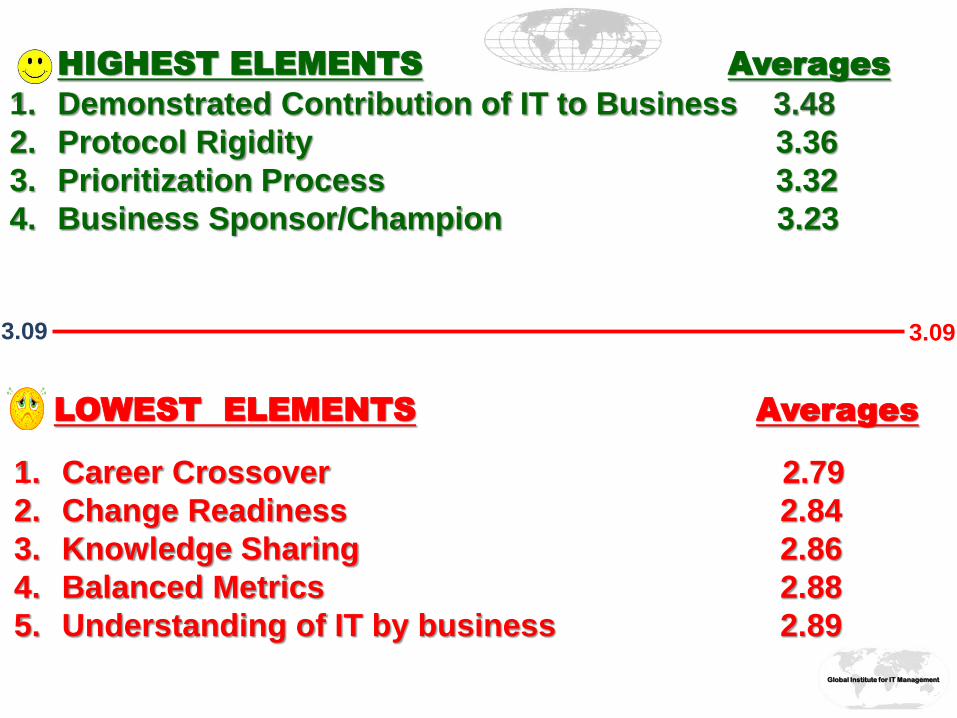
HIGHEST ELEMENTS Averages
LOWEST ELEMENTS Averages
1. Career Crossover 2.79
2. Change Readiness 2.84
3. Knowledge Sharing 2.86
4. Balanced Metrics 2.88
5. Understanding of IT by business 2.89
3.09 3.09
1. Demonstrated Contribution of IT to Business 3.48
2. Protocol Rigidity 3.36
3. Prioritization Process 3.32
4. Business Sponsor/Champion 3.23
Global Institute for IT Management

Geography Number of
Companies COMMUNICATION COMPETENCY GOVERNANCE PARTNERSHIP
SCOPE OF IT
ARCHITECTURE SKILLS
Overall
Average
Middle
East/Africa 9 2.15 2.29 1.98 2.24 1.86 2.33 2.14
USA 184 2.86 2.87 3.06 2.96 2.98 2.77 2.92
Europe 70 2.98 2.89 3.20 3.15 3.07 2.93 3.04
Latin
America 42 3.22 3.12 3.09 3.24 3.33 3.13 3.19
Asia 73 3.49 3.55 3.68 3.59 3.58 3.46 3.56
Geography: Maturity by Component
Overall Alignment Average Score: 3.09
378
Global Institute for IT Management

1. Protocol Rigidity 3.50
2. Business Strategic Planning 3.40
3. IT Strategic Planning 3.40
4. Business Sponsor/Champion 3.37
5. IT Program Management 3.30
HIGHEST ELEMENTS Averages
LOWEST ELEMENTS Averages
1. Knowledge Sharing 2.47
2. Balanced Metrics 2.65
3. IT Metrics 2.73
1. Education, Cross-Training 2.74
2. Budgetary Control 2.77
Alignment Average Score: 2.80 EUROPE
Global Institute for IT Management
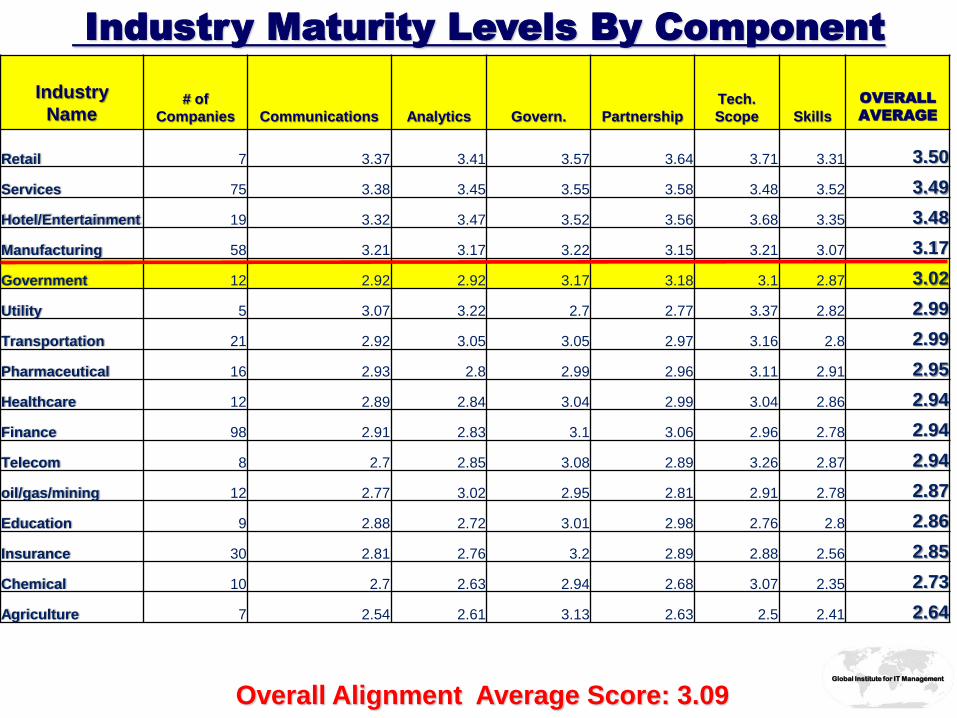
Industry Maturity Levels By Component
Industry
Name # of
Companies Communications Analytics Govern. Partnership
Tech.
Scope Skills
OVERALL
AVERAGE
Retail 7 3.37 3.41 3.57 3.64 3.71 3.31 3.50
Services 75 3.38 3.45 3.55 3.58 3.48 3.52 3.49
Hotel/Entertainment 19 3.32 3.47 3.52 3.56 3.68 3.35 3.48
Manufacturing 58 3.21 3.17 3.22 3.15 3.21 3.07 3.17
Government 12 2.92 2.92 3.17 3.18 3.1 2.87 3.02
Utility 5 3.07 3.22 2.7 2.77 3.37 2.82 2.99
Transportation 21 2.92 3.05 3.05 2.97 3.16 2.8 2.99
Pharmaceutical 16 2.93 2.8 2.99 2.96 3.11 2.91 2.95
Healthcare 12 2.89 2.84 3.04 2.99 3.04 2.86 2.94
Finance 98 2.91 2.83 3.1 3.06 2.96 2.78 2.94
Telecom 8 2.7 2.85 3.08 2.89 3.26 2.87 2.94
oil/gas/mining 12 2.77 3.02 2.95 2.81 2.91 2.78 2.87
Education 9 2.88 2.72 3.01 2.98 2.76 2.8 2.86
Insurance 30 2.81 2.76 3.2 2.89 2.88 2.56 2.85
Chemical 10 2.7 2.63 2.94 2.68 3.07 2.35 2.73
Agriculture 7 2.54 2.61 3.13 2.63 2.5 2.41 2.64
Overall Alignment Average Score: 3.09 Global Institute for IT Management

SAM Performance Framework
Communications
Competency
Governance
Partnership
Tech Scope
Skills/HR
Strategic
Alignment
Maturity
Performance
Organizational
Structure
Reporting
Structure
Global Institute for IT Management

The direct impact of the
individual components on
Company Performance is
negligible.
η2
Company
Performance
γ1,7=0.063 γ1,8=0.193* γ1,9=0.417* γ1,10=0.167*
β2,1=0.387*η1
SAM Alignment
ξ1
Communications
ξ2
Value
Measurement
ξ3
IT Governance
ξ4
Partnership
ξ5
IT Scope
ξ6
Skills
ξ7
Industry Sector
ξ10
Reporting
Structure
ξ8
Region
ξ9
Organizational
Structure
*p<0.001
Global Institute for IT Management
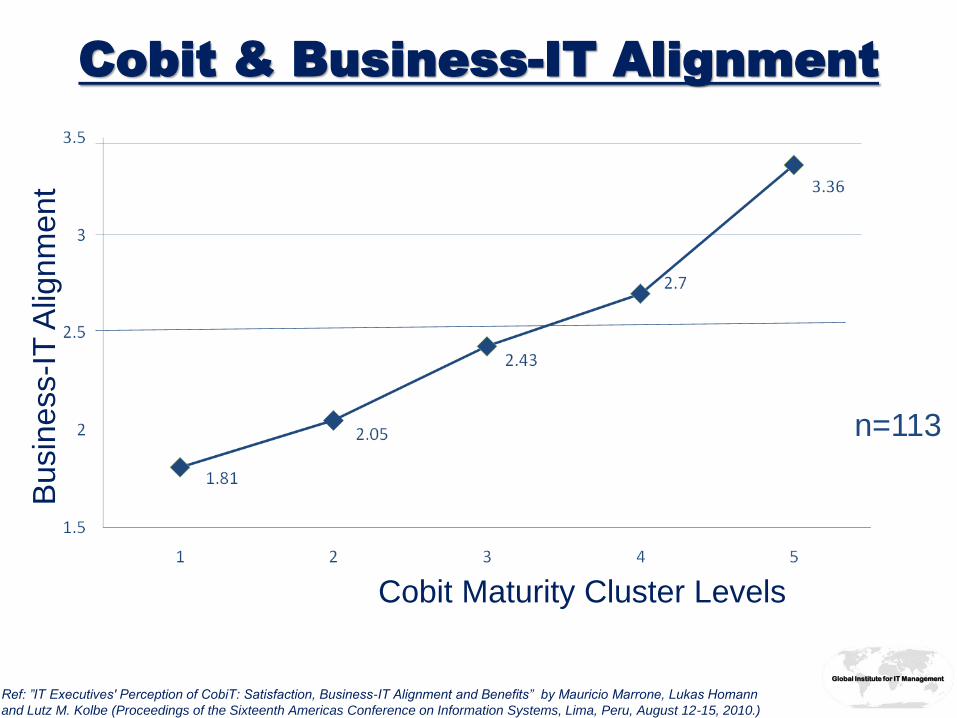
Cobit & Business-IT Alignment
Cobit Maturity Cluster Levels
Busin
ess-I
T A
lignm
ent
Ref: ”IT Executives' Perception of CobiT: Satisfaction, Business-IT Alignment and Benefits” by Mauricio Marrone, Lukas Homann
and Lutz M. Kolbe (Proceedings of the Sixteenth Americas Conference on Information Systems, Lima, Peru, August 12-15, 2010.)
n=113
Global Institute for IT Management
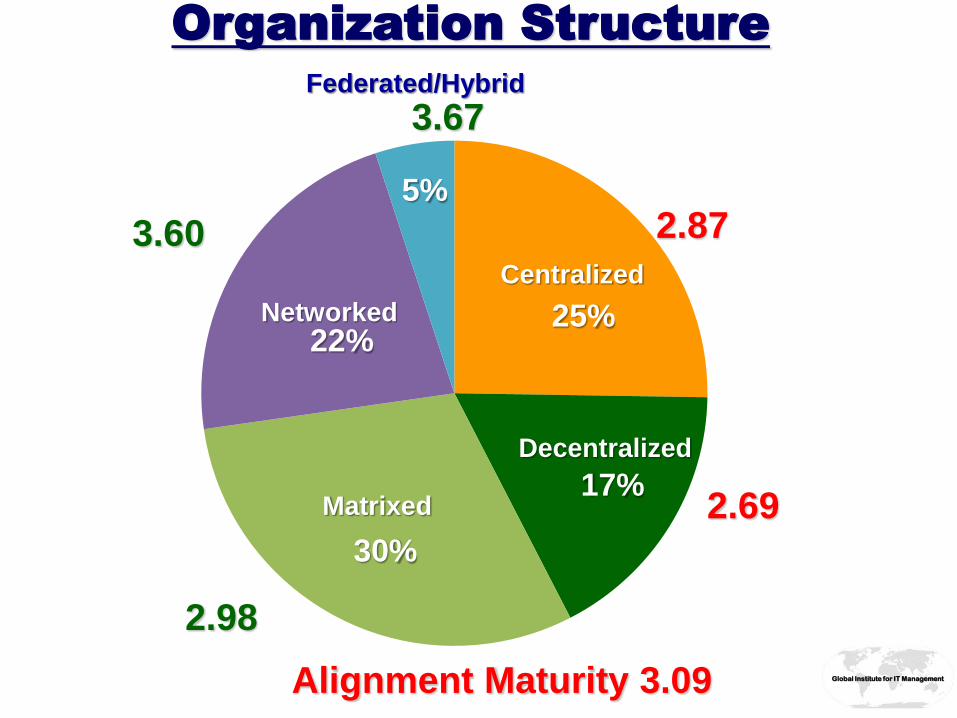
22%
Decentralized
5%
Matrixed
25%
Centralized
Networked
30%
17%
Federated/Hybrid
2.98
3.60
2.69
2.87
Alignment Maturity 3.09
3.67
Global Institute for IT Management
Organization Structure

CIO Reporting Structure
President,
Chairman,
CEO
56 % 30 %
9 %
5 %
COO
CFO
Business
Unit Exec
3.45
3.36
3.25
3.01
Alignment Maturity 3.09 Global Institute for IT Management
Open up the
door to improve
the relationship
of IT & Business!