ISWM Strategy Report for Hlifax
95
Item No. 3 Committee of the Whole January 14, 2014 TO: Mayor Savage and Members of Halifax Regional Council SUBMITTED BY: ___________________________________________________________ Richard Butts, Chief Administrative Officer __________________________________________________________ Mike Labrecque, Deputy Chief Administrative Officer DATE: January 8, 2014 SUBJECT: Integrated Solid-Waste Resource Management Strategy Review – Final Report ORIGIN Regional Council directed staff to assess the Integrated Solid-Waste Resource Management Strategy (ISWMS) to enhance system environmental and fiscal performance LEGISLATIVE AUTHORITY HRM Charter, Part XIII, Solid Waste Resource Management RECOMMENDATIONS It is recommended that Regional Council: 1. Confirm the objectives of the Community Stakeholders Committee Integrated Resource Management Strategy 1995: a. Maximize reduction, reuse and recycling of waste resources; b. Maximize environmental and fiscal sustainability of the waste program; c. Foster public stewardship and conservation. RECOMMENDATIONS CONT’D ON NEXT PAGE
Transcript of ISWM Strategy Report for Hlifax

Item No. 3
Committee of the Whole
January 14, 2014
TO: Mayor Savage and Members of Halifax Regional Council
SUBMITTED BY: ___________________________________________________________
Richard Butts, Chief Administrative Officer
__________________________________________________________
Mike Labrecque, Deputy Chief Administrative Officer
DATE: January 8, 2014
SUBJECT: Integrated Solid-Waste Resource Management Strategy Review – Final
Report
ORIGIN
Regional Council directed staff to assess the Integrated Solid-Waste Resource Management
Strategy (ISWMS) to enhance system environmental and fiscal performance
LEGISLATIVE AUTHORITY
HRM Charter, Part XIII, Solid Waste Resource Management
RECOMMENDATIONS
It is recommended that Regional Council:
1. Confirm the objectives of the Community Stakeholders Committee Integrated Resource
Management Strategy 1995:
a. Maximize reduction, reuse and recycling of waste resources;
b. Maximize environmental and fiscal sustainability of the waste program;
c. Foster public stewardship and conservation.
RECOMMENDATIONS CONT’D ON NEXT PAGE

Solid Waste Strategy Review – Final Report
Committee of the Whole Report - 2 - January 14, 2014
2. Direct staff to initiate development of a business case for the source separated organics
program to introduce an Anaerobic Digestion processing capability and other program
changes to improve system cost performance and compost quality and return to Regional
Council with a revised plan by 30 June, 2014;
3. Initiate By-law amendments to improve organics collection, processing and finished
compost product quality for residential source separated organics by:
a. removing boxboard as a mandated green bin product (while still permitted as a
kitchen scrap material catcher);
b. mandating use of kraft paper bags for separate collection of leaf and yard waste;
and,
c. banning grass clippings from collection;
4. Direct staff to site a second household special handling waste depot and introduce annual
district mobile household special handling waste events;
5. Initiate By-law amendments to:
a. mandate clear bags (with one nested opaque bag) for residential collections; and,
b. reduce garbage bag limits from 6 to 4;
6. Direct staff to increase:
a. curb-side education and monitoring;
b. apartment tenant education and monitoring; and,
c. ICI load monitoring and inspections at the landfill;
7. Amend By-law S-600 to allow for the export of ICI residual waste (garbage) outside
HRM, and amend Administrative Order number 16 to provide for an increase in fees for
disposal of ICI residual waste from $125 per tonne to the assessed system cost of $170.00
per tonne;
8. Direct staff to initiate consultation with MIRROR NS and the Community Monitoring
Committee on options for changes in the operating model (front end processor facility,
waste stabilization facility, residual disposal facility) at Otter Lake landfill site A,
returning to Council with a transition plan for landfill operations at the site based on
diversion outcomes resulting from the changes outlined in this report; and
9. Extend operations at Otter Lake beyond 2024 and direct staff to increase the vertical
height of existing and future cells by 15 meters and establish an Integrated Solid Waste
Management Campus at the site to support new facilities and alternative technologies as
they become viable.

Solid Waste Strategy Review – Final Report
Committee of the Whole Report - 3 - January 14, 2014
EXECUTIVE SUMMARY
Halifax Regional Municipality – Integrated Solid Waste Management Strategy (ISWMS) System
Review
HRM’s ISWMS was based in principle on the Community Stakeholders Committee (CSC)
consultation process which created An Integrated Waste/Resource Management Strategy, dated
March 25, 1995. That process was mandated as a result of the outcomes from the Sackville
Landfill and its negative impact on the community and environment. The subsequently
implemented ISWMS 1997 changed two critical conditions of the original strategy. The ISWMS
plan changes resulted in continued reliance on pre-processing prior to disposal at the landfill
compounding long-term escalating system costs.
The ISWMS system review identified a number of program and system changes to achieve
Regional Council’s directive to enhance system environmental and fiscal performance. The
system review confirmed that HRM has made progress in terms of the integrated waste
management strategy objectives. However, HRM failed to achieve the intended outcomes of the
CSC Strategy, 1995 as a result of the changes to the implemented ISWMS plan 1997. The
current ISWMS plan does not meet the environmental or fiscal objectives of the CSC Strategy.
The ISWMS Review identified system changes which can meet the CSC Strategy objectives.
The outlined options in this report would significantly increase diversion from Otter Lake within
3 years. Statistical data supports the analysis that the changes will reduce delivered putrescible
organics below 5,000 tonnes per year from the current approximately 25,000 tonnes at Otter
Lake. Waste stream data indicates that over 5,000 tonnes of putrescible organics currently goes
directly into the landfill without passing through the waste stabilization facility (WSF). The
outlined changes would essentially empty the WSF facility.
The recommended system changes will achieve the CSC strategy objectives and enable re-
evaluation of the current operating model at the landfill.
The system review identified options to improve overall ISWMS fiscal and environmental
performance. The changes include:
Confirm anew the CSC Strategy objectives;
Improve compost quality and reduce organics program costs through processing
changes, collection changes and by-law changes to improve monitoring and
compliance;
Improve household special handling waste program diversion and visibility
through the establishment of a second permanent depot, reviewing depot hours or
operation and establishing new district mobile events to be held yearly;
Reduce materials delivered to Otter Lake landfill by allowing the export of
residual waste (garbage) outside HRM saving landfill cell capacity and increased
education, monitoring and compliance efforts;

Solid Waste Strategy Review – Final Report
Committee of the Whole Report - 4 - January 14, 2014
Improve the environmental and fiscal performance of landfill operations through
negotiated modifications to the operating model as a result of system outcomes
from these recommended program changes;
Reduce future ISWMS system requirement costs through extending operations at
Otter Lake beyond 2024, and increasing cell height by 15 meters; and,
Increase strategic adaptability of the ISWMS system program through
establishment of an ISWMS campus at the Otter Lake site where new projects and
facilities will be developed.
The ISWMS Review confirmed that a campus model provides for the most adaptable, cost
effective and efficient ISWMS program. While this is a departure from the CSC strategy vision
of dissipated sites, consolidating facilities enables greater flexibility to incorporate alternative
technologies and industry advancements in terms of equipment, collection systems and material
resource management. A campus scenario also enhances the opportunities from a regionalized
waste management perspective. The logical location for a campus site in terms of environmental,
social and fiscal sustainability is at the current Otter Lake site.
The ISWMS review confirmed the ability to achieve Regional Council’s directive to improve
fiscal performance and environmental stewardship. A decision to remain at Otter Lake can
significantly reduce program costs and future system costs by extending operations beyond 2024
and capitalizing on the existing investment in Cells 1 through 6 through vertical extension. A
campus site will also include development of a landfill gas to energy project and enable future
energy from waste projects to provide power and heat for campus facilities. Remaining at Otter
Lake eliminates a potential 100 million dollar landfill siting project.
BACKGROUND
a. The Solid Waste Strategy Review Process
Regional Council directed staff to assess the Integrated Solid Waste Resource Management
Strategy System (ISWMS) program to enhance environmental stewardship and improve fiscal
performance.
The review of the ISWMS originated from a Community Monitoring Committee (CMC) letter
dated 9 September, 2010. CMC requested Regional Council direct staff to consult with CMC on
determining the specific closure date for the Otter Lake landfill. The Community Stakeholder
Committee (CSC) Strategy vision was to reduce HRM’s reliance on landfilling through diversion
of resources. CMC’s request to determine the future of HRM’s Otter Lake landfill was an
appropriate time to review the ISWMS in terms of HRM’s progress in achieving the objectives
of the citizen developed An Integrated Solid Waste Resource Strategy, 1995.1
1 An Integrated Waste/Resource Management Strategy, dated March 25, 1995.
Solid Waste Strategy Review – Final Report
Committee of the Whole Report - 5 - January 14, 2014
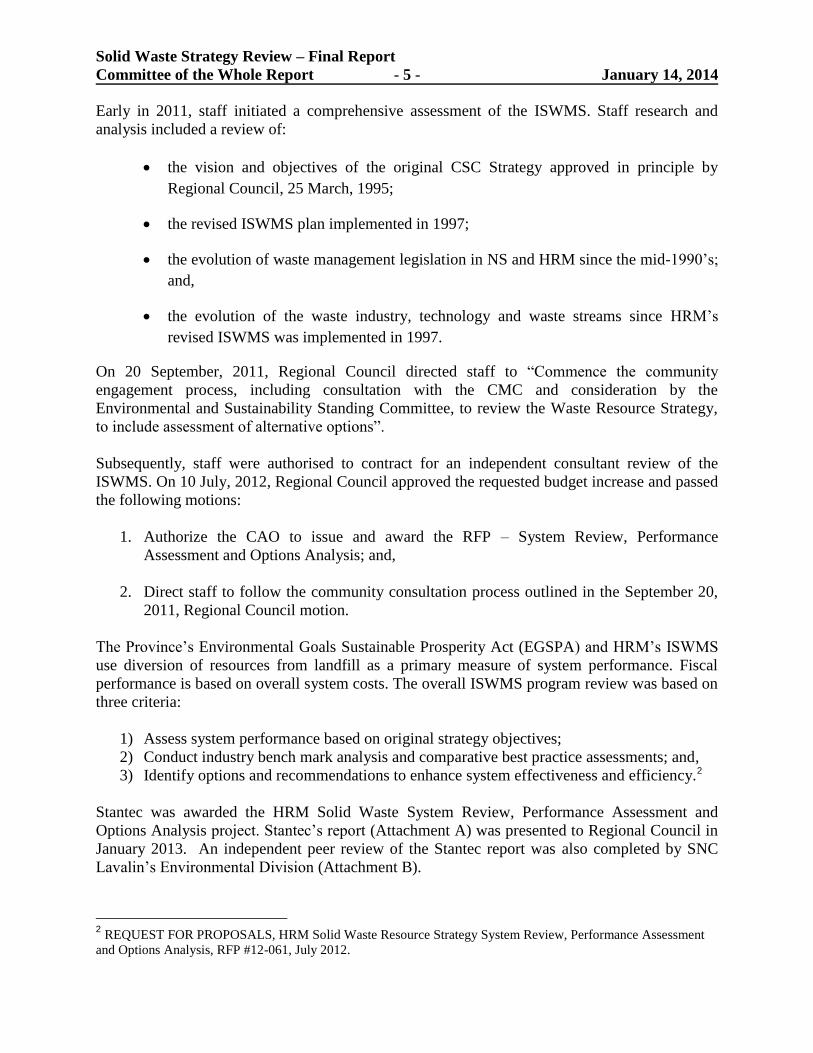
Early in 2011, staff initiated a comprehensive assessment of the ISWMS. Staff research and
analysis included a review of:
the vision and objectives of the original CSC Strategy approved in principle by
Regional Council, 25 March, 1995;
the revised ISWMS plan implemented in 1997;
the evolution of waste management legislation in NS and HRM since the mid-1990’s;
and,
the evolution of the waste industry, technology and waste streams since HRM’s
revised ISWMS was implemented in 1997.
On 20 September, 2011, Regional Council directed staff to “Commence the community
engagement process, including consultation with the CMC and consideration by the
Environmental and Sustainability Standing Committee, to review the Waste Resource Strategy,
to include assessment of alternative options”.
Subsequently, staff were authorised to contract for an independent consultant review of the
ISWMS. On 10 July, 2012, Regional Council approved the requested budget increase and passed
the following motions:
1. Authorize the CAO to issue and award the RFP – System Review, Performance
Assessment and Options Analysis; and,
2. Direct staff to follow the community consultation process outlined in the September 20,
2011, Regional Council motion.
The Province’s Environmental Goals Sustainable Prosperity Act (EGSPA) and HRM’s ISWMS
use diversion of resources from landfill as a primary measure of system performance. Fiscal
performance is based on overall system costs. The overall ISWMS program review was based on
three criteria:
1) Assess system performance based on original strategy objectives;
2) Conduct industry bench mark analysis and comparative best practice assessments; and,
3) Identify options and recommendations to enhance system effectiveness and efficiency.2
Stantec was awarded the HRM Solid Waste System Review, Performance Assessment and
Options Analysis project. Stantec’s report (Attachment A) was presented to Regional Council in
January 2013. An independent peer review of the Stantec report was also completed by SNC
Lavalin’s Environmental Division (Attachment B).
2 REQUEST FOR PROPOSALS, HRM Solid Waste Resource Strategy System Review, Performance Assessment
and Options Analysis, RFP #12-061, July 2012.

Solid Waste Strategy Review – Final Report
Committee of the Whole Report - 6 - January 14, 2014
Concurrent to the Peer review analysis, staff developed a consultation framework as per the
approved 2008 Community Engagement policy and direction from Regional Council.
The following motion was approved at the 23 April, 2013 Regional Council session.
Motion of Regional Council:
1. Release the Stantec Waste Resource Strategy report January, 2013.
2. Direct Staff to initiate public consultation on the Stantec Report options and
recommendations beginning with the community monitoring committee and in particular
recommendations A1 and A3 that:
i. The Front End Processor FEP and Waste Stabilization facility (WSF) be
closed by the end of 2013; and,
ii. The life of the Otter Lake Landfill be extended through vertical expansion.
3. Direct staff that as part of the public consultation process to initiate discussions with the
operator of the Otter Lake Landfill concerning the implications of the Stantec Report
options and recommendations.
4. Direct the CAO to report to the Environmental and Sustainability Standing Committee.
HRM contracted National Public Relations to facilitate the community engagement consultation
process in accordance with the Regional Council motion and approved framework. The
consultation process was completed and National Public Relations submitted their final report on
6 December, 2013 (Attachment C).
b. History of HRM’s Integrated Solid Waste Management System
i. The CSC Strategy Vision, 1995
The CSC Strategy vision for a municipal waste management regime was described as:
…an achievable vision which has:
The least possible negative impact on the natural environment;
The most effective methods of collecting, processing, recovering and reusing the
material resources produced and consumed by our communities; and,
The most responsible format for minimizing the amount of inert residues which
emerge as the final product of the resource management system.3
Authors who first envisioned the CSC Strategy regime said:
3 An Integrated Waste/Resource Management Strategy, page vi, dated March 25, 1995.

Solid Waste Strategy Review – Final Report
Committee of the Whole Report - 7 - January 14, 2014
“To achieve this vision, we must shift from our present focus on waste management to
focus on the conservation and appropriate use of resources. As long as we think
primarily of how to deal with waste, even if our objective is to minimize waste, we will
ignore the fundamental use of resources.”4
The CSC Strategy assumed a new position: waste stream materials were resources not garbage.
The Strategy outlined a model to reduce society’s reliance on landfill to minimize the associated
negative environmental and community impacts. This stewardship driven position was in
response to the challenges resulting from the Sackville Landfill. The strategy required
behavioural changes to absolutely minimize materials ending up in a landfill.
CSC created three objectives to support their vision:
Maximize reduction, reuse and recycling of waste resources
Maximize environmental and fiscal sustainability of the waste program
Foster public stewardship and conservation5
The CSC established an ambitious target of 88% of the waste stream diverted to organic and
recyclable processing by the year 2000.6 However, this was based on an assessment that
organics represented approximately 47% of the waste stream. We know today that this
assessment was inaccurate. Organics currently represents only 22% of the waste stream. Garbage
also currently represents 22% of the waste stream. Therefore, if all organics and recyclables were
diverted, the best HRM could achieve would be 78% diversion.
The CSC Strategy incorporated reduced long-term landfill costs and the generation of revenues
from recycled materials to offset implementation and initial higher system costs. Program
innovations included:
Separation of organic waste stream materials by residents and businesses at point of
generation through provision of green carts;
Organics processing plants to create marketable and revenue generating compost;
Separation of recycling materials at point of generation to protect their value;
Multiple waste streams processed at separate processing plants to divert materials from
landfill;
Interim processing and stabilizing of organics remaining in the garbage stream through a
Waste Stabilization Facility (WSF) into marketable low grade compost and diversion
from landfill;
Interim processing, separation and diversion of recyclables remaining in the garbage
stream through the Front End Processor for revenue and diversion from landfill.
4 J. Jackson & B. Wallace, “Resource Management Systems: An Alternative to Current Waste Management
Systems,” study, 1993. 5 An Integrated Waste/Resource Management Strategy, page 4, 1995.
6 An Integrated Waste/Resource Management Strategy, Chart 3-1, 1995.

Solid Waste Strategy Review – Final Report
Committee of the Whole Report - 8 - January 14, 2014
The CSC Strategy objective of behavioural change was founded on source-separation of
materials at the point of generation. Source separation would achieve environmental protection
and reduce reliance on landfill. Source separation would leave only inert residual materials to go
to landfill. Education and monitoring were critical in establishing the new regime. Fiscal
sustainability was based on long-term system cost savings from lower long-term landfill costs
resulting from significantly reduced tonnage being delivered to landfill.
The CSC Strategy envisioned a long-term solution which would:
reduce reliance and costs of landfill,
reduce the physical impacts of landfill on the environment,
minimize the negative impacts from leachate, gases, odours and vectors, and,
provide an environmentally and fiscally sustainable waste management system for
the Region that would be “acceptable for the next 100 years…”7
The CSC strategy recognized that achievement of the behavioural change objective would take
time. The Strategy committed to interim processing of garbage to divert organics and recyclable
materials remaining in the black bag garbage stream while behaviours changed. The Front End
Processor (FEP) and Waste Stabilization Facility (WSF) would divert improperly separated
materials from the landfill and capitalize on their value as resources. The resulting revenues
would offset the interim processing costs.
The strategy envisioned that the FEP/WSF model would be “scaled down in a planned manner as
source separated centralized composting scaled up.”8 Environmental and community protection
were derived from behavioural change and source separation and the landfill cell liner designs
and specifications. In the CSC Strategy, the mechanical FEP/WSF system was not intended as
the environmental and community protection. The FEP/WSF system was intended to recover
resources for revenue to offset system costs.
The Strategy outlined system changes and expectations to enable HRM’s evolution to a
conserver society. Managing of the system changes would be a challenge, which was the
principal reason for a single proponent to have oversight and management of the entire system.
However, the subsequent plan implemented to support the ISWMS incorporated several changes.
ii. The Implemented Integrated Solid Waste Management Strategy System Model 1996-
1999
CSC Strategy success meant all organics went to compost processing plants, all recycling
materials went to recycling plants and the remaining inert residual waste materials would be
stored in landfill. The ultimate objective was for inert materials stored in the landfill, eventually
free of toxics and organics, to be available for later recovery and use.9 Green carts and organics
separation were the innovative keys to practically and sustainably minimize organic materials in
7 An Integrated Waste/Resource Management Strategy for Halifax County/Halifax/Dartmouth/Bedford, Prepared by
The Community Stakeholder Committee (CSC) and Adopted in Principle, page 2, March 25, 1995. 8 An Integrated Waste/Resource Management Strategy, page 7, 1995.
9 An Integrated Waste/Resource Management Strategy, page ii, dated March 25, 1995.

Solid Waste Strategy Review – Final Report
Committee of the Whole Report - 9 - January 14, 2014
the landfill and the negative environmental impact of odorous greenhouse gases (GHG) and
leachate.
In 1996, Council was presented with a revised ISWMS implementation plan which changed the
outcomes of the Strategy in terms of diversion and disposal. MIRROR NS’s analysis was that
there were less organics in HRM than the Strategy projected, and that they could find no
evidence of a successfully operated positive organics sorting system.10
“MIRROR cannot find evidence of any operation in the world that can substantiate these
recovery rates for sorting organics, nor for any successfully operated positive sorting
system of organic. Consequently, the FEP organics diversion rate proposed in this plan
is lower than that of the Strategy, based on a negative sort (selecting out the more easily
removable inert materials, such as paper and cans, leaving organics behind) and
financial constraints on the FEP process.”11
Within a year of the CSC Strategy’s “approval in principle,” MIRROR NS and those involved in
the ISWMS implementation process determined that the Strategy objectives were not practical
from a fiscal or operational perspective. The CSC remained engaged through this process.
Changes were made to accommodate what the proponent felt were reasonable adjustments to the
system.
The implemented ISWMS plan, 1997, incorporated many of the key innovations of the CSC
Strategy 1995, including: source separation, green carts, multi-stream recycling, and organics
processing. However, the ISWMS plan incorporated two changes from the CSC Strategy, which
affected system outcomes and shifted responsibilities in the proposed new ISWMS plan regime
between HRM and the proponent MIRROR NS.12
Firstly, the implemented ISWMS plan incorporated changes to the landfill operations plan to
address challenges with assessed system cost and practicality implications. Diversion of
resources mixed in with inert residual waste materials delivered to the landfill was changed to
processing, stabilizing, limited diversion but mainly disposal in the landfill.
The change from diversion to disposal of materials at the landfill was a major shift from the CSC
Strategy objectives envisioned by HRM citizens. This change resulted in long-term landfill
processing dependency and escalating system costs, all while the CSC strategy diversion goals
continue to not be met.
Secondly, the Strategy intended for a single contracted proponent to assume responsibility for
overall ISWMS implementation and management. The single proponent would have total control
over all system components and all program measures. The CSC Strategy assessed a high level
10
Metropolitan Halifax Solid Waste/Resource Management System Implementation Plan, MIRROR Nova Scotia,
page 7, September 15 1995. 11
Metropolitan Halifax Solid Waste/Resource Management System Implementation Plan, MIRROR Nova Scotia,
page 7, September 15 1995. 12
Revised Regional Solid Waste/Resource Management Plan Framework RE; Scope and Utility of the FEP/WSF, 3
May 1996, Solid Waste Resource Advisory Committee MOU.

Solid Waste Strategy Review – Final Report
Committee of the Whole Report - 10 - January 14, 2014
of risk associated with the objective of 88% diversion by 2000.13 This risk was reflected in the
acknowledged higher program costs. The contracted proponent, staff, (in consultation with the
selected proponent, MIRROR NS) and Sound Resources (another consultant firm involved in the
process) revised this single proponent approach. HRM assumed responsibility of program
implementation and management of everything except operation of the landfill. MIRROR NS
assumed responsibility for landfill development and operations only.
Excerpts from the revised plan report detailing the framework changes are:
8. FEP & WSF
a) FEP was to be designed for minimal sorting. The machines would separate
metals from the stream and minimal screening capability (i.e. trommel only) was
intended for separating the putrescible organics from the mixed waste stream for
stabilization.14
11. Proposed Business Relationship Structure
a) MIRROR will design, build, and operate the front end processing – waste
stabilization plant as well as the residuals disposal facility.
b) HRM assumed day to day operations administration, policy making and oversight
authority of the integrated system.15
In the span of one year, 1995 to 1996, following hundreds of citizen consultation meetings and
the resulting approval in principal of the CSC Strategy, the vision was fundamentally reversed.
Diversion from landfill became disposal in landfill based on the need to reduce costs. The system
would only mechanically screen materials and stabilize organics prior to disposal in the RDF
(landfill).16 Diversion from landfill was still an objective, but this outcome was to be achieved
only through source separation.
In 1998, before the Otter Lake site was fully operational, in an interview with the Daily News
describing the functionality of the FEP-WSF, a senior representative of MIRROR NS described
the process of FEP-WSF stabilization this way:
“We have to ensure there is no rotable material going into the RDF. Not only does it
make sense from an environmental stand point, but as an operator it also makes sense in
terms of less methane, odour and strength of leachate.” “By putting the residuals
through the WSF, we achieve an environmentally inert material. What nature takes 30
years to do, the WSF does in 18-21 days.”17
13
An Integrated Waste/Resource Management Strategy, Chart 3-1, 1995. 14
Revised Regional Solid Waste/Resource Management Plan Framework RE; Scope and Utility of the FEP/WSF, 3
May 1996, Solid Waste Resource Advisory Committee MOU. 15
Revised Regional Solid Waste/Resource Management Plan Framework RE; Scope and Utility of the FEP/WSF, 3
May 1996, Solid Waste Resource Advisory Committee MOU. 16
Revised Regional Solid Waste/Resource Management Plan Framework RE; Scope and Utility of the FEP/WSF, 3
May 1996, Solid Waste Resource Advisory Committee MOU. 17
Supplement to the Sunday Daily News, October 18th
, 1998, Nova Scotia Business Journal, Grand Opening Otter
Lake, Halifax Regional Municipality, Otter Lake a Homegrown Solution, page 4.

Solid Waste Strategy Review – Final Report
Committee of the Whole Report - 11 - January 14, 2014
The expected outcome from the processing of materials through the FEP-WSF was elimination
of the negative environmental impacts of gases, odours, leachate and vectors.18 However, within
two year after operations began, in 2001, gases and odours began generating numerous
complaints from neighbouring residents. Odours were unanticipated given the stabilization
process.
Stabilization was supposed to eliminate gases and odours. The Otter Lake cell was new, open,
and receiving only stabilized putrescible organics. Gases and odours should not have been an
issue. MIRROR NS developed a pre-closure gas and odour management system of temporary
piping and wells to capture and flare off the fugitive gases escaping from the active cell. This fix
currently adds approximately $750,000.00/year to operating expenses at the site.
The rapid generation of fugitive gases and odours were unintended consequences of the
FEP/WSF processing operation which MIRROR NS was mandated to correct. The added cost of
the FEP/WSF processing was intended to eliminate this outcome. Instead, the FEP/WSF
facilities actually created a new problem. The cost of correcting this undesired FEP/WSF
outcome remains an on-going additional operating expense borne solely by HRM under the
current agreement. Since its implementation, the temporary gas and odour management fix has
added approximately $5,250,000 to HRM costs.
HRM pays all costs for operating the site. In addition, HRM pays a fixed percentage of those
costs as a profit to the operator. In the current contract, MIRROR NS is paid $0.25 for every
dollar spent at Otter Lake in terms of operating expenses.
This type of services contract is called a Cost Plus Percentage of Cost (CPPC) contract
agreement. This type of agreement does not favour the buyer of the service since there is no
incentive for the service provider to reduce costs or find efficiencies. Project Management theory
describes this type of agreement as follows:
Cost plus fee or Cost Plus Percentage of Cost (CPPC)
Not valid for federal contracts. Sellers are not motivated to control cost, used when buyer
can tell what is needed then what to do. Seller writes SOW. Bad for buyer,19
The ISWMS Plan changes resulted in two outcomes contrary to the CSC strategy vision.
1. The ongoing dependence on machine processing prior to disposal resulted in landfill
operation costs which became almost double industry standards and continue to rise even
while the tonnage of waste processed declines.
18
Appendix Q, Operations Plan, Agreement For The Design, Construction And Operation Of Components Of The
Halifax Regional Municipality’s Solid Waste Facilities,” page 21, dated July 25, 1997. 19
http://www.projectmanagement.net.au/pmbok-procurement-management-contract-types, By Rod Hutchings,
PMP, CPPD, SCPM, MAppSc| September 30, 2011.
Solid Waste Strategy Review – Final Report
Committee of the Whole Report - 12 - January 14, 2014
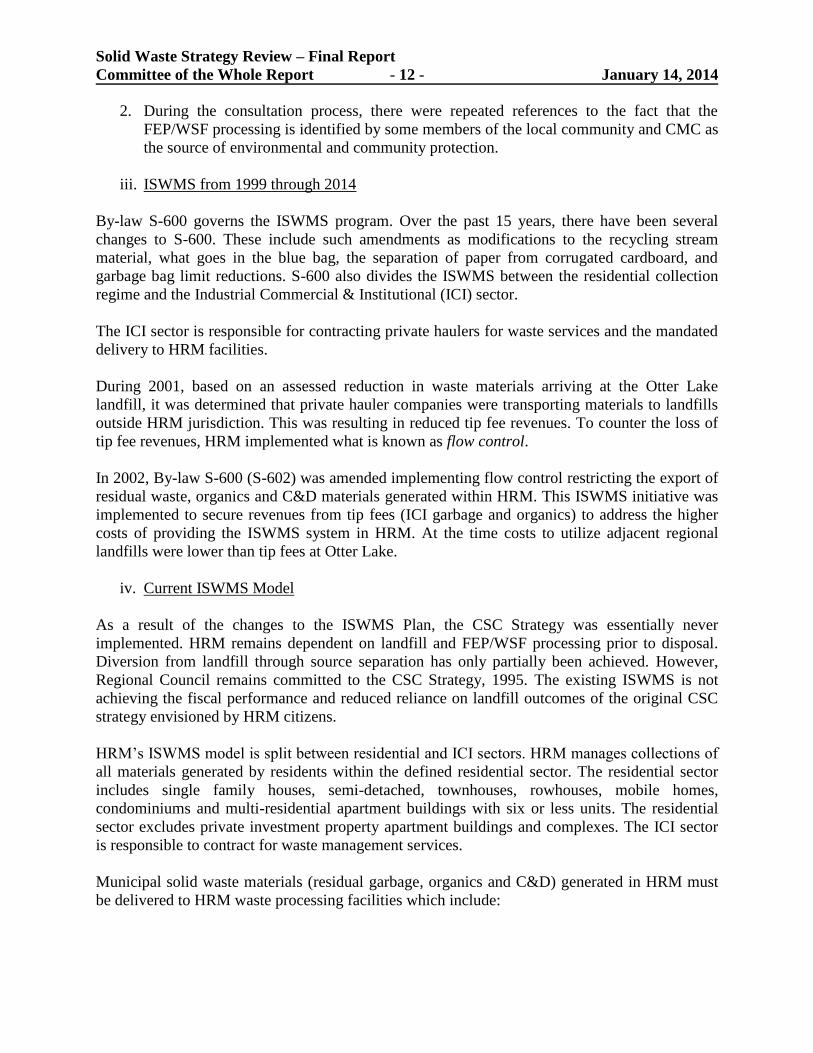
2. During the consultation process, there were repeated references to the fact that the
FEP/WSF processing is identified by some members of the local community and CMC as
the source of environmental and community protection.
iii. ISWMS from 1999 through 2014
By-law S-600 governs the ISWMS program. Over the past 15 years, there have been several
changes to S-600. These include such amendments as modifications to the recycling stream
material, what goes in the blue bag, the separation of paper from corrugated cardboard, and
garbage bag limit reductions. S-600 also divides the ISWMS between the residential collection
regime and the Industrial Commercial & Institutional (ICI) sector.
The ICI sector is responsible for contracting private haulers for waste services and the mandated
delivery to HRM facilities.
During 2001, based on an assessed reduction in waste materials arriving at the Otter Lake
landfill, it was determined that private hauler companies were transporting materials to landfills
outside HRM jurisdiction. This was resulting in reduced tip fee revenues. To counter the loss of
tip fee revenues, HRM implemented what is known as flow control.
In 2002, By-law S-600 (S-602) was amended implementing flow control restricting the export of
residual waste, organics and C&D materials generated within HRM. This ISWMS initiative was
implemented to secure revenues from tip fees (ICI garbage and organics) to address the higher
costs of providing the ISWMS system in HRM. At the time costs to utilize adjacent regional
landfills were lower than tip fees at Otter Lake.
iv. Current ISWMS Model
As a result of the changes to the ISWMS Plan, the CSC Strategy was essentially never
implemented. HRM remains dependent on landfill and FEP/WSF processing prior to disposal.
Diversion from landfill through source separation has only partially been achieved. However,
Regional Council remains committed to the CSC Strategy, 1995. The existing ISWMS is not
achieving the fiscal performance and reduced reliance on landfill outcomes of the original CSC
strategy envisioned by HRM citizens.
HRM’s ISWMS model is split between residential and ICI sectors. HRM manages collections of
all materials generated by residents within the defined residential sector. The residential sector
includes single family houses, semi-detached, townhouses, rowhouses, mobile homes,
condominiums and multi-residential apartment buildings with six or less units. The residential
sector excludes private investment property apartment buildings and complexes. The ICI sector
is responsible to contract for waste management services.
Municipal solid waste materials (residual garbage, organics and C&D) generated in HRM must
be delivered to HRM waste processing facilities which include:

Solid Waste Strategy Review – Final Report
Committee of the Whole Report - 13 - January 14, 2014
Two organics processing plants, one each in Burnside and Ragged Lake industrial
parks (materials exceeding capacity are sent to a processing outside HRM)
One operational Landfill at Otter Lake site A
C&D waste materials are also prohibited from export outside HRM and must be taken to a
licensed C&D depot, processing and landfill site within HRM.
Due to organics collection exceeding current processing capacity, HRM has established contracts
for processing organics outside HRM. In addition, some special wastes, such as medical and
international wastes, and compost plant residual materials and contaminants are sent to
processing sites and landfills outside of HRM.
ICI sector recyclable materials are processed at a few private fibre processing facilities in HRM
(for most ICI sector cardboard and paper) and at HRM’s Materials Recovery Facility (MRF)
located at Bayer’s Lake Industrial Park (for ICI sector container recyclables and some paper).
ICI sector recyclable materials are permitted to go to other jurisdictions but remain in HRM
likely due to transport and processing costs and lack of processing capability elsewhere.
DISCUSSION
The ISWMS program review examined the overall system, from curb-side collection of all
streams to processing and revenue generation, to identify ways to improve fiscal performance
and environmental stewardship. The review consisted of three criteria:
Assess overall system performance based on original strategy objectives;
Conduct industry bench mark analysis and comparative best practice assessments;
and,
Identify options and recommendations to enhance overall system effectiveness and
efficiency.20
The following discussion incorporates three years of staff research and analysis, the Stantec
Review, the SNC Lavalin Peer review, Community Consultation, ICI input, CMC input, the
Dillon report commissioned by MIRROR NS and the Arnold memo commissioned by Dillon
Consulting Ltd, letters and petitions sent to Regional Council and National Public Relations’
consultation report.
As a result of the system interdependencies, the discussion includes a general statement of
system performance as a whole followed by individual analysis of component parts.
Components include:
Organics program
Recycling program
20 REQUEST FOR PROPOSALS, HRM Solid Waste Resource Strategy System Review, Performance Assessment
and Options Analysis, RFP #12-061, July 2012.

Solid Waste Strategy Review – Final Report
Committee of the Whole Report - 14 - January 14, 2014
Household Special Handling Waste
Residual Waste/Garbage
FEP/WSF
Otter Lake Landfill
Each component will be addressed in terms of:
Successes
Challenges
Opportunities
Consultation Feedback
Recommendation
In assessing the ISWMS system performance, based on CSC Strategy objectives, staff’s analysis
focused on two key performance indicators (KPI):
A. Rate of Diversion - Diversion consists of diverting waste resource materials at
point of generation to an appropriate processing site other than landfill. The
diversion target is 78% based on there being 22% garbage in the waste stream;
and,
B. Overall System Costs - System costs are generated through collections, resource
material processing, resident and business education, monitoring, inspections and
landfill costs, both operating and capital.
A. Integrated Solid Waste Management System Report Card
In 2012, over 140,000 tonnes of materials were delivered to the Otter Lake landfill. Of that,
approximately 80,000 tonnes (which represents 22% of the total of 366,100 tonnes of waste
resource materials generated within HRM in 2012) was designated as garbage and was correctly
sent to landfill. The remaining 60,000 tonnes are recyclable and represent a significant
opportunity to enhance system environmental stewardship and fiscal performance. The figure
below shows the historical effects of the source separation measures in HRM. The dramatic
decline in garbage (top line) was influenced by the introduction of green carts, expansion of blue
bag recycling and subsequent diversion of C&D materials from landfill.

Solid Waste Strategy Review – Final Report
Committee of the Whole Report - 15 - January 14, 2014
Figure 1
The original CSC Strategy was developed at a time when there was limited recycling collection
and no source separated organics (SSO) collection and processing.
As of 2013:
HRM has achieved a 61% blended residential and ICI overall diversion rate, which is a
significant achievement when compared to the rest of the country. A critical factor in
understanding this number is that it still includes the garbage tonnage. There are over
81,000 tonnes of garbage in HRM’s waste stream (22%) which is garbage and should go
to landfill.
ICI diversion is 66%, based in large part to C&D diversion and HRM’s use of C&D
engineered cover matrix as landfill cell daily cover.
Residential diversion is 52%, one of the highest in Canada for similar sized cities when
factoring in garbage generation.
Compared to the original CSC Strategy target of 88% diversion by 2000, 61% diversion may
seem low. However, the CSC Strategy assessment of the waste stream make-up put organics at
47%. MIRROR NS, in its subsequent planning analysis, estimated that organics made up only
approximately 27% of the waste stream.21
Current data puts organics at approximately 22% and
garbage at 22% of the waste stream make-up.
Table 1 shows the current make-up of the waste stream divided into individual streams with
amount (tonnes) and diversion rate of each waste/resource stream, and to which facility it was
21
Metropolitan Halifax Solid Waste/Resource Management System Implementation Plan, MIRROR Nova Scotia,
page 7, September 15 1995.

Solid Waste Strategy Review – Final Report
Committee of the Whole Report - 16 - January 14, 2014
delivered. The bottom row shows the overall diversion rate for the individual waste streams and
the cumulative overall rate for HRM at 61%.
HRM is currently the only region in NS who regulates C&D materials. HRM also utilizes a
significant percentage of the processed C&D as daily cover in the landfill cells which also counts
as diversion.
Table 1
Waste/Resource System Mass Balance
by Facility and Waste Stream
Fiscal 2011/2012 Garbage Organics
Recyclable
Paper and
Cardboard
Recyclable
Containers
C&D
MaterialOther
System
Total
Otter Lake 82,376 24,254 19,347 8,760 7,320 613 142,670
MRF 18,858 5,460 24,318
Private Recycling 43,000 43,000
Enviro Depots 7,500 7,500
Compost Facilities 51,328 51,328
Backyard Composting 5,000 5,000
C & D Facilities 92,268 92,268
HHW (Est) 500 500
Totals 82,376 80,582 81,205 21,720 99,588 1,113 366,584
Diversion (% of Totals) 70% 76% 60% 93% 45% 61%
Of note: Nova Scotia Environment (NSE) calculates diversion rate differently than HRM. NSE compares
a Region’s current per capita disposal with the Region’s 1984 per capita disposal. Using this formula,
NSE sets HRM’s overall diversion rate at 53%.
When examining waste resource streams individually, as of 2012/13, the rates are:
70% diversion for organics,
over 75% diversion for recyclables, and,
over 75% diversion of C&D recognizing that some C&D materials are used in
daily cover at Otter Lake landfill and the operation of the private C&D landfill at
Antrim.
HRM’s waste generation rate of 393 kg of garbage per capita is a significant diversion
achievement. The national average is over 800 kg per capita. In terms of CSC Strategy
objectives of diverting organic materials, HRM residents and businesses have made significant
progress. However, over 20,000 tonnes of putrescible organics remains in the mixed waste
stream of which over 5,000 tonnes goes directly to the landfill without stabilization in the WSF.
(see Appendix 7, Figure 23, Summary of Waste Stream Data).

Solid Waste Strategy Review – Final Report
Committee of the Whole Report - 17 - January 14, 2014
The Province’s EGSPA provincial target of 300 kg per capita for all of Nova Scotia in 2015
remains a challenging objective. Halifax alone would need to divert a further 25,000 tonnes from
landfill.
Current landfill capacity at the Otter Lake site is based on generation of garbage by both the ICI
and residential sectors. HRM is currently utilizing Cell 6, which opened in October 2012 and is
projected to reach capacity in the summer of 2016. Construction of Cell 7 must commence
during the 2015 construction season. This will require approval of the projected $19 million
dollar project for the FY2015/16 capital budget.
Table 2 below identifies overall ISWMS program costs for the next ten years. These costs
include infrastructure capital investments to address capacity, lifecycle and regulatory
compliance. This includes:
New Recycling Facility - $10,000,000
Secondary Compost Curing Site - $3,500,000
Increase Organics Capacity - $5,000,000
Multiple Stream Collection Carts (Blue/Green) - $25,500,000
New Landfill Site - $100,000,000
Total = $144,000,000
Table 2
OPERATING 2014 2015 2016 2017 2018 5 Year Total Cost Total to 2024/25
Total Operating $34,200,000 $32,300,000 $34,700,000 $37,100,000 $39,800,000 $178,100,000 $479,500,000
Total Capital Funding $10,403,000 $10,903,000 $10,603,000 $10,903,000 $11,500,000 $54,312,000 $126,312,000
New Capital Total $0 $8,500,000 $10,000,000 $25,440,000 $100,000,000 $143,940,000 $143,940,000
ANNUAL FUNDING FOR SOLID WASTE $44,603,000 $51,703,000 $55,303,000 $73,443,000 $151,300,000 $376,352,000 $749,752,000
Note: New infrastructure costs have been identified in terms of potential future system costs.
Infrastructure development requirements can be met through public or private RFP funding of
capital projects. Full business case analysis will determine the appropriate mechanism to meet
the future infrastructure development requirements.
The above outlined future system costs do not reflect operating model changes at Otter Lake.
The recommendations outlined in this report provide for a dramatic reduction in tonnage
delivered to Otter Lake. The changes also represent cell construction cost avoidance. These
changes will reduce operating costs of the current price agreement with MIRROR NS. In
addition, there are other measures which will further improve fiscal performance. However,
these operating cost savings have not been included in the system cost avoidance and cost
savings calculations shown in subsequent cost tables. The recommendations are based on current
identified system savings and cost avoidance, and not future negotiated price agreement
operating cost savings.

Solid Waste Strategy Review – Final Report
Committee of the Whole Report - 18 - January 14, 2014 Recommendation # 1 re: ISWMS
Confirm the objectives of the Community Stakeholders Committee Integrated Resource
Management Strategy 1995:
a. Maximize reduction, reuse and recycling of waste resources;
b. Maximize environmental and fiscal and fiscal sustainability of the waste
program;
c. Foster public stewardship and conservation.
B. Organics Program
Successes
HRM’s organics program is a sustainable success. In July, 2013, Statistics Canada identified
HRM with a rating of over 93% participation in organics diversion, the highest for a city in the
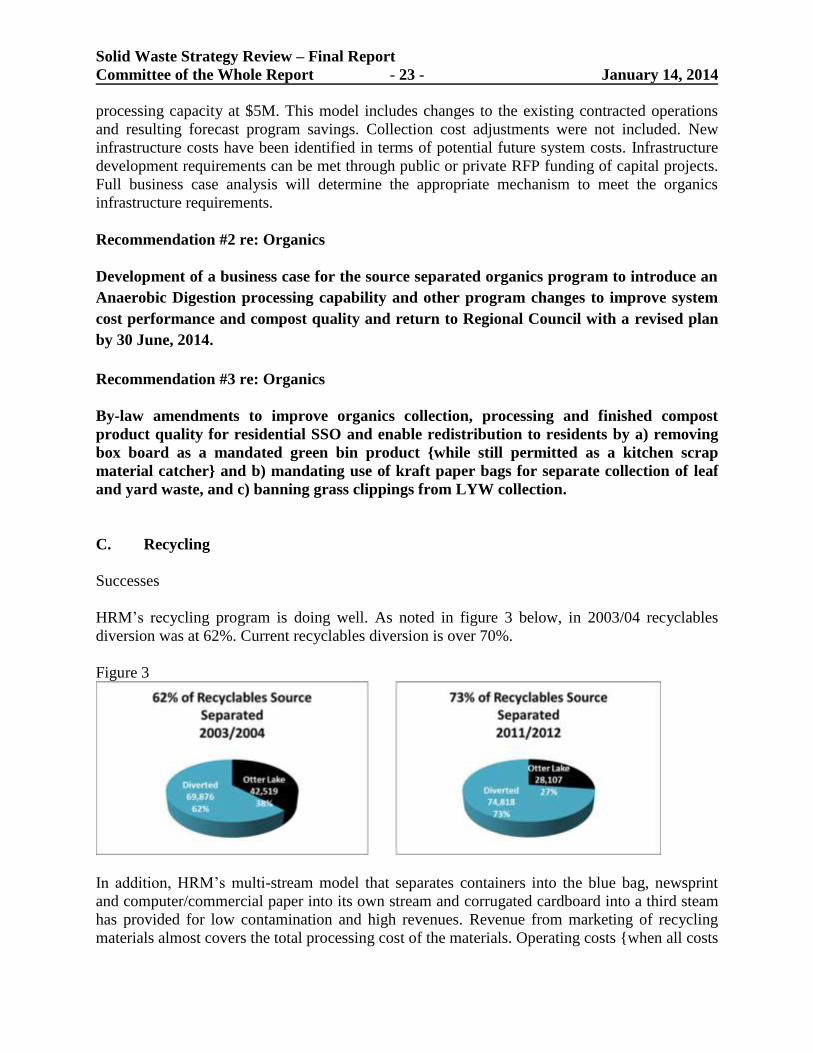
country.22 HRM’s innovative green bin program has spread across North America. As noted in
the figure 2 pie charts below, HRM has continued to increase diversion of organics from landfill,
improving 12% in the past 10 years.
Figure 2: Then and Now organics diversion
Challenges
Waste content analysis shows that almost 25,000 tonnes of putrescible organics remains in the
garbage stream being delivered to Otter Lake landfill. Proper diversion of this material will
require development of alternative processing capacity and/or program changes.
Current SSO collection and delivery of organics from residents and the ICI sector exceeds
existing HRM infrastructure processing capacity. HRM’s two in-vessel aerobic composting
plants have an annual combined capacity of 48,000 tonnes. HRM currently receives over 51,000
tonnes. HRM contracts for excess organics materials to be sent to an outside of jurisdiction
processing site. In addition, HRM contracts for separate extra leaf and yard waste (LYW)
22 EnviroStats: Composting by households in Canada, by Iman Mustapha, Environment Accounts and Statistics
Division, July 2013, http://www.statcan.gc.ca/pub/16-002-x/2013001/article/11848-eng.pdf, 3 January, 2014.

Solid Waste Strategy Review – Final Report
Committee of the Whole Report - 19 - January 14, 2014
collection during spring clean-up and fall leaf collection periods. There is also a separate
Christmas tree collection contract.
In 2005, the Canadian Council of Ministers of the Environment, CCME, implemented new
compost guidelines to govern municipal SSO programs and processing. The 2005 guidelines are
currently in effect. HRM has until 2015 to meet those guidelines through implementation of
system and program changes. HRM is required to submit a plan by January, 2014.
HRM’s current aerobic compost processing plants in Burnside and Ragged Lake are at capacity.
System performance analysis identified that the inclusion of ICI organics introduces problematic
high moisture content materials into the aerobic process. The aerobic process was not designed
for this type of high moisture content materials. The combination of residential and ICI organics
in HRM’s SSO program results in a CCME 2005 guideline compliance challenge.
The Burnside plant has made progress through capital improvements over the past 18 months
and the current assessment is that the plant meets the updated guidelines. This is being tested for
confirmation. Compliance testing is on-going at the Ragged Lake site. HRM has notified NSE of
the assessed compliance of one plant and requested a delay in submitting a plan for the second
while the ISWMS program review is on-going.
HRM’s end product compost has never lived up to program or CSC Strategy expectations.
HRM’s phase one material from the processing plants goes to secondary sites for open windrow
finishing, making it suitable for sale and use in landscaping applications. Due to the level of
contamination and poor quality, there is no revenue return on HRM’s current compost program.
The CSC Strategy envisioned revenue generation from the organics program to offset system
costs. Factors affecting organics quality include:
Contaminants in the residential green-cart collection materials, including glass, rocks,
plastics and other banned materials;
Contaminants in the ICI materials, including plastic utensils, straws, and other banned
materials;
Plastic bag shreds resulting from plastic bags ending up in the green carts and ICI
organics. These bags introduce shreds of plastic film into the compost product during
initial processing and are very challenging to remove and unsightly in terms of finished
compost;
Grass clippings, which introduce odour and processing challenges from materials which
is now commonly just left on lawns.
Opportunities
Analysis of municipal SSO programs that include ICI organics indicates that anaerobic digest
(AD) processing is far better suited to deal with ICI organics. There are several operational
technologies in urban settings processing ICI organics. AD processing also produces a methane
gas which can be used to generate renewable energy and revenues. AD technology systems
capable of dealing with ICI organics are costly systems. A new project in Toronto cost $70
million. An alternative to the costly large scale ICI AD plant is the evolving option of on-farm

Solid Waste Strategy Review – Final Report
Committee of the Whole Report - 20 - January 14, 2014
AD processing.
HRM has no legislative obligation to support ICI organics processing. However, there is
currently no alternative ICI organics processing option within HRM. HRM currently subsidizes
the processing cost of $160.00/tonne based on a tip fee of only $75.00/tonne. This equates to
$1,367,820.00 per year in subsidization. Introducing higher service costs to the ICI sector could
have a negative effect on HRM’s ISWMS objective of diverting organics from the garbage
stream and landfill.
The following options could address HRM’s program requirements:
1. Issue an RFP for design/build/own or operate project to develop an AD capability to
support ICI organics processing. An industry confirmed rough order of magnitude
(ROM) assessed cost of this project is approximately $25 million. A business case would
have to be developed to confirm per tonne tip fees costs to repay this capital investment;
2. Notify the ICI sector that as of a set date, ICI organics would no longer be accepted at
HRM compost processing facilities. The ICI sector would be responsible to develop a
private sector option to accept their organics materials. This could include a new site(s)
or expansion and/or new arrangements with existing processors. A private sector option
could result in a higher tip-fee for ICI organics which could be a negative impact on
HRM diversion from landfill.
3. Partner with an existing contractor for the development of an AD capacity, either at a
new site or at an existing site. An existing site would need modifications but also reduces
capital investment from use of existing scales and other infrastructure.
4. Capitalize on a growing effort to establish on-farm AD processing in NS. There are
currently two systems in development within reasonable proximity to HRM. This
capability introduces the opportunity of a hybrid organics solution incorporating option 3,
utilizing an existing compost plant as a transfer station to pre-process HRM ICI organic
slurry for tanker transfer to area on-farm AD processing sites. This option encourages
development of private sector ICI organics processing capacity. Viability depends on
confirming adequate additional on-farm AD processing capacity to handle HRM’s ICI
organics tonnage.
Consultation Feedback
Current ICI organics tonnage and composition negatively affects HRM’s SSO organics program.
Consultation input identified improving the quality of HRM’s organics compost as a desired
system outcome. Improving compost quality is consistent with CSC Strategy objectives and
Regional Council priorities and direction.
Consultation outcomes important to residents included:
A marketable compost product at a reasonable price

Solid Waste Strategy Review – Final Report
Committee of the Whole Report - 21 - January 14, 2014
Ease of participation
Focus on backyard composting (BYC)
Increased education and enforcement
Increased participation from apartments and condos
Production of a category B compost product from the WSF at Otter Lake
Tensions and Trade-offs:
Cost
Weekly pickup for part of the year (April through October)
Durability of paper bags for LYW
Concern with rodents associated with BYC
Consultation feedback from Industry and the ICI sessions was consistent with resident feedback:
Reduce contamination, reduce system and service costs, and improve education.
Analysis of kraft paper bags verses plastic for LYW collection programs supports mandating
kraft paper and banning plastic. System data from PEI, Fredericton, NB, City of Brockville,
Region of Waterloo, North and West Vancouver, Ottawa and Hamilton includes:
Strong support and recognition that kraft paper bags significantly reduces compost
contamination from plastics/residual plastic scraps from shredding and improves compost
quality
Higher degree of decomposition than bio-degradable plastic bags through standard urban
composting systems
Equally robust as plastic for standing up to weather conditions in the Maritimes
Price comparable once established in the market place as the required option
More acceptable than plastic bags as visible materials in end state organics compost
Separately collected LYW could be sent to open windrow processing sites rather than utilizing
costly in-vessel composting plant capacity. Open windrow composting costs significantly less
that the current in-vessel processing.
$160.00/tonne overall system cost of HRM aerobic organics processing;
$28.55/tonne for separate LYW processing in 2013 {$56,500 for 1,979 tonnes}
In order to achieve outcomes identified through the system review process, output from HRM’s
aerobic composting plants (phase one SSO) would optimally go to a contracted partner site for
final curing. Such a future contract would include return of HRM compost for distribution and/or
sale to residents.
The above-noted hybrid system incorporates the following program changes and investments:
Investment in ICI organics slurry receiving and initial processing for transportation to on-
farm AD processing
Solid Waste Strategy Review – Final Report
Committee of the Whole Report - 22 - January 14, 2014
Collection program changes for separate LYW
Changes in phase two processing options
Reduced program costs based on separate LYW, separate ICI processing and improved
quality of residential aerobic processing and end state compost
The hybrid opportunity includes: an introduction of on-farm AD processing for ICI organics and
requires refinement into a full business case analysis for Regional Council consideration. Full
business case (BC) analysis will include:
Development of a refined site investment project plan to support receiving and initial
processing of ICI organics for transportation to alternative AD sites;
Confirmation of regional site options for various processing capacities;
Letters of Intent (LOI) for partnerships to confirm AD processing capacity and phase two
processing of residential SSO;
Validation of HRM’s capacity requirements for processing SSO;
Validate green cart size given content changes but maintain environmental stability and
robustness (wind, rodents etc…) for replacement procurement;
Expand weekly collection of organics from spring through late fall (April through
November) for all residents.
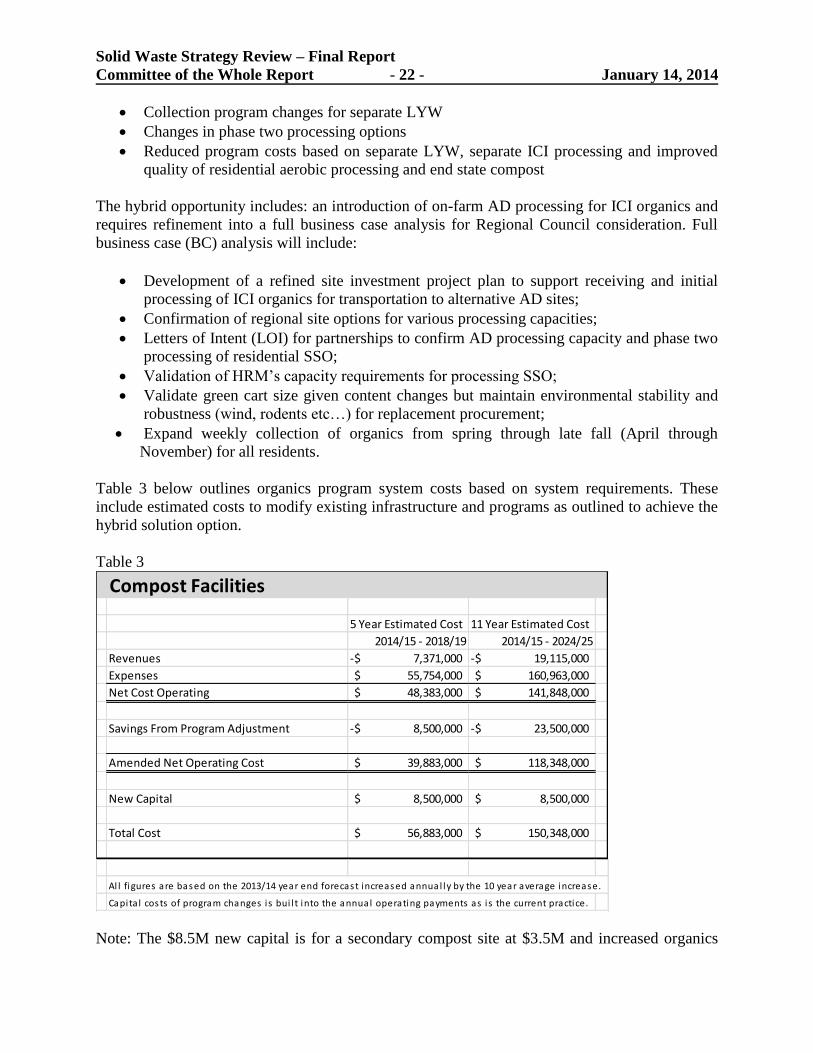
Table 3 below outlines organics program system costs based on system requirements. These
include estimated costs to modify existing infrastructure and programs as outlined to achieve the
hybrid solution option.
Table 3
Compost Facilities
5 Year Estimated Cost 11 Year Estimated Cost
2014/15 - 2018/19 2014/15 - 2024/25
Revenues 7,371,000-$ 19,115,000-$
Expenses 55,754,000$ 160,963,000$
Net Cost Operating 48,383,000$ 141,848,000$
Savings From Program Adjustment 8,500,000-$ 23,500,000-$
Amended Net Operating Cost 39,883,000$ 118,348,000$
New Capital 8,500,000$ 8,500,000$
Total Cost 56,883,000$ 150,348,000$
Al l figures are based on the 2013/14 year end forecast increased annual ly by the 10 year average increase.
Capita l costs of program changes i s bui l t into the annual operating payments as i s the current practice.
Note: The $8.5M new capital is for a secondary compost site at $3.5M and increased organics
Solid Waste Strategy Review – Final Report
Committee of the Whole Report - 23 - January 14, 2014
processing capacity at $5M. This model includes changes to the existing contracted operations
and resulting forecast program savings. Collection cost adjustments were not included. New
infrastructure costs have been identified in terms of potential future system costs. Infrastructure
development requirements can be met through public or private RFP funding of capital projects.
Full business case analysis will determine the appropriate mechanism to meet the organics
infrastructure requirements.
Recommendation #2 re: Organics
Development of a business case for the source separated organics program to introduce an
Anaerobic Digestion processing capability and other program changes to improve system
cost performance and compost quality and return to Regional Council with a revised plan
by 30 June, 2014.
Recommendation #3 re: Organics
By-law amendments to improve organics collection, processing and finished compost
product quality for residential SSO and enable redistribution to residents by a) removing
box board as a mandated green bin product {while still permitted as a kitchen scrap
material catcher} and b) mandating use of kraft paper bags for separate collection of leaf
and yard waste, and c) banning grass clippings from LYW collection.
C. Recycling
Successes
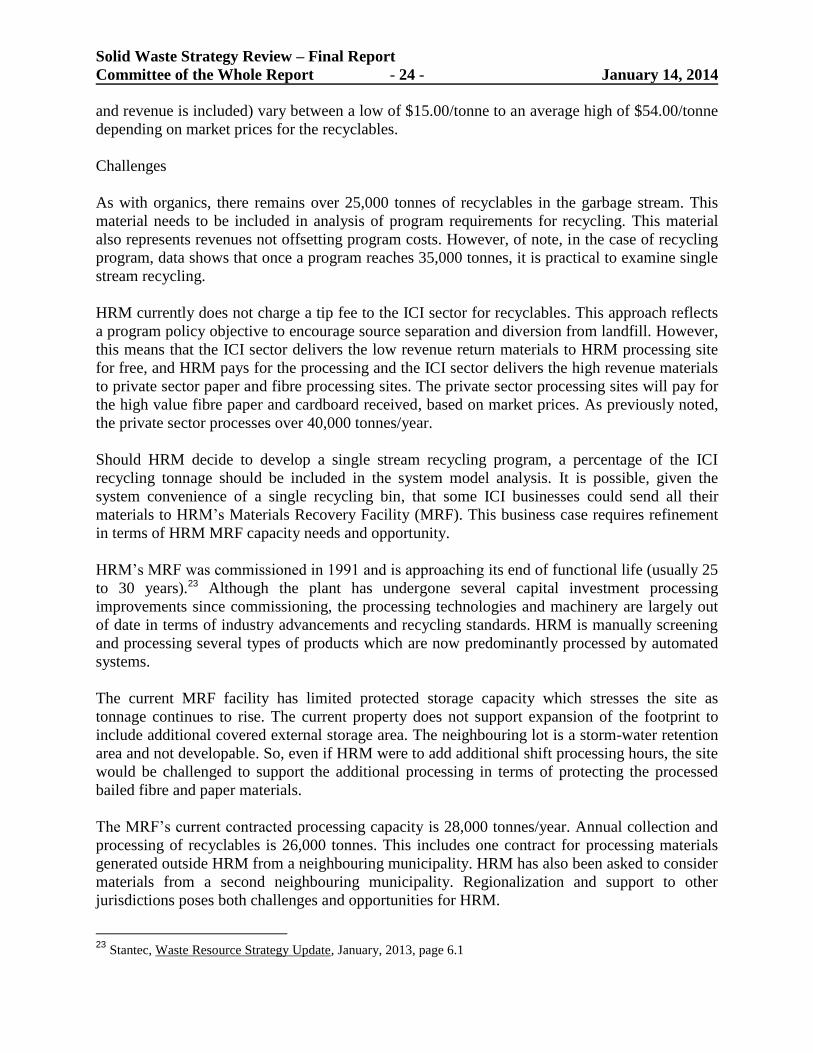
HRM’s recycling program is doing well. As noted in figure 3 below, in 2003/04 recyclables
diversion was at 62%. Current recyclables diversion is over 70%.
Figure 3
In addition, HRM’s multi-stream model that separates containers into the blue bag, newsprint
and computer/commercial paper into its own stream and corrugated cardboard into a third steam
has provided for low contamination and high revenues. Revenue from marketing of recycling
materials almost covers the total processing cost of the materials. Operating costs {when all costs
Solid Waste Strategy Review – Final Report
Committee of the Whole Report - 24 - January 14, 2014
and revenue is included) vary between a low of $15.00/tonne to an average high of $54.00/tonne
depending on market prices for the recyclables.
Challenges
As with organics, there remains over 25,000 tonnes of recyclables in the garbage stream. This
material needs to be included in analysis of program requirements for recycling. This material
also represents revenues not offsetting program costs. However, of note, in the case of recycling
program, data shows that once a program reaches 35,000 tonnes, it is practical to examine single
stream recycling.
HRM currently does not charge a tip fee to the ICI sector for recyclables. This approach reflects
a program policy objective to encourage source separation and diversion from landfill. However,
this means that the ICI sector delivers the low revenue return materials to HRM processing site
for free, and HRM pays for the processing and the ICI sector delivers the high revenue materials
to private sector paper and fibre processing sites. The private sector processing sites will pay for
the high value fibre paper and cardboard received, based on market prices. As previously noted,
the private sector processes over 40,000 tonnes/year.
Should HRM decide to develop a single stream recycling program, a percentage of the ICI
recycling tonnage should be included in the system model analysis. It is possible, given the
system convenience of a single recycling bin, that some ICI businesses could send all their
materials to HRM’s Materials Recovery Facility (MRF). This business case requires refinement
in terms of HRM MRF capacity needs and opportunity.
HRM’s MRF was commissioned in 1991 and is approaching its end of functional life (usually 25
to 30 years).23 Although the plant has undergone several capital investment processing
improvements since commissioning, the processing technologies and machinery are largely out
of date in terms of industry advancements and recycling standards. HRM is manually screening
and processing several types of products which are now predominantly processed by automated
systems.
The current MRF facility has limited protected storage capacity which stresses the site as
tonnage continues to rise. The current property does not support expansion of the footprint to
include additional covered external storage area. The neighbouring lot is a storm-water retention
area and not developable. So, even if HRM were to add additional shift processing hours, the site
would be challenged to support the additional processing in terms of protecting the processed
bailed fibre and paper materials.
The MRF’s current contracted processing capacity is 28,000 tonnes/year. Annual collection and
processing of recyclables is 26,000 tonnes. This includes one contract for processing materials
generated outside HRM from a neighbouring municipality. HRM has also been asked to consider
materials from a second neighbouring municipality. Regionalization and support to other
jurisdictions poses both challenges and opportunities for HRM.
23
Stantec, Waste Resource Strategy Update, January, 2013, page 6.1

Solid Waste Strategy Review – Final Report
Committee of the Whole Report - 25 - January 14, 2014
MRF marketing revenues are variable in terms of market supply and demand. HRM is further
challenged by the fact that most material recycling production facilities are located outside the
Maritimes. Transportation costs from HRM to Ontario markets are a negative factor on HRM
recycling revenues. Identifying new markets and capitalizing on HRM’s port logistics supply
chain position offer new opportunities as HRM’s system evolves. This includes new recycling
technologies coming into operation, which include plastics processing and other waste to fuel
technologies.
Opportunities
A new MRF will enable HRM to benefit from significant advancements in technology used to
process, sort, screen, and manage recyclable materials. Single stream verses multi-stream
recycling continues to be a contested debate. Data supports both models. Automated screening
and sorting technology has advanced to the point where recycling materials in a single stream
program can be as cost effective as multi-stream systems. The issue remains the degree to which
the single stream automated systems can reduce cross material contamination. Contamination
was traditionally a negative impact for single stream systems where broken glass and other
contaminants reduced the market value of materials collected.
New screening and processing systems reduce contamination and produce marketable materials
which can improve single stream revenue returns. Single stream systems have proven to generate
higher participation and capture rates than multi-stream systems through the convenience of a
single receptacle or bin. Potential revenue loss can be partially offset through higher participation
and capture rates and greater efficiency in collection programs. However, residue rates (materials
that in the end are sent to landfill following rejection in the MRF) do increase with single stream
over multi-stream processing. The counter is lost revenue from this higher residue rate.
Glass in the recycling stream requires examination. Glass introduces negative impacts on
recycling materials and has minimal recycling options and value. Broken glass contaminates
paper and fibre and other recycling streams. With minimal residual value and negative impact on
the recycling process, especially in single-stream systems, glass may more appropriately be
returned to the garbage stream as an inert material for landfill.
Any use of glass, be it road construction, septic fields, landfill cover etc…, will still require glass
to be processed through the recycling stream because it would need to be sorted and processed
for other use. Another option could use recycled glass as part of a daily cover mix for landfills.
Environmental stewardship for products needs to include all impacts of recycling materials, not
just diversion from landfill. Recycling systems need to validate the cost, energy and implications
of all included materials being processed. It may be more environmentally prudent to remove
glass from the recycling than expend energy and resources in recycling.
In 2011 HRM added all plastic containers to its blue bag program (except Styrofoam). This has
resulted in additional plastics being diverted from the landfill for recycling and made program
participation easier for residents. The “mixed plastics” product has a lower yield revenue rate of
return then other higher value plastics such as HDPE and LDPE plastics. However, the industry

Solid Waste Strategy Review – Final Report
Committee of the Whole Report - 26 - January 14, 2014
is evolving and there are a number of new technologies which are vying for this mixed plastic
material stream which may represent future opportunities for new revenue for HRM’s program,
further reducing processing costs.
New technology processes can reduce plastics back to their fossil fuel base elements. This is a
proven technology currently in operation. The proponents who have contacted HRM are at
various stages of their business case development. HRM is well placed to support the sale of
plastics to these proponents to improve recycling system fiscal performance. However, there is a
limited quantity of plastic products. Determination of the best partner will come down to an RFP
process to identify the most beneficial relationship for HRM.
Industry data indicates that the recycling program fiscal performance could be further improved
with the introduction of automated collection using large blue carts rather than blue bags. A cart
based system is generally associated with single stream recycling. There are a few jurisdictions
utilizing split carts. However, there is industry concern for the practicality and cross
contamination outcomes of split carts.
Introduction of blue carts would likely be made in conjunction with a recommendation to change
from multi-stream to single stream recycling. Automation, both in collection and processing
reduces long-term system costs. However, multi-stream systems have greater revenue returns
and market protection based on higher quality materials. In volatile market periods, as was
witnessed during the crash in 2008/09, single stream recycling materials can become very hard if
not impossible to market which negatively impacts offsetting program revenues.
Alternative Technologies
Alternative technologies and their use of waste stream resources can bring added benefit to
HRM’s ISWMS program. Plastics to fuel, gas and chemical recovery systems and energy from
waste systems introduce practical environmental stewardship alternatives to sending
unmarketable resources to landfill. Establishing local options for recycling and including
alternative technologies as part of the ISWMS regime could enhance HRM’s revenue position in
terms of system fiscal performance.
Recent industry literature suggests that market value is definitely a priority with the volatility of
the recycling commodities markets. Furthermore, given the effort to educate citizen behaviours
for multi-stream source separation at the curb, reverting to the single stream model would seem
counter-productive and regressive. However, providing one cart to handle all materials has
significantly improved participation and capture rates where a single recycling stream was
adopted. From a system perspective, enabling all recycling materials to be placed in one cart
addresses the desire to make the program easier and increase diversion from landfill. The counter
is a potential increase in residue rates.
Recycling carts can be collected using various truck types, including semi-auto and auto loaders
which reduce crew sizes and collection costs through improved efficiency. When delivered to the
MRF, the materials are tipped and then moved through initial dynamic sorting systems to split
the streams between containers, paper and plastic film. New screening systems remove
Solid Waste Strategy Review – Final Report
Committee of the Whole Report - 27 - January 14, 2014
contaminants such as broken glass from the other materials. The use of a large recycling cart
could provide better protection from the environment as compared to the separate paper and
cardboard practices currently in use. However, recycling materials are light so cart size and
stability would have to be validated.
The introduction of blue carts would require an extended planning period. Program changes
would include:
A new single-stream MRF which would require approximately 18-24 months for a
design/build/operate project. A new MRF facility could be funded through public or
private capital with different operating models. This would be determined through a full
business case cost benefit analysis process.
Potential changes to collection truck specifications will require issuance of a new
collection RFP which stipulates what truck configuration will be required to be capable
of supporting blue carts.
The procurement, distribution and education of a new blue cart system will also take
careful planning.
Industry data supports the following hybrid model as an optimal model for recycling:
automated or semi-automated collection of carts for recycling;
automated processing in a single stream MRF which can accommodate multi-stream
materials with a bypass;
material screening to minimize contaminants to sustain marketability of materials and
revenues.
A single stream cart based collection and automated MRF system means:
Carts that will increase capture rates and participation as compared to HRM’s current bag
program.
MRF automated screening and sorting technology with improved protection from
material contaminants.
Carts that will reduce MRF processing costs – less labour to remove bags, improving
MRF throughput/production per hour.
New sorting and processing technologies that should reduce typical residue rates.
A MRF processing set-up to minimize cross-contamination on each processing line
(paper & containers) – having the materials arrive at the MRF loose will allow sorter
systems to efficiently remove paper materials from containers and vice versa. New
MRFs are designed to better accommodate cross contamination with combined pre-sort
areas, recirculated Quality Control conveyors, etc…
Other implications from a single-stream / automated MRF include:
Reduced impact from cross-contamination of materials in bags which holds up
processing lines and makes it difficult to separate materials efficiently.
Industry supplied data indicates bags increase processing costs per incoming tonne of
recyclables when all MRF costs are accounted for (less MRF labour, higher MRF
throughput, less MRF residue, less MRF paper/container cross-contamination, higher
MRF materials revenue).

Solid Waste Strategy Review – Final Report
Committee of the Whole Report - 28 - January 14, 2014
Plastic bags collection programs negatively affect system performance of a MRF.
Consultation Feedback
Consultation feedback was mixed on recycling. There was consensus that HRM needed to
provide more education, monitoring and address the challenges with apartments and condos.
Feedback also identified making the system easier as a priority. Members of the community who
participated raised concerns about dealing with another large cart should the program introduce
blue carts rather than the current blue bag system. There was also concern raised about reducing
the quality of the materials as a result of moving to single stream rather than the current multi-
stream program.
Table 4 below outlines identified system and program costs going out to 2024/25.
Table 4 - Recycling Program Costs Analysis
Material Recovery Facility
5 Year Estimated Cost 11 Year Estimated Cost
2014/15 - 2018/19 2014/15 - 2024/25
Revenues 10,516,000-$ 25,687,000-$
Expenses 17,167,000$ 41,724,000$
Net Cost Operating 6,651,000$ 16,037,000$
Capital - New MRF 10,000,000$ 10,000,000$
Total Cost 16,651,000$ 26,037,000$
Al l figures are based on the 2013/14 year end forecast increased annual ly by the 10 year average increase.
It i s estimated the operating costs and revenue generated within a new MRF wi l l be cons is tent with past trends .
Note: New infrastructure costs have been identified in terms of potential future system costs.
Infrastructure development requirements can be met through public or private RFP funding of
capital projects. Full business case analysis will determine the appropriate mechanism to meet
the infrastructure requirements.

Solid Waste Strategy Review – Final Report
Committee of the Whole Report - 29 - January 14, 2014
MRF Replacement Timeline
There are various models HRM could employ to replace the existing MRF. HRM could invest
taxpayer funds through an RFP process to develop its own MRF as with the current facility and
then contract out for its operation. Alternatively, HRM could RFP for a proponent to develop a
MRF and pay on a per tonne basis for processing. There are multiple variations of the
design/build/operate/maintain models for this type of project. The business case will include cost
benefit analysis of the return on investment comparison and long term system cots between a pay
per tonne verses own and operate model.
Based on a 24 month project timeline, and a one year RFP process, the following is a timeline for
a MRF replacement project.
FY2016/17 – Approve $10 million capital project (funding source to be determined)
FY2017/18 – Conduct RFP process for new MRF
FY2018/19– Execute new MRF project
FY2019 – Commence new MRF operations.
HRM will require a new MRF to support the recycling program and system growth. Regional
partnership opportunities also exist. The recycling program also affects the collection program in
terms of single verses multi-stream recycling. Staff intend to return to Regional Council within a
year with a full business case to support evolving the HRM recycling program to include an
optimal model of:
approval for an RFP for a new MRF project = $10 million
approval for an RFP for procurement of new blue carts = $13 million
a new collections regime RFP
D. Household Special Handling Waste (HSW)
Successes
HRM has one permanent HSW depot which operates on Saturdays behind the MRF in Bayer’s
Lake. It is open approximately 42 Saturdays per year. In addition, HRM conducts up to four
mobile events at other locations across the municipality. Figure 4 and table 5 below show a
comparison of what is captured through the HSW depot and mobiles as compared to what is
captured through processing at Otter Lake (FEP/WSF).

Solid Waste Strategy Review – Final Report
Committee of the Whole Report - 30 - January 14, 2014
Figure 4
Table 5 Comparison of HSW Materials Received (B)
Acid Batteries Fire Extinguishers Propane Tanks Paint (cages)
HSW Depots 550 0 1966 319
Otter Lake 183 256 316 0
Challenges
2012 system analysis shows the single permanent HSW depot, located in Bayer’s Lake, received
approximately 8,100 vehicle visits during the 45 Saturdays it was open for operation. In addition,
HRM conducted three mobile HSW events with approximately 1,500 additional vehicle visits. In
2011 vehicle visits to the permanent depot numbered some 8,200 cars, with a further 1,900
vehicles at mobile events. Data from Otter Lake shows minimal recovery of HSW materials as
compared to that from the Bayer’s Lake depot and mobile events.
In terms of a municipality of 400,000 people, voluntary drop off by 9,600-10,100 vehicles over a
year would seem to be a low participation rate. However, capture rates at Otter Lake shows that
minimal quantities of HSW are delivered to the landfill. This may indicate that many residents
are storing their HSW materials at their homes.
Some special handling products are covered under Extended Producer Responsibility (EPR)
programs. Paint and electronics utilize the Enviro-Depot network. There are other programs
which use retailers which sell products and retain or accept the recovered used products, like
used oil at gas stations or tires. EPR programs are intended to cover the complete 100% end of
life cycle costs of the products involved.
Solid Waste Strategy Review – Final Report
Committee of the Whole Report - 31 - January 14, 2014
Depot networks are funded by fees paid by consumers when they purchase products. The fees are
then administered by an agency such as the Resource Recovery Fund Board (RRFB; tires,
deposit beverage containers), Product Care (paint) and the Electronic Product Recycling
Association (EPRA; electronics). These agencies establish their recovery model, in this case a
depot or voluntary drop-off system, and pay the operating costs for the depots, transportation,
processing and marketing of the captured materials.
Not all EPR programs in NS have a mechanism to provide funding to municipalities who must
deal with the materials not voluntarily dropped off and captured at the depots. The RRFB
beverage container program and the paint recycling program do provide direct funding back to
municipalities. EPR programs in other jurisdictions include mechanisms to transfer payment to
municipalities for additional materials not captured in the voluntary drop off program.
Another challenge with voluntary depot drop off programs is that certain groups in the
community are disadvantaged by this model of recycling program including the physically
challenged, elderly and economically disadvantaged who do not have their own means of
transportation and/or are unable to bring their materials to depots. This demographic includes
individuals living in apartments, often the most economically disadvantaged in society, who may
be unable to participate in the beverage depot program for deposit refunds. When the HSW
program is examined, given the nature of the materials involved, improved universal access
needs to be a factor in evolving the municipality’s HSW program.
Opportunities
The addition of a second depot will have a direct impact on program participation. Greater
participation addresses HRM’s objective of increasing diversion of HSW materials from landfill.
Program costs would be:
One depot - $360,000/year
Two depots - $700,000/year (estimated)
Increasing HSW program capacity through a second depot and/or increasing depot hours of
operation addresses the program objective of enhancing environmental stewardship. Fiscal
system performance is affected by the increased program costs of adding a second depot.
However, as EPR programs evolve under NSE administration, it is hoped that costs of delivering
municipal HSW programs for materials covered under EPR programs will receive funding.
In terms of mobile events, HRM has traditionally supported up to four mobile events at various
locations across the municipality per year. A new initiative gaining popularity in other
jurisdictions is for an annual district HSW event, often hosted by the district councillor and
incorporated into other community events. This model offers a managed event in each municipal
district every year. Events would be planned in coordination with the local councillor.
Current 4/yr. mobile event cost approximately $12,500/event
16 District events {taking into account economies of scale} could cost between
$150-200,000/yr.
Solid Waste Strategy Review – Final Report
Committee of the Whole Report - 32 - January 14, 2014
Based on the assessed levels of participation in the HSW program, new initiatives to get
residents to clean-out basements, sheds and garages of HSW materials is a recognized program
priority. The district event model is identified as an opportunity to gain program visibility,
increase resident access and improve capture rates across HRM.
Consultation Feedback
Residents strongly supported expanding the HSW program. Local community members
participating in the consultation sessions remain concerned about these materials continuing to
end up in the landfill. A consistent theme through all public sessions and online feedback was for
improving education and implementing measures to increase diversion from landfill. These
objectives are consistent with program priorities and Council direction to enhance education and
improve system environmental and fiscal performance.
In-person input and online feedback from the consultation portal identified new by-law measures
to improve diversion from landfill and overall system outcomes. The following list of S-600 By-
law amendments are aligned with the vision and principles of the original CSC Strategy and
Regional Council’s priorities and direction. Statistical data shows that these measures
specifically target HSW materials while also increasing diversion of organics and recyclables.
Recommendation #4 re: HSW
Site a second household special handling waste depot and introduce annual district mobile
household special handling waste events.
E. Residual Waste / Garbage
Successes
HRM can take pride in the fact that for the past seven years the municipality has reduced the
generation of waste delivered to the Otter Lake landfill. HRM peaked in waste generation in
2005-2006.
1999/2000 – HRM generated 141,000 tonnes
2005/2006 – HRM generated 165,000 tonnes
2012/2013 – HRM generated 139,000 tonnes
Figure 5 below illustrates the waste stream breakdown between what was source separated and
what was delivered to Otter Lake and the make-up of materials delivered to Otter Lake.

Solid Waste Strategy Review – Final Report
Committee of the Whole Report - 33 - January 14, 2014
Figure 5
HRM’s source separation program has been in place for over 15 years. In terms of broader
ISWMS and CSC Strategy system objectives, progress has been made. As noted in the pie charts
above, from 2003/04 to 2011/12, HRM reduced the amount of organics in the landfill waste
stream by almost 10,000 tonnes. Recycling material was also reduced by over 10,000 tonnes.
However, as also shown, there remains almost 60,000 tonnes which can be diverted from landfill
annually.
Contributing factors to waste stream changes since 1995 include:
o Legislative Changes
Environmental Act
Environmental Goals and Sustainable Prosperity Act
Solid Waste Resource Management Regulations
NS Landfill Guidelines
NS Material Bans
By-law S-600
HRM Education/Enforcement
o Behavioural changes
source separation & green carts
source separation & blue bags, paper + cardboard recycling
program responsibility/ownership
consumer purchasing choices
back yard composting
reuse, reduce practices, weekend give-aways
recycling products through charities/donations
o Product changes in terms of:
reduced packaging
packaging changes (recyclable plastics verses glass and Styrofoam)
reusable bags

Solid Waste Strategy Review – Final Report
Committee of the Whole Report - 34 - January 14, 2014
Challenges
Currently, 97% of materials delivered to Otter Lake end up in the landfill cell. This is the
outcome of the change in the CSC Strategy objective to accommodate disposal rather than
diversion. Otter Lake landfill operations currently cost $170.00/tonne as of construction of Cell
6. This includes operations of the FEP/WSF and at the Residual Disposal Facility (RDF or
landfill cells), plus gas management operations, leachate processing and all capital expenditures
for cell construction, closure and operating equipment.
When system costs were assessed in relation to the original CSC Strategy, analysis indicated a
projected cost of $67.00/tonne (FY96).24 This equates to $90.00/tonne (FY12) based on Canada
CPI Inflation. When changes were made to the ISWMS plan they were based on keeping
implementation and operating costs within the projected cost ranges of CSC Strategy
projections.25 The CSC Strategy model reduced landfill costs by reducing the requirement to
build landfill cells through diversion, extending their life spans and the period used to pay for
them. Current system costs are almost double what they were forecast to be when the ISWMS
plan system changes were approved.
In terms of diversion, the FEP/WSF operating model was changed from diversion to disposal,
with only limited diversion of readily managed and practical materials. The FEP/WSF operating
plan states that hazardous materials identified on the tip floor are to be separated and sent
directly to the landfill cells. Table 6 below outlines the actual tonnage of materials pulled off the
processing line by the 40 staff who work in the FEP/WSF. The cost of that diversion is also
noted.
Table 6
Figure 6 below illustrates how HRM’s landfill costs have continued to rise as tonnage decreases
(tonnage is currently holding around the 140,000 tonne/year mark in forecasts). Figure 6 shows
the inverse relationship between rising landfill costs and decreasing garbage tonnage. The left
24
An Integrated Waste/Resource Management Strategy, Table 7-3, 1995. 25
HRM – SWRAC 5 July, 1996, Revised Solid Waste/Resource Management Strategy Cost Projections, Revised
Regional Solid Waste/Resource Management Plan May 1996, 2.July, 1996
FEP/WSF System Performance & Cost
Year/Overall
HRM
Diversion
from
Landfill
Isolated
FEP/WSF
Operating
Cost
Recyclable
Materials
Diverted from
Landfill (Tonnes)
Percentage of
Diversion
From RDF
Cost Per
Tonne of
Diverted
Material
2004/54% $ 7,200,000 525 0.5% $ 13,700
2011/61% $ 8,000,000 300 0.3% $ 26,700

Solid Waste Strategy Review – Final Report
Committee of the Whole Report - 35 - January 14, 2014
hand vertical axis shows annual Otter Lake costs. The right hand vertical axis shows annual
tonnages.
Figure 6
Private Investment Property Complexes
Private investment property complexes, high rise/high density, are included in the ICI sector
based on being commercial properties assessed using commercial methods (based on revenue)
although taxed at the residential rate. Condos are included with the Residential sector (those who
receive curbside solid waste collection) because they are assessed as residential dwellings and
taxed in the same or similar manner as houses, semis, duplexes, mobile homes, townhouses.
Overall, ICI diversion is over 60%. However, private investment property complex sector
diversion lags well behind at approximately 30%. These complexes pose unique challenges as a
result of tenant demographics and legacy waste infrastructure systems, which in some cases pre-
date the current waste management program. HRM is engaged with the Investment Property
Owners Association of Nova Scotia (IPOANS) in efforts to improve this outcome.
Compliance with By-law S-600 program guidelines is complicated in private investment
property complexes as a result of environmental living factors including: multiple floors to
transport waste; heavy or locked doors; convenient waste chutes; lack of education or signage;
lack of storage space for source separation; and lack of practical methods of enforcement. It is
further complicated by demographic and cultural factors: tenants rather than owners; students;
cultural and language barriers of new Nova Scotian families and international students; seniors;
and socio-economic influences.
Upon request from various property management firms during 2012/13, staff initiated pilot
projects and tenant outreach education at several private investment property complexes across

Solid Waste Strategy Review – Final Report
Committee of the Whole Report - 36 - January 14, 2014
HRM. These projects included direct outreach and education sessions, use of clear bags and
provision of mini-kitchen green bins. The results have shown improved diversion and
compliance outcomes at some apartment complexes. Project data also showed that improved
diversion resulted in improved waste management service costs.
Private investment property complexes remain within the ICI sector. Integration of such
complexes into the residential collection regime would underscore the municipality’s
commitment to addressing source separation and increasing diversion from landfill and put them
under HRM service oversight and system monitoring. However, private investment property
complexes would represent a challenge in terms of cost and program outcomes.
Incorporation of such complexes into the residential collection regime would result in the
addition of approximately 50,000 units with uncertain results in terms of improvement in the
extent of diversion. The additional cost of such integration based on existing condo waste
modeling data is estimated to be anywhere from $4.7 to $6.8 million per year. It is recognized
that tenant demographics are different between condos and investment properties. However, in
terms of system analysis it was felt that this comparison would provide realistic data necessary to
assess program implications. The collection of this sector would be put to an RFP and be subject
to market pricing. This system cost does not include the additional resource costs to support this
contracted collection regime and oversight work.
Integration of private investment property complexes into the residential collection regime would
require the development of an implementation plan in conjunction with IPOANS and contracted
collection firms. This option would generate some opposition from private sector haulers. There
would need to be a transition period while the properties deal with their existing collection
contracts. The increased scope of operations to manage, educate and monitor these properties
would require additional staff resources. Assumption of the estimated $5 million annual
additional program cost without identification of other offsetting program savings is not
supported. Such a program change would require identification of current program savings to
fund the assumption of this service cost from the private sector.
Flow Control
In 2002, HRM amended By-law S-600 (S-602) to ban the export of waste materials generated
within the municipality and give HRM control over where materials were sent within the
municipality. This measure was intended to protect revenues assessed as critical to support the
ISWMS landfill and organics program costs. The NS Court of Appeal upheld HRM’s position
that it was entitled to control the waste materials generated within its jurisdiction to support
waste program requirements.
Successes/Challenges
Flow control has not been a success. Analysis of flow control in HRM established that it is
neither a fiscal nor environmental system performance benefit. In making this assessment, all
system costs associated with each tonne of waste were included to assess overall system impact.
The following is a straight forward tip fee verses cost impact comparison of flow control:

Solid Waste Strategy Review – Final Report
Committee of the Whole Report - 37 - January 14, 2014
2002 – landfill cost/tonne = $135.00/tonne vs. tip fee of $115.00/tonne
2014 – landfill cost/tonne = $170.00/tonne vs. tip fee of $125.00/tonne
HRM’s flow control mandates all garbage waste go to Otter Lake. Landfill system costs have
and continue to exceed the charged tip fee. All waste materials delivered to the Otter Lake
landfill utilize valuable cell capacity and result in the construction of cells every 40 months.
Flow control further eliminates market competition for tip fees at adjacent second generation
landfills for the business community and their contracted haulers while also imposing higher
system costs on the ICI sector.
When examined in terms of overall system tonnages, changes to flow control could have a
dramatic impact in terms of tonnage delivered to Otter Lake. Using an estimate of a 24%
declining reduction in ICI residual garbage tonnage delivered to Otter Lake, eliminating flow
control could result in less than 70,000 tonnes of waste per year being delivered to Otter Lake. In
an estimated five years, this would enable doubling the existing cell life from 40 months to 80
months. This equates to system capital investment delays as follows:
Current – Cell 8 $20M build in 2018/19, average allocation over 3 years is $6.6M
Doubling Cell 7 life results in Cell 8 build in 2021/22, average allocation over 6 years is
$3.3M
Current – Cell 9 $21.5M build in 2021/22, average allocation over 3 years $7.2M
Doubling Cell 8 life results in Cell 9 build in 2027/28 average allocation over 6 years is
$3.6M
Opportunities
Flow control increases the tonnages delivered to HRM’s landfill every year. Current tonnage
results in the filling of one landfill cell approximately every 40 months. Cell 6 alone cost over
$16 Million dollars to construct. Cell 7 is programmed at 19 million. Reducing tonnage delivered
to Otter Lake would delay the requirement to construct the next cell. Delayed construction
further allows for capital costs to be amortised over a longer period. This improves the
environmental performance of the system without negatively impacting the fiscal system
performance. Elimination of flow control represents two fiscal and environmental system
performance opportunities:
1. Reducing tonnage delivered to Otter Lake conserves landfill cell capacity and delays
construction of cells thereby delaying the environmental impact of constructing a new cell.
2. Removing flow control enables market competition for HRM waste materials, which should
result in reduced service costs for businesses across the ICI sector.
All landfills in NS are governed by the same NS Solid Waste regulations and guidelines, and
landfill liner specifications. Residual waste/garbage materials exported from HRM would only
be delivered to other permitted and fully compliant landfills held to the same landfill
environmental protection standards. Allowing waste to be exported to landfills outside HRM is
not diversion. However, it does improve overall fiscal performance through:

Solid Waste Strategy Review – Final Report
Committee of the Whole Report - 38 - January 14, 2014
saving valuable Otter Lake landfill capacity and space,
reducing landfill system costs by extending cell construction periods,
reducing ICI organics delivered to Otter Lake which must be processed through the
FEP/WSF,
enabling waste resource exchanges, backhauling alternate loads further reducing system
costs.
In addition to improving program fiscal performance, allowing export of residual waste/garbage
also improves economic outcomes through:
reducing ICI sector waste management service costs; and,
supporting other regional landfill regimes.
Table 7 below shows a cost comparison by tonne of the current HRM regime both with flow
control and without flow control. The two costs are essentially the same. In the “no flow control”
regime, a reduced tonnage of 125,000 tonnes per year (from current 140,000) delivered to the
landfill is used. The system costs are then calculated based on the existing price agreement with
MIRROR NS to illustrate the comparison.
It is reasonable to assume that without flow control, given the lower cost of utilizing other
landfills, (see Appendix 1, Table 20) more than 15,000 tonnes of ICI waste would be exported
outside HRM. As noted previously, a 24% reduction in ICI tonnage delivered to Otter Lake
results in an annual tonnage of 116,000. Table 7 illustrates that removal of flow control, and the
corresponding loss in tip fee revenue is offset by the overall system saving of extending the life
of cells and delaying cell construction.
Table 7
Cost/Tonne at the
landfill
Variable Cost – costs
which fluctuate based
on operations and
tonnage
Fixed Cost – capital
costs to develop cells
Status Quo with Flow
Control
$167.00 $120.00 $47.00
No Flow Control at Cell
6
$170.00 $120.00 $50.00
No Flow control
including Cell 7 (2015)
$175.00 $125.00 $50.00

Solid Waste Strategy Review – Final Report
Committee of the Whole Report - 39 - January 14, 2014
Table 8 outlines the diversion rates across the waste streams as a result of implementing clear
bags and eliminating flow control. This data does not include the transfer of disposed residual
tonnage back to HRM by NSE from exported wastes to other landfills. However, based on the
diversion measures, increased education, clear bags and bag limits, plus increased monitoring
and compliance measures across the ICI sector, diversion should continue to increase even as
residual waste is exported out of HRM.
Table 8
Clear Bag & No Flow Control Effect on the
Projected Waste/Resources Received at HRM Facilities
System Components
System Total 1st
Year Forecast
System Total 2nd
Year Forecast
System Total 3rd
Year Forecast
System Total 4th
Year Forecast
System Total 5th
Year Forecast
Otter Lake 116,200 97,500 83,100 72,100 63,800
Compost Facilities 54,400 57,700 60,600 63,000 64,900
MRF 25,200 26,200 27,000 27,500 27,800
Fibres Private Recycling 43,400 43,800 44,200 44,600 45,000
Backyard Composting 5,000 5,000 5,000 5,000 5,000
Drop-off Materials 7,500 7,500 7,500 7,500 7,500
C & D 88,000 88,000 88,000 88,000 88,000
HSHW 500 500 500 500 500
Totals 340,200 326,200 315,900 308,200 302,500
Table 8 provides a forecast five year impact of removing flow control and implementing clear
bags and a reduced residential bag limit in terms of materials delivered to Otter Lake. This
assessment is based on a diminishing scale and the clear bag statistical data obtained from other
jurisdictions. Analysis shows these changes could result in reducing waste delivered to Otter
Lake below 70,000 tonnes per year within five years.

Solid Waste Strategy Review – Final Report
Committee of the Whole Report - 40 - January 14, 2014
Table 9
Clear Bag & No Flow Control Effect on Waste Characterization
at Otter Lake Waste Management Facility
Acceptable Unacceptable
Otter Lake Garbage Organics Recyclable Paper and Cardboard
Recyclable Containers
C&D Material
Other Otter Lake
Total
1st Year Forecast 69,700 17,800 15,000 7,300 5,800 600 116,200
2nd Year Forecast
61,000 12,500 12,000 6,400 5,000 600 97,500
3rd Year Forecast 54,200 8,300 9,700 5,800 4,500 600 83,100
4th Year Forecast 48,800 5,000 8,000 5,500 4,200 600 72,100
5th Year Forecast 44,600 2,500 6,800 5,300 4,000 600 63,800
Table 9 data shows the dramatic reduction in organics delivered to Otter Lake based on removal
of flow control and the implementation of program changes to enhance monitoring and
compliance. In year 5, organics delivered mixed in with garbage is reduced to 2,500 tonnes. That
equates to 3% of the waste materials delivered to Otter Lake. Current data indicates that over
5,000 tonnes/year of putrescible organics goes directly into the landfill without passing through
the WSF. (See Appendix 7, figure 23)
Table 9 analysis indicates that the 30,000 tonne/year WSF facility would be processing less than
3,000 tonnes per year within five years. In addition to the functional performance outcomes of
the current operating model outlined below, the above forecast waste stream changes of materials
delivered to Otter Lake support re-examination of the operating model and the corresponding
approximately $136.4 million cost of the operating model until 2024. See Attachment I –
Financials for detailed breakdown of these costs.
A summary of the outcomes of removing flow control are:
operating cost savings through reduced tonnage delivered to Otter Lake
capital avoidance savings through extended useful life of cells
economic benefits to ICI through lower costs of disposal, especially in view of assessed
required HRM tip fee increases
environmental benefits to HRM through reduced truck traffic, air and noise pollution
exporting waste at market pricing to landfills to improve their fiscal performance
economic benefits to other communities as a result of improved landfill program
performance

Solid Waste Strategy Review – Final Report
Committee of the Whole Report - 41 - January 14, 2014
Consultation Feedback
Participating residents expressed a consistent theme of frustration at the apparent lack of intent to
hold apartment tenants and the ICI sector to the same source separation expectations as residents
serviced through the residential collection regime. Other consultation feedback included:
Strong support for increasing education and enforcement
Increase monitoring and rejections
Reduce system costs and improve fiscal sustainability
Mixed support for reducing garbage bag limits
Mixed support for clear bags
Concerns on feasibility of and effectiveness of proposed changes
HRM conducted waste industry stakeholder and ICI stakeholder consultation sessions. Across
multiple sectors and from several industry representatives, there was demand to examine the
merits and justification for flow control of residual waste/garbage. HRM received direct input
from several sectors (see attachments), which all speak to examining flow control and its’ effect
on waste management service and system costs.
Investment Property Owners Association of NS (IPOANS) (Attachment D)
Canadian Restaurant and Food Services Industry (Attachment E)
Waste Management (Attachment F)
Miller Waste Systems Ltd. (Attachment G)
Industry and the ICI sector were consistent in terms of supporting greater enforcement and
education, especially with apartments. Industry stakeholders and the business community were
looking for defined understanding and accountability in terms of implications of a clear bag
system. Who was to be held accountable and how were rejections to be dealt with. The restaurant
association did not support clear bags. Use of clear bags to monitor and manage source
separation will require a detailed management regime be developed in consultation with the
haulers and be incorporated into collection contracts.
Waste industry feedback recommended a separate collection regime for investment properties.
Both the ICI and industry sectors did not want to move backwards but rather desired to build on
existing successes with a view of holding costs in check.
In addition to reducing service costs, IPOANS identified incorporating high density residential
properties into HRM’s residential collection regime as a priority. Based on a national
comparative scan, integration of apartments into residential collection regimes is a common
practice in other jurisdictions of comparative size to HRM (Attachment H).
The consultation process identified strong support for practical changes which will enhance
diversion from landfill, reduce system costs and improve private sector service delivery and
costs. There was also intent to hold everyone equally accountable for the source separation
model.
Solid Waste Strategy Review – Final Report
Committee of the Whole Report - 42 - January 14, 2014
Recommendation #5 re: Residual Waste / Garbage (Flow Control)
Initiate By-law amendments to:
a. mandate clear bags (with one nested opaque bag) for residential collections;
and,
b. reduce garbage bag limits from 6 to 4.
Recommendation # 6 re: Residual waste / Garbage (flow control)
a. Increase curb-side education and monitoring;
b. Increase apartment tenant education and monitoring; and
c. Increase ICI load monitoring and inspections and the landfill.
Recommendation # 7 re: residual waste / garbage (flow control)
Amend By-law S-600 to allow for the export of ICI residual waste (garbage) outside
HRM, and amend Administrative Order number 16 to provide for an increase in fees
for disposal of ICI residual waste from $125 per tonne to the assessed system cost of
$170.00 per tonne.
F. FEP/WSF
The original CSC strategy viewed solid waste as a resource as opposed to garbage. The strategy
relied on source separation or diversion to reduce reliance on landfill and achieve environmental
protection. However, it was recognized that it would take some period of time to evolve the
cultural change necessary to achieve the outcomes envisioned by the strategy. As such the
strategy committed to the interim processing of residual garbage to divert organics and
recyclable materials remaining in the black bag garbage stream while behaviours changed. The
Front End Processor (FEP) and Waste Stabilization Facility (WSF) would divert improperly
separated materials out of the landfill and capitalize on their value as resources. The resulting
revenues would offset the interim processing costs
The CSC strategy envisioned that the FEP/WSF model would be “scaled down in a planned
manner as source separated centralized composting scaled up.”[1]
Environmental and community
protection were derived from behavioural change and source separation and the landfill cell liner
designs and specifications. The mechanical FEP/WSF processing system was not intended as
protection but rather to recover resources for revenue to offset initial system costs. Waste
processing was not intended to provide long-term protection. Source separation based on
behavioural change was the long-term solution.
The role of the FEP/WSF mechanical processing changed with the revised plan. The function
changed from diversion to disposal; that is, minimizing the negative impacts from gases, odours,
leachate and vectors resulting from organic and putrescible materials decomposing in the
[1]
An Integrated Waste/Resource Management Strategy, page 7, 1995.

Solid Waste Strategy Review – Final Report
Committee of the Whole Report - 43 - January 14, 2014
landfill. [2]
The contract with MIRROR NS included the design, construction and operational plan
for Otter Lake, for which Provincial approval was required. However, there is no legislative
requirement for the FEP or WSF and no other landfill in the province or identified in Canada or
elsewhere, uses similar machine processing prior to disposal. This fact was noted by MIRROR
NS when they submitted the revised plan and remains the same as noted by Stantec in their
review. Unlike the green bin program, the FEP/WSF process has not been replicated anywhere.
Successes
The FEP/WSF facilities have performed as designed in the Revised Plan and contracted. They
were developed to counter the negative environmental and community impacts resulting from
putrescible food scrap organics supporting flocks of seagulls and other vermin, decomposing and
creating odours and negatively impacting the environment and community and they have largely
done that. In doing so, they have alleviated the concerns of the community. For some area
residents, the FEP/WSF processing is identified as the source of community and environmental
protection. Operational outcomes from the landfill site itself have met community expectations
in terms of there being no environmental and community impacts. The landfill site does not
support a large flock of seagulls. There have only been two brief periods of odour incidents,
which were attributable to identified operational issues and addressed in a timely manner.
Challenges
There are four identified functional system challenges. These are:
1. Environmental impact of fugitive Green House Gases (GHG)
2. System Performance – Organics Capture Rate
3. System Cost Benefit Analysis
4. Occupational Health and Safety Issues
1. Fugitive GHGs
The proposed change from diversion to stabilizing prior to disposal was intended to achieve the
environmental objective of minimizing the negative outcomes resulting from gases, odours,
leachate and vectors. As previously note, MIRROR was not expecting fugitive gases to create
problems at the landfill as a result of the FPE/WSF processing. The expected outcome from the
processing of materials through the FEP-WSF was elimination of the negative environmental
impacts of gases, odours, leachate and vectors.[4]
Two years after operations began, in 2001,
gases and odours began generating numerous complaints from neighbouring residents.
MIRROR NS developed a pre-closure gas and odour management system of temporary piping
and wells to capture and flare off the fugitive gases escaping from the active cell. This fix
currently adds approximately $750,000.00/year to operating expenses at the site. The cost of
correcting this system failure is an on-going operational expense which is borne solely by HRM.
[4]
Appendix Q, Operations Plan, Agreement For The Design, Construction And Operation Of Components Of The
Halifax Regional Municipality’s Solid Waste Facilities,” page 21, dated July 25, 1997.

Solid Waste Strategy Review – Final Report
Committee of the Whole Report - 44 - January 14, 2014
MIRROR NS recently commissioned a report by Dillon Consulting Limited, the engineering
firm associated with the design and construction of the FEP and WSF. Dillon’s position is that
the FEP/WSF functions as contracted (in terms of duration and temperature of materials
processed through the WSF) and that processing decreases the duration that resulting putrescible
organics gases need to be managed.[5]
Dillon Consulting Limited commissioned an analysis from Dr. Paul Arnold who assessed the
operation of the WSF and the materials coming out after stabilizing as follows:
“The evaluation of the WSF demonstrates the facility is capable of significantly stabilizing the
organic content in the residual waste stream delivered to the WSF, reducing the respiration rate
(or in other words, the reactiveness or appetite for oxygen) by approximately 67% over the
three-week treatment process. This reduction in the rate of oxygen consumption diminishes the
subsequent decomposition that inevitably takes place in the Residuals Disposal Facility (RDF),
thereby proportionately reducing the odour production potential and the corresponding
production of liquid and gaseous by-products of anaerobic digestion.”[6]
Dillon and Arnold contend that the WSF functions as contracted and reduces the gas potential of
the materials which pass through the facilities. However, the outcome of this process was not
anticipated. Shredded and stabilized mixed waste organic materials, placed in an active cell,
rapidly generate fugitive GHG that escape into the atmosphere. The temporary gas and odour
management system manages the odours resulting from the processing.
2. System Performance – Organic Capture Rate
The FEP/WSF mechanical processing is intended to minimizing the negative impacts from
gases, odours, leachate and vectors resulting from organic and putrescible materials
decomposing in the landfill by stabilizing the waste prior to disposal in the landfill. The
MIRROR NS currently employs 40 personnel in this function.
Statistical data from waste content analysis by both CBCL and SNC Lavalin shows that one third
of the putrescible organics (2011) which are delivered to the FEP/WSF facility are sent directly
to the RDF landfill cell without passing through WSF stabilizing.[7]
(See Appendix 7, Figure 23
for the detailed breakdown of this analysis). This outcome is contrary to the MIRROR NS
contract and also the CMC agreement. The MIRROR NS contract stipulates that all putrescible
organics must be stabilized in the WSF prior to being placed in the landfill. These organics go
straight to the RDF. The CMC agreement requires that only “acceptable waste” be deposited in
the landfill. These putrescible organics bypassing the WSF are not acceptable waste. In terms of
[5]
Waste Resource Strategy Update Document Review Report, May 2013, Procured by MIRROR Nova Scotia,
Submitted by: Dillon Consulting Limited, page 11. [6] Memo, Subject: Waste Stabilization Facility (WSF) Evaluation and Comment on Stantec Inc. & SNC-Lavalin
Inc. Reports, Bio-Logic Environmental Systems, Dr. P Arnold, 16 September, 2013 [7]
CBCL Ltd. - Otter Lake WSF Materials Characterization and Testing (Dec 2012 – Jan 2013) determined that 66%
of the material processed through the WSF is organic and 34% is other material.

Solid Waste Strategy Review – Final Report
Committee of the Whole Report - 45 - January 14, 2014
system performance, a significant percentage of putrescible organics enter the landfill without
stabilization. The status quo situation is not compliant. However, notwithstanding this, the
operational measures at the RDF currently in place at the landfill are effectively dealing with
these putrescible organics that are not stabilized through the WSF.
3. System Performance – Cost/Benefit Analysis
The contract with MIRROR NS including the operation of the FEP/WSF and landfill is a no risk,
total cost plus percentage of cost profit agreement. For every dollar MIRROR NS spends
operating the landfill, HRM pays MIRROR NS that dollar plus an additional $0.25 in profit.
Table 10 outlines the projected system costs of the FEP/WSF over the next ten years:
Table 10
Projected Isolated FEP/WSF Capital Equipment and Annual
Operating Cost Estimates
Year FEP/WSF
Operating Cost FEP/WSF Capital Total
2013/2014 $8,500,000 $1,600,000 $10,100,000
2014/2015 $8,700,000 $1,300,000 $10,000,000
2015/2016 $9,000,000 $900,000 $9,900,000
2016/2017 $9,200,000 $1,600,000 $10,800,000
2017/2018 $9,400,000 $1,600,000 $11,000,000
2018/2019 $9,700,000 $1,900,000 $11,600,000
2019/2020 $9,900,000 $2,500,000 $12,400,000
2020/2021 $10,100,000 $2,100,000 $12,200,000
2021/2022 $10,400,000 $1,300,000 $11,700,000
2022/2023 $10,700,000 $1,300,000 $12,000,000
2023/2024 $10,900,000 $1,300,000 $12,200,000
2024/2025 $11,200,000 $1,300,000 $12,500,000
Total $117,700,000 $18,700,000 $136,400,000
4. Occupational Health and Safety Issues
The MIRROR NS operating plan specifies sharps including biomedical waste hazardous
materials when identified on the FEP tip floor shall be separated from the other residual
materials and sent directly to the landfill cells.[8]
This includes sharps, and all biomedical waste
[8]
Approval, Province of Nova Scotia, Environment Act, S.N.S. 1994-95, c.1, Holder HRM, approval number 2008-
065580-A01, expiry date July2, 2022, section 4 c 2 i & 5 e through i.

Solid Waste Strategy Review – Final Report
Committee of the Whole Report - 46 - January 14, 2014
and all hazardous materials identified through inspection on the tip floor. This is an Occupational
Health and Safety measure.
Medical waste is not classified as garbage, and when generated in a hospital is treated as special
waste and not sent to the landfill. However, the growth of “at home health care” is a growing
issue for the existing operating model at Otter Lake. This program has introduced what has
always been identified as medical waste into the municipal waste stream. The Health Department
has recently determined that some materials generated in a home as a result of “at home health
care” be classified as garbage and be placed in garbage bags. HRM is concerned about this
position, and waste identified as medical waste will be stickered and rejected.
As a result of the use of black bags for garbage in HRM, generated at home medical waste can be
hidden within the garbage bag and not be identified until it is at the landfill. This medical waste
could burst from a black bag being compacted in the back of a packer truck, or if run over by a
frontend loader in the FEP. Of greater risk is the FEP processing which includes mechanically
and manually ripping open black bags and exposing the contents prior to the materials being sent
through the trommel screen and shredder before inspection by the second processing line of
workers. The presence of this medical waste in the municipal garbage stream poses a potential
Occupational Health and Safety risk for HRM’s waste system workers. This OHS issue is
magnified in HRM given the current use of black bags and the operating model at Otter Lake.
The negative environmental outcome of fugitive GHG, the continued reliance on processing of
wastes, system performance, the significantly higher costs of the current landfill operating
regime and the identified OHS issues are system challenges and outcomes unintended and
contrary to the original vision and objectives of the citizen based CSC Strategy.
Opportunities
While the FEP/WSF facilities have performed as designed in the implemented ISWMS plan, the
engineering and financial information indicate that they only contribute marginally to
environmental protection and do so at a very significant cost of more than $10,000,000 per year.
Further, that cost continues to rise notwithstanding that diversion of waste at source has
continued to increase and volumes of residual waste processed by the facilities have continued to
decrease. As such, there is an opportunity to use other methods to increase diversion (such as
clear bags and removing flow control) and other measures at the landfill face to enable the
scaling back, discontinuance or even repurposing of the FEP/WSF facilities, and thereby
maintain environmental protection while realizing significant savings.
Stantec and SNC Lavalin both concur that given the current contents of the garbage waste
stream, other measures could maintain exiting environmental and community protection. SNC
Lavalin went so far as to suggest that given the amount and nature of organics currently arriving
at the Otter Lake site; “In our opinion, the WSF process contribution to minimizing the number
of reported annual community odour incidents is such that if it did not exist, it would not be

Solid Waste Strategy Review – Final Report
Committee of the Whole Report - 47 - January 14, 2014
missed, due to the demonstrated management infrastructure, capacity, and operations at the
RDF.”[1]
Stantec and SNC Lavalin are not suggesting that the FEP/WSF does nothing. On the contrary,
both firms agreed with Dillon and Arnold that the facilities do reduce gas potential in the
stabilized putrescible organics. What Stantec and SNC Lavalin are suggesting is that other
measures, operational initiatives and processes undertaken at the active cell and on the RDF
itself could achieve the same results as the current FEP/WSF operation. More importantly, these
same results could be achieved for significantly less cost. At a current annual assessed cost of
over $10 million/year over ten years, FEP/WSF system costs would support most if not all other
ISWMS infrastructure investment needs.
Consultation Feedback
Town hall and community outreach consultation events featured very emotional sessions. Every
public session was attended by many residents of Beechville, Timberlea, Lakeside and Prospect
Road (BLTPR), MIRROR NS and Municipal Group employees, the CMC and engaged
stakeholders. Overall consultation feedback, including online input, identified:
Strong opposition to any changes to the Otter Lake operating model, facilities or landfill
design.
Strong support for exploration of alternative technologies rather than landfill for waste
Mixed reaction to a ISWMS campus at the Otter Lake site
Outcomes most important to residents, especially those in attendance at most events:
Honour the contract, referring to the MIRROR NS contract and CMC agreement
No reduction of the landfill liner
No increase in cell height
No waste campus
HRM to site a new landfill and close Otter Lake in 2024
The ICI sector and Industry breakout sessions were also dominated by MIRROR NS and
Municipal group employees. Key takeaways from these sessions included:
Lower waste system costs
Cost effective programs which meet environmental objectives
Must consider impact on community of changes at Otter Lake
Change the HRM By-laws to allow export of materials
Increase monitoring and education of apartments and condos
Single stream recycling would streamline recycling
Need clear understanding of service cost implications of any system changes
[1]
A Peer Review of the January 2013 Stantec Report for HRM titled “Waste Resource Strategy Update,” SNC
Lavalin Inc., Version 1.0, page 58, April 2013.

Solid Waste Strategy Review – Final Report
Committee of the Whole Report - 48 - January 14, 2014
Recommendation # 8 re: FEP/WSF
Direct staff to initiate consultation with MIRROR NS and the Community Monitoring
Committee on options for changes in the operating model (front end processor, waste
stabilization facility, residual disposal facility) at Otter Lake landfill site A, returning to
Council with a transition plan for landfill operations at the site based on diversion
outcomes resulting from the changes outlined in this report.
G. Otter Lake Landfill
Successes
Based on operational records, environmental monitoring and complaint records, the Otter Lake
landfill site has achieved municipal program expectations in terms of community and
environmental impacts. A standard of ‘no complaints logged’ is the accepted and predominant
outcome for the annual reports on record with the exception of two periods, 2001/02 and fall
2011. The site is situated adjacent to one of the highest growth areas within the municipality
which speaks to its lack of community and environmental impact.
HRM owns the lands associated with the landfill located at Otter Lake. MIRROR NS Limited
currently operates the landfill for HRM in accordance with a design/build/operate contract
entered into between the two parties in 1997. The contract includes a defined Operating Term
that expires upon the earlier of the site reaching designed capacity as a landfill, or 25 years after
the Acceptance Date (January 1, 1999).
Section 24.2 of the Mirror Agreement reads as follows:
At the end of the Operating Term, if the Facilities have reached capacity as a landfill
such that no further waste is permitted to be disposed of at the Facilities under
permits that have been issued at that time and no additional permits can be obtained
to permit further waste to be disposed of at the Site or HRM elects, at its option to
permanently close the Facilities, then HRM shall deliver a notice to Mirror not later
than sixty (60) days after the end of the Operating Term stating that it is HRM’s
intention to permanently close the Facilities (“Notice of Intention to Close”).
Section 24.2 only requires HRM to permanently close the Facilities at the end of the Operating
Term (a) if it elects to do so, or (b) if the Facilities have reached capacity and no additional
permits can be obtained to permit further waste to be disposed of at the Site.
In addition, HRM and the Halifax Waste/Resource Society entered into a monitoring agreement
of the landfill dated February 16, 1999 (the “CMC Agreement”). The CMC Agreement imposes
no obligations on HRM with respect to closure of the landfill. The term of the CMC Agreement
is open ended:

Solid Waste Strategy Review – Final Report
Committee of the Whole Report - 49 - January 14, 2014
10.01 This Agreement shall be effective as of the date of its execution and, subject
to this Agreement, shall remain in effect for such time as the Facilities are operated
at the Site.
The Regional Plan, approved in 2006, contemplates the extension of the Otter Lake site beyond
2024:
SU-22 - HRM shall, through a public consultation process as defined by Council,
consider all options for a new regional waste processing and disposal facility, including
siting a new facility, extending the life of the existing facility, and exploring waste
diversion initiatives.
Over the past 12 years, HRM purchased 800 hectares of additional lands surrounding the site in
order to maintain its isolation and support future operational needs. The landfill’s current site
approval permit is based on the original plan for 9 cells. As required, HRM has requested permit
amendments as new cells were added or facility changes were made. Upon issuance of the
amended approval permit, the expiration date is updated to reflect a new 10-year period. HRM
has requested and received over two dozen approval permit amendments. The current approval
permit, based on Cell 6 having been added to the facilities in October 2012, expires in 2022.
Based on provincial legislation, contracts, agreements and the Regional Plan, Regional Council
is the sole authority to extend operations at Otter Lake beyond 2024. Operations at the site can
be extended in the following ways:
reducing tonnage delivered to the landfill and thereby extending the life of the originally
planned remaining four cells with an updated permit beyond 2024;
increasing the design height of the cells, thereby increasing the capacity of the existing 6
cells and extending their operational life beyond 2024 and an updated permit;
executing the bullet above and adding the final three cells, 7-9, with an updated permit,
further extending site operations;
making no changes and requesting a new site approval permit for an additional block of
cells adjacent to the originally planned 9 cells.
Challenges
The following requirements would be needed to extend operations at Otter Lake:
negotiate a new agreement with the current contractor or new contractor in terms of
extending beyond the initial operating agreement period of 1999-2024;
apply to NSE for amended permits as the cells are developed/expanded beyond Cell 9
and/or 2024.
Some members of the local community advocate that there is an agreement in place
which mandates closure of the site in 2024.
Opportunities

Solid Waste Strategy Review – Final Report
Committee of the Whole Report - 50 - January 14, 2014
Regional Council can choose to remain at Otter Lake beyond the current initial operating term
and 2024. Otter Lake landfill represents significant opportunities for HRM’s ISWMS program.
Stantec identified a number of them in their system review. These included:
A2 – Request Modification of the Nova Scotia Landfill Liner Specification
A3 – Extend Life of Otter Lake Landfill through Vertical Expansion
B1 – Create a Centralized Waste Resource Campus
The following factors support extension of operations at Otter Lake beyond 2024:
Siting a new landfill in order to close an existing no-impact landfill with significant
capacity is not sound environmental stewardship;
Wasting capacity at the existing site through flow control is not sound environmental
stewardship;
Shutting down and abandoning a strategic regional asset unnecessarily and imposing a
$100 million dollar new site development expense on tax payers is not sound fiduciary
responsibility.
Initiating a landfill siting process and exposing the municipality to all of the issues related
to that process is not recommended given that the current site is fully capable of meeting
HRM landfill needs well beyond the initial design duration.
Landfill Liner Specifications
Regional Council’s direction included maintaining or improving environmental protection.
Current landfill cell specifications mandated by Nova Scotia Environment were assessed by
Stantec to be more stringent in terms of waste industry standards for second generation landfills.
Otter Lake landfill liner design and construction currently exceeds NSE landfill liner guideline
specification standards. The landfill liner is over 12 feet thick with multiple layers, including
multiple membranes for leak protection.
In terms of fiscal performance, the cells are, therefore, more costly than industry standards. This
is further impacted by the additional materials utilized at Otter Lake which were added to the
specifications. In addition, the NS Landfill cell specifications were developed in response to the
waste streams of the mid-1990s. The current waste stream which ends up in a landfill is
significantly different. These factors support a review and validation of the current specifications
in terms of potentially imposing an unnecessary program cost burden on tax payers.
However, Regional Council mandated no reduction of environmental protection. Validating the
cell liner specifications from an environmental protection perspective based on mixed waste
garbage stream contents has not been accomplished. This analysis would need to be completed in
conjunction with a validation process entered into with the NS Department of Environment.
Vertical Extension
The addition of added height on cells with no identifiable environmental impact increases the
economic sustainability of the development of cells at Otter Lake. This change also introduces

Solid Waste Strategy Review – Final Report
Committee of the Whole Report - 51 - January 14, 2014
over 20 years of projected annual capital budget savings as noted below in Table 11. The key
point in this representation is that these are not discretionary potential budget avoidance savings.
These capital dollars would have to be spent to fund future cells which are already in the long
range forecast budget to support Cells 7-9. Vertical extension can significantly reduce the
additional physical impact of additional cells on site lands by extending the use of existing cells
through managed/engineered cell height increases.
Table 11
Based on current reserve funding and past budgets the immediate funding outcome of increasing
cell height would be approximately $11.5M surplus for FY2013/14. There will be an additional
$6.3M which will be allocated from the 14/15 budget to the reserve for cell 7 which can also be
saved.The five-year budget cost avoidance savings of vertical extension is over $50 million. This
represents cost avoidance and system savings which could fully fund all identified ISWMS
program capital and program investment requirements. These include:
Organics program changes and capital investment requirements;
Future MRF replacement costs if the decision is to use tax pay funding
Cart replacement projects
Integrating apartments into the residential collection regime
Developing landfill gas to energy project
Industry analysis assesses current cell height protocols impose higher than industry standard
capital cost/tonne investment on HRM with no quantifiable environmental benefit. There are no
identified environmental impacts resulting from increasing cell height. Visual testing proved no
change to existing visual conditions. Based on current industry practices, and the effectiveness of
remedial site restoration practices employed today, it is recommended that an increase in height
across all existing and future cells be implemented at the Otter Lake site.
ISWMS Campus Model
The need to develop a new MRF site represents an opportunity to capitalize on the existing Otter
Lake site and infrastructure. HRM already owns the land necessary to develop a new MRF at
Otter Lake. Otter Lake has existing scales and administration facilities. Co-location at the site
with the existing facilities represents future flexibility in terms of program options. Should HRM
introduce an alternative technology option, such a facility is likely to also benefit from co-
Cell Height Scenario’s Projected Capital Budget Cost
Avoidance
Cell Height
Increase
Resulting Year The
Next Cell Would
Need to be Built
Projected
Budget Savings / Cost Avoidance
15m 2034 - 2036 $ 114M - $ 117M
10m 2029 - 2031 $ 74M - $ 82M
5m 2023 - 2024 $ 36M - $ 43M
Current 2016 $0

Solid Waste Strategy Review – Final Report
Committee of the Whole Report - 52 - January 14, 2014
location with the residual waste and recycling streams. Transportation of materials to processing
sites increases program costs and reduces material revenue returns. This is the fiscal performance
benefit of a campus model.
As alternative technologies evolve, waste stream materials management will likewise evolve.
Materials will be separated for processing in alternative technologies. These may include
materials in both the residual garbage stream and products with low recycling market value
which are beneficial to alternative technology systems as a fuel source or for chemical recycling.
Long-term planning should continually adapt to be cost effective and/or evolve waste stream
materials management, processing and usage. As a result of its mature multi-stream waste
resources management program, HRM is well-positioned to capitalize on future alternative
technologies as they become operational realities. A campus model represents a strategic
decision to incorporate a cost effective, efficient and adaptable system model to support future
opportunities.
A future campus site also supports economic opportunities related to regionalization of the
ISWMS through partnerships with adjacent municipalities. Based on HRM’s size of operations,
organics and recycling processing is more economical. Accepting materials for processing from
other jurisdictions at reduced costs due to economies of scale offers the reciprocal opportunity to
send waste materials at reduced rates to other regional landfills. The double use of a transport-
trailer reduces overall system costs and improves fiscal performance. A campus represents the
optimized central location of material processing for loading and off-loading transfer trailers.
The Otter Lake landfill also introduces the opportunity to explore utilizing landfill gas as a
power source. As with the closed Sackville landfill, HRM could develop a landfill gas energy
project which would produce electricity. A campus model would then include its own electricity
and heat source for power needs. A new MRF located at the campus will require electricity to
run the processing systems and require heat to support the large open facility. A generic power
and heat source at a campus would further reduce program operating costs.
A landfill gas to energy project for Otter Lake still requires a full business case analysis.
However, HRM’s existing landfill gas-to-energy project partner, who operates the landfill gas
project at the closed Sackville Landfill site, completed preliminary analysis in terms of gas
generation and project costs and assessed a project would be viable. Stantec also advanced this
position. Given the capital investment for a landfill gas project, this opportunity depends on the
decision to extend operations Otter Lake beyond the current 9 cell plan and 2024.
Future alternative technology projects co-located at the campus site could also support the
provision of power to facilities located at Otter Lake. All operations located at the Otter Lake site
would benefit from locally generated HRM owned power and heat.
Co-location of new infrastructure which could utilize on-site generated power and heat through
energy from waste projects provides a significant program incentive. Utilizing existing and/or
the addition of new infrastructure facilities and systems to support campus site represents a less
costly option than developing new dissipated sites.

Solid Waste Strategy Review – Final Report
Committee of the Whole Report - 53 - January 14, 2014
The development of Otter Lake as an ISWMS campus site addresses both environmental
stewardship and system fiscal performance based on:
Co-location of other ISWMS components, such as a future new recycling facility, would
be more cost efficient in terms of sharing existing operational infrastructure.
HRM already owns sufficient property at Otter Lake to support any future ISWMS
facility component need.
Analysis is on-going to establish a project to capture landfill gases for use in an Energy
from Waste (EFW) plant which could generate sufficient electricity to support all site
power and heat requirements.
Potential repurposing of existing facilities to other ISWMS component requirements
would further reduce future capital cost investment requirements.
Evolution of the ISWMS in terms of utilizing other regional waste industry asset capacity
and utilizing Otter Lake facilities as a transfer station eliminates the requirement to
develop a new transfer station. The FEP is a transfer station in terms of functionality.
A campus will reduce identified future system requirement investment and operating
costs.
Repurpose the FEP & WSF structures
The WSF is an aerobic composting facility which could provide up to an additional 30,000
tonnes of SSO aerobic processing capacity annually. A new plant of equal capacity would cost
well over $10 million. In 2010, HRM refurbished the roof of the WSF which should now last an
extended operational life well beyond 2024. Should conditions change at the site to permit the
repurposing of the WSF to process organics rather than garbage mixed with putrescible organics,
this could support reducing system strain on organics processing.
The FEP is essentially a transfer station which could be re-purposed to provide transfer station
capacity within HRM. Should conditions change at the site which permits the repurposing of the
FEP into a transfer station, this could save HRM upwards of $10 million dollars in infrastructure
costs. In a campus scenario, the FEP could be used to load organics or garbage for backhauling
to other regions who contract HRM for processing their recycling. HRM could also take
advantage of backhauling waste from Otter Lake campus to utilize other landfill capacity at
lower costs including ICI sector waste transfer operations with flow control removed. These
initiatives could further reduce system costs with offsetting revenues. In addition, both the FEP
and WSF could provide more adaptability as the ISWMS evolves, especially when operationally
viable alternative technologies are eventually introduced.
Consultation Feedback
During the consultation phase of the strategy review, a position raised by CMC, members of the
local communities who participated and employees of MIRROR NS was to Honour the Contract
and Agreement to close the Otter Lake site in 2024. CMC objected to the option of extending
operations at the Otter Lake site. CMC’s position, acting on behalf of local residents, is that the
contract and agreement with the community requires HRM to close the site in 2024. The
“contract” in question is with the site operator, MIRROR NS and the “agreement” is with CMC

Solid Waste Strategy Review – Final Report
Committee of the Whole Report - 54 - January 14, 2014
which forms a part of the contract with MIRROR NS but signed separately 16 February, 1999.
The same consultation feedback from the FEP/WSF section applies to this section.
As a result of the direct implication of extending operations at Otter Lake beyond 2024, there
was strong opposition voiced by event participants to the establishment of an ISWMS campus at
Otter Lake.
During the industry session, the following concerns were raised:
Congestion in terms of traffic to deliver loads to various facilities through one
gate/entrance and scale operation;
In the event of an environmental or public safety emergency, the site could be closed for
access to all facilities;
Labour issues and unrest might restrict facility access impacting all operations.
Recommendation # 9 re: Otter Lake
Extend operations at Otter Lake beyond 2024, and direct staff to increase the vertical
height of existing and future cells by 15 meters and establish an ISWMS campus to support
new facilities and alternative technologies as they become viable.
LEGAL IMPLICATIONS
HRM Legal services division has reviewed this report and provided legal opinions under
separate cover as required. Regional Council has legal authority under the Halifax Regional
Municipality Charter to make By-laws implementing the recommendations contained herein.
FINANCIAL IMPLICATIONS
In order to provide some degree of financial assessment of the above outlined options, initiatives
and recommendations, staff developed a two scenario comparison model. Scenario 2 is further
sub-divided into (a , b & c), (a) having the FEP/WSF remain operating, (b) having the FEP/WSF
phased out in 2016/17 and (c) with the FEP/WSF facilities no longer pre-processing waste for
disposal in 2014/15.
Financial Scenario Options Analysis:
Table 12 below outlines the ten year overview of the options in terms of overall system costs.The
Estimated Solid Waste Program Cost sheet illustrates the estimated solid waste costs for the
status quo as well as three scenarios outlined below going out to 2024/25. The individual
scenario tables outline just the program changes taking place for each scenario and how these
additional program changes would be paid for or create a budget pressure to be covered in the
case of the status quo scenario.

Solid Waste Strategy Review – Final Report
Committee of the Whole Report - 55 - January 14, 2014
Table 12
Estimated Solid Waste Program Cost 2014/15 - 2024/25
Operating Capital New Capital Total Cost to 2024/25
Scenario 1 - Status Quo $480,000,000 $126,000,000 $144,000,000 $750,000,000
Scenario 2A - FEP/WSF Remain $453,000,000 $60,000,000 $44,000,000 $557,000,000
Scenario 2B - FEP/WSF Phased out after 2016/17 $379,000,000 $46,000,000 $44,000,000 $469,000,000
Scenario 2C - FEP/WSF Removed $355,000,000 $42,000,000 $44,000,000 $441,000,000
Note: New infrastructure costs have been identified in terms of potential future system costs.
Infrastructure development requirements can be met through public or private RFP funding of
capital projects. Full business case analysis will determine the appropriate mechanism to meet
the infrastructure requirements.
In Scenario 1 there are no changes to operations at the Otter Lake Facilities, FEP and WSF
continue operations and landfill cell heights remain the same. Composting operations are
adjusted to include upgrades in Burnside which facilitate pre-processing of ICI organics for off-
site Anaerobic Digestion. Upgrades to ensure regulatory compliance and to meet capacity needs
also occur to the existing aerobic composting operations. A secondary compost curing site is
programmed for 2015 and a new Recycling Facility is planned for 2016. Procurement of
recycling carts and replacement organics carts is programmed for 2017 to enable roll out in
2018/19 prior to operations at a new MRF.
Table 13
SCENARIO 1 STATUS QUO 2014/15 - 2024/25
Adjustments to Compost Program (-$24,000,000)
New Recycling Facility $10,000,000
Secondary Compost Curing Site $4,000,000
Increase Organics Capacity $5,000,000
Multiple Stream Collection Carts (Blue/Green) $25,000,000
New Landfill Site $100,000,000
Total $144,000,000
Net Cost Position $120,000,000

Solid Waste Strategy Review – Final Report
Committee of the Whole Report - 56 - January 14, 2014
Scenario 2A – FEP/WSF Included
In Scenario 2A, the FEP and WSF continue operations and landfill cell heights increase by 15
metres. Control of waste export is removed and Commercial garbage tip fees are increased to
$170 per tonne. The household hazardous waste program is expanded. Composting operations
are adjusted to include upgrades in Burnside which facilitate pre-processing of ICI organics for
off-site Anaerobic Digestion. Upgrades to ensure regulatory compliance and to meet capacity
needs also occur to the existing aerobic composting operations. A secondary compost curing site
is programmed for 2015 and a new Recycling Facility is planned for 2016. Procurement of
recycling carts and replacement organics carts is programmed for 2017 to enable roll out in
2018/19 prior to operations at a new MRF.
Table 14
Scenario 2B – FEP/WSF phased out in 2016/17
In Scenario 2B, the FEP and WSF are no longer operated after 2016/17 and landfill cell heights
increase by 15 metres. Control of waste export is removed and Commercial garbage tip fees are
increased to $170 per tonne. The household hazardous waste program is expanded. Composting
operations are adjusted to include upgrades in Burnside which facilitate pre-processing of ICI
organics for off-site Anaerobic Digestion. Upgrades to ensure regulatory compliance and to
meet capacity needs also occur to the existing aerobic composting operations. A secondary
compost curing site is programmed for 2015 and a new Recycling Facility is planned for 2016.
Procurement of recycling carts and replacement organics carts is programmed for 2017 to enable
roll out in 2018/19 prior to operations at a new MRF.

Solid Waste Strategy Review – Final Report
Committee of the Whole Report - 57 - January 14, 2014
Table 15
Scenario 2C – FEP/WSF Removed
In Scenario 2C, the FEP and WSF are no longer operated and landfill cell heights increase by 15
metres. Control of waste export is removed and Commercial garbage tip fees are increased to
$170 per tonne. The household hazardous waste program is expanded. Composting operations
are adjusted to include upgrades in Burnside which facilitate pre-processing of ICI organics for
off-site Anaerobic Digestion. Upgrades to ensure regulatory compliance and to meet capacity
needs also occur to the existing aerobic composting operations. A secondary compost curing site
is programmed for 2015 and a new Recycling Facility is planned for 2016. Procurement of
recycling carts and replacement organics carts is programmed for 2017 to enable roll out in
2018/19 prior to operations at a new MRF.

Solid Waste Strategy Review – Final Report
Committee of the Whole Report - 58 - January 14, 2014 Table 16
COMMUNITY ENGAGEMENT
The community engagement (CE) program evolved through discussions and motions of the
Environment and Sustainability Standing Committee and Regional Council. Given the scope and
duration of the CE program, HRM retained NATIONAL Public Relations to design and conduct
it according to HRM’s Community Engagement Strategy, and to collect all feedback into a
comprehensive CE report, which NATIONAL delivered to HRM on December 6, 2013
(Attachment C).
Throughout the CE process, NATIONAL aligned all program components with the engagement
plan outlined in the staff report to the Environment and Sustainability Standing Committee dated
February 26, 2013, and the motions approved by Regional Council on April 23, 2013. This
approach helped ensure that as many perspectives as possible from the landfill host community
participants, other HRM residents, businesses, and waste industry stakeholders would be
considered in Regional Council’s eventual decisions for the entire solid waste system in HRM.
NATIONAL and HRM staff hosted 14 engagement events during September and October 2013
and maintained continuous online engagement throughout the same period using the
ShapeYourCityHalifax.ca website. NATIONAL estimates about 700 people participated in the
in-person events during Phase I of the CE program and approximately 600 attended during Phase
II, with the majority of participants self-identifying as living in the districts (11, 12 and 13)
closest to the Otter Lake landfill. For the online engagement component, participants completed
454 surveys, 291 quick polls and posted 95 comments in the discussion forums.
During the in-person and online engagement activities, NATIONAL used many diverse
opportunities for participants to have their say on various questions and concerns regarding the
Solid Waste Strategy Review – Final Report
Committee of the Whole Report - 59 - January 14, 2014
many implications of the system-wide review of solid waste management in HRM. NATIONAL
also conducted public opinion research through two surveys during the CE process. All of these
activities and approaches are detailed in the final CE report (Attachment C).
Early in the engagement planning process, representatives from NATIONAL met with the
Community Monitoring Committee (CMC) to discuss the overall engagement approach and how
CMC could best represent the communities closest to the existing landfill site. CMC provided
the engagement team written recommendations for community engagement that helped inform
the event design, location and timing of the town hall meetings and regional public sessions.
At all public events, CMC was provided an opportunity to speak and present information on the
history of the solid waste resource management strategy, siting of the landfill and the agreement
with the host community.
Despite widespread promotion and significant media coverage during the CE program,
NATIONAL was consistently challenged to raise general public interest in the matters related to
the solid waste strategy review and increase broad public participation at the engagement events.
Of those who attended regional public events (approximately 200 during Phase I and 175 during
Phase II), most identified themselves as having a direct interest in the Otter Lake Landfill
through either residential proximity or employment. A number of others indicated they had
historically been involved the development of the 1996 Solid Waste Resource Management
Strategy.
Generally, many of these participants were very vocal about their position on the options under
consideration within the strategy review, especially any options related to proposed changes at
the Otter Lake landfill site. As a result, NATIONAL adapted the CE program design in advance
of Phase II to help capture public feedback about the entire waste management system and the
diverse recommendations in the Stantec report as mandated by Regional Council.
The verbatim comments and quantitative survey results from the entire CE program are included
in NATIONAL’s final CE report (Attachment C). Key findings from the NATIONAL report are
included in the Consultation Feedback comments for each of the solid waste system components
examined in the Discussion section above.
ENVIRONMENTAL IMPLICATIONS
The above noted recommendations support and advance the following environmental goals:
Aligned with all Regional Council’s Environmental priorities
Reduces HRM’s GHG emissions and footprint
Development of landfill gas to energy project will produce a renewable power source
and reduce HRM’s power costs

Solid Waste Strategy Review – Final Report
Committee of the Whole Report - 60 - January 14, 2014
ALTERNATIVES
Organics
Maintain status quo; make no changes to existing program or infrastructure. This will not
meet capacity requirements or regulatory requirements. Not recommended.
Do not make amendments to By-law S-600 in terms of revised organics collection
measures, mandated kraft paper bags for separate leaf and yard waste collection, banning
grass clippings for collection. Not recommended.
Residual Waste / Garbage
Maintain status quo, do not mandate clear bags or a bag limit reduction. Not
recommended.
Incorporate private investment property complexes into the residential collection region.
Not supported unless other program savings and cost avoidance measures fund the
additional $5million program cost.
Do not amend By-law S-600 to repeal flow control of residual waste/garbage generated
within HRM. Not recommended.
Increase tip fees without repealing flow control which will transfer this new higher
service cost to businesses. Not recommended.
Do not increase landfill tip fee. HRM would continue to subsidize ICI sector for waste
processing and landfill costs. Not recommended. If flow control were removed, the
increased tip fee will act as the incentive for waste materials to be delivered to other sites,
saving Otter Lake capacity and improving system fiscal performance. Finally, increasing
tip fee will continue to encourage increased effort to divert organics and recyclables from
the waste stream.
Household Special Handling Waste
Maintain the status quo, do not increase to a second depot or increase mobile events. Not
recommended.
Maintain one depot but increase to 16 district mobiles per year. This option will cost less
than the equivalent of a second permanent deport.
FEP/WSF
Maintain the status quo; do not modify the operating model to reflect tonnage reductions
and waste stream changes at Otter Lake. Not recommended
Otter Lake
Maintain status quo, do nothing. Requires the immediate approval to commence siting a
new landfill. This will require budgeting $100 million dollars to pay for the development
of the new site. This cost would be spread across the next ten years, adding $10 Million

Solid Waste Strategy Review – Final Report
Committee of the Whole Report - 61 - January 14, 2014
capital yearly. Not recommended.
Continue to use Otter Lake until it reaches capacity and then enter into agreements with
neighboring landfill sites to receive HRM waste. Not recommended.
Continue to use Otter Lake until it reaches capacity and explore alternative technology
options and if a viable option presents a practical alternative, negotiate an agreement for
receipt of HRM residual wastes. Not recommended.
ATTACHMENTS
Attachment A – Stantec Waste Resource Strategy Update Report – January 2013
Attachment B – SNC Lavalin Peer Review of the January 2013 Stantec Report ‘Waste Resource
Strategy Update’ – April 2013
Attachment C – NATIONAL Public Relations Final Report – December 2013
Attachment D – IPOANS Letter
Attachment E – Canadian Restaurant and Food Services Association (CRFSA)
Attachment F – Waste Management Letter
Attachment G – Miller Waste Systems Letter
Attachment H – Other City Comparative Matrix
Attachment I – Financials Table
Attachment J – 5July96 SWRAC Report
Attachment K – HRM Briefing Session – Fundamental Beliefs of HRM
Appendices
Appendix 1 – Flow Control
Appendix 2 – Cost of Integrating Investment Properties into Residential Collection Regime
Appendix 3 – Clear Bag Program Data
Appendix 4 - ICI Mass Balance Breakdown
Appendix 5 – Evolution of Costs of Residual Garbage
Appendix 6 – System Performance Report Card and Diversion Pie Charts
Appendix 7 – Functional Analysis of the FEP/WSF
Appendix 8 - Cell Increase in Height Implications
____________________________________________________________________________
A copy of this report can be obtained online at http://www.halifax.ca/council/agendasc/cagenda.html then choose the appropriate
meeting date, or by contacting the Office of the Municipal Clerk at 490-4210, or Fax 490-4208.
Report Prepared by: Gord Helm, Manager, Solid Waste Resources, 490-6606
Financial Approval by: ___________________________________________________
Greg Keefe, Director of Finance & ICT/CFO, 490-6308
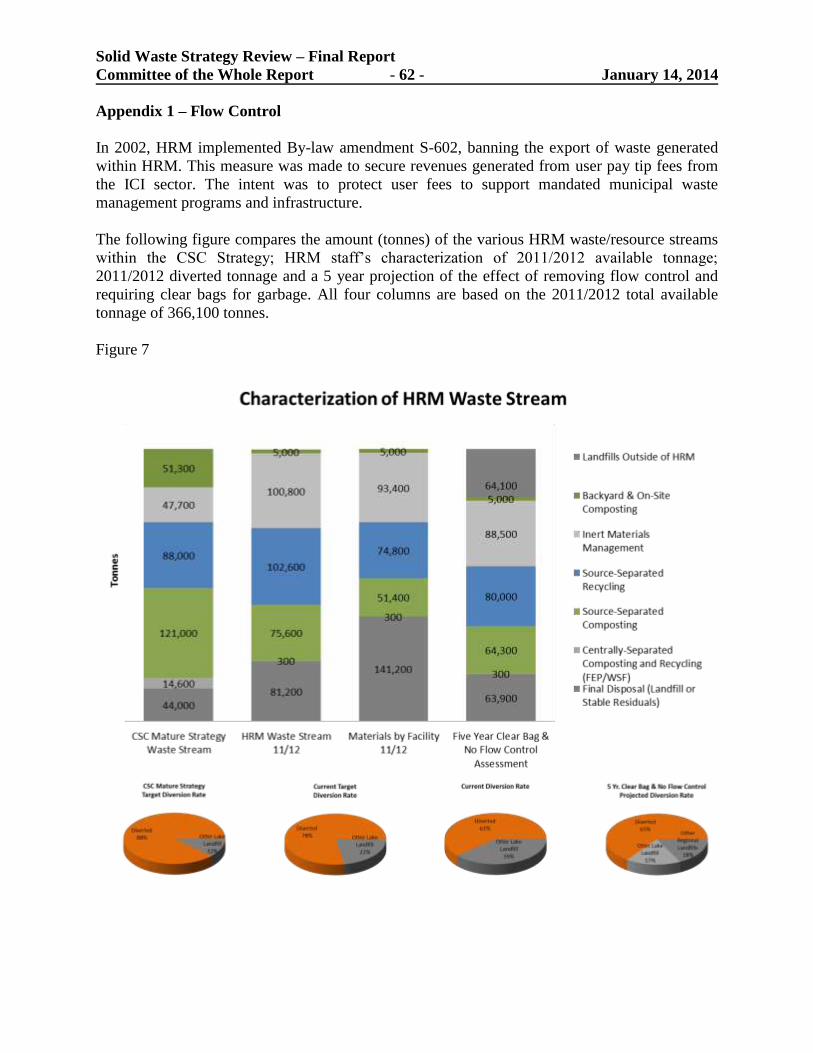
Solid Waste Strategy Review – Final Report
Committee of the Whole Report - 62 - January 14, 2014
Appendix 1 – Flow Control
In 2002, HRM implemented By-law amendment S-602, banning the export of waste generated
within HRM. This measure was made to secure revenues generated from user pay tip fees from
the ICI sector. The intent was to protect user fees to support mandated municipal waste
management programs and infrastructure.
The following figure compares the amount (tonnes) of the various HRM waste/resource streams
within the CSC Strategy; HRM staff’s characterization of 2011/2012 available tonnage;
2011/2012 diverted tonnage and a 5 year projection of the effect of removing flow control and
requiring clear bags for garbage. All four columns are based on the 2011/2012 total available
tonnage of 366,100 tonnes.
Figure 7

Solid Waste Strategy Review – Final Report
Committee of the Whole Report - 63 - January 14, 2014
The CSC’s original system estimate of HRM’s waste stream identified 172,300 tonnes of
organics, plus what would have been diverted through the FEP/WSF. Waste characterization
studies estimate that number to be closer to 81,000 tonnes. Those characterization studies also
estimate there is more inert and recyclable material available to divert than the original Strategy
estimates. The third column from the left shows the breakdown of waste materials in terms of
delivery to HRM facilities. This provides a realistic comparison to the original estimates of
stream makeup of the first column. The final column provides an estimate of the effect of
eliminating flow control for ICI residual waste (garbage) and By-law changes reducing bag
limits and requiring garbage be placed in clear bags. As shown, HRM diversion improves from
61% to 65%.
HRM’s current cost per tonne for landfill operations is $170.00 based on construction and
operations at of Cell 6. This is based on smoothed future costs of developing Cells 7, 8 & 9 over
the next 10 years. This cost/tonne assumes an average of 140,000 tonnes per year of waste
materials being delivered to Otter Lake. Based on program pressures and fiscal requirements to
sustain program costs, HRM tip fees should be raised to $170.00/tonne to reflect actual landfill
costs. This cost will impact the HRM business community as a flow through service cost
increase from haulers to businesses.
Eliminating flow control will reduce waste delivered to Otter Lake landfill which will extend the
life of cells. For example, if flow control were eliminated and if 60% of ICI waste being
delivered to other landfill sites in the region, HRM would benefit from a two year delay in
developing cell 7. See the figures below which show the delay in construction and fill dates for
future cells based on scaled percentage reduction in tonnage delivered to HRM’s landfill.

Solid Waste Strategy Review – Final Report
Committee of the Whole Report - 64 - January 14, 2014
Figure 8
Figure 9

Solid Waste Strategy Review – Final Report
Committee of the Whole Report - 65 - January 14, 2014
This reduction in delivered waste enables amortization of future cells over a longer period of
time reducing capital budget pressures. To be clear, this is not reducing system costs, cells still
cost the same, but their operational life is extended through reduced tonnage being delivered
annually. This aligns with the CSC Strategy vision of reducing system costs through diversion
from landfill.
Flow Control Opportunity Analysis
The following three tables illustrate cost analysis showing reduced revenues due to lost tip fees.
However, the tables show the offsetting system costs balance in terms of cost avoidance from
delaying cell construction and the corresponding extended amortization of capital costs. The
subsequent three tables show current status quo costs with cell 6 constructed (Table 16), reduced
tonnage due to flow control elimination and corresponding cell life extension (Table 17), and a
similar assessment as table two but using construction of cell 7, currently scheduled for the
2015/16 capital construction season (Table 18).
Table 16
STATUS QUO
Tonnage Band
134,240 and
137,239
131,240 and
134,239
128,240 and
131,239
Cost Per Tonne Review Cell 613/14 14/15 15/16 Average
Operating Cost Per Tonne 102$ 106$ 109$ 106$
Capital Cost Per Tonne - Cell 48$ 48$ 48$ 48$
Capital Cost Per Tonne - Equipment 12$ 12$ 12$ 12$
Perpetutal Care 2$ 2$ 2$ 2$
Total Cost per Tonne 164$ 168$ 171$ 168$
Variable Costs Cell 6
Per Tonne Savings Cost 13/14 14/15 15/16 Average
Operating Cost Per Tonne 59$ 60$ 62$ 60$
Capital Cost Per Tonne - Cell 48$ 48$ 48$ 48$
Capital Cost Per Tonne - Equipment 12$ 12$ 12$ 12$
Perpetutal Care
Total Variable Cost per Tonne 119$ 120$ 122$ 120$
Fixed Costs cell 6
Per Tonne Savings Cost 13/14 14/15 15/16 Average
Operating Cost Per Tonne 43$ 45$ 47$ 45$
Capital Cost Per Tonne - Cell
Capital Cost Per Tonne - Equipment
Perpetutal Care 2$ 2$ 2$ 2$
Total Fixed Cost per Tonne 45$ 47$ 49$ 47$
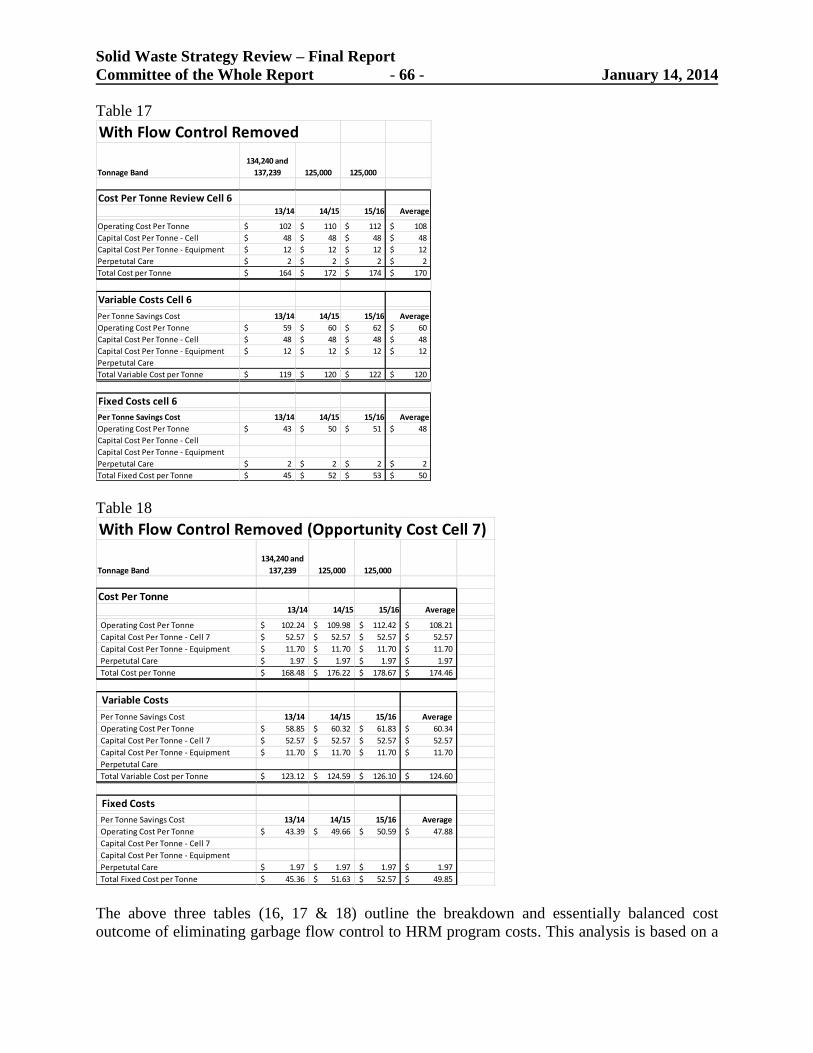
Solid Waste Strategy Review – Final Report
Committee of the Whole Report - 66 - January 14, 2014
Table 17
With Flow Control Removed
Tonnage Band
134,240 and
137,239 125,000 125,000
Cost Per Tonne Review Cell 613/14 14/15 15/16 Average
Operating Cost Per Tonne 102$ 110$ 112$ 108$
Capital Cost Per Tonne - Cell 48$ 48$ 48$ 48$
Capital Cost Per Tonne - Equipment 12$ 12$ 12$ 12$
Perpetutal Care 2$ 2$ 2$ 2$
Total Cost per Tonne 164$ 172$ 174$ 170$
Variable Costs Cell 6
Per Tonne Savings Cost 13/14 14/15 15/16 Average
Operating Cost Per Tonne 59$ 60$ 62$ 60$
Capital Cost Per Tonne - Cell 48$ 48$ 48$ 48$
Capital Cost Per Tonne - Equipment 12$ 12$ 12$ 12$
Perpetutal Care
Total Variable Cost per Tonne 119$ 120$ 122$ 120$
Fixed Costs cell 6
Per Tonne Savings Cost 13/14 14/15 15/16 Average
Operating Cost Per Tonne 43$ 50$ 51$ 48$
Capital Cost Per Tonne - Cell
Capital Cost Per Tonne - Equipment
Perpetutal Care 2$ 2$ 2$ 2$
Total Fixed Cost per Tonne 45$ 52$ 53$ 50$
Table 18
With Flow Control Removed (Opportunity Cost Cell 7)
Tonnage Band
134,240 and
137,239 125,000 125,000
Cost Per Tonne13/14 14/15 15/16 Average
Operating Cost Per Tonne 102.24$ 109.98$ 112.42$ 108.21$
Capital Cost Per Tonne - Cell 7 52.57$ 52.57$ 52.57$ 52.57$
Capital Cost Per Tonne - Equipment 11.70$ 11.70$ 11.70$ 11.70$
Perpetutal Care 1.97$ 1.97$ 1.97$ 1.97$
Total Cost per Tonne 168.48$ 176.22$ 178.67$ 174.46$
Variable Costs
Per Tonne Savings Cost 13/14 14/15 15/16 Average
Operating Cost Per Tonne 58.85$ 60.32$ 61.83$ 60.34$
Capital Cost Per Tonne - Cell 7 52.57$ 52.57$ 52.57$ 52.57$
Capital Cost Per Tonne - Equipment 11.70$ 11.70$ 11.70$ 11.70$
Perpetutal Care
Total Variable Cost per Tonne 123.12$ 124.59$ 126.10$ 124.60$
Fixed Costs
Per Tonne Savings Cost 13/14 14/15 15/16 Average
Operating Cost Per Tonne 43.39$ 49.66$ 50.59$ 47.88$
Capital Cost Per Tonne - Cell 7
Capital Cost Per Tonne - Equipment
Perpetutal Care 1.97$ 1.97$ 1.97$ 1.97$
Total Fixed Cost per Tonne 45.36$ 51.63$ 52.57$ 49.85$
The above three tables (16, 17 & 18) outline the breakdown and essentially balanced cost
outcome of eliminating garbage flow control to HRM program costs. This analysis is based on a
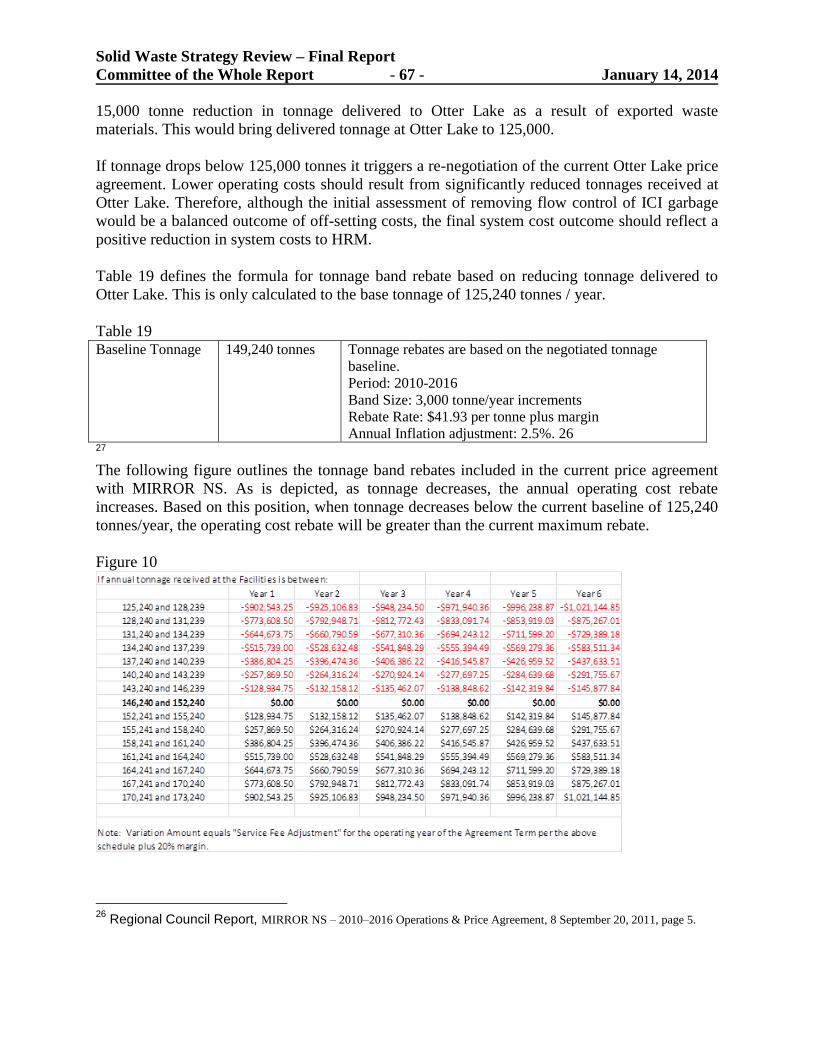
Solid Waste Strategy Review – Final Report
Committee of the Whole Report - 67 - January 14, 2014
15,000 tonne reduction in tonnage delivered to Otter Lake as a result of exported waste
materials. This would bring delivered tonnage at Otter Lake to 125,000.
If tonnage drops below 125,000 tonnes it triggers a re-negotiation of the current Otter Lake price
agreement. Lower operating costs should result from significantly reduced tonnages received at
Otter Lake. Therefore, although the initial assessment of removing flow control of ICI garbage
would be a balanced outcome of off-setting costs, the final system cost outcome should reflect a
positive reduction in system costs to HRM.
Table 19 defines the formula for tonnage band rebate based on reducing tonnage delivered to
Otter Lake. This is only calculated to the base tonnage of 125,240 tonnes / year.
Table 19 Baseline Tonnage 149,240 tonnes Tonnage rebates are based on the negotiated tonnage
baseline.
Period: 2010-2016
Band Size: 3,000 tonne/year increments
Rebate Rate: $41.93 per tonne plus margin
Annual Inflation adjustment: 2.5%. 26 27 The following figure outlines the tonnage band rebates included in the current price agreement
with MIRROR NS. As is depicted, as tonnage decreases, the annual operating cost rebate
increases. Based on this position, when tonnage decreases below the current baseline of 125,240
tonnes/year, the operating cost rebate will be greater than the current maximum rebate.
Figure 10
26
Regional Council Report, MIRROR NS – 2010–2016 Operations & Price Agreement, 8 September 20, 2011, page 5.

Solid Waste Strategy Review – Final Report
Committee of the Whole Report - 68 - January 14, 2014
Elimination of flow control on ICI garbage affects waste service costs across the entire ICI and
business community. Reduced service costs for HRM businesses are a positive economic
outcome. This also supports free market competition for haulers delivering waste to landfills
outside HRM at lower tip fee rates.
The table below shows tip fees promulgated for the four closest landfills within practical
transportation distances from HRM. Of note, tip fees are in fact negotiable depending on the
quantity of materials a hauler intends to deliver. Therefore, promulgated tip fees would reflect a
cost higher than a lower negotiated cost based on planned deliveries.
Table 20
Name of
Landfill
Distance fm
HRM
Time to
Travel
Tip Fee
(Promulgated)
X
$4.85/km/20
tonnes
Total
Cost/Tonne
Chester 72 km 47 min $79.36 $17.46 $96.82
West Hants 86 km 63 min $65.00 $20.86 $85.86
Cumberland 137 km 92 min $165.00 $45.48 $210.48
Queens 151 km 96 min $79.17 $36.62 115.78
Figure 11 below shows the five closest landfills to HRM.
Solid Waste Strategy Review – Final Report
Committee of the Whole Report - 69 - January 14, 2014
*Currently Colchester does not accept garbage from outside in the agreement they have with
their host community. They will accept C&D, recyclables and other specials waste.
Adjacent regional landfills have confirmed that they would be more than willing to accept ICI
waste generated within HRM.
Fundamental Principles of HRM Program (Attachment K)
In the May 28, 2002, report to Regional Council recommending the restriction of the export of
solid waste material generated within HRM, there is the following statement: “a policy statement
that was included in the early development of the Integrated Solid Waste Resource Management
Strategy – “Stewardship – We Manage the Materials We Generate.”
This position is based on an HRM Council Memorandum dated 14 February, 1996, Proposed
Work Plan for Halifax Regional Municipality Solid Waste/Resource Management Strategy,
Attachment K, Fundamental Beliefs of HRM related to the approval in principle of the CSC
Strategy, which outlines:
Regarding Community Principles:
1. That we {HRM} intend to deal with all aspects of the solid waste/resource stream
within our jurisdiction through the Strategy; and that,
2. Communities’ issues such as competitiveness for existing businesses and
facilities; and,
3. Employment security for existing system employees; and,
4. Traffic issues, tipping fee policy and a regulatory environment consistent with
protecting the taxpayer base from adverse implications are essential; and,
5. That the system represents a cost efficient approach to this high standard of
environmental protection.
The management of materials within HRM boundaries was not intended to adversely affect
taxpayers and the business community in terms of higher system costs and service costs. This
system outcome is contrary to the intent of the outlined “Community Principles”.
The principle of “dealing with all aspects of the solid waste/resource stream within our
jurisdiction through the Strategy” enables the judicious reservation of landfill capacity and the
corresponding protection of the physical environment from reducing cell use. All landfills within
NS are governed by the same legislative environmental safety standards as is HRM’s landfill.
Therefore, since the material would only be delivered to NSE approved and permitted landfills,
there would be no reduction of environmental protection from using a landfill outside HRM.

Solid Waste Strategy Review – Final Report
Committee of the Whole Report - 70 - January 14, 2014
Appendix 2 – Cost of Integrating Private Investment Property Complexes into the
Residential Collection Regime
Compliance with By-law S-600 program guidelines is complicated in private investment
property complexes as a result of:
Environmental Living Factors
o Multiple floors to transport waste (easier to take 1 bag rather than multiple bags
and a bin that has to be taken back up and cleaned)
o Heavy doors (have heard this from seniors primarily)
o Locked doors (bins often in parking garage and if you don’t have a car, you don’t
have a key)
o Presence of waste chutes on every floor
o Security measures to control illegal dumping on their properties
o Lack of education from manager/landlord/SWR that separation is required and
how to do it
o Lack of storage space in the apartments for the material streams (garbage,
organics, blue bag, paper, cardboard)
o Inconsistent or lack of signage in the building directing tenants to the source-
separation areas/bins
o Lack of practical means of holding non-participants accountable
Demographic Factors
o Tenants (cost, work schedules, inconvenience etc.)
o Cultural and language barriers facing new Nova Scotians
o Seniors (didn’t grow up with program, find it confusing, scared of waste room
and use chutes exclusively)
o Single older working class men (don’t care – had someone else do it for them at
one time)
o Single moms/young children (perceived increased cost with purchase of many
coloured bags)

Solid Waste Strategy Review – Final Report
Committee of the Whole Report - 71 - January 14, 2014
o Students (apathy, perceived cost, not understanding how)
o International students/families (apathy/disinterest/awareness/understanding)
Figure 12 depict pie graphs illustrating apartment verses condo waste stream makeup. There are
different demographic groups in condos verses apartments. However, in terms of waste
generation, the expectation is that they would be similar.
Figure 12
The garbage, organics and recyclables breakdown for condominium units serviced under HRM’s
contract is as follows:
Tonnes per HRM Serviced Condo Unit
Table 21
Fiscal Garbage Organics Recyclables
12/13 0.293 0.40 0.089
11/12 0.26 0.04 0.08
10/11 0.27 0.05 0.08
09/10 0.3 0.05 0.1
The per serviced unit cost for collection of garbage, organics and recyclables as specified
in Tender No. 13-055 in the three collection areas is approximately $53.52 per serviced
unit per year.
New Program Cost – Assuming a similar per serviced unit cost as the Condos at $53.52
per serviced unit per year {there would also be additional HRM contract administrative
costs} for the estimated 50,942 apartment units (HRM Finance 2013 estimate) $53.52 x
50,942 = $2,726,416
There would be the loss of tip fees from these apartment units. The generation rates per
unit could be considered to be similar to Condo units so:
o 0.293 tonnes garbage per SU x 50,942 = 14,926 tonnes x $125 per tonne (current
tip fee) = $1,865,750 lost apartment tip fees

Solid Waste Strategy Review – Final Report
Committee of the Whole Report - 72 - January 14, 2014
0.293 tonnes garbage per SU x 50,942 = 14,926 tonnes x $170 per tonne
(recommended increased tip fee) = $2,537,420 lost apartment tip fees
o 0.040 tonnes organics per SU x 50,942 = 2,038 tonnes x $75 per tonne = $152,850
lost apartment tip fees
Total system cost to service 50,942 private investment property complex units is estimated at:
$2,726,416 (Collection Program Costs)
+ $1,865,750 (Lost ICI tip fees at Otter Lake)
+ $152,850 (Lost ICI Tip fees at Compost facilities)
= $4,745,016 (Annual integration cost at current tip fee rate)
Integrating private investment property complexes into the residential regime and putting them
under HRM service oversight and system monitoring would introduce the following:
Ensure such properties are provided with proper source separation program
infrastructure;
Ensure waste areas and bins meet by-law requirements for safety, access and
cleanliness through contract performance management and penalties;
Enable direct coordination with private investment property complex firms on waste
management initiatives to improve diversion;
Enhance perception that tenants are seen as residents the same as condo and single
house dwellers;
Improve staff access to and education of tenants;
Based on pilot project outcomes, would result in increased diversion; and
Reduce waste service costs for private investment property firms/owners.
Collection service would be based on a similar model to the existing contracts for condo service.
This would need to be established through an RFP process. The RFP would have to be developed
based on a geographical scan of existing units and properties and sub-divided into zones similar
to how the current residential and condo contracts are divided. This option may generate some
opposition from private sector haulers.
There would need to be a transition period while the investment properties dealt with existing
collection contracts. The increased scope of operations to manage, educate and monitor these
properties will also require additional staff resources.
Challenges to incorporating private investment property complexes:
Solid Waste Strategy Review – Final Report
Committee of the Whole Report - 73 - January 14, 2014
Budget impact and increased program costs ($4-6 Million/year)
Opposition from private sector haulers with existing contracts who may lose business;
Increases the number of condo-like serviced units six-fold (adding 50,942 units to
8,545 condo units currently serviced);
Creating a contract and service structure that can accommodate the varied needs, size
and configuration of the private investment property complexes;
Scoping out the service requirements;
Creating the database of private investment property complexes to service;
Protecting against mixing ICI loads with private investment property complexes
loads;
Illegal dumping at private investment property complex sites;
Load contamination of waste streams;
Diversion expectations; and,
Risk of poor implementation or decreased service satisfaction from tenants and
private investment property complex firms.
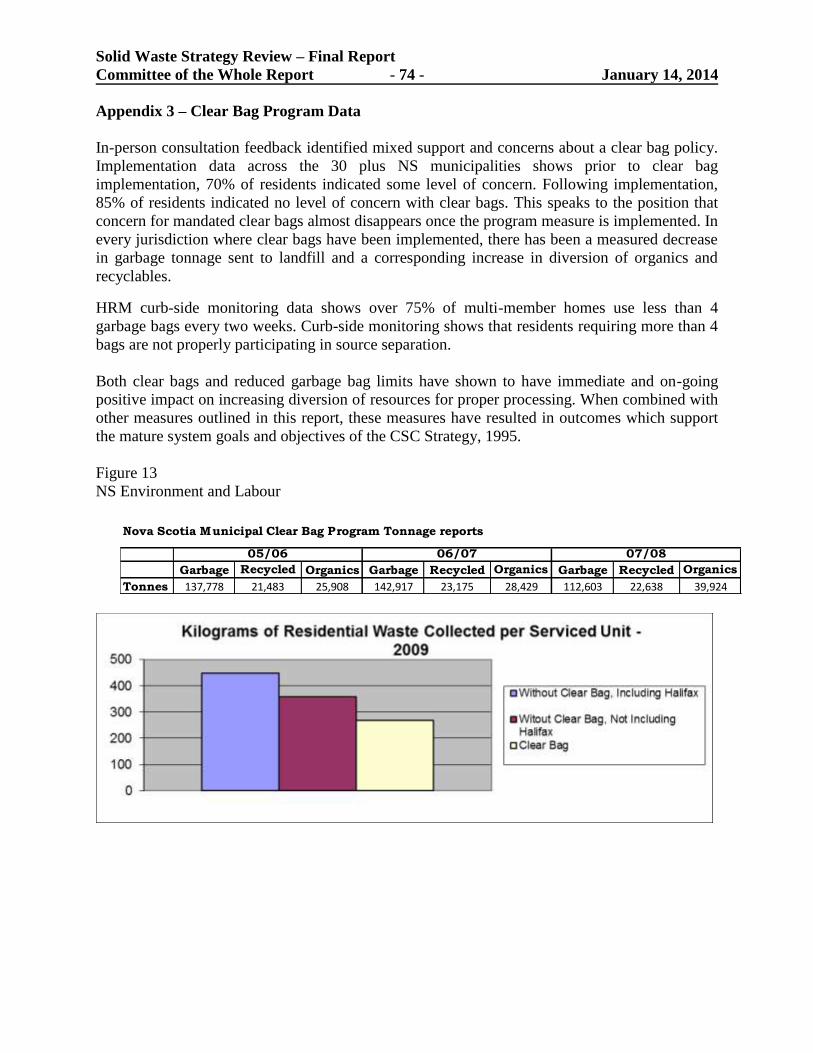
Solid Waste Strategy Review – Final Report
Committee of the Whole Report - 74 - January 14, 2014
Appendix 3 – Clear Bag Program Data
In-person consultation feedback identified mixed support and concerns about a clear bag policy.
Implementation data across the 30 plus NS municipalities shows prior to clear bag
implementation, 70% of residents indicated some level of concern. Following implementation,
85% of residents indicated no level of concern with clear bags. This speaks to the position that
concern for mandated clear bags almost disappears once the program measure is implemented. In
every jurisdiction where clear bags have been implemented, there has been a measured decrease
in garbage tonnage sent to landfill and a corresponding increase in diversion of organics and
recyclables.
HRM curb-side monitoring data shows over 75% of multi-member homes use less than 4
garbage bags every two weeks. Curb-side monitoring shows that residents requiring more than 4
bags are not properly participating in source separation.
Both clear bags and reduced garbage bag limits have shown to have immediate and on-going
positive impact on increasing diversion of resources for proper processing. When combined with
other measures outlined in this report, these measures have resulted in outcomes which support
the mature system goals and objectives of the CSC Strategy, 1995.
Figure 13
NS Environment and Labour
Nova Scotia Municipal Clear Bag Program Tonnage reports
Garbage Recycled Organics Garbage Recycled Organics Garbage Recycled Organics
Tonnes 137,778 21,483 25,908 142,917 23,175 28,429 112,603 22,638 39,924
05/06 06/07 07/08

Solid Waste Strategy Review – Final Report
Committee of the Whole Report - 75 - January 14, 2014
Table 22 - Other Jurisdiction Clear Bag Program Statistics and Outcomes
Region Clear Bag
Implemented
1st Year Garbage
Reduction
1st Year
Organic
Increase
1st Year
Recycling
Increase
Pictou/Antigonish 2005 26% 13% 16%
Valley Waste 2008 16% 10% 18%
CBRM 2010 6% 4% 8%
Markham, ON 2013 Residential diversion increased from 72% to 81%
Summary of HRM staff Clear Bag/Mini-Bin Pilot for IPOANS 2012
At the request of IPOANS members in 2012 SWR staff conducted a pilot project assessing the
impacts of clear bags for garbage and organics mini bins in apartment units.
The project included buildings of various sizes throughout Halifax and Dartmouth that were
confirmed to house tenants of various demographics, included students, newcomers, and seniors.
Some buildings were provided with a year’s supply of clear bags for garbage, some were given
mini bins for each unit, and some received both.
SWR educators conducted waste audits before starting the pilot to determine the percentage of
unacceptable waste currently found in the garbage stream. This is different from diversion rate
which is a very different statistic.
Table 23
Location Pilot
Divertible
Waste in
Garbage
Start
Divertible
Waste in
Garbage
Final Change
3 Fernhill Rd, Dartmouth CB/GB 65 23 -42
830 McLean St., Halifax CB/GB 66 35 -31
Mont Blanc Terrace, Halifax CB/GB 58 31 -27
1119 Tower Rd. Halifax GB 69 43 -26
4 Lakefront Dr. Dartmouth CB 48 32 -16
149 Albro Lake Rd.,
Dartmouth CB 60 59 -1
18 Crown Dr., Halifax CB 47 59 12
6957 Mumford Rd., Halifax CB 42 58 16
7 Parker St., Dartmouth CB 61 80 19
Six of the nine properties that finished the project experienced a positive impact from the
implementation of clear bags and/or organics containers. The top three performers had both
provided to them, followed by the organics mini bin-only property and two buildings that had

Solid Waste Strategy Review – Final Report
Committee of the Whole Report - 76 - January 14, 2014
just clear bags. The bottom three buildings also had clear bags only provided to them. The data
supports the complementary combination of clear bags for garbage and provision of organics
bins in each unit as having a positive impact on proper source separation.
Statistical data and operational experience in jurisdictions across NS and other municipalities in
Canada confirm clear bags, reduced bag limits and pro-active education, monitoring and
compliance measures, supported by effective policy increases diversion and improves source
separation.
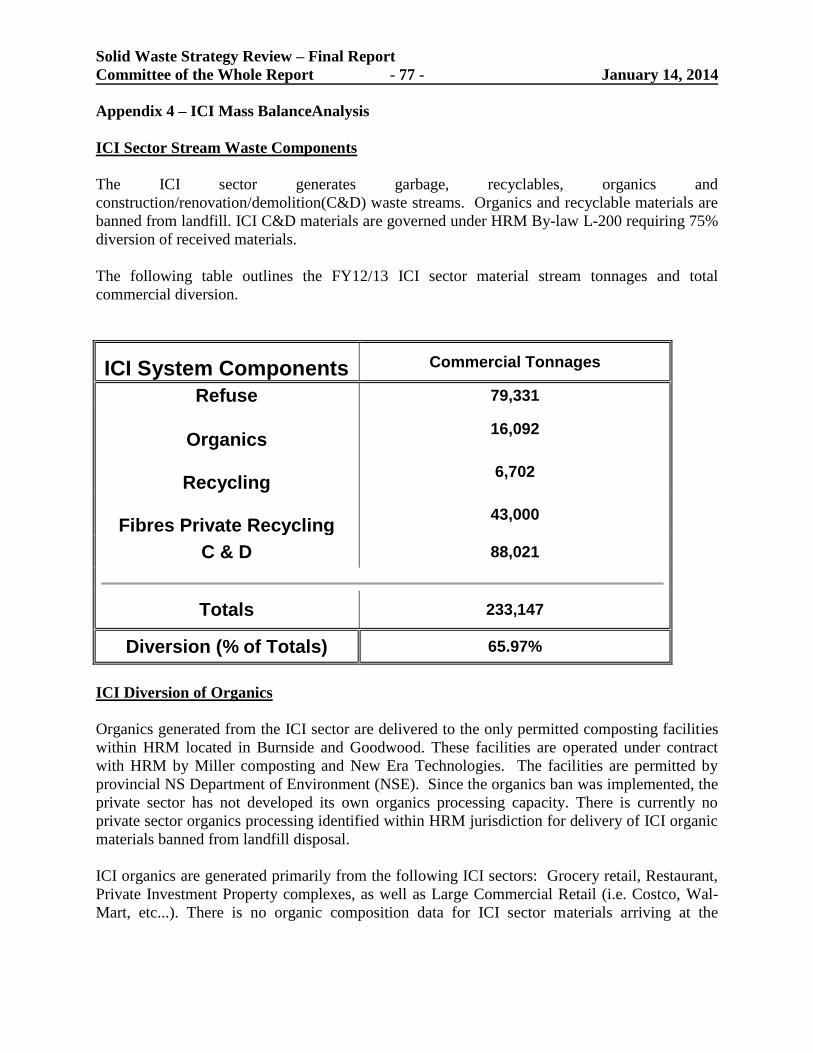
Solid Waste Strategy Review – Final Report
Committee of the Whole Report - 77 - January 14, 2014
Appendix 4 – ICI Mass BalanceAnalysis
ICI Sector Stream Waste Components
The ICI sector generates garbage, recyclables, organics and
construction/renovation/demolition(C&D) waste streams. Organics and recyclable materials are
banned from landfill. ICI C&D materials are governed under HRM By-law L-200 requiring 75%
diversion of received materials.
The following table outlines the FY12/13 ICI sector material stream tonnages and total
commercial diversion.
ICI System Components Commercial Tonnages
Refuse 79,331
Organics
16,092
Recycling
6,702
Fibres Private Recycling
43,000
C & D 88,021
Totals 233,147
Diversion (% of Totals) 65.97%
ICI Diversion of Organics
Organics generated from the ICI sector are delivered to the only permitted composting facilities
within HRM located in Burnside and Goodwood. These facilities are operated under contract
with HRM by Miller composting and New Era Technologies. The facilities are permitted by
provincial NS Department of Environment (NSE). Since the organics ban was implemented, the
private sector has not developed its own organics processing capacity. There is currently no
private sector organics processing identified within HRM jurisdiction for delivery of ICI organic
materials banned from landfill disposal.
ICI organics are generated primarily from the following ICI sectors: Grocery retail, Restaurant,
Private Investment Property complexes, as well as Large Commercial Retail (i.e. Costco, Wal-
Mart, etc...). There is no organic composition data for ICI sector materials arriving at the

Solid Waste Strategy Review – Final Report
Committee of the Whole Report - 78 - January 14, 2014
compost plants as a result of the service model where collections occur at various locations prior
to delivery.
ICI sector organics are scaled and recorded as commercially generated tonnes. In 12/13 there
were 16,092 tonnes of ICI organics delivered. Apartments are considered similar to condo units
in terms of generation rates. There are 50,900 apartment units in HRM. Based on condo data,
organics generation from the private investment properties in the ICI sector is estimated to be
2,036 tonnes.
The ICI sector organics composition is described as primarily wet food waste residue that is
nitrogen rich requiring extensive processing. The costs for processing ICI organics are currently
not reflected in the tipping fee regime in HRM. HRM organics system costs are approximately
$160.00/tonne. The tip fee set for the two organics facilities is $75.00. This equates to a loss of
revenues of $1,367,990. This subsidization was established to encourage source separation and
diversion from landfill. The tip fee at the landfill is set at $125.00/tonne.
When the organics plants were designed in 1999, the inclusion of ICI organics for processing
was envisioned as part of the HRM Waste Management Strategy by way of the “put or pay”
clause in the facility agreements. HRM guarantees delivery of a minimum quantity to each
facility annually (20,000 tonnes) and inclusion of ICI is recognized as enabling the “put” to be
met. The subsidized tip fee remains an initiative to drive organics diversion to these facilities.
ICI Recyclables Diversion
For the past 20 years, there have been 2 primary fibre processors in HRM receiving upwards of
43,000 tonnes of corrugated cardboard and other paper. Recyclables processed by the private
sector is driven by market demand and commodity pricing and material can move freely in the
marketplace in NS.
In 12/13 the HRM MRF received 6,702 tonnes of ICI blue bag recyclables and lower grade
paper. This represented 27% of the total incoming tonnes received at the HRM Recycling Plant.
Over the years, the quantity of ICI materials received has fluctuated. ICI recycling tonnage
represents an average of 15–30% of total incoming tonnage annually. HRM’s strategy originally
contemplated the inclusion of private sector processors. The HRM MRF plant does not have the
capacity to process all ICI fiber tonnages. To date, HRM has not charged a tip fee for ICI sector
recyclables processing.
MRF operating costs, all in, fluctuate based on market pricing for recyclables and range from
$15-$54/tonne. If HRM charged a tip fee, based on annual tonnage of 6,700 tonnes, revenues
would be:
o $25.00 tip fee = $167,500.00
o $50.00 tip fee = $335,000.00

Solid Waste Strategy Review – Final Report
Committee of the Whole Report - 79 - January 14, 2014
ICI C&D Diversion
C&D materials represent the largest factor in ICI materials diversion at 57% of the total ICI
materials diverted away from HRM landfill. ICI C&D materials are governed by HRM By-law
L-200 and provincial regulations. Under L-200, licensed C&D facilities are required to divert a
minimum 75% of incoming materials away from landfill disposal.
Figure 14 shows HRM C&D Waste stream flows from 2007/08 to present. In 12/13, the private
C&D operational facilities (transfer and processing sites) received 88,021 tonnes of C&D and
disposed of 22,894 tonnes in the C&D landfill, with the remainder 65,127 tonnes of materials
being recycled and re-used.
Figure 14
The 88,021 tonnes of ICI C&D material is diverted away from HRM Otter Lake landfill. The
22,894 tonnes (26%) was disposed of in a private C&D landfill site within HRM. HRM is the
only N.S municipality with a C&D strategy, which includes a licensing regime mandating targets
for recycling C&D materials otherwise destined for landfill disposal.
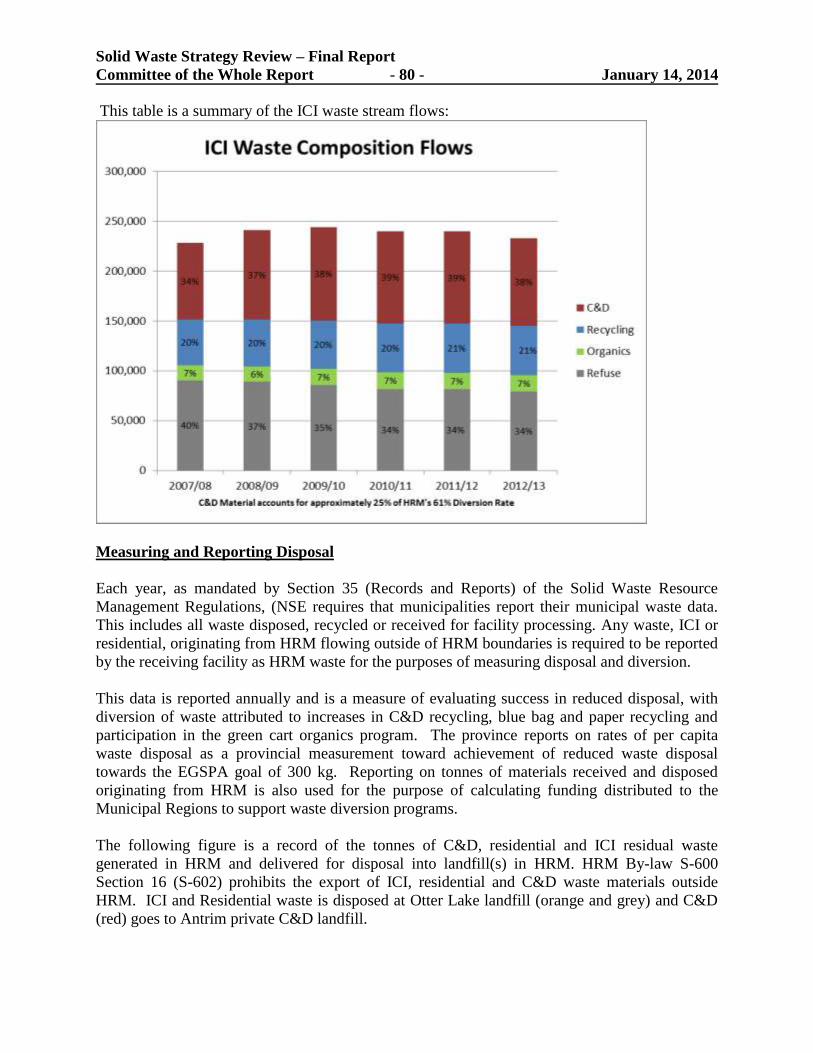
Solid Waste Strategy Review – Final Report
Committee of the Whole Report - 80 - January 14, 2014
This table is a summary of the ICI waste stream flows:
Measuring and Reporting Disposal
Each year, as mandated by Section 35 (Records and Reports) of the Solid Waste Resource
Management Regulations, (NSE requires that municipalities report their municipal waste data.
This includes all waste disposed, recycled or received for facility processing. Any waste, ICI or
residential, originating from HRM flowing outside of HRM boundaries is required to be reported
by the receiving facility as HRM waste for the purposes of measuring disposal and diversion.
This data is reported annually and is a measure of evaluating success in reduced disposal, with
diversion of waste attributed to increases in C&D recycling, blue bag and paper recycling and
participation in the green cart organics program. The province reports on rates of per capita
waste disposal as a provincial measurement toward achievement of reduced waste disposal
towards the EGSPA goal of 300 kg. Reporting on tonnes of materials received and disposed
originating from HRM is also used for the purpose of calculating funding distributed to the
Municipal Regions to support waste diversion programs.
The following figure is a record of the tonnes of C&D, residential and ICI residual waste
generated in HRM and delivered for disposal into landfill(s) in HRM. HRM By-law S-600
Section 16 (S-602) prohibits the export of ICI, residential and C&D waste materials outside
HRM. ICI and Residential waste is disposed at Otter Lake landfill (orange and grey) and C&D
(red) goes to Antrim private C&D landfill.

Solid Waste Strategy Review – Final Report
Committee of the Whole Report - 81 - January 14, 2014
HRM NSE reported waste kilograms per capita disposed is calculated and noted in this table:
The Provincial Funding agency, the Resource Recovery Fund Board (RRFB) , created by the
Province of NS, channels funding from product levies and product stewardship programs to help
support municipal waste diversion programs. These are referred to as Diversion Credits issued
to municipal Regions based on the quantity of tonnes diverted away from disposal. While the
total value of available funding from RRFB has been declining, associated with the current
RRFB operating model, HRM revenues are linked to tonnage diverted from landfill.

Solid Waste Strategy Review – Final Report
Committee of the Whole Report - 82 - January 14, 2014
Allowing the export of residual waste/.garbage will not adversely affect HRM’s diversion.
Residual waste tonnage delivered to other than Otter Lake landfills will continue to be assigned
to HRM. However, the new measures implemented by HRM as outlined in this report should
result in improved diversion and compliance. This will increase HRM diversion and increase
diversion credit revenues.

Solid Waste Strategy Review – Final Report
Committee of the Whole Report - 83 - January 14, 2014
Appendix 5 - Evolution of Costs of Residual Garbage
This table shows 1996/97 and comparison to inflated costs based on CPI to 2012 which were
used to develop the cost analysis for this report.
Table 25
Cost per Tonne
Tonnes Total Estimated Cost
1996/1997 Integrated Waste Resource Mgmt. Strategy Report (Low Range)
$66.78 250,000 $16,694,500
Inflation Adjusted to 2012 @ Canada CPI (Low Range) $91.42 250,000 $22,854,001
1996/1997 Integrated Waste Resource Mgmt. Strategy Report (High Range)
$87.80 250,000 $21,950,500
Inflation Adjusted to 2012 @ Canada CPI (High Range) $120.20 250,000 $30,049,222
1996 Revised Integrated Waste Resource Mgmt. Strategy Report
$116.62 262,400 $30,600,000
Inflation Adjusted to 2012 @ Canada CPI $159.64 262,400 $41,889,989
Actual Operating and Reserve Transfer (Capital) Cost 2012/13
$201.28 270,598 $54,465,625
Figure 16 shows just the landfill costs per tonne. Figure 17 shows the comparison, low to high,
of the initial assessed system costs, the revised plan system cost estimates and the current system
costs based on the annual tonnages used to make the assessment back in 1996 in a cost per tonne
comparison.
Figure 16
Figure 17 shows the comparison in terms of total system costs.
Figure 17

Solid Waste Strategy Review – Final Report
Committee of the Whole Report - 84 - January 14, 2014
This data illustrates that both in cost per tonne or total system costs, the revised ISWMS 1997
plan resulted in system costs much higher than anticipated and an outcome opposite to the CSC
Strategy vision.
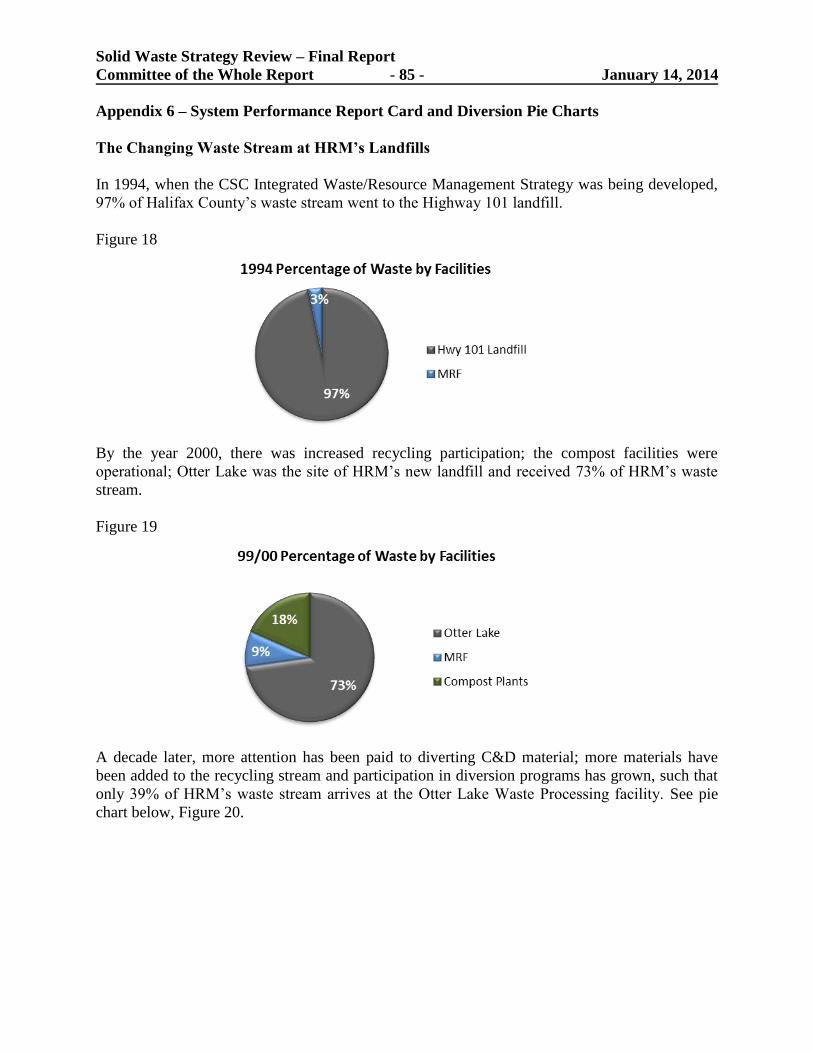
Solid Waste Strategy Review – Final Report
Committee of the Whole Report - 85 - January 14, 2014
Appendix 6 – System Performance Report Card and Diversion Pie Charts
The Changing Waste Stream at HRM’s Landfills
In 1994, when the CSC Integrated Waste/Resource Management Strategy was being developed,
97% of Halifax County’s waste stream went to the Highway 101 landfill.
Figure 18
By the year 2000, there was increased recycling participation; the compost facilities were
operational; Otter Lake was the site of HRM’s new landfill and received 73% of HRM’s waste
stream.
Figure 19
A decade later, more attention has been paid to diverting C&D material; more materials have
been added to the recycling stream and participation in diversion programs has grown, such that
only 39% of HRM’s waste stream arrives at the Otter Lake Waste Processing facility. See pie
chart below, Figure 20.

Solid Waste Strategy Review – Final Report
Committee of the Whole Report - 86 - January 14, 2014
Figure 20
As you can see, over the years, HRM’s waste has changed from a waste stream to a
waste/resource stream, with the resources funneled off to their appropriate processing facilities.
Figure 21
However, as noted below, there is still more work to be done. 40% of the material that are
delivered to the Otter Lake site A facility should have been source separated and delivered to
other processing facilities.

Solid Waste Strategy Review – Final Report
Committee of the Whole Report - 87 - January 14, 2014
Figure 22

Solid Waste Strategy Review – Final Report
Committee of the Whole Report - 88 - January 14, 2014
Appendix 7 – Functional Analysis of the FEP/WSF
System Functionality Analysis of the FEP/WSF
The contract with MIRROR NS included the design, construction and operational plan for Otter
Lake, for which Provincial approval was required. There is no legislative requirement for the
FEP or WSF and no other landfill in the province or which can be identified in Canada, uses
similar machine processing prior to disposal. In fact, as MIRROR NS noted when they submitted
the revised 1997 plan to Regional Council, they were unable to identify any other facility in the
world which used machine processing prior to disposal in a landfill.28 Stantec confirmed in their
report that they were unable to identify another facility utilizing a similar operating model.
The MIRROR contract stipulates that all putrescible organics must be stabilized in the WSF prior
to being placed in the landfill. Statistical data analysis by both CBCL and SNC Lavalin, as
outlined in Figure 23 below, shows that a third of the putrescible organics currently arriving at
the landfill do not go through the WSF.
Figure 23
Component Percentage Component Percentage
Organic Material 66% Organic Material 18%
Other Material 34% Other Material 82%
Total 100% Total 100%
Component Percentage Tonnes Component Percentage Tonnes
Organic Material 66% 16,600 Organic Material 18% 25,000
Other Material 34% 8,500 Other Material 82% 114,300
Total 100% 25,100 Total 100% 139,300
Organic Component Percentage Tonnes Component Percentage Tonnes
Food Waste 14% 19,400 Organic Material 66% 16,600
Yard Waste & Boxboard 4% 5,600 Other Material 34% 8,500
Total 18% 25,000 Total 100% 25,100
Material Characterization Analysis indicates approximately 19,400 tonnes of food waste enters the FEP and approximately
16,600 tonnes of organic material enters the WSF, so at least approximately 2,800 tonnes of food waste goes to the Landfill
without being processed through the WSF.
SNC Lavalin Environment Halifax Regional Municipality Solid
Waste Characterization Study
Otter Lake Waste Facility 2009
Material Characterization Analysis Applied to Determine the
Weight of the Materials that Entered the WSF January to
Material Characterization Analysis indicates approximately 25,000 tonnes of organic material enters the FEP and
approximately 16,600 tonnes of this organic material enters the WSF, so the remainder of the organic material,
approximately 8,400 tonnes, goes to the Landfill without being processed through the WSF.
CBCL Ltd. Otter Lake WSF Materials Characterization and Testing
December 2012 and January 2013
Summary of APPENDIX B - Physical Composition of Wastes
Entering WSF (Three 100 kg Samples)
Material Characterization Analysis Applied to Determine the
Weight of the Materials that Entered the WSF January to
December 2011
SNC Lavalin Environment Halifax Regional Municipality Solid
Waste Characterization Study
Otter Lake Waste Facility 2009
Material Characterization Analysis Applied to Determine the
Weight of the Materials that Entered the FEP January to
December 2011
Summary of Tables 3-1 and 3-2
28
Metropolitan Halifax Solid Waste/Resource Management System Implementation Plan, MIRROR Nova Scotia,
page 7, September 15 1995.

Solid Waste Strategy Review – Final Report
Committee of the Whole Report - 89 - January 14, 2014
These putrescible organics go straight to the RDF following processing in the FEP. This data
proves that in terms of system performance, a significant percentage of putrescible organics enter
the landfill without stabilization. This outcome is contrary to the contract and the CMC
agreement that only approved waste will be placed in the landfill. The status quo situation is not
compliant. However, the operational measures at the RDF are effectively dealing with the
putrescible organics that are not stabilized through the WSF.
In addition to un-stabilized putrescible organics going to the RDF, another functional outcome of
the FEP/WSF processing is the introduction of fugitive GHG escaping into the atmosphere. The
issue is whether or not the assessed benefits from the stabilizing of 2/3 of the putrescible
organics arriving at Otter Lake outweighs the negative environmental impact of fugitive GHG
entering the atmosphere as a result of the machine processing?
All parties {Dillon, Arnold, Stantec and SNC Lavalin} agree that the shredding and stabilizing of
the mixed organics and garbage waste materials, upwards of 25,000 tonnes per year, through the
WSF reduces the material’s gas potential. However, what Stantec and SNC Lavalin also identify
is that the processing through the WSF unintentionally introduces a methane gas impact to the
environment. The process generates increased volumes of GHG in the early years of cell
operation before optimized GHG collection systems can be installed following cell closure.
Environment Canada’s website states:
Methane is 21 times more potent than carbon dioxide in terms of its global warming
potential.
Emissions from Canadian landfills account for 20% of national methane emissions.
Estimates have shown that approximately 27 Mega tonnes (Mt) of carbon dioxide
equivalent (eCO2) are generated annually from Canadian landfills, of which 20 Mt
eCO2 are being emitted annually.29
The illustration below (Figure 24) shows gases captured and not captured in a traditional landfill.
A traditional landfill does not pre-process, shred and stabilize into a dry fluffy material
putrescible organics mixed with garbage {outcome from the FEP/WSF}. Captured and managed
methane gases are below the dashed line. Fugitive gases which escape into the atmosphere are
those above the dashed line in the dark shaded area. This graphic illustrates the gases presenting
before cells are properly capped and sealed. Even when the cells are sealed, methane continues
to escape.
29
http://www.ec.gc.ca/gdd-mw/default.asp?lang=En&n=6F92E701-1, January 24, 2013.

Solid Waste Strategy Review – Final Report
Committee of the Whole Report - 90 - January 14, 2014
Figure 24
30
The following graph shows a comparison between a bio-reactor landfill and a traditional landfill
with no waste processing. A bio-reactor landfill utilizes a process similar to the process
undertaken in the WSF to “generate” decomposition through introduction of air, heat and
moisture to accelerate decomposition. As shown, the processing of materials significantly
accelerates and shortens the duration of substantial gas production.
30 http://compostactivist.com/Activist/PoliticalObstacles/MethaneGas.aspx, 25 November, 2013.

Solid Waste Strategy Review – Final Report
Committee of the Whole Report - 91 - January 14, 2014
Figure 25
31 The following is an image of a bio-reacotr landfill.
Figure 26
32
The above image depicts a managed gas production bio-reactor landfill. The current processing
of the organics garbage mixture at Otter Lake to stabilize the putrescible organics through the
WSF can be compared to the process utilized to rapidly generate decomposition in a bio-reactor
landfill. The waste materials are saturated to desired levels, and air and heat are introduced to
accelerate decomposition.
31
http://oldweb.northampton.ac.uk/aps/env/Wasteresource/2000/Mar2000/2000mar25_3.gif 32
http://www.wm.com/sustainability/bioreactor-landfills/bioreactor-technologies.jsp

Solid Waste Strategy Review – Final Report
Committee of the Whole Report - 92 - January 14, 2014
Over the 15-18 days in the WSF, the materials release a percentage of their gas potential.33
The
remaining gas potential is released once the stabilized materials are placed in the landfill. A
critical difference between the two systems is that in a bio-reactor landfill, the landfill cells are
sealed prior to the application of measures to accelerate decomposition. The gases released from
the process are then captured to generate renewable energy.
At Otter Lake, the putrescible materials are processed through stabilization in the WSF prior to
being placed in the open landfill cell. The gases generated during the stabilization process are
released through a bio-filter adjacent to the WSF which acts as a filter to manage odours. Then
the stabilized materials are placed into the landfill and mixed with the other garbage.
As noted above, when re-introduced to oxygen, moisture and the atmosphere, decomposition
continues at an accelrated rate. This is what produces the gases and odours managed by the
temporay gas management system.
Below is the graph utilized by Dillon Consulting Limited to illustrate the gas production curve as
a result of the processing, shredding and stabilizing of the organics through the WSF at Otter
Lake. Once the putrescible organics and garbage mixture comes out of the WSF and are placed
in the landfill, decomposition results in the remaining gases being produced much faster. In the
case of Otter Lake, based on the previous graphs, given the placement in an active uncapped cell,
the majority of methane gases from the organics would escape as fugitive gases into the
atmosphere or be captured by the temporary gas management system and burned off.
Figure 27
34
33 Memo, Subject: Waste Stabilization Facility (WSF) Evaluation and Comment on Stantec Inc. & SNC-Lavalin
Inc. Reports, Bio-Logic Environmental Systems, Dr. P Arnold, 16 September, 2013 34 Waste Resource Strategy Update Document Review Report, May 2013, Procured by MIRROR Nova Scotia,
Submitted by: Dillon Consulting Limited, page 11.
Solid Waste Strategy Review – Final Report
Committee of the Whole Report - 93 - January 14, 2014
Arnold, Dillon, MIRROR NS and CMC maintain the FEP/WSF process is required to protect the
environment and community. Stantec and SNC Lavalin agree that the processing reduces gas
potential in the materials but also produces rapid generation of gases once placed in the landfill.
The two outcomes are fugitive GHG and a reduced number of years that GHG must be managed.
From an environmental stewardship perspective, as is shown in the first gas production graphic,
the shredding and “stabilizing” of mixed organic waste materials and subsequent placement into
an active cell will result a significantly higher percentage of GHG being released into the
atmosphere before a cell is sealed.
What Stantec and SNC Lavalin have suggested was that the FEP/WSF mechanical processing
introduces a negative environmental impact in rapidly generated fugitive GHG. The question is
whether or not the more rapid generation and release of GHG prior to cell closure is an
acceptable environmental impact? An alternative, as has been suggested by Stantec and SNC
Lavalin, are more rigorous operational management practices at the RDF cell to achieve similar
operational outcomes in terms of no community impacts. HRM could introduce other ISWMS
changes as outlined throughout this report to increase diversion and further enhance
environmental or community protection to address concerns of placing materials directly into the
RDF.

Solid Waste Strategy Review – Final Report
Committee of the Whole Report - 94 - January 14, 2014
Appendix 8 – Cell Increase in Height Implications
Landfill Cell Height
The current cell height protocol is consistent with original site planning. The nine cell plan for
Otter Lake will reach capacity in 2024. However, the existing nine cell plan at Otter Lake could
be extended by almost 25 years with an addition of 15 meters in height to each cell. This analysis
includes adding additional materials on top of closed cells (1-5) once the current active cell, 6,
reaches capacity. Cells 7-9 would subsequently be developed to the new height protocol. Staff is
working on a digital representation of what this height increase would look like from various
angles.
Industry standard is to build landfill cells as high as practical to realize maximum return on the
capital investment in the cell liner construction cost. The vast majority of cost for a landfill cell is
in the construction of the cell liner mold. Cell 6 cost $16.1 million as approved by Regional
Council. This figure does not include the cost of the Borrow Pit Road ($ 944 K) project
associated with the construction of cell 6.
Programmed capacity for cell 6 is approximately 500,000 tonnes for a $32.20/tonne capital
investment expense. Increasing cell 6 height by 15m doubles the cell’s capacity to approximately
one million tonnes. This results in a reduced capital investment cost of $16.10/tonne. Current
amortization is based on a cell life of 3.5 years on a projection of approximately 140,000
tonnes/year. The additional cell height doubles the cell life and doubles the amortization period
to 7 years.
The only Provincial legislative criterion for siting cells at the Otter Lake site relates to distance
from a well servicing a residence. According to Provincial legislation, cells must be a minimum
of 1000m from the nearest well servicing a residence. The cells at Otter Lake exceed this
Provincial regulation by over 2000m as per the CSC strategy recommendation that cells be no
closer than 3000m from the nearest well servicing a residence. This is depicted in Appendix B.
The environmental consideration of the recommended increase in cell height would be a drumlin
mound 15m higher than the existing drumlin mound at the site. The current site plan requires
remedial restoration through the planting of trees, shrubs and other local vegetation. The intent of
the remedial work would be to return the site topography to be consistent with local
surroundings. Given the topography of the area and the existence of hills and ridges, the
increased height of the resulting drumlin mound is assessed to have limited impact on this
objective.
The recommendation to increase cell height is further supported when the capital investment
already made in the existing cells on site is taken into consideration. Cells 1 through 5 are
already built and paid for. Each cell which is added to in terms of 15m of additional materials
has the ability to push out the requirement to build the next cell by several years. Each extension
of time before the next cell is required also extends the life of the site, should Regional Council
so choose.
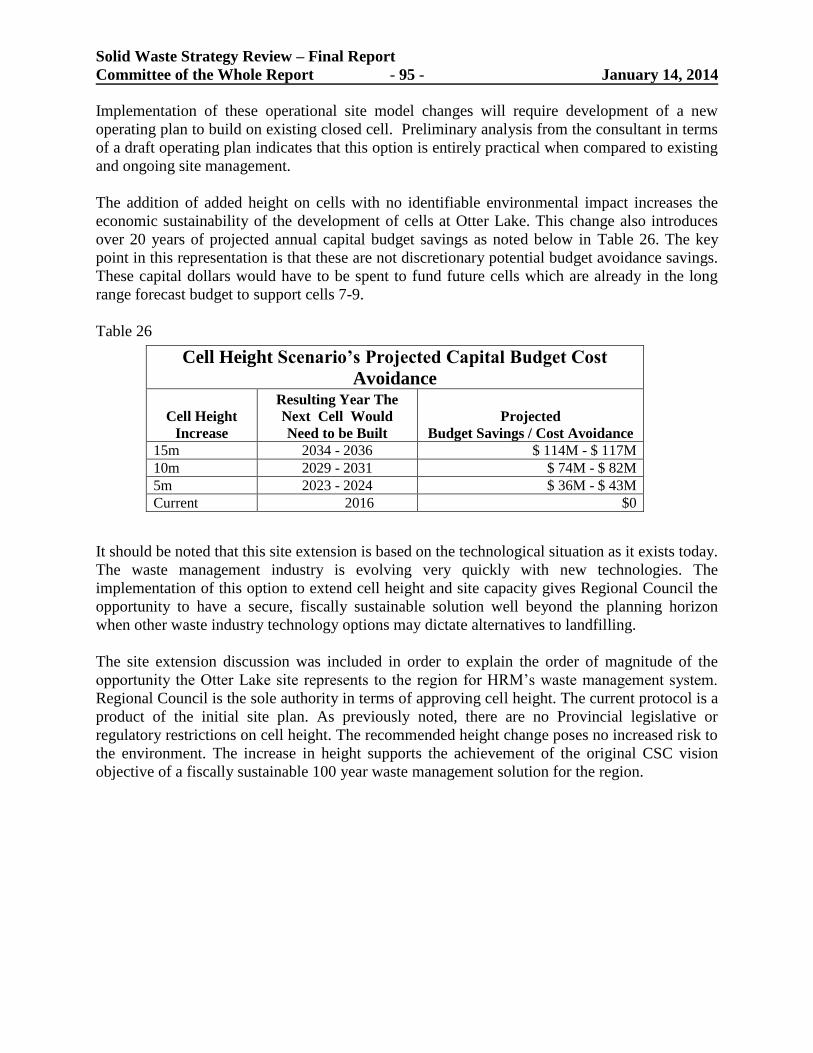
Solid Waste Strategy Review – Final Report
Committee of the Whole Report - 95 - January 14, 2014
Implementation of these operational site model changes will require development of a new
operating plan to build on existing closed cell. Preliminary analysis from the consultant in terms
of a draft operating plan indicates that this option is entirely practical when compared to existing
and ongoing site management.
The addition of added height on cells with no identifiable environmental impact increases the
economic sustainability of the development of cells at Otter Lake. This change also introduces
over 20 years of projected annual capital budget savings as noted below in Table 26. The key
point in this representation is that these are not discretionary potential budget avoidance savings.
These capital dollars would have to be spent to fund future cells which are already in the long
range forecast budget to support cells 7-9.
Table 26
It should be noted that this site extension is based on the technological situation as it exists today.
The waste management industry is evolving very quickly with new technologies. The
implementation of this option to extend cell height and site capacity gives Regional Council the
opportunity to have a secure, fiscally sustainable solution well beyond the planning horizon
when other waste industry technology options may dictate alternatives to landfilling.
The site extension discussion was included in order to explain the order of magnitude of the
opportunity the Otter Lake site represents to the region for HRM’s waste management system.
Regional Council is the sole authority in terms of approving cell height. The current protocol is a
product of the initial site plan. As previously noted, there are no Provincial legislative or
regulatory restrictions on cell height. The recommended height change poses no increased risk to
the environment. The increase in height supports the achievement of the original CSC vision
objective of a fiscally sustainable 100 year waste management solution for the region.
Cell Height Scenario’s Projected Capital Budget Cost
Avoidance
Cell Height
Increase
Resulting Year The
Next Cell Would
Need to be Built
Projected
Budget Savings / Cost Avoidance
15m 2034 - 2036 $ 114M - $ 117M
10m 2029 - 2031 $ 74M - $ 82M
5m 2023 - 2024 $ 36M - $ 43M
Current 2016 $0