ISU FARM Research Report - extension.iastate.edu · Iowa State University (ISU) has a long-standing...
49
ISRF13-99 January 2014 2013 ISU FARM Research Report ISU FARM Report Cover 2013.indd 1 10/30/13 8:57 AM
Transcript of ISU FARM Research Report - extension.iastate.edu · Iowa State University (ISU) has a long-standing...

ISRF13-99 January 2014
2013
ISU FARM Research Report
ISU FARM Report Cover 2013.indd 1 10/30/13 8:57 AM

i
ISU FARM, Farmer-Assisted Research and Management ISRF13-99
1
IntroductionIowa State University (ISU) has a long-standing relationship with Iowa corn and soybean farmers. As a part of this relationship, ISU works to provide quality, unbiased research data to assist in the decision-making process on farm operations. In 2006, Iowa State began to expand that commitment, with the assistance of northwest Iowa farmers, by conducting research on their farms. In 2011, ISU Farmer-Assisted Research and Management (FARM) was established to expand the northwest Iowa program to the rest of the state through Iowa State University Extension and Outreach field agronomists and ag specialists.
This publication was prepared by the Iowa State University Research Farms and Iowa State University Extension and Outreach with contributions from Josh Sievers, Wayne Roush, Lyle Rossiter, Micah Smidt, Zack Koopman, Lance Miller, Paul Kassel, Jim Fawcett, Erin Hodgson, Mark Honeyman, Antonio Mallarino, John Sawyer, and others. NOTE: This is a progress report and, therefore, is not necessarily conclusive. Further data may result in conclusions somewhat different from those reported here. Information in this publication may be specific to Iowa. © 2014 Iowa State University of Science and Technology. All rights reserved. The information in this report is not to be used for publication without the express written consent of ISU FARM, Curtiss Hall, Iowa State University, Ames, IA. Information contained within does not constitute a recommendation or endorsement of product use.

ISU FARM, Farmer-Assisted Research and Management ISRF13-99
1
ii
ISU FARM SpecialistsIn 2013, more than 70 farmer-cooperators in 27 counties assisted in conducting over 130 research trials that are shared in this publication. As Iowa State University continues to expand locations for ISU FARM, the need for farmers to participate will increase as well. If you are interested in participating in this program, please contact one of the ISU Extension and Outreach ag specialists or field agronomists listed.
The ISU FARM Specialists make contact with the farmer cooperators, assist them in design/conducting the trials, and collect/submit the data. These specialists are housed on ISU Research Farms and also play a key role conducting plot trials on the research farms.
Micah Smidt310 S. Main StreetKanawha, IA 50447Phone/Fax: (641) 762-3247Cell: (641) [email protected]
Josh Sievers6320 500th StreetSutherland, IA 51508Phone: (712) 446-2626Cell: (712) 539-2510Fax: (712) [email protected]
Wayne Roush36515 Highway E34Castana, IA 51010Phone/Fax: (712) [email protected]
Lyle Rossiter2030 640th StreetNewell, IA 50568Phone/Fax: (712) [email protected]
Zack Koopman1308 U AvenueBoone, IA 50036Phone: (515) 296-4083Cell: (515) [email protected]
Lance Miller3114 Louisa-Washington RoadCrawfordsville, IA 52621Phone/Fax: (319) 658-2353Cell: (319) [email protected]
Jim Rogers53020 Hitchcock AvenueLewis, IA 51544Phone: (712) 769-2402Cell: (712) [email protected]
iii
ISU FARM, Farmer-Assisted Research and Management ISRF13-99
1
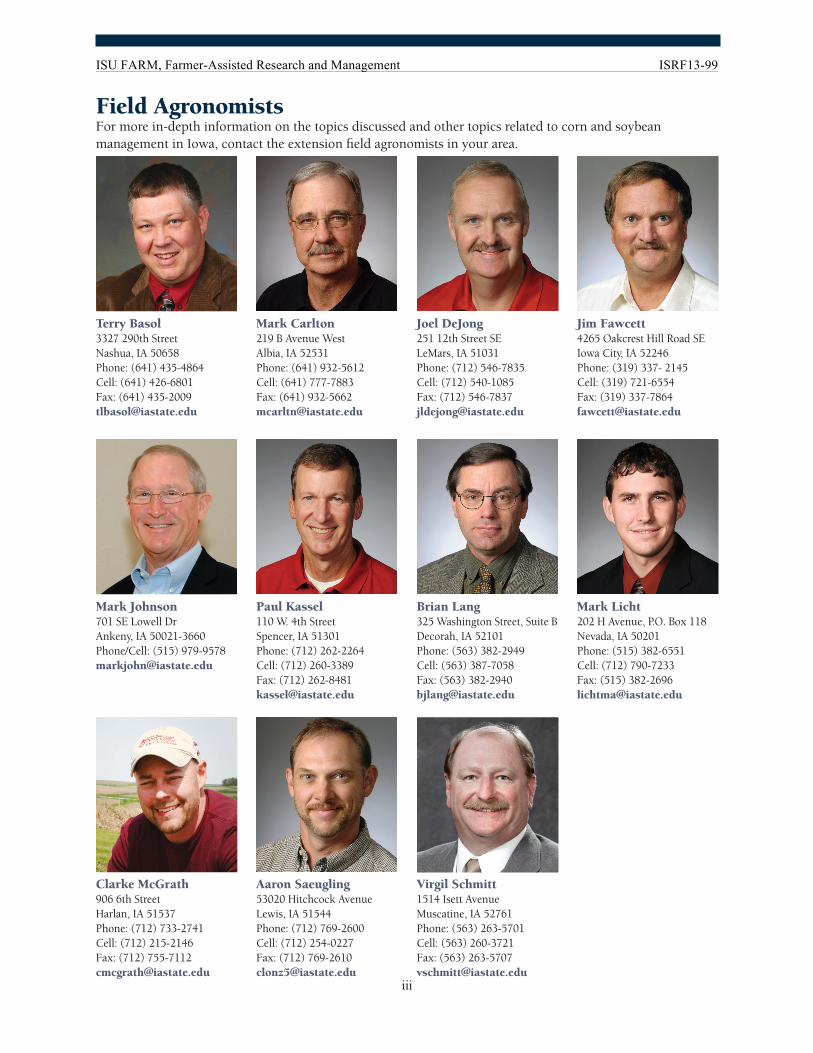
Field AgronomistsFor more in-depth information on the topics discussed and other topics related to corn and soybean management in Iowa, contact the extension field agronomists in your area.
Jim Fawcett4265 Oakcrest Hill Road SEIowa City, IA 52246Phone: (319) 337- 2145Cell: (319) 721-6554Fax: (319) [email protected]
Terry Basol3327 290th StreetNashua, IA 50658Phone: (641) 435-4864Cell: (641) 426-6801Fax: (641) [email protected]
Mark Carlton219 B Avenue WestAlbia, IA 52531Phone: (641) 932-5612Cell: (641) 777-7883Fax: (641) [email protected]
Joel DeJong251 12th Street SELeMars, IA 51031Phone: (712) 546-7835Cell: (712) 540-1085Fax: (712) [email protected]
Mark Licht202 H Avenue, P.O. Box 118Nevada, IA 50201Phone: (515) 382-6551Cell: (712) 790-7233Fax: (515) [email protected]
Mark Johnson701 SE Lowell DrAnkeny, IA 50021-3660Phone/Cell: (515) [email protected]
Paul Kassel110 W. 4th StreetSpencer, IA 51301Phone: (712) 262-2264Cell: (712) 260-3389Fax: (712) [email protected]
Brian Lang325 Washington Street, Suite BDecorah, IA 52101Phone: (563) 382-2949Cell: (563) 387-7058Fax: (563) [email protected]
Virgil Schmitt1514 Isett AvenueMuscatine, IA 52761Phone: (563) 263-5701Cell: (563) 260-3721Fax: (563) [email protected]
Clarke McGrath906 6th StreetHarlan, IA 51537Phone: (712) 733-2741Cell: (712) 215-2146Fax: (712) [email protected]
Aaron Saeugling53020 Hitchcock AvenueLewis, IA 51544Phone: (712) 769-2600Cell: (712) 254-0227Fax: (712) [email protected]

ISU FARM, Farmer-Assisted Research and Management ISRF13-99
1
iv
Interpreting P-Values in ISU FARM TrialsStatistics Shed Light on Yield VariationWhen comparing yields from a field, even when the plots measured are next to each other, the measured yields very well may differ. Yield differences can be attributed to several factors such as: variation within the soil map unit, soil fertility, moisture availability, insect infestation, disease pressure, or differences in planting or harvesting techniques.
When at least three replications of a trial are conducted, statistics can be used to determine if variations are attributed to the treatment or to factors unrelated to the treatments being compared. All trials reported were replicated at least three times at the site in the farmer-cooperator’s field.
P-ValuesP-values are used to help determine if differences in a measurement (yield in this case) can be attributed to treatments and not other factors. The lower the p-value, the more likely it is that the treatments are actually affecting yield. Common benchmarks for p-values in field research are 0.10 and 0.05. If an experiment has a p-value of 0.10, we would be 90 percent confident that the differences observed are in response to the treatments. Likewise, if an experiment has a p-value of 0.05, we can say we are 95 percent confident that the differences observed were in response to the treatments. Keep in mind that the larger a p-value, the lower the probability that the treatment effect was responsible for differences observed.
A Finding of “No Statistical Difference” Is Still Valuable DataEven if yields are not statistically different, it is important to remember that the data are still valuable because they tell us that the treatments did not produce a difference in yield (or other factors measured). Simply knowing this can help a grower learn more about the conditions and performance of a given field, as well as aid future management decisions.
ISU FARM, Farmer-Assisted Research and Management ISRF13-99
Table of Contents
RFR-A1307 Corn Production
On-farm Corn Population Trials RFR-A1301 ........................................................................1 On-farm Corn Planter Trials RFR-A1302 ..............................................................................3 On-farm Drought-tolerant Corn Hybrid Trials RFR-A1303 ..................................................7 On-farm Corn Tillage Trials RFR-A1304 ..............................................................................8 On-farm Sulfur Fertilization of Corn Trials RFR-A1305 .......................................................9 On-farm Micronutrient Fertilization of Corn Trials RFR-A1306 .........................................11 On-farm Soil Amendment Trials RFR-A1308 .....................................................................13 On-farm Cover Crop Trials RFR-A1309 ..............................................................................15 On-farm Corn Fertilizer and Related-Product Trials RFR-A1310 .......................................16
Corn Protection On-farm Corn Seed Treatment Trials RFR-A1311 ..............................................................18 On-farm Corn Rootworm Trials RFR-A1312 .......................................................................19 On-farm Corn Fungicide Trials RFR-A1313 ........................................................................22 On-farm Corn Fungicide Application Timing Trials RFR-A1314 .......................................25
Soybean Production On-farm Soybean Management Trials RFR-A1315 .............................................................27 On-farm Soybean Tillage Trials RFR-A1316 .......................................................................30 On-farm Land Rolling of Soybeans RFR-A1317 .................................................................31 On-farm Sulfur Fertilization of Soybean Trials RFR-A1318 ...............................................32 On-farm Micronutrient Fertilization of Soybean Trials RFR-A1319 ...................................34
Soybean Protection On-farm Soybean Seed Treatment Trials RFR-A1321 .........................................................36 On-farm Soybean Fungicide Trials RFR-A1322 ..................................................................38
Acknowledgements
The data from each 2013 FARM on-farm research trial was analyzed by Jim Fawcett, ISU field agronomist, with support from Mark Honeyman, coordinator, ISU Research Farms. Jim Fawcett also interpreted the results and wrote the text for the articles.
Note: This is a progress report and, therefore, is not necessarily conclusive. Further data may result in conclusions somewhat different from those reported here.
Annual report, farm, and weather information is available at: www.ag.iastate.edu/farms/ and http://www.fpr.extension.iastate.edu/.
Progress reports also can be found on the ISU Extension website fpr.extension.iastate.edu. This site allows sorting by field, area, department, and farm.

ISU FARM, Farmer Assisted Research and Management ISRF13-99
1
On-farm Corn Population Trials
RFR-A1301
In 2013, ISU FARM had various experiments examining corn planting populations and the effect on corn yield. Yield results at the end of the season may be impacted by early season planting decisions. For this reason, it is important to have information on the best early season practices to aid decision-making before the season begins. Methods Farmers continue to increase corn planting populations in hopes of increasing yields. But as seed prices rise, it is important for farmers to find a population that maximizes both yield and profit. The following trials evaluated the effect of differing planting populations on grain yield. Three planting population trials with five treatments each were conducted in 2013 in Boone, Dallas, and Story counties (Table 1). Treatments consisted of plots with 25,000, 30,000, 35,000, 40,000, and 45,000 seeds/acre. Three trials were conducted in Cass, Montgomery, and Washington counties that investigated three planting populations with seeding rates ranging from about 30,000 to 45,000 seeds/acre. Two trials also were conducted in Adams and Buena Vista counties that had two planting populations from about 30,000 to 45,000 seeds/acre. Spring and fall stand counts were made in most of the trials. Treatments in all trials were replicated three or more times. Results There was a significant effect of corn planting population on corn yield in only Trial 5, where the planting population of 25,000 seeds/acre yielded significantly less than the planting population of 35,000 seeds/acre (Table 2). There also was a trend for a lower yield with the highest seeding rate of 45,000 seeds/acre in Trials 7 and 8 (P≤0.08). With the stressful year, it is likely the corn did not respond as much to the higher planting population because of the lower yield potential in 2013. The dry conditions present in the summer also would have increased the potential for lower yields with the highest seeding population of 45,000 seeds/acre. In all of the trials, 35,000 seeds/acre was in the top-yielding tier of treatments and was not significantly lower yielding than any other treatment. According to ISU Extension Corn Specialist Roger Elmore’s research, the optimal planting rate for yield falls in the range of 34,500 to 37,000 seeds/acre and the optimal planting rate for profit falls between 30,000 and 35,000 seeds/acre. Thus, the results of the trials presented align with Elmore’s recommendations on planting population.

ISU FARM, Farmer Assisted Research and Management ISRF13-99
2
Table 1. Hybrid, row spacing, planting date, previous crop, and tillage practices from corn population trials in eight counties.
Exp. No. Trial County Hybrid
Row spacing
(in.) Planting
date Previous
crop Tillage 130203 1 Buena Vista DK 5262
RRNA 36 6/18/13 Soybean Spring field
cultivate 130609 2 Adams DK 66-96
Pro 3 15 6/20/13 Soybean No-till
130610 3 Cass Epply E 1403 VT 2p
RIB
30 5/15/13 Soybean Conventional
130704 4 Washington DKC 61-16 30 5/14/13 Soybean No-till 130505 5 Dallas Pioneer
993HR 30 5/14/13 Corn Conventional
130506 6 Boone Pioneer 1161
30 5/18/13 Corn Conventional
130507 7 Story Pioneer 9910XR
VT3
30 6/13/13 Corn Conventional
130607 8 Montgomery DK 6297 15 6/4/13 Corn Tilled Table 2. Spring stand, fall stand, and yield from corn planting population trials.
Exp. No. Trial Treatments
Spring stand
(plants/A)* Fall stand
(plants/A)* Yield (bu/A)* P-Value 130203
1
29,700 34,300
29,500 a 33,600 b
29,000 a 33,100 b
144.9 a 146.2 a
0.73
130609
2
35,000 45,000
33,875 a 42,050 b
-- --
157.6 a 162.4 a
0.50
130610
3
30,000 35,000 40,000
27,625 c 32,375 b 37,625 a
-- -- --
173.5 a 169.7 a 168.6 a
0.32
130704
4
31,000 34,000 37,000
29,375 b 32,875 ab 35,625 a
29,125 b 32,750 ab 35,000 a
211.0 a 217.8 a 219.1 a
0.23
130505
5
25,000 30,000 35,000 40,000 45,000
23,050 e 27,800 d 32,400 c 36,800 b 41,200 a
22,500 e 27,000 d 30,800 c 33,800 b 39,200 a
164.4 b 170.0 ab 171.9 a
170.4 ab 167.1 ab
0.02
130506
6
25,000 30,000 35,000 40,000 45,000
17,400 c 20,800 bc 25,100 bc 27,300 ab 33,400 a
17,800 b 20,300 b 25,000 ab 25,300 ab 30,800 a
147.8 a 151.3 a 157.6 a 146.5 a 166.4 a
0.65
130507
7
25,000 30,000 35,000 40,000 45,000
24,300 e 29,900 d 34,600 c 40,800 b 45,700 a
24,300 e 29,500 d 33,500 c 39,500 b 44,800 a
176.8 a 177.8 a 170.3 a 170.2 a 166.2 a
0.08
130607
8
37,000 40,000 45,000
-- -- --
-- -- --
253.7 a 256.8 a 230.3 a
0.06
*Values denoted with the same letter within a trial are not statistically different at the significance level 0.05.

ISU FARM, Farmer Assisted Research and Management ISRF13-99
3
On-farm Corn Planter Trials
RFR-A1302 Closing wheel configurations Methods Trials were conducted that examined closing wheel type and wheel down pressure on subsequent corn grain yield. Treatments consisted of conventional press wheels, finger press wheels, and half conventional and half finger press wheels, each with both heavy (high)- and light (low)-down pressure. Because of the study design, we can look for yield differences between closing wheel type, amount of pressure, and closing wheel type × wheel pressure interactions. These trials were identical in design, but Trial 1 was no-till and Trial 2 was conventional tillage (Table 1). Results There were no statistically significant differences in corn grain yield with any of the wheel types or wheel down pressures in either of the two trials, although there was a nearly significant trend (P=0.13) for a greater yield with the conventional press wheels compared with the finger press wheels in Trial 2 (Table 2). Stand counts (not shown) taken in the spring indicated a lower stand count with the finger wheel treatment in Trial 1. Table 1. Hybrid, row spacing, planting date, planting population, previous crop, and tillage practices from two closing wheel and wheel pressure trials in corn.
Exp. No. Trial County Hybrid
Row spacing
(in.) Planting
date
Planting population (seeds/A)
Previous crop
Tillage practices
130516 1 Boone Fontanelle 6A100
30 5/24/13 35,700 Soybean No-till
130517 2 Boone Fontanelle 6A100
30 5/24/13 35,700 Soybean Conventional
Table 2. Yield from two closing wheel and wheel pressure trials in corn.
Exp. No. Trial Wheel
Yield (bu/A)*
P-value
Down pressure
Yield (bu/A)*
P-value
Wheel × pressure
Yield (bu/A)*
P-value
130516
1
Conventional
Finger press
Half & Half
200.7 a
195.0 a
206.0 a
0.61
High
Low
201.9 a
198.8 a
0.43
Conv × Hi Conv × Lo Finger × Hi Finger × Lo Half × Hi Half × Lo
209.2 a 200.4 a 195.5 a 192.2 a 201.0 a 203.8 a
0.66
130517
2
Conventional
Finger Press
Half & Half
208.4 a
191.5 a
196.1 a
0.13
High
Low
199.0 a
198.4 a
0.93
Conv × Hi Conv × Lo Finger × Hi Finger × Lo Half × Hi Half × Lo
205.8 a 210.9 a 196.3 a 186.8 a 194.9 a 197.3 a
0.48
*Values denoted with the same letter within a trial are not statistically different at the significance level 0.05.
ISU FARM, Farmer Assisted Research and Management ISRF13-99
4
Planter attachments and planting depth Methods One corn planter trial was conducted in Sioux County in 2013 that compared the use of an “E-Set” precision planting vacuum disk with the standard John Deere vacuum disk. Ten trials were conducted in O’Brien County comparing factory-installed spring pressure with hydraulic down pressure on a Kinze 3600 planter using V-Set vacuum disks. Another corn planter study (Trial 12) looked at the effect of planting depth on corn stands and corn grain yield. Corn was planted at a 1-in., 2-in., and 3-in. depth in this trial. See Table 3 for details on these 12 studies. Results No difference was detected in grain yield between corn planted with the E-Set vacuum disk and the standard John Deere vacuum disk in Trial 1 (Table 4). No significant yield difference was detected with corn planted using hydraulic down pressure vs. spring down pressure in nine of the 10 trials, but there was a significant yield advantage of over three bushels/acre to the hydraulic down pressure in one trial. However, when all 10 trials and 48 reps were analyzed together, there was no difference in corn grain yield with the two treatments (P=0.48). The average yield for the hydraulic down pressure for the 10 trials was 193.8 bushels/acre. The average yield with the spring down pressure was 193.3 bushels/acre. There was no difference in corn grain yield among the three planting depths in Trial 12, although there was a nearly significant increase in yield with the 2-in. planting depth compared with the 3-in. depth (P=0.11). Corn yield for the 2-in. planting depth also was about 13 bushels/acre greater than the yield for the 1-in. planting depth, although not statistically significant at P=0.05. There also was no difference in plant stands with the three planting depths. Corn stands in the spring were 28,750 plants/acre for both the 1-in. and 2-in. planting depths and 25,250 for the 3-in. planting depth. Even though the yield differences were not significant at P=0.05 in this trial, the greatest yield was obtained with the 2-in. planting depth, which agrees with the recommendation of planting corn 1.5 to 2 in. deep.

ISU FARM, Farmer Assisted Research and Management ISRF13-99
5
Table 3. Hybrid, row spacing, planting date, planting population, previous crop, and tillage practices from planter attachment and planting depth trials in corn.
Exp. No. Trial County Hybrid
Row spacing
(in.) Planting
date
Planting population (seeds/A)
Previous crop
Tillage practices
130133 1 Sioux Golden Harvest
8239-3111
30 5/13/13 32,000 Soybean Field cultivator
130145 2 O’Brien Channel C199-54
30 5/14/13 36,000 Soybean Fall manure, spring field
cultivate 130165 3 O’Brien Channel
203-44 30 5/13/13 36,000 Soybean Fall manure,
spring field cultivate
130166 4 O’Brien DKC 4812 30 5/13/13 36,000 Soybean Fall manure, spring field
cultivate 130167 5 O’Brien DKC 4994 30 5/13/13 36,000 Soybean Fall manure,
spring field cultivate
130168 6 O’Brien DKC 5077 30 5/13/13 36,000 Soybean Fall manure, spring field
cultivate 130169 7 O’Brien Pioneer
193 30 5/13/13 36,000 Soybean Fall manure,
spring field cultivate
130170 8 O’Brien Pioneer 216
30 5/13/13 36,000 Soybean Fall manure, spring field
cultivate 130171 9 O’Brien Pioneer
392 30 5/14/13 36,000 Soybean Fall manure,
spring field cultivate
130172 10 O’Brien Pioneer 448
30 5/15/13 36,000 Soybean Fall manure, spring field
cultivate 130173 11 O’Brien Pioneer
9748 30 5/15/13 36,000 Soybean Fall manure,
spring field cultivate
130509 12 Story 6408 VT3RIB
30 4/30/13 33,500 Soybean Conventional

ISU FARM, Farmer Assisted Research and Management ISRF13-99
6
Table 4. Yield from corn planter studies. Exp. No. Trial Treatment
Yield (bu/A)* P-value
130133
1
E-Set precision planting disk John Deere VAC disk
181.5 a 182.4 a
0.69
130145
2
Hydraulic down pressure Spring down pressure
188.3 a 184.9 b
0.02
130165 3 Hydraulic down pressure Spring down pressure
188.1 a 188.0 a
0.86
130166 4 Hydraulic down pressure Spring down pressure
201.9 a 202.8 a
0.77
130167 5 Hydraulic down pressure Spring down pressure
192.9 a 190.8 a
0.14
130168 6 Hydraulic down pressure Spring down pressure
213.5 a 210.4 a
0.14
130169 7 Hydraulic down pressure Spring down pressure
206.3 a 205.8 a
0.91
130170 8 Hydraulic down pressure Spring down pressure
197.9 a 197.7 a
0.99
130171 9 Hydraulic down pressure Spring down pressure
190.5 a 189.1 a
0.11
130172 10 Hydraulic down pressure Spring down pressure
188.1 a 186.8 a
0.59
130173 11 Hydraulic down pressure Spring down pressure
196.0 a 199.1 a
0.29
130509
12
1-in. planting depth 2-in. planting depth 3-in. planting depth
174.5 a 187.2 a 162.3 a
0.11
*Values denoted with the same letter within a trial are not statistically different at the significance level 0.05.

ISU FARM, Farmer Assisted Research and Management ISRF13-99
7
On-farm Drought-tolerant Corn Hybrid Trials
RFR-A1303 Methods Testing for drought tolerance was appropriate in 2013 due to below normal summer rainfall in much of the state. The AQUAmax™ drought-tolerant hybrids from DuPont Pioneer were tested against equivalent hybrids without drought tolerance. Trials were conducted in Monona, Crawford, and Story counties (Table 1). Results In Trials 2 and 3, AQUAmax™ hybrids produced statistically greater yields of about 20 bushels/acre than conventional hybrids (Table 2). In Trial 1, the AQUAmax™ hybrid also yielded about 10 bushels/acre more than the conventional hybrid (P=0.06). However, none of the drought-tolerant hybrids produced statistically greater yields than the conventional hybrid in the three Story County trials. Drought conditions were present during the summer at all sites, so it is unknown why there was no advantage seen with the drought-tolerant hybrids in the Story County trials. These results show that drought-tolerant hybrids can be advantageous in drought years, but the yield advantages may not always occur. Table 1. Row spacing, planting date, planting population, previous crop, and tillage practices in drought-tolerant hybrid trials.
Exp. No. Trial County
Row spacing
(in.) Planting
date
Planting population (seeds/A)
Previous crop Tillage
130322 1 Monona 30 5/15/13 32,316 Corn No-till 130323 2 Monona 30 5/14/13 32,316 Soybean No-till 130324 3 Crawford 30 5/14/13 29,500 Soybean No-till 130502 4 Story 36 5/15/13 25,000 Soybean Conventional 130503 5 Story 36 5/16/13 25,000 Corn Conventional 130504 6 Story 36 5/16/13 25,000 Corn Conventional Table 2. Yield from corn drought-tolerant hybrid trials.
Exp. No. Trial Treatment
Yield (bu/A)
Response (bu/A) P-value
130322
1
Pioneer 34F07 (conventional) Pioneer 1151AM (drought tolerant)
147.5 158.1
10.6 0.06
130323
2
Pioneer 34F07 (conventional) Pioneer 1151AM (drought tolerant)
204.0 222.6
18.6 <0.01
130324
3
Pioneer 34F07 (conventional) Pioneer 1151AM (drought tolerant)
171.4 194.8
23.4 <0.01
130502
4
Pioneer 34F07 (conventional) Pioneer 1151AM (drought tolerant)
183.9 185.4
1.5 0.80
130503
5
Pioneer 34F07 (conventional) Pioneer 1151AM (drought tolerant)
180.5 176.4
- 4.1 0.46
130504
6
Pioneer 621 (conventional) Pioneer 636 (drought tolerant)
168.6 170.6
2.0 0.83
ISU FARM, Farmer Assisted Research and Management ISRF13-99
8
On-farm Corn Tillage Trials
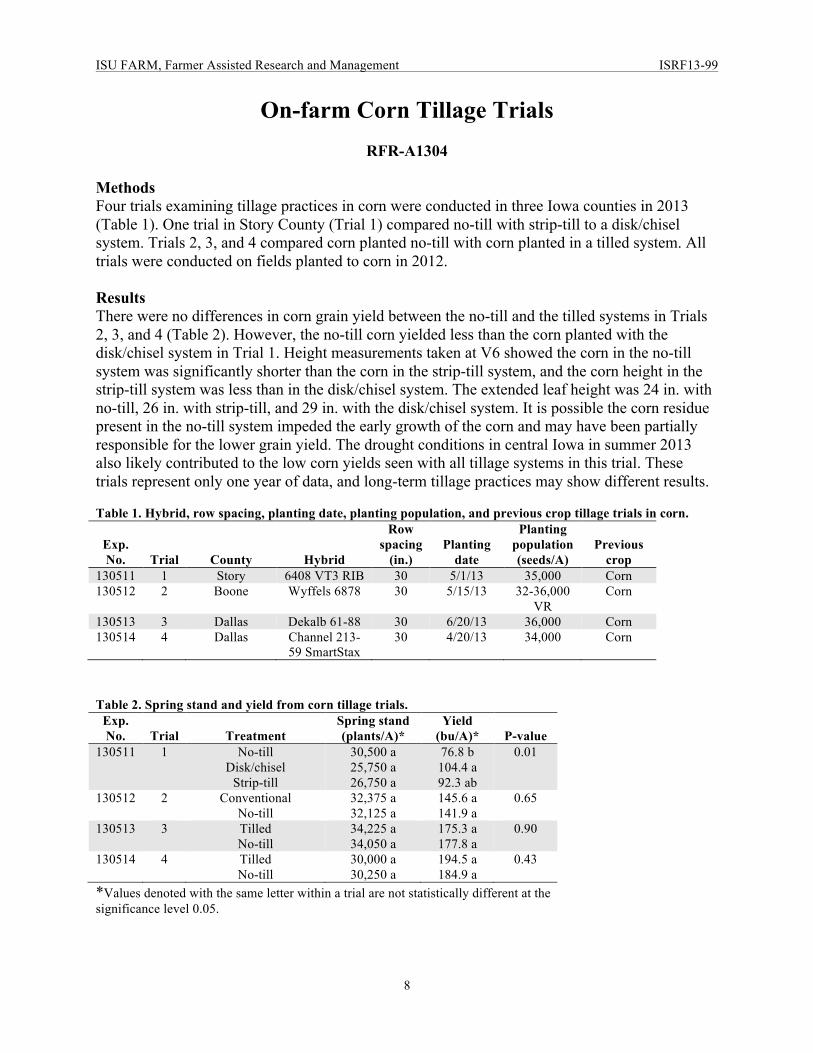
RFR-A1304 Methods Four trials examining tillage practices in corn were conducted in three Iowa counties in 2013 (Table 1). One trial in Story County (Trial 1) compared no-till with strip-till to a disk/chisel system. Trials 2, 3, and 4 compared corn planted no-till with corn planted in a tilled system. All trials were conducted on fields planted to corn in 2012. Results There were no differences in corn grain yield between the no-till and the tilled systems in Trials 2, 3, and 4 (Table 2). However, the no-till corn yielded less than the corn planted with the disk/chisel system in Trial 1. Height measurements taken at V6 showed the corn in the no-till system was significantly shorter than the corn in the strip-till system, and the corn height in the strip-till system was less than in the disk/chisel system. The extended leaf height was 24 in. with no-till, 26 in. with strip-till, and 29 in. with the disk/chisel system. It is possible the corn residue present in the no-till system impeded the early growth of the corn and may have been partially responsible for the lower grain yield. The drought conditions in central Iowa in summer 2013 also likely contributed to the low corn yields seen with all tillage systems in this trial. These trials represent only one year of data, and long-term tillage practices may show different results. Table 1. Hybrid, row spacing, planting date, planting population, and previous crop tillage trials in corn.
Exp. No. Trial County Hybrid
Row spacing
(in.) Planting
date
Planting population (seeds/A)
Previous crop
130511 1 Story 6408 VT3 RIB 30 5/1/13 35,000 Corn 130512 2 Boone Wyffels 6878 30 5/15/13 32-36,000
VR Corn
130513 3 Dallas Dekalb 61-88 30 6/20/13 36,000 Corn 130514 4 Dallas Channel 213-
59 SmartStax 30 4/20/13 34,000 Corn
Table 2. Spring stand and yield from corn tillage trials.
Exp. No. Trial Treatment
Spring stand (plants/A)*
Yield (bu/A)* P-value
130511
1
No-till Disk/chisel
Strip-till
30,500 a 25,750 a 26,750 a
76.8 b 104.4 a 92.3 ab
0.01
130512
2
Conventional No-till
32,375 a 32,125 a
145.6 a 141.9 a
0.65
130513
3
Tilled No-till
34,225 a 34,050 a
175.3 a 177.8 a
0.90
130514
4
Tilled No-till
30,000 a 30,250 a
194.5 a 184.9 a
0.43
*Values denoted with the same letter within a trial are not statistically different at the significance level 0.05.
ISU FARM, Farmer Assisted Research and Management ISRF13-99
9
On-farm Sulfur Fertilization of Corn Trials
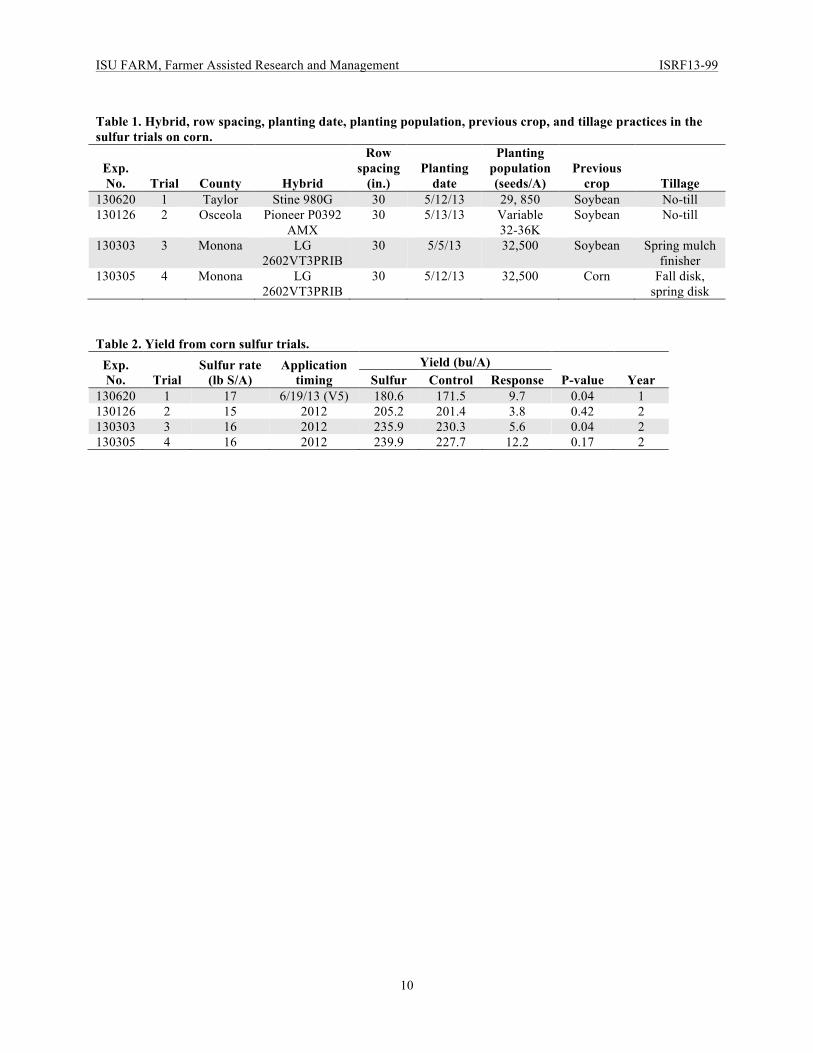
RFR-A1305 In the past several years, sulfur (S) deficiency has been showing up more frequently in Iowa fields than what had been seen in the past. This has been especially true in corn and alfalfa fields in northern Iowa. The sulfur deficiencies are thought to be partially due to Iowa receiving less S in the rainfall because of more stringent air pollution regulations, less S application in fertilizers, higher crop yields, eroded topsoil (organic matter loss), and less widespread use of manure. Sulfur fertilizer applications can offer yield increases where S deficiencies are present. The objective of these trials was to evaluate potential for S deficiency and grain yield response in corn to S application. Methods In 2012, S was applied to two soybean fields and one cornfield with no manure history to test the response of these crops to S in 2012, and the response of corn in 2013 to the residual effect of S applied to the prior year crop. In addition, S was applied to one cornfield in 2013 when the corn was at V5 growth stage to test the response of corn to S in the year of application. Calcium sulfate (gypsum) was the source of S in all four trials. The rate of applied S ranged from 15 to 17 pounds/acre. Sulfur was applied in strip plots with three or more replications per treatment in each trial. All trials were conducted in western Iowa. See Table 1 for details on the four trials. Results First-year trial There was a significant increase in grain yield to the S applied at V5 corn growth stage in the one trial that looked at response to S in the year of application (Table 2). Second-year residual There was a significant grain yield increase of six bushels/acre to the residual S in one of the three trials. The other two trials did not have a yield response to the prior-year S application. These results indicate there are some cornfields in western Iowa that could benefit from an S application, and that the benefits can be seen for at least one year after the application. Across the two years of all FARM trials with S application (first-year or residual-year in corn and soybean), there was a 29 percent positive yield response rate to S application. For further information on these trials and other research on S fertilization, contact John Sawyer, professor, Department of Agronomy, Iowa State University Extension and Outreach ([email protected]).
ISU FARM, Farmer Assisted Research and Management ISRF13-99
10
Table 1. Hybrid, row spacing, planting date, planting population, previous crop, and tillage practices in the sulfur trials on corn.
Exp. No. Trial County Hybrid
Row spacing
(in.) Planting
date
Planting population (seeds/A)
Previous crop Tillage
130620 1 Taylor Stine 980G 30 5/12/13 29, 850 Soybean No-till 130126 2 Osceola Pioneer P0392
AMX 30 5/13/13 Variable
32-36K Soybean No-till
130303 3 Monona LG 2602VT3PRIB
30 5/5/13 32,500 Soybean Spring mulch finisher
130305 4 Monona LG 2602VT3PRIB
30 5/12/13 32,500 Corn Fall disk, spring disk
Table 2. Yield from corn sulfur trials.
Exp. No. Trial
Sulfur rate (lb S/A)
Application timing
Yield (bu/A) P-value Year Sulfur Control Response
130620 1 17 6/19/13 (V5) 180.6 171.5 9.7 0.04 1 130126 2 15 2012 205.2 201.4 3.8 0.42 2 130303 3 16 2012 235.9 230.3 5.6 0.04 2 130305 4 16 2012 239.9 227.7 12.2 0.17 2
ISU FARM, Farmer Assisted Research and Management ISRF13-99
11
On-farm Micronutrient Fertilization of Corn Trials
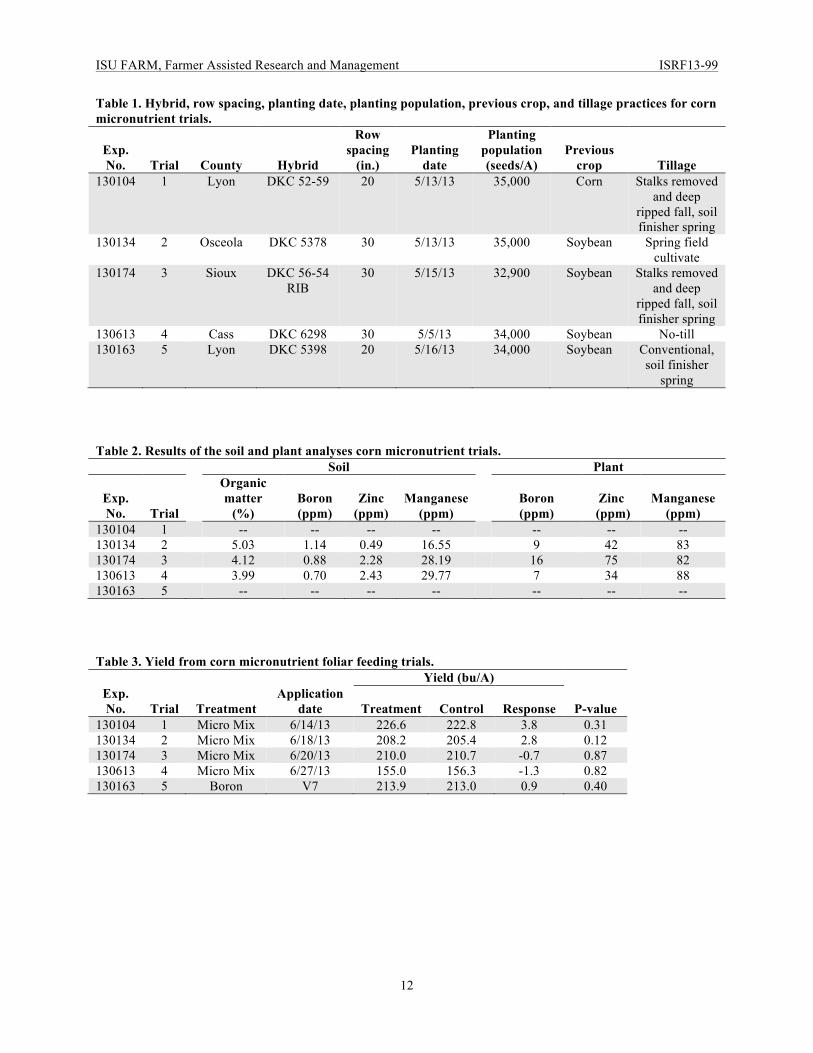
RFR-A1306 Methods Five side-by-side micronutrient trials were conducted on corn in 2013 (Table 1). Foliar applications of a mixture containing boron, zinc, and manganese were applied to approximately V6 corn and compared with an untreated control in Trials 1 through 4. The mixture was one part Winfield® Max-in ZMB (1 qt/acre) and one part Max-in Boron (1 pt/acre) applied in 15 gallons of water/acre. In Trial 5, Max-in Boron only (1 pt/acre) was compared with an untreated control. Soil and plant samples were collected before spraying near the time of the foliar application and analyzed for nutrients. Treatments were replicated three or more times in all trials. Results Soil and plant tissue sample results can be found in Table 2. Also, soil phosphorus and potassium analyses were at optimum level or higher (not shown). None of the yields in the micronutrient-treated plots were statistically greater than the control plots (Table 3). According to Iowa soil-test interpretations for zinc in corn, we could have seen a small yield increase in Trial 2 and no increase in Trial 3. There are no interpretations for boron or manganese for Iowa. No response to manganese was expected according to soil-test interpretations from other north-central states. We should have seen a yield increase from boron in all trials according to interpretations from Illinois, but no increase from boron in any trial according to interpretations from South Dakota. There are no interpretations from Iowa or the north-central states for plant-tissue analysis at this growth stage. Results will be used with other ongoing research to establish interpretations for Iowa. For further information on these trials and other information regarding micronutrient research, contact Antonio Mallarino, professor, Iowa State University Extension and Outreach ([email protected]).
ISU FARM, Farmer Assisted Research and Management ISRF13-99
12
Table 1. Hybrid, row spacing, planting date, planting population, previous crop, and tillage practices for corn micronutrient trials.
Exp. No. Trial County Hybrid
Row spacing
(in.) Planting
date
Planting population (seeds/A)
Previous crop Tillage
130104 1 Lyon DKC 52-59 20 5/13/13 35,000 Corn Stalks removed and deep
ripped fall, soil finisher spring
130134 2 Osceola DKC 5378 30 5/13/13 35,000 Soybean Spring field cultivate
130174
3
Sioux
DKC 56-54 RIB
30
5/15/13
32,900
Soybean
Stalks removed and deep
ripped fall, soil finisher spring
130613 4 Cass DKC 6298 30 5/5/13 34,000 Soybean No-till 130163 5 Lyon DKC 5398 20 5/16/13 34,000 Soybean Conventional,
soil finisher spring
Table 2. Results of the soil and plant analyses corn micronutrient trials.
Soil Plant
Exp. No. Trial
Organic matter
(%) Boron (ppm)
Zinc (ppm)
Manganese (ppm)
Boron (ppm)
Zinc (ppm)
Manganese (ppm)
130104 1 -- -- -- -- -- -- -- 130134 2 5.03 1.14 0.49 16.55 9 42 83 130174 3 4.12 0.88 2.28 28.19 16 75 82 130613 4 3.99 0.70 2.43 29.77 7 34 88 130163 5 -- -- -- -- -- -- -- Table 3. Yield from corn micronutrient foliar feeding trials.
Yield (bu/A) Exp. No. Trial Treatment
Application date Treatment Control Response P-value
130104 1 Micro Mix 6/14/13 226.6 222.8 3.8 0.31 130134 2 Micro Mix 6/18/13 208.2 205.4 2.8 0.12 130174 3 Micro Mix 6/20/13 210.0 210.7 -0.7 0.87 130613 4 Micro Mix 6/27/13 155.0 156.3 -1.3 0.82 130163 5 Boron V7 213.9 213.0 0.9 0.40
ISU FARM, Farmer Assisted Research and Management ISRF13-99
13
On-farm Soil Amendment Trials
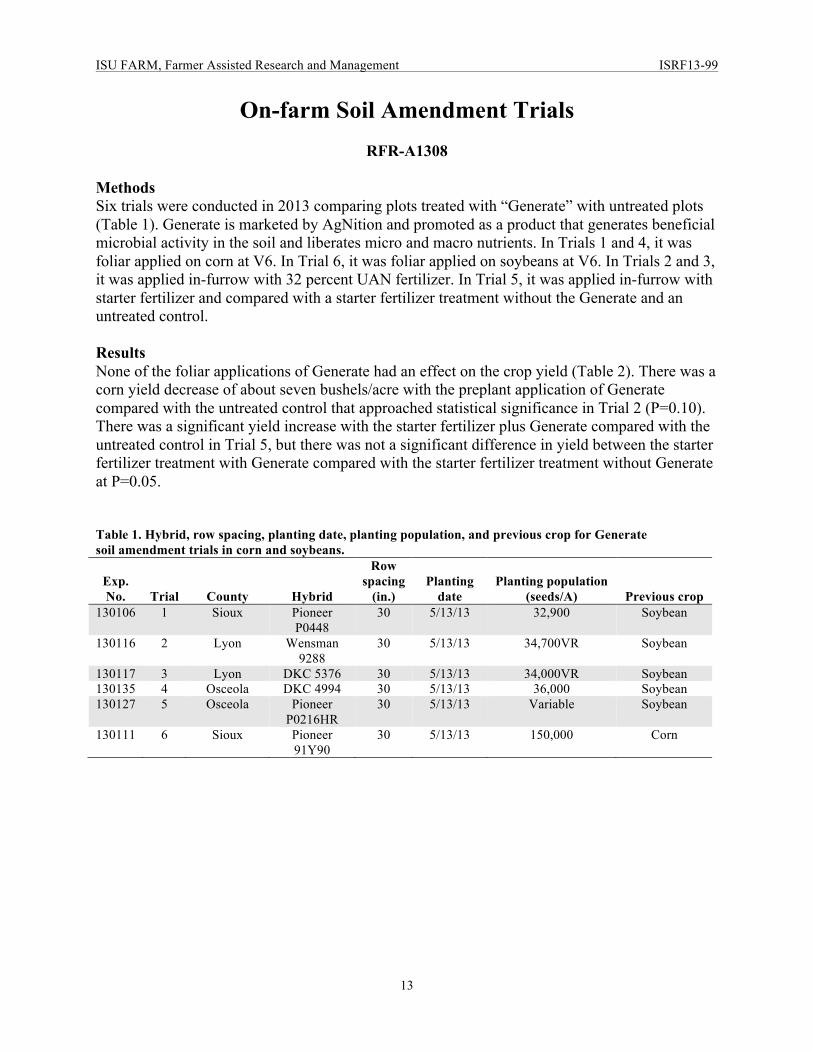
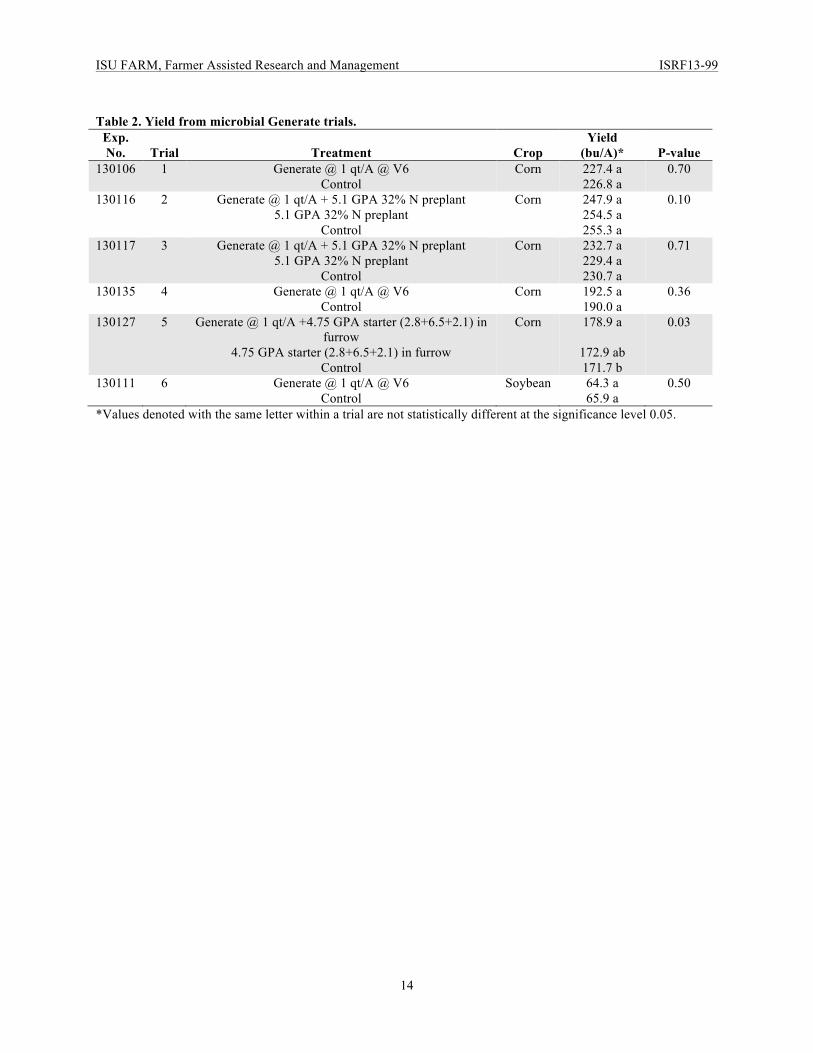
RFR-A1308 Methods Six trials were conducted in 2013 comparing plots treated with “Generate” with untreated plots (Table 1). Generate is marketed by AgNition and promoted as a product that generates beneficial microbial activity in the soil and liberates micro and macro nutrients. In Trials 1 and 4, it was foliar applied on corn at V6. In Trial 6, it was foliar applied on soybeans at V6. In Trials 2 and 3, it was applied in-furrow with 32 percent UAN fertilizer. In Trial 5, it was applied in-furrow with starter fertilizer and compared with a starter fertilizer treatment without the Generate and an untreated control. Results None of the foliar applications of Generate had an effect on the crop yield (Table 2). There was a corn yield decrease of about seven bushels/acre with the preplant application of Generate compared with the untreated control that approached statistical significance in Trial 2 (P=0.10). There was a significant yield increase with the starter fertilizer plus Generate compared with the untreated control in Trial 5, but there was not a significant difference in yield between the starter fertilizer treatment with Generate compared with the starter fertilizer treatment without Generate at P=0.05. Table 1. Hybrid, row spacing, planting date, planting population, and previous crop for Generate soil amendment trials in corn and soybeans.
Exp. No. Trial County Hybrid
Row spacing
(in.) Planting
date Planting population
(seeds/A) Previous crop 130106 1 Sioux Pioneer
P0448 30 5/13/13 32,900 Soybean
130116 2 Lyon Wensman 9288
30 5/13/13 34,700VR Soybean
130117 3 Lyon DKC 5376 30 5/13/13 34,000VR Soybean 130135 4 Osceola DKC 4994 30 5/13/13 36,000 Soybean 130127 5 Osceola Pioneer
P0216HR 30 5/13/13 Variable Soybean
130111 6 Sioux Pioneer 91Y90
30 5/13/13 150,000 Corn
ISU FARM, Farmer Assisted Research and Management ISRF13-99
14
Table 2. Yield from microbial Generate trials.
Exp. No. Trial Treatment Crop
Yield (bu/A)* P-value
130106
1
Generate @ 1 qt/A @ V6 Control
Corn 227.4 a 226.8 a
0.70
130116
2
Generate @ 1 qt/A + 5.1 GPA 32% N preplant 5.1 GPA 32% N preplant
Control
Corn 247.9 a 254.5 a 255.3 a
0.10
130117
3
Generate @ 1 qt/A + 5.1 GPA 32% N preplant 5.1 GPA 32% N preplant
Control
Corn 232.7 a 229.4 a 230.7 a
0.71
130135
4
Generate @ 1 qt/A @ V6 Control
Corn 192.5 a 190.0 a
0.36
130127
5
Generate @ 1 qt/A +4.75 GPA starter (2.8+6.5+2.1) in furrow
4.75 GPA starter (2.8+6.5+2.1) in furrow Control
Corn 178.9 a
172.9 ab 171.7 b
0.03
130111
6
Generate @ 1 qt/A @ V6 Control
Soybean 64.3 a 65.9 a
0.50
*Values denoted with the same letter within a trial are not statistically different at the significance level 0.05.
ISU FARM, Farmer Assisted Research and Management ISRF13-99
15
On-farm Cover Crop Trials
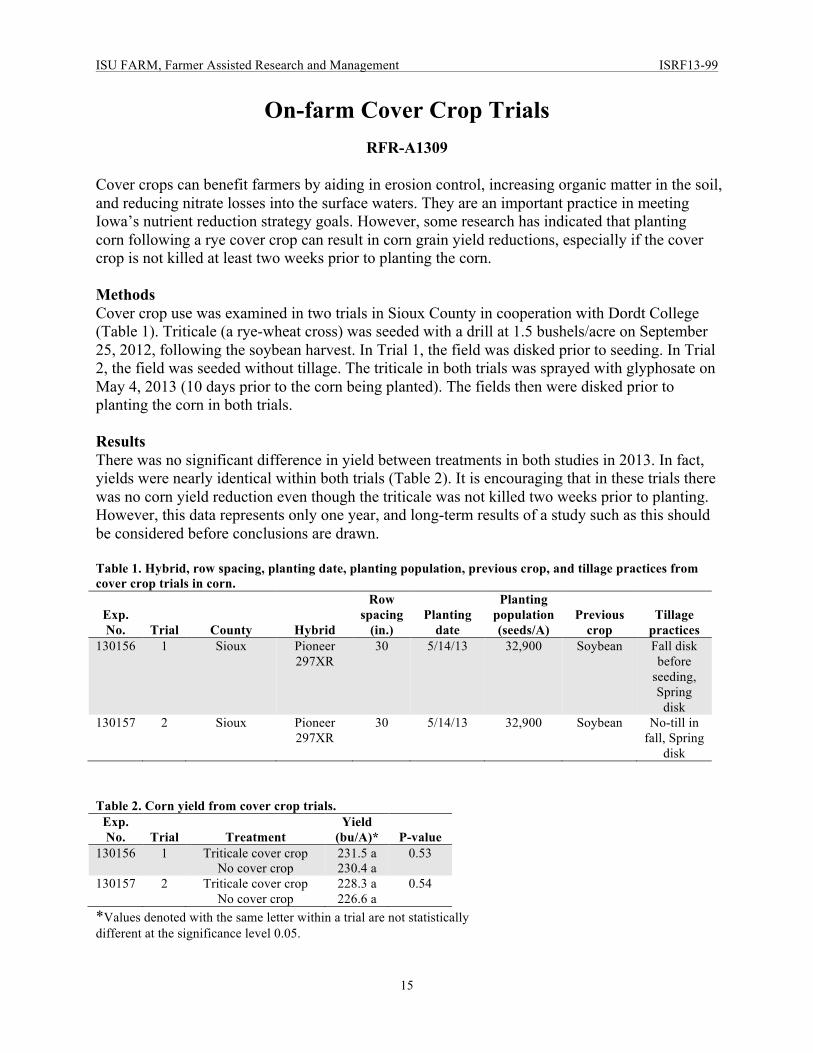
RFR-A1309 Cover crops can benefit farmers by aiding in erosion control, increasing organic matter in the soil, and reducing nitrate losses into the surface waters. They are an important practice in meeting Iowa’s nutrient reduction strategy goals. However, some research has indicated that planting corn following a rye cover crop can result in corn grain yield reductions, especially if the cover crop is not killed at least two weeks prior to planting the corn. Methods Cover crop use was examined in two trials in Sioux County in cooperation with Dordt College (Table 1). Triticale (a rye-wheat cross) was seeded with a drill at 1.5 bushels/acre on September 25, 2012, following the soybean harvest. In Trial 1, the field was disked prior to seeding. In Trial 2, the field was seeded without tillage. The triticale in both trials was sprayed with glyphosate on May 4, 2013 (10 days prior to the corn being planted). The fields then were disked prior to planting the corn in both trials. Results There was no significant difference in yield between treatments in both studies in 2013. In fact, yields were nearly identical within both trials (Table 2). It is encouraging that in these trials there was no corn yield reduction even though the triticale was not killed two weeks prior to planting. However, this data represents only one year, and long-term results of a study such as this should be considered before conclusions are drawn. Table 1. Hybrid, row spacing, planting date, planting population, previous crop, and tillage practices from cover crop trials in corn.
Exp. No. Trial County Hybrid
Row spacing
(in.) Planting
date
Planting population (seeds/A)
Previous crop
Tillage practices
130156 1 Sioux Pioneer 297XR
30 5/14/13 32,900 Soybean Fall disk before
seeding, Spring
disk 130157 2 Sioux Pioneer
297XR 30 5/14/13 32,900 Soybean No-till in
fall, Spring disk
Table 2. Corn yield from cover crop trials.
Exp. No. Trial Treatment
Yield (bu/A)* P-value
130156
1
Triticale cover crop No cover crop
231.5 a 230.4 a
0.53
130157
2
Triticale cover crop No cover crop
228.3 a 226.6 a
0.54
*Values denoted with the same letter within a trial are not statistically different at the significance level 0.05.
ISU FARM, Farmer Assisted Research and Management ISRF13-99
16
On-farm Corn Fertilizer and Related-Product Trials
RFR-A1310
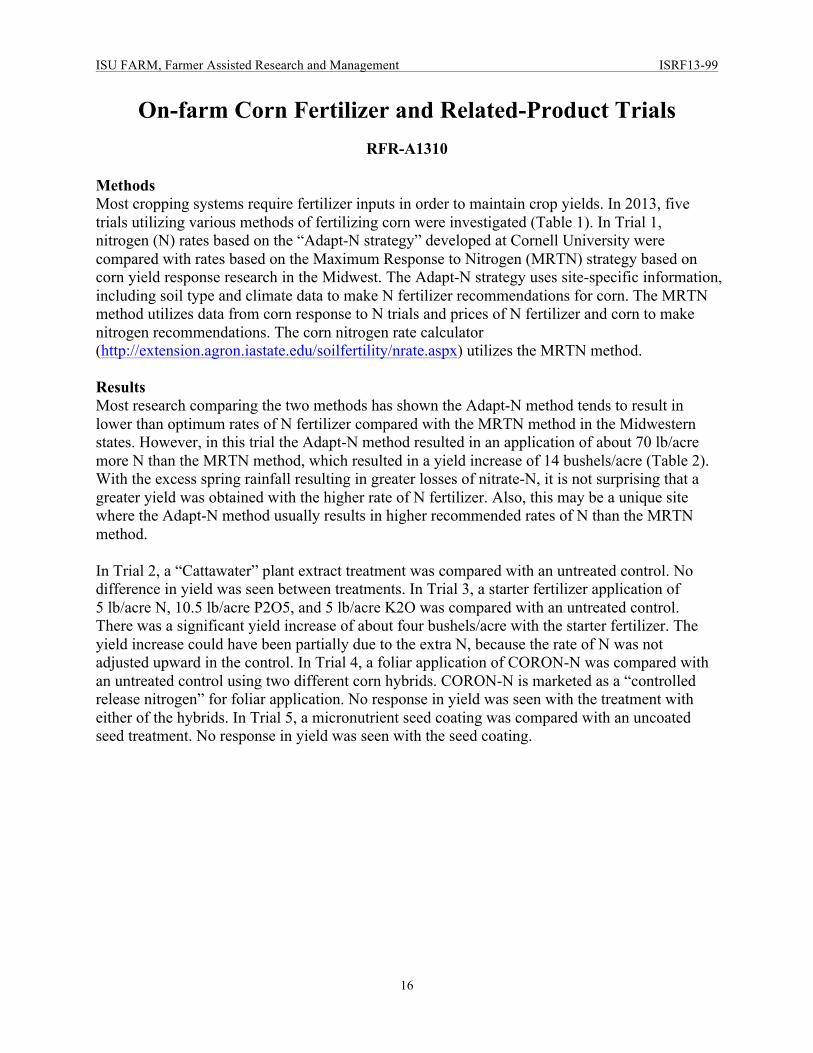
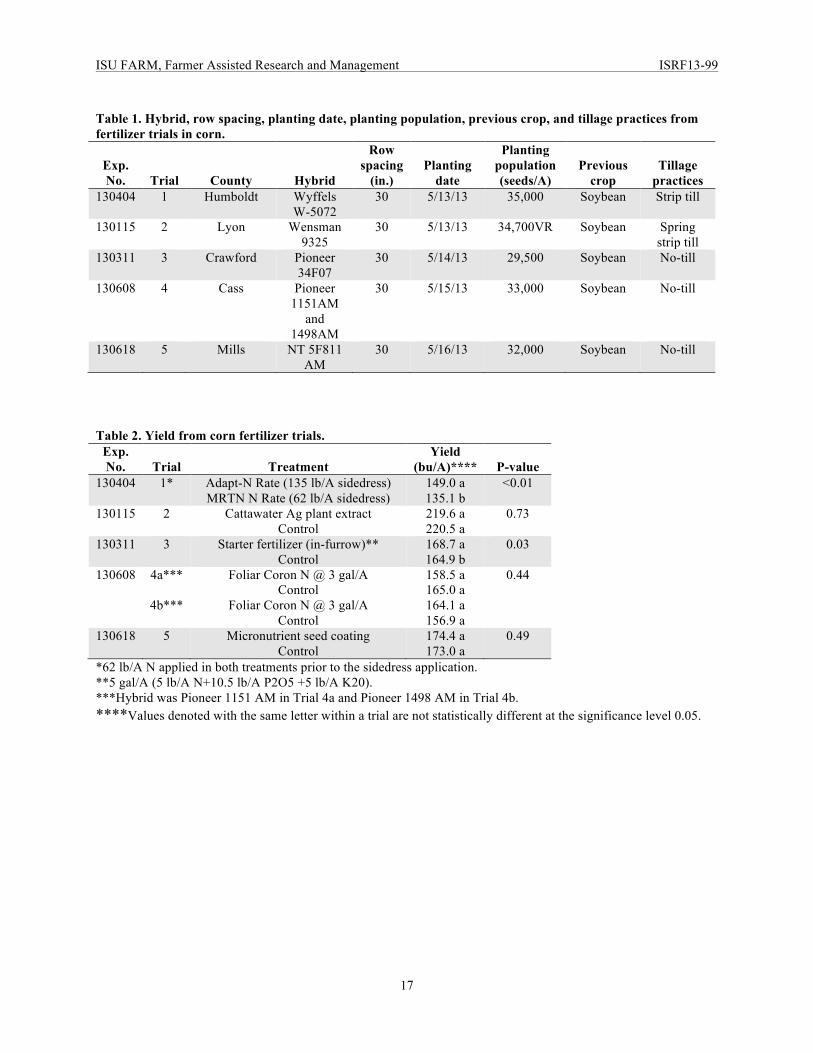
Methods Most cropping systems require fertilizer inputs in order to maintain crop yields. In 2013, five trials utilizing various methods of fertilizing corn were investigated (Table 1). In Trial 1, nitrogen (N) rates based on the “Adapt-N strategy” developed at Cornell University were compared with rates based on the Maximum Response to Nitrogen (MRTN) strategy based on corn yield response research in the Midwest. The Adapt-N strategy uses site-specific information, including soil type and climate data to make N fertilizer recommendations for corn. The MRTN method utilizes data from corn response to N trials and prices of N fertilizer and corn to make nitrogen recommendations. The corn nitrogen rate calculator (http://extension.agron.iastate.edu/soilfertility/nrate.aspx) utilizes the MRTN method. Results Most research comparing the two methods has shown the Adapt-N method tends to result in lower than optimum rates of N fertilizer compared with the MRTN method in the Midwestern states. However, in this trial the Adapt-N method resulted in an application of about 70 lb/acre more N than the MRTN method, which resulted in a yield increase of 14 bushels/acre (Table 2). With the excess spring rainfall resulting in greater losses of nitrate-N, it is not surprising that a greater yield was obtained with the higher rate of N fertilizer. Also, this may be a unique site where the Adapt-N method usually results in higher recommended rates of N than the MRTN method. In Trial 2, a “Cattawater” plant extract treatment was compared with an untreated control. No difference in yield was seen between treatments. In Trial 3, a starter fertilizer application of 5 lb/acre N, 10.5 lb/acre P2O5, and 5 lb/acre K2O was compared with an untreated control. There was a significant yield increase of about four bushels/acre with the starter fertilizer. The yield increase could have been partially due to the extra N, because the rate of N was not adjusted upward in the control. In Trial 4, a foliar application of CORON-N was compared with an untreated control using two different corn hybrids. CORON-N is marketed as a “controlled release nitrogen” for foliar application. No response in yield was seen with the treatment with either of the hybrids. In Trial 5, a micronutrient seed coating was compared with an uncoated seed treatment. No response in yield was seen with the seed coating.
ISU FARM, Farmer Assisted Research and Management ISRF13-99
17
Table 1. Hybrid, row spacing, planting date, planting population, previous crop, and tillage practices from fertilizer trials in corn.
Exp. No. Trial County Hybrid
Row spacing
(in.) Planting
date
Planting population (seeds/A)
Previous crop
Tillage practices
130404 1 Humboldt Wyffels W-5072
30 5/13/13 35,000 Soybean Strip till
130115 2 Lyon Wensman 9325
30 5/13/13 34,700VR Soybean Spring strip till
130311 3 Crawford Pioneer 34F07
30 5/14/13 29,500 Soybean No-till
130608 4 Cass Pioneer 1151AM
and 1498AM
30 5/15/13 33,000 Soybean No-till
130618 5 Mills NT 5F811 AM
30 5/16/13 32,000 Soybean No-till
Table 2. Yield from corn fertilizer trials.
Exp. No. Trial Treatment
Yield (bu/A)**** P-value
130404
1*
Adapt-N Rate (135 lb/A sidedress) MRTN N Rate (62 lb/A sidedress)
149.0 a 135.1 b
<0.01
130115
2
Cattawater Ag plant extract Control
219.6 a 220.5 a
0.73
130311
3
Starter fertilizer (in-furrow)** Control
168.7 a 164.9 b
0.03
130608
4a***
4b***
Foliar Coron N @ 3 gal/A Control
Foliar Coron N @ 3 gal/A Control
158.5 a 165.0 a 164.1 a 156.9 a
0.44
130618
5
Micronutrient seed coating Control
174.4 a 173.0 a
0.49
*62 lb/A N applied in both treatments prior to the sidedress application. **5 gal/A (5 lb/A N+10.5 lb/A P2O5 +5 lb/A K20). ***Hybrid was Pioneer 1151 AM in Trial 4a and Pioneer 1498 AM in Trial 4b. ****Values denoted with the same letter within a trial are not statistically different at the significance level 0.05.
ISU FARM, Farmer Assisted Research and Management ISRF13-99
18
On-farm Corn Seed Treatment Trials
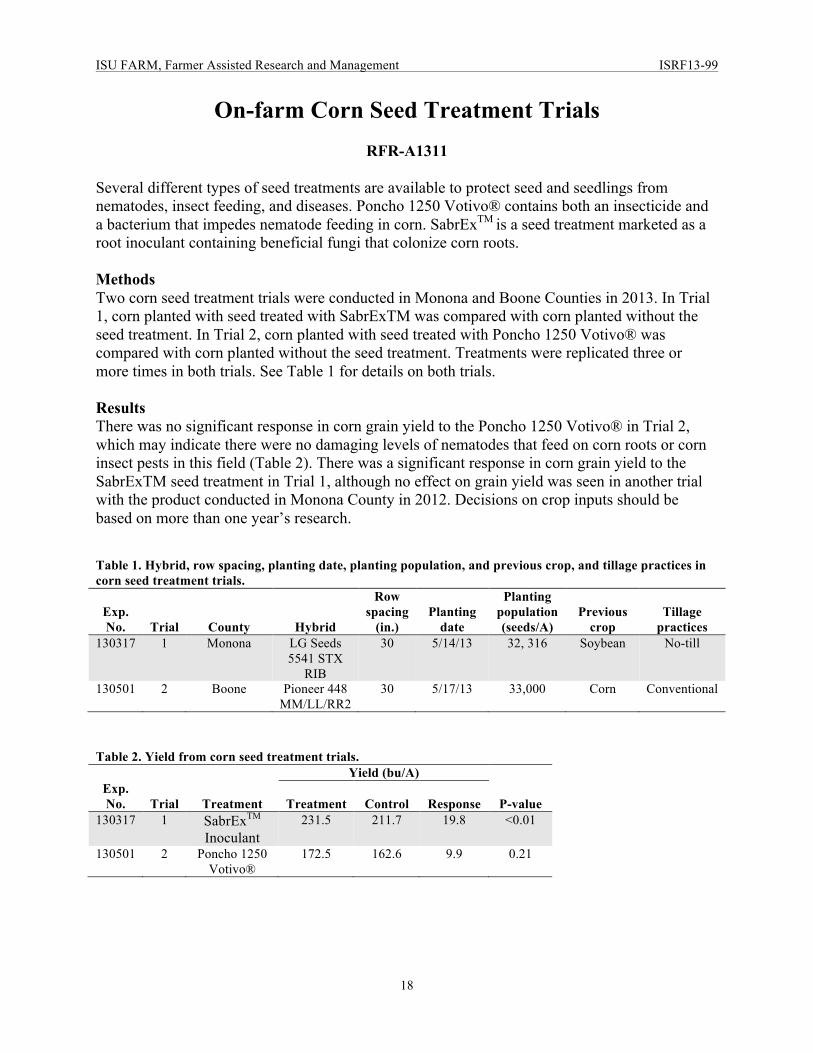
RFR-A1311 Several different types of seed treatments are available to protect seed and seedlings from nematodes, insect feeding, and diseases. Poncho 1250 Votivo® contains both an insecticide and a bacterium that impedes nematode feeding in corn. SabrExTM is a seed treatment marketed as a root inoculant containing beneficial fungi that colonize corn roots. Methods Two corn seed treatment trials were conducted in Monona and Boone Counties in 2013. In Trial 1, corn planted with seed treated with SabrExTM was compared with corn planted without the seed treatment. In Trial 2, corn planted with seed treated with Poncho 1250 Votivo® was compared with corn planted without the seed treatment. Treatments were replicated three or more times in both trials. See Table 1 for details on both trials. Results There was no significant response in corn grain yield to the Poncho 1250 Votivo® in Trial 2, which may indicate there were no damaging levels of nematodes that feed on corn roots or corn insect pests in this field (Table 2). There was a significant response in corn grain yield to the SabrExTM seed treatment in Trial 1, although no effect on grain yield was seen in another trial with the product conducted in Monona County in 2012. Decisions on crop inputs should be based on more than one year’s research. Table 1. Hybrid, row spacing, planting date, planting population, and previous crop, and tillage practices in corn seed treatment trials.
Exp. No. Trial County Hybrid
Row spacing
(in.) Planting
date
Planting population (seeds/A)
Previous crop
Tillage practices
130317 1 Monona LG Seeds 5541 STX
RIB
30 5/14/13 32, 316 Soybean No-till
130501 2 Boone Pioneer 448 MM/LL/RR2
30 5/17/13 33,000 Corn Conventional
Table 2. Yield from corn seed treatment trials.
Yield (bu/A) Exp. No. Trial Treatment Treatment Control Response P-value
130317 1 SabrExTM Inoculant
231.5 211.7 19.8 <0.01
130501 2 Poncho 1250 Votivo®
172.5 162.6 9.9 0.21
ISU FARM, Farmer Assisted Research and Management ISRF13-99
19
On-farm Corn Rootworm Trials
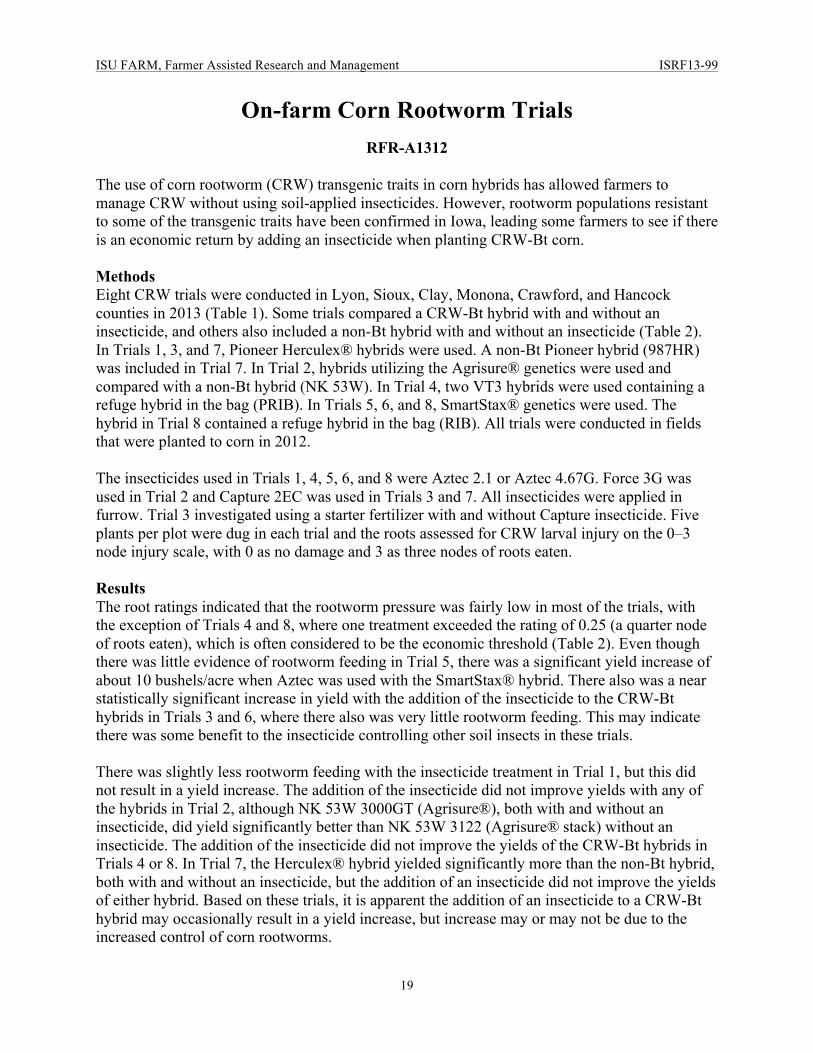
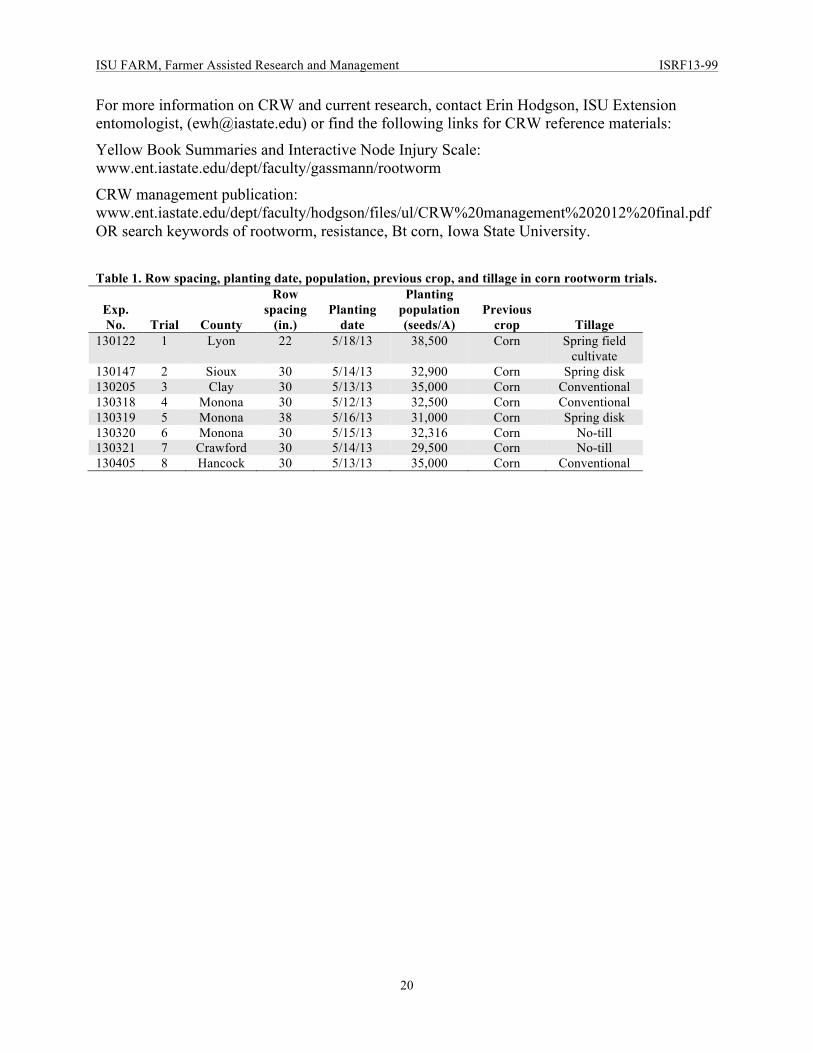
RFR-A1312 The use of corn rootworm (CRW) transgenic traits in corn hybrids has allowed farmers to manage CRW without using soil-applied insecticides. However, rootworm populations resistant to some of the transgenic traits have been confirmed in Iowa, leading some farmers to see if there is an economic return by adding an insecticide when planting CRW-Bt corn. Methods Eight CRW trials were conducted in Lyon, Sioux, Clay, Monona, Crawford, and Hancock counties in 2013 (Table 1). Some trials compared a CRW-Bt hybrid with and without an insecticide, and others also included a non-Bt hybrid with and without an insecticide (Table 2). In Trials 1, 3, and 7, Pioneer Herculex® hybrids were used. A non-Bt Pioneer hybrid (987HR) was included in Trial 7. In Trial 2, hybrids utilizing the Agrisure® genetics were used and compared with a non-Bt hybrid (NK 53W). In Trial 4, two VT3 hybrids were used containing a refuge hybrid in the bag (PRIB). In Trials 5, 6, and 8, SmartStax® genetics were used. The hybrid in Trial 8 contained a refuge hybrid in the bag (RIB). All trials were conducted in fields that were planted to corn in 2012. The insecticides used in Trials 1, 4, 5, 6, and 8 were Aztec 2.1 or Aztec 4.67G. Force 3G was used in Trial 2 and Capture 2EC was used in Trials 3 and 7. All insecticides were applied in furrow. Trial 3 investigated using a starter fertilizer with and without Capture insecticide. Five plants per plot were dug in each trial and the roots assessed for CRW larval injury on the 0–3 node injury scale, with 0 as no damage and 3 as three nodes of roots eaten. Results The root ratings indicated that the rootworm pressure was fairly low in most of the trials, with the exception of Trials 4 and 8, where one treatment exceeded the rating of 0.25 (a quarter node of roots eaten), which is often considered to be the economic threshold (Table 2). Even though there was little evidence of rootworm feeding in Trial 5, there was a significant yield increase of about 10 bushels/acre when Aztec was used with the SmartStax® hybrid. There also was a near statistically significant increase in yield with the addition of the insecticide to the CRW-Bt hybrids in Trials 3 and 6, where there also was very little rootworm feeding. This may indicate there was some benefit to the insecticide controlling other soil insects in these trials. There was slightly less rootworm feeding with the insecticide treatment in Trial 1, but this did not result in a yield increase. The addition of the insecticide did not improve yields with any of the hybrids in Trial 2, although NK 53W 3000GT (Agrisure®), both with and without an insecticide, did yield significantly better than NK 53W 3122 (Agrisure® stack) without an insecticide. The addition of the insecticide did not improve the yields of the CRW-Bt hybrids in Trials 4 or 8. In Trial 7, the Herculex® hybrid yielded significantly more than the non-Bt hybrid, both with and without an insecticide, but the addition of an insecticide did not improve the yields of either hybrid. Based on these trials, it is apparent the addition of an insecticide to a CRW-Bt hybrid may occasionally result in a yield increase, but increase may or may not be due to the increased control of corn rootworms.
ISU FARM, Farmer Assisted Research and Management ISRF13-99
20
For more information on CRW and current research, contact Erin Hodgson, ISU Extension entomologist, ([email protected]) or find the following links for CRW reference materials:
Yellow Book Summaries and Interactive Node Injury Scale: www.ent.iastate.edu/dept/faculty/gassmann/rootworm
CRW management publication: www.ent.iastate.edu/dept/faculty/hodgson/files/ul/CRW%20management%202012%20final.pdf OR search keywords of rootworm, resistance, Bt corn, Iowa State University. Table 1. Row spacing, planting date, population, previous crop, and tillage in corn rootworm trials.
Exp. No. Trial County
Row spacing
(in.) Planting
date
Planting population (seeds/A)
Previous crop Tillage
130122 1 Lyon 22 5/18/13 38,500 Corn Spring field cultivate
130147 2 Sioux 30 5/14/13 32,900 Corn Spring disk 130205 3 Clay 30 5/13/13 35,000 Corn Conventional 130318 4 Monona 30 5/12/13 32,500 Corn Conventional 130319 5 Monona 38 5/16/13 31,000 Corn Spring disk 130320 6 Monona 30 5/15/13 32,316 Corn No-till 130321 7 Crawford 30 5/14/13 29,500 Corn No-till 130405 8 Hancock 30 5/13/13 35,000 Corn Conventional

ISU FARM, Farmer Assisted Research and Management ISRF13-99
21
Table 2. Treatments, root feeding, and yield in corn rootworm trials.
Exp. No. Trial Treatments
Insecticide (Y/N)*
Root injury
rating** Yield
(bu/A)** P-Value 130122
1
Pioneer 0062 AMX RIB (Herculex®) Pioneer 0062 AMX RIB (Herculex®)
Y N
0.06 a 0.16 b
198.8 a 199.3 a
0.73
130147 2 NK 53W 3000GT (Agrisure®) NK 53W 3000GT (Agrisure®)
NK 53W 3122 (Agrisure® stack) NK 53W 3122 (Agrisure® stack)
NK 53W3 (non-Bt) NK 53W3 (non-Bt)
Y N Y N Y N
0.01 c 0.04 bc 0.01 c 0.02 c
0.11 ab 0.18 a
214.4 a 210.7 ab 205.0 bc 197.9 c
207.2 ab 202.8 bc
<0.01
130205
3
Pioneer 528AMX (Herculex®) Pioneer 528AMX (Herculex®) + 4
gal/A 6-24-6 starter fertilizer Pioneer 528AMX (Herculex®) + 4
gal/A 6-24-6 starter fertilizer
N
N
Y
0.11 a
0.10 a
0.10 a
197.6 a
197.4 a
202.1 a
0.08
130318
4
LG2620 (VT3 PRIB) LG2602 (VT3 PRIB) LG2602 (VT3 PRIB) LG2620 (VT3 PRIB)
Y Y N N
0.01 b 0.08 ab 0.36 a
0.13 ab
232.7 a 226.9 ab 219.9 b 230.2 ab
0.03
130319
5
DK 6333SSLL (SmartStax®) DK 6333SSLL (SmartStax®)
Y N
0.01 a 0.05 a
222.2 a 212.3 b
<0.01
130320 6 Renze seeds 3240SST (SmartStax®) Renze seeds 3240SST (SmartStax®)
Y N
0.01 a 0.03 a
145.9 a 130.9 a
0.06
130321 7 Pioneer 987HR (non-Bt) Pioneer 987AM1 (Herculex®) Pioneer 987AM1 (Herculex®)
Pioneer 987HR (non-Bt)
Y Y N N
0.01 a 0.01 a 0.03 a 0.05 a
178.8 b 187.4 a 188.9 a 176.1 b
<0.01
130405
8
DKC 53-78 RIB (SmartStax®) DKC 53-78 RIB (SmartStax®)
Y N
0.16 a 0.43 a
205.1 a 198.5 a
0.24
*Aztec 4.67G (2 oz/1,000 ft of row) was used in Trial 1, Force (5 oz/1,000 ft of row) in Trial 2, Capture @ 8 oz/A in Trial 3, Aztec 4.67G @ 3 lb/A in furrow in Trial 4, Aztec 2.1G (3.8 lb/A–¾ rate) in furrow in Trial 5, Aztec 2.1G at 7.3 lb/A in furrow (full rate) in Trial 6, Capture 2EC at 7.5 oz/A in furrow in Trial 7, and Aztec 2.1G @ 6.7 oz/1,000 ft of row in furrow in Trial 8. **Values denoted with the same letter within a trial are not statistically different at the significance level 0.05.

ISU FARM, Farmer Assisted Research and Management ISRF13-99
22
On-farm Corn Fungicide Trials
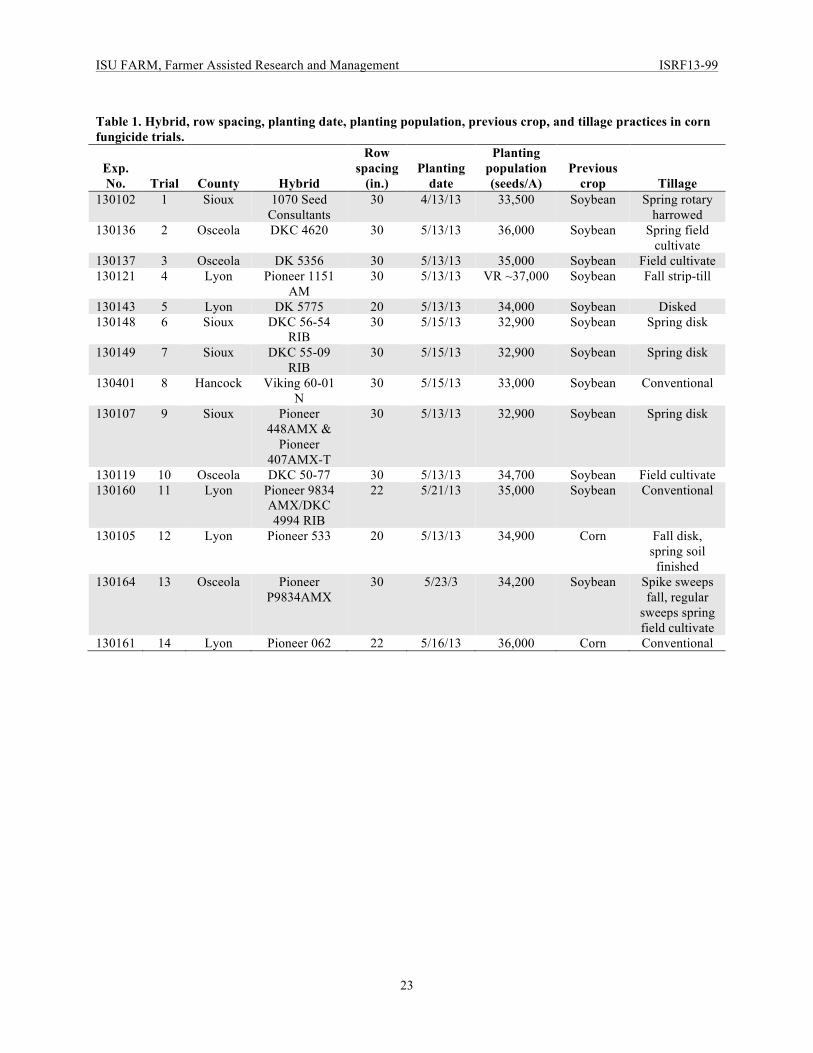
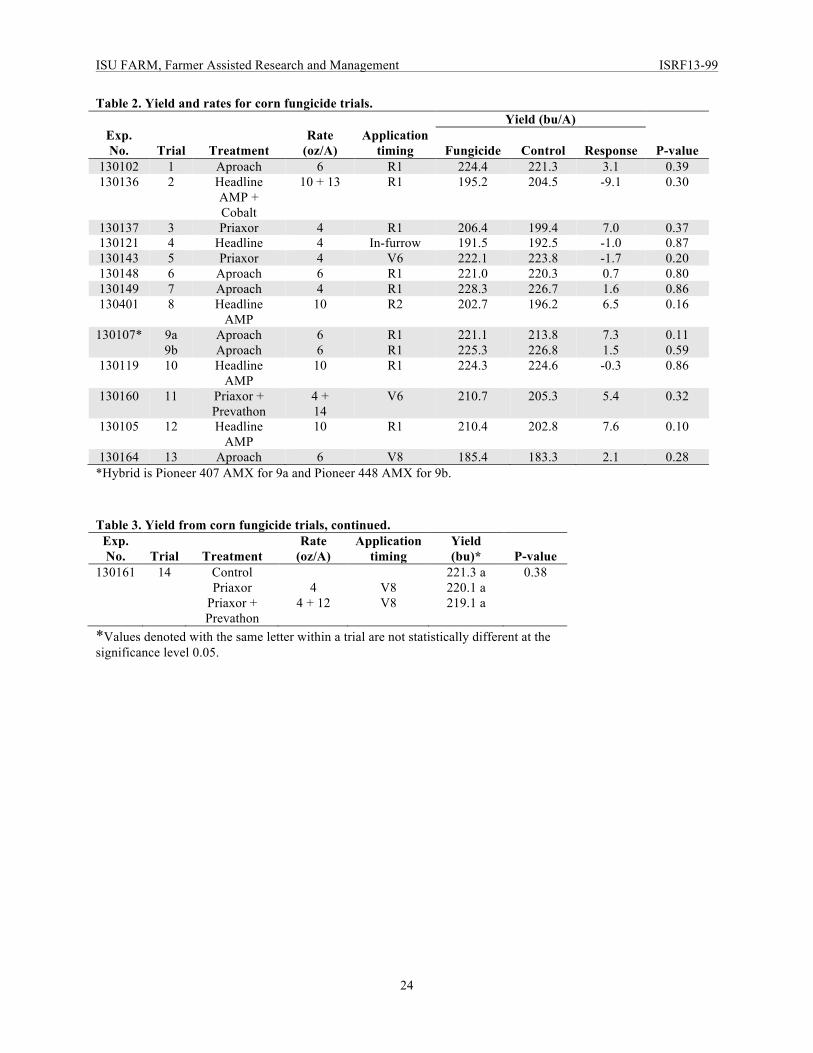
RFR-A1313 In 2013, there were 14 on-farm trials in Iowa that evaluated the effect of fungicide on corn yield. Application of fungicide to corn has become a popular input with many farmers in Iowa. The effect of fungicide on corn yield, however, can vary from year to year. Annual corn fungicide trials offer insight into how fungicides perform each year. Environmental conditions, such as rainfall and temperature, likely are the main factors for differences in how a fungicide affects corn yield because these factors influence disease and crop development. Because environmental conditions vary from one year to the next, it is difficult to predict how and when to use a fungicide. Compilation of trial data over multiple years could help identify factors associated with fungicide response in corn. Methods All fungicide trials examined a range of timings and products. All fungicides were applied with ground equipment, except Trials 2 and 12, which were applied by air. Ten trials examined applications of fungicide primarily at silking (R1) compared with an untreated control. The insecticide Cobalt® was included with the fungicide in Trial 2. Three trials examined the application of fungicide at V6-V8 compared with an untreated control. One trial examined the application of fungicide at planting (in-furrow) compared with an untreated control, and one trial compared the application of Priaxor® at V8 with an application of Priaxor® plus the insecticide Prevathon® at V8 compared with an untreated control. Fungicide products used in these studies included Aproach®, Headline®, Headline AMP®, and Priaxor®. Evaluations of foliar diseases were not made in the majority of the trials. All trials had a minimum of three replications. See Table 1 for more information on field data and Tables 2 and 3 for rates. Results Over all 14 trials, there was no significant increase in corn yield with any of the fungicide treatments (Table 2 and 3). However, there were two trials (9a and 12) where there was a yield increase of about seven bushels/acre with the fungicide applied at R1 that approached statistical significance (P≤ 0.11). The average response to the fungicide treatment across the trials was +1.7 bushels/acre. With a corn price of around $4/bushel, it would take a yield increase of about 6-7 bushels/acre to pay for the fungicide application, so the fungicide application likely was not profitable this year in any of the trials. Although evaluations of foliar disease were not made in most of the trials, disease pressure was minimal in the trials where it was evaluated, which probably explains the lack of response to the fungicide in this year’s trials. The dry weather in mid-late summer over much of the state was not conducive to disease development. Most fungal pathogens require a significant amount of available moisture to sporulate and infect a leaf. In the absence of foliar disease, there likely was little justification to apply a fungicide to protect the yield in 2013.
ISU FARM, Farmer Assisted Research and Management ISRF13-99
23
Table 1. Hybrid, row spacing, planting date, planting population, previous crop, and tillage practices in corn fungicide trials.
Exp. No. Trial County Hybrid
Row spacing
(in.) Planting
date
Planting population (seeds/A)
Previous crop Tillage
130102 1 Sioux 1070 Seed Consultants
30 4/13/13 33,500 Soybean Spring rotary harrowed
130136 2 Osceola DKC 4620 30 5/13/13 36,000 Soybean Spring field cultivate
130137 3 Osceola DK 5356 30 5/13/13 35,000 Soybean Field cultivate 130121 4 Lyon Pioneer 1151
AM 30 5/13/13 VR ~37,000 Soybean Fall strip-till
130143 5 Lyon DK 5775 20 5/13/13 34,000 Soybean Disked 130148 6 Sioux DKC 56-54
RIB 30 5/15/13 32,900 Soybean Spring disk
130149 7 Sioux DKC 55-09 RIB
30 5/15/13 32,900 Soybean Spring disk
130401 8 Hancock Viking 60-01 N
30 5/15/13 33,000 Soybean Conventional
130107 9 Sioux Pioneer 448AMX &
Pioneer 407AMX-T
30 5/13/13 32,900 Soybean Spring disk
130119 10 Osceola DKC 50-77 30 5/13/13 34,700 Soybean Field cultivate 130160 11 Lyon Pioneer 9834
AMX/DKC 4994 RIB
22 5/21/13 35,000 Soybean Conventional
130105 12 Lyon Pioneer 533 20 5/13/13 34,900 Corn Fall disk, spring soil finished
130164 13 Osceola Pioneer P9834AMX
30 5/23/3 34,200 Soybean Spike sweeps fall, regular
sweeps spring field cultivate
130161 14 Lyon Pioneer 062 22 5/16/13 36,000 Corn Conventional
ISU FARM, Farmer Assisted Research and Management ISRF13-99
24
Table 2. Yield and rates for corn fungicide trials. Yield (bu/A)
Exp. No. Trial Treatment
Rate (oz/A)
Application timing Fungicide Control Response P-value
130102 1 Aproach 6 R1 224.4 221.3 3.1 0.39 130136
2
Headline AMP + Cobalt
10 + 13 R1
195.2
204.5
-9.1
0.30
130137 3 Priaxor 4 R1 206.4 199.4 7.0 0.37 130121 4 Headline 4 In-furrow 191.5 192.5 -1.0 0.87 130143 5 Priaxor 4 V6 222.1 223.8 -1.7 0.20 130148 6 Aproach 6 R1 221.0 220.3 0.7 0.80 130149 7 Aproach 4 R1 228.3 226.7 1.6 0.86 130401
8
Headline AMP
10 R2
202.7
196.2
6.5
0.16
130107*
9a 9b
Aproach Aproach
6 6
R1 R1
221.1 225.3
213.8 226.8
7.3 1.5
0.11 0.59
130119 10 Headline AMP
10 R1 224.3 224.6 -0.3 0.86
130160 11 Priaxor + Prevathon
4 + 14
V6 210.7 205.3 5.4 0.32
130105
12
Headline AMP
10 R1
210.4
202.8
7.6
0.10
130164 13 Aproach 6 V8 185.4 183.3 2.1 0.28 *Hybrid is Pioneer 407 AMX for 9a and Pioneer 448 AMX for 9b. Table 3. Yield from corn fungicide trials, continued.
Exp. No. Trial Treatment
Rate (oz/A)
Application timing
Yield (bu)* P-value
130161
14
Control Priaxor
Priaxor + Prevathon
4
4 + 12 V8 V8
221.3 a 220.1 a 219.1 a
0.38
*Values denoted with the same letter within a trial are not statistically different at the significance level 0.05.
ISU FARM, Farmer Assisted Research and Management ISRF13-99
25
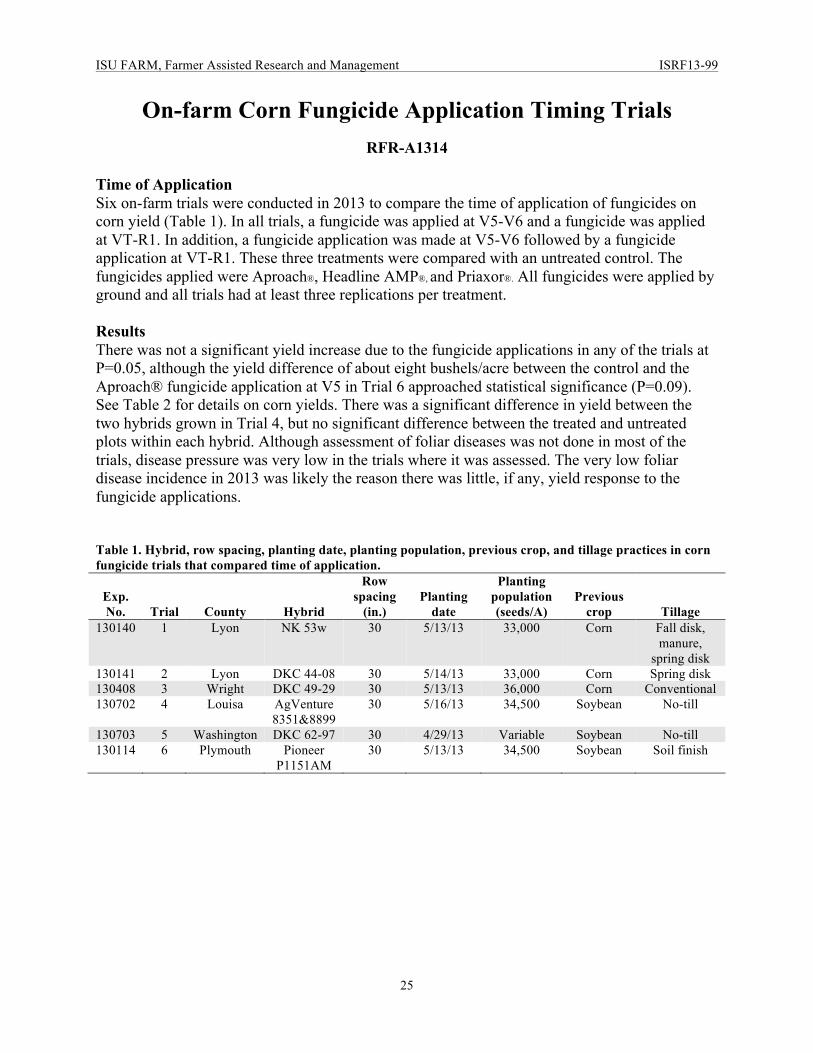
On-farm Corn Fungicide Application Timing Trials
RFR-A1314 Time of Application Six on-farm trials were conducted in 2013 to compare the time of application of fungicides on corn yield (Table 1). In all trials, a fungicide was applied at V5-V6 and a fungicide was applied at VT-R1. In addition, a fungicide application was made at V5-V6 followed by a fungicide application at VT-R1. These three treatments were compared with an untreated control. The fungicides applied were Aproach®, Headline AMP®, and Priaxor®. All fungicides were applied by ground and all trials had at least three replications per treatment. Results There was not a significant yield increase due to the fungicide applications in any of the trials at P=0.05, although the yield difference of about eight bushels/acre between the control and the Aproach® fungicide application at V5 in Trial 6 approached statistical significance (P=0.09). See Table 2 for details on corn yields. There was a significant difference in yield between the two hybrids grown in Trial 4, but no significant difference between the treated and untreated plots within each hybrid. Although assessment of foliar diseases was not done in most of the trials, disease pressure was very low in the trials where it was assessed. The very low foliar disease incidence in 2013 was likely the reason there was little, if any, yield response to the fungicide applications. Table 1. Hybrid, row spacing, planting date, planting population, previous crop, and tillage practices in corn fungicide trials that compared time of application.
Exp. No. Trial County Hybrid
Row spacing
(in.) Planting
date
Planting population (seeds/A)
Previous crop Tillage
130140 1 Lyon NK 53w 30 5/13/13 33,000 Corn Fall disk, manure,
spring disk 130141 2 Lyon DKC 44-08 30 5/14/13 33,000 Corn Spring disk 130408 3 Wright DKC 49-29 30 5/13/13 36,000 Corn Conventional 130702 4 Louisa AgVenture
8351&8899 30 5/16/13 34,500 Soybean No-till
130703 5 Washington DKC 62-97 30 4/29/13 Variable Soybean No-till 130114 6 Plymouth Pioneer
P1151AM 30 5/13/13 34,500 Soybean Soil finish

ISU FARM, Farmer Assisted Research and Management ISRF13-99
26
Table 2. Corn yield from fungicide trials that compared time of application.
Exp. No. Trial Treatment
Yield (bu/A)**
P-Value
130140
1
Control Priaxor @ 4 oz/A at V6 Headline AMP @ 10 oz/A at R1 Priaxor @ 4 oz/A at V6 followed by Headline AMP @ 10 oz/A at R1
183.7 a 186.2 a 187.6 a
187.7 a
0.65
130141
2
Control Priaxor @ 4 oz/A at V6 Headline AMP @ 10 oz/A at R1 Priaxor @ 4 oz/A at V6 followed by Headline AMP @ 10 oz/A at R1
195.1 a 200.1 a 196.5 a
201.1 a
0.44
130408
3
Control Priaxor @ 4 oz/A at V6 Headline AMP @ 10 oz/A at R1 Priaxor @ 4 oz/A at V6 followed by Headline AMP @ 10 oz/A at R1
199.6 a 198.3 a 200.2 a
195.5 a
0.50
130702
4a*
4b*
Control Headline AMP @ 10 oz/A at VT Priaxor @ 4 oz/A at V6 followed by Headline AMP @ 10 oz/A at VT Control Headline AMP @ 10 oz/A at VT Priaxor @ 4 oz/A at V6 followed by Headline AMP @ 10 oz/A at VT
193.2 a 195.6 a
197.4 a 161.5 b 164.0 b
165.7 b
<0.01
130703
5
Control Headline AMP @ 10 oz/A at VT Priaxor @ 4 oz/A at V6 followed by Headline AMP @ 10 oz/A at VT
213.8 a 215.0 a
218.0 a
0.35
130114
6
Control Aproach @ 4 oz/A at V5 Aproach @ 6 oz/A at R1 Aproach @ 4 oz/A at V5 followed by Aproach @ 6 oz/A at R1
222.7 a 230.7 a 221.7 a
227.0 a
0.09
*Hybrid for Trial 4a was AgVenture 8351 and hybrid for Trial 4b was AgVenture 8899. **Values denoted with the same letter within a trial are not statistically different at the significance level 0.05.
ISU FARM, Farmer Assisted Research and Management ISRF13-99
27
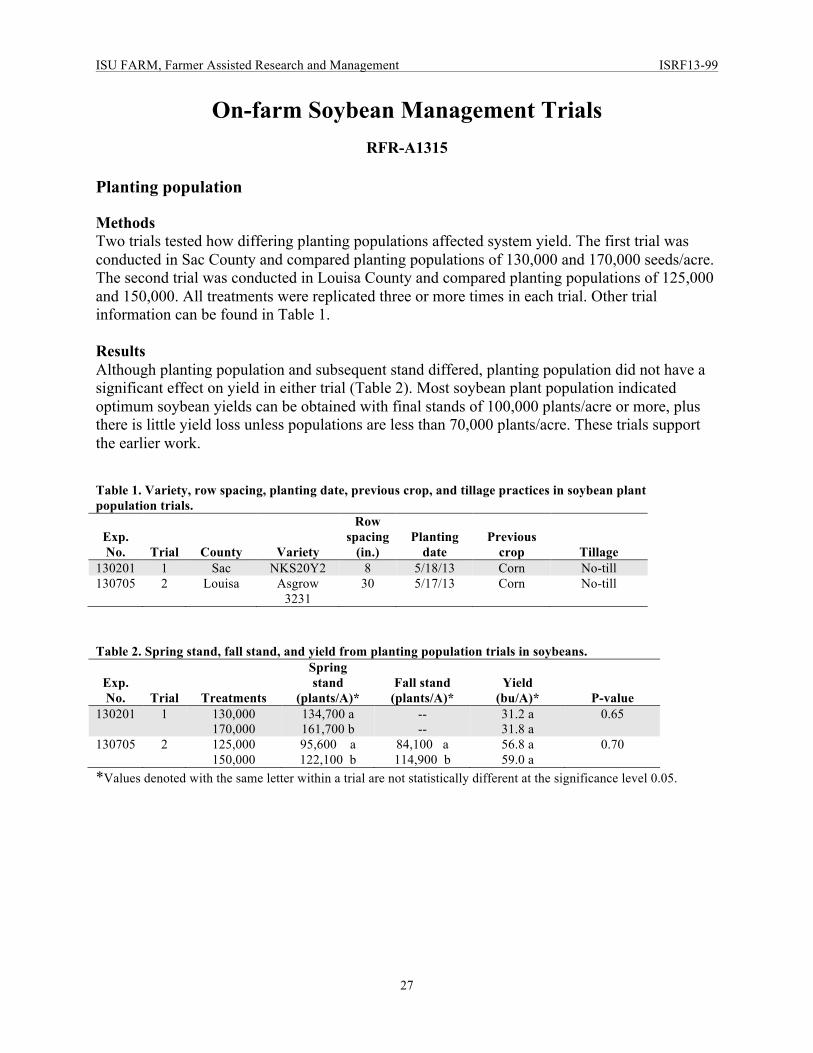
On-farm Soybean Management Trials
RFR-A1315 Planting population Methods Two trials tested how differing planting populations affected system yield. The first trial was conducted in Sac County and compared planting populations of 130,000 and 170,000 seeds/acre. The second trial was conducted in Louisa County and compared planting populations of 125,000 and 150,000. All treatments were replicated three or more times in each trial. Other trial information can be found in Table 1. Results Although planting population and subsequent stand differed, planting population did not have a significant effect on yield in either trial (Table 2). Most soybean plant population indicated optimum soybean yields can be obtained with final stands of 100,000 plants/acre or more, plus there is little yield loss unless populations are less than 70,000 plants/acre. These trials support the earlier work. Table 1. Variety, row spacing, planting date, previous crop, and tillage practices in soybean plant population trials.
Exp. No. Trial County Variety
Row spacing
(in.) Planting
date Previous
crop Tillage 130201 1 Sac NKS20Y2 8 5/18/13 Corn No-till 130705 2 Louisa Asgrow
3231 30 5/17/13 Corn No-till
Table 2. Spring stand, fall stand, and yield from planting population trials in soybeans.
Exp. No. Trial Treatments
Spring stand
(plants/A)* Fall stand
(plants/A)* Yield
(bu/A)* P-value 130201
1
130,000 170,000
134,700 a 161,700 b
-- --
31.2 a 31.8 a
0.65
130705
2
125,000 150,000
95,600 a 122,100 b
84,100 a 114,900 b
56.8 a 59.0 a
0.70
*Values denoted with the same letter within a trial are not statistically different at the significance level 0.05.
ISU FARM, Farmer Assisted Research and Management ISRF13-99
28
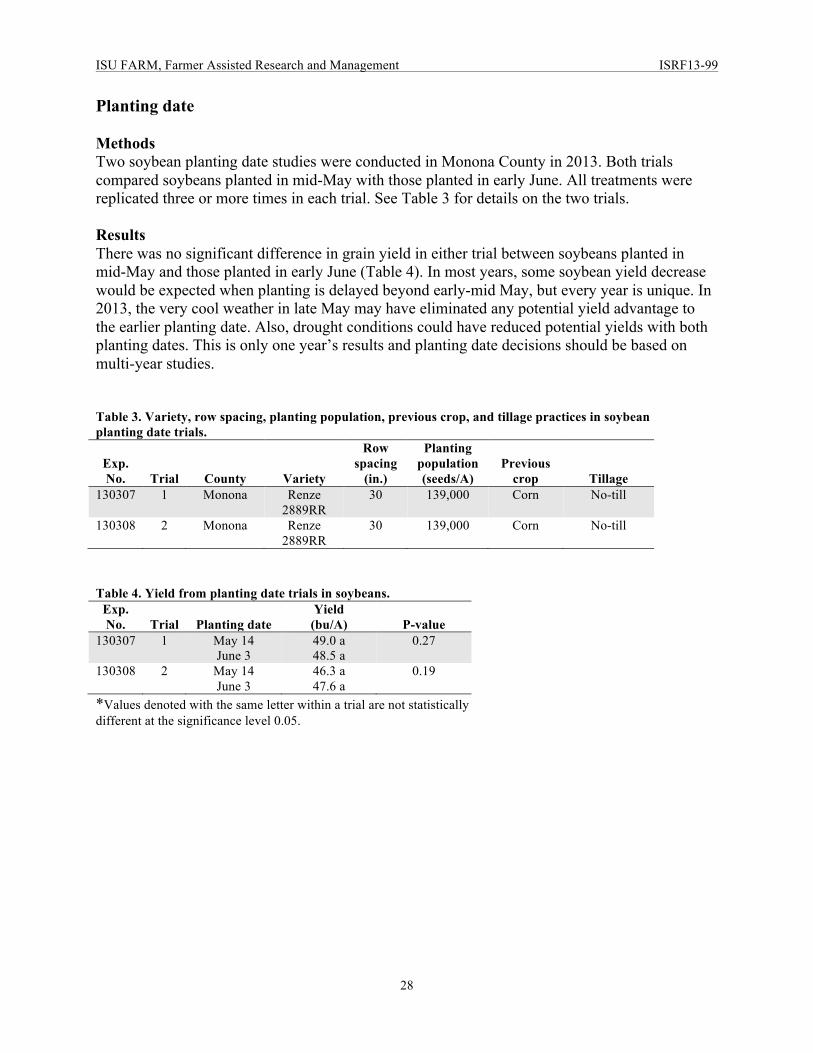
Planting date Methods Two soybean planting date studies were conducted in Monona County in 2013. Both trials compared soybeans planted in mid-May with those planted in early June. All treatments were replicated three or more times in each trial. See Table 3 for details on the two trials. Results There was no significant difference in grain yield in either trial between soybeans planted in mid-May and those planted in early June (Table 4). In most years, some soybean yield decrease would be expected when planting is delayed beyond early-mid May, but every year is unique. In 2013, the very cool weather in late May may have eliminated any potential yield advantage to the earlier planting date. Also, drought conditions could have reduced potential yields with both planting dates. This is only one year’s results and planting date decisions should be based on multi-year studies. Table 3. Variety, row spacing, planting population, previous crop, and tillage practices in soybean planting date trials.
Exp. No. Trial County Variety
Row spacing
(in.)
Planting population (seeds/A)
Previous crop Tillage
130307 1 Monona Renze 2889RR
30 139,000 Corn No-till
130308 2 Monona Renze 2889RR
30 139,000 Corn No-till
Table 4. Yield from planting date trials in soybeans.
Exp. No. Trial Planting date
Yield (bu/A) P-value
130307
1
May 14 June 3
49.0 a 48.5 a
0.27
130308
2
May 14 June 3
46.3 a 47.6 a
0.19
*Values denoted with the same letter within a trial are not statistically different at the significance level 0.05.
ISU FARM, Farmer Assisted Research and Management ISRF13-99
29
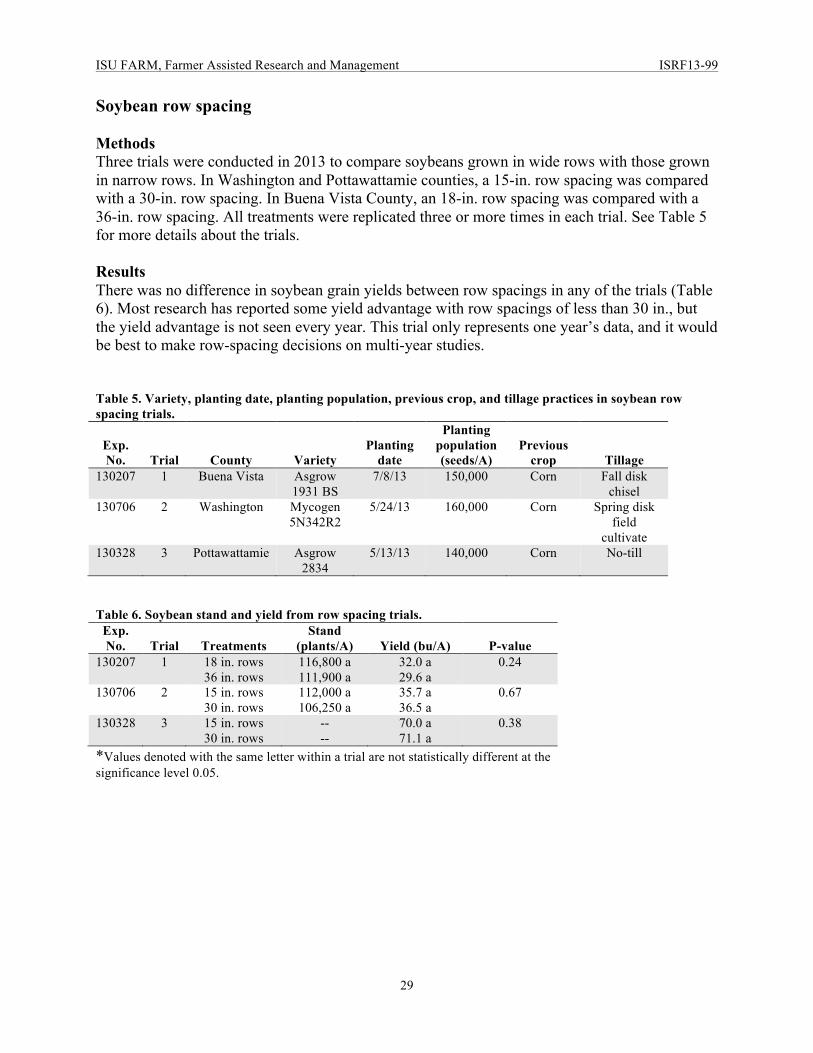
Soybean row spacing Methods Three trials were conducted in 2013 to compare soybeans grown in wide rows with those grown in narrow rows. In Washington and Pottawattamie counties, a 15-in. row spacing was compared with a 30-in. row spacing. In Buena Vista County, an 18-in. row spacing was compared with a 36-in. row spacing. All treatments were replicated three or more times in each trial. See Table 5 for more details about the trials. Results There was no difference in soybean grain yields between row spacings in any of the trials (Table 6). Most research has reported some yield advantage with row spacings of less than 30 in., but the yield advantage is not seen every year. This trial only represents one year’s data, and it would be best to make row-spacing decisions on multi-year studies. Table 5. Variety, planting date, planting population, previous crop, and tillage practices in soybean row spacing trials.
Exp. No. Trial County Variety
Planting date
Planting population (seeds/A)
Previous crop Tillage
130207 1 Buena Vista Asgrow 1931 BS
7/8/13 150,000 Corn Fall disk chisel
130706 2 Washington Mycogen 5N342R2
5/24/13 160,000 Corn Spring disk field
cultivate 130328 3 Pottawattamie Asgrow
2834 5/13/13 140,000 Corn No-till
Table 6. Soybean stand and yield from row spacing trials.
Exp. No. Trial Treatments
Stand (plants/A) Yield (bu/A) P-value
130207
1
18 in. rows 36 in. rows
116,800 a 111,900 a
32.0 a 29.6 a
0.24
130706
2
15 in. rows 30 in. rows
112,000 a 106,250 a
35.7 a 36.5 a
0.67
130328
3
15 in. rows 30 in. rows
-- --
70.0 a 71.1 a
0.38
*Values denoted with the same letter within a trial are not statistically different at the significance level 0.05.

ISU FARM, Farmer Assisted Research and Management ISRF13-99
30
On-farm Soybean Tillage Trials
RFR-A1316 Methods In 2013, ISU FARM conducted two trials in Pottawattamie County that investigated the effect of various tillage systems on soybean grain yield. In Trial 1, a fall vertical tillage system and a fall disking were compared with a no-till system. In Trial 2, a fall vertical tillage system was compared with no-till. Vertical tillage systems are marketed as systems that lightly till the soil while leaving most of the crop residue on the surface. All treatments were replicated three or more times in each trial. Details of the trials can be found in Table 1. Results There was no significant difference in soybean grain yield among any of the tillage systems in either trial (Table 2). This agrees with much of the earlier work done in the Midwest showing very little difference in soybean yields with different tillage systems. Table 1. Variety, row spacing, planting date, planting population, and previous crop from vertical tillage trials in soybean.
Exp. No. Trial County Variety
Row spacing
(in.) Planting
date
Planting population (seeds/A)
Previous crop
130604 1 Pottawattamie Pioneer 31M11
15 5/12/13 165,000 Corn
130605 2 Pottawattamie Asgrow 2931
7.5 5/24/13 165,000 Corn
Table 2. Yield from soybean tillage trials.
Exp. No. Trial Treatment
Yield (bu/A)* P-value
130604
1
Fall vertical tillage Fall disk No-till
71.7 a 70.0 a 68.8 a
0.57
130605
2
No-till Fall vertical tillage
53.8 a 57.2 a
0.29
*Values denoted with the same letter within a trial are not statistically different at the significance level 0.05.

ISU FARM, Farmer Assisted Research and Management ISRF13-99
31
On-farm Land Rolling of Soybeans
RFR-A1317 Land rolling is the practice of pulling a large, heavy roller across soybean fields in order to push down rocks, smooth the surface of the field, and help break up residue. The purpose is to protect harvest equipment that could be vulnerable to rocks and corn roots, thus saving money. Yields also are expected to improve by creating a more uniform harvest. Methods Two land rolling trials were conducted in 2013. Strips that were land rolled were compared with strips that were not. Treatments were replicated three or more times in both trials. Individual trial information can be found in Table 1. Results There was not a significant effect of the land rolling on the soybean yield in either of the two trials (Table 2). Land rolling is still fairly new to Iowa and there is more to be learned about this practice. Table 1. Variety, row spacing, planting date, planting population, previous crop, and tillage practices in land rolling trials.
Exp. No. Trial County Variety
Row spacing
(in.) Planting
date
Planting population (seeds/A)
Previous crop Tillage
130109 1 Sioux Pioneer 91Y90
30 5/13/13 150,000 Corn No-till
130118 2 Lyon Asgrow 2032
30 5/20/13 140,000 Corn No-till
Table 2. Yield from soybean land rolling trials.
Yield (bushels/A) Exp. No. Trial Treatment Control Response P-value
130109 1 64.3 64.8 -0.5 0.67 130118 2 56.6 55.6 1.0 0.17
ISU FARM, Farmer Assisted Research and Management ISRF13-99
32
On-farm Sulfur Fertilization of Soybean Trials
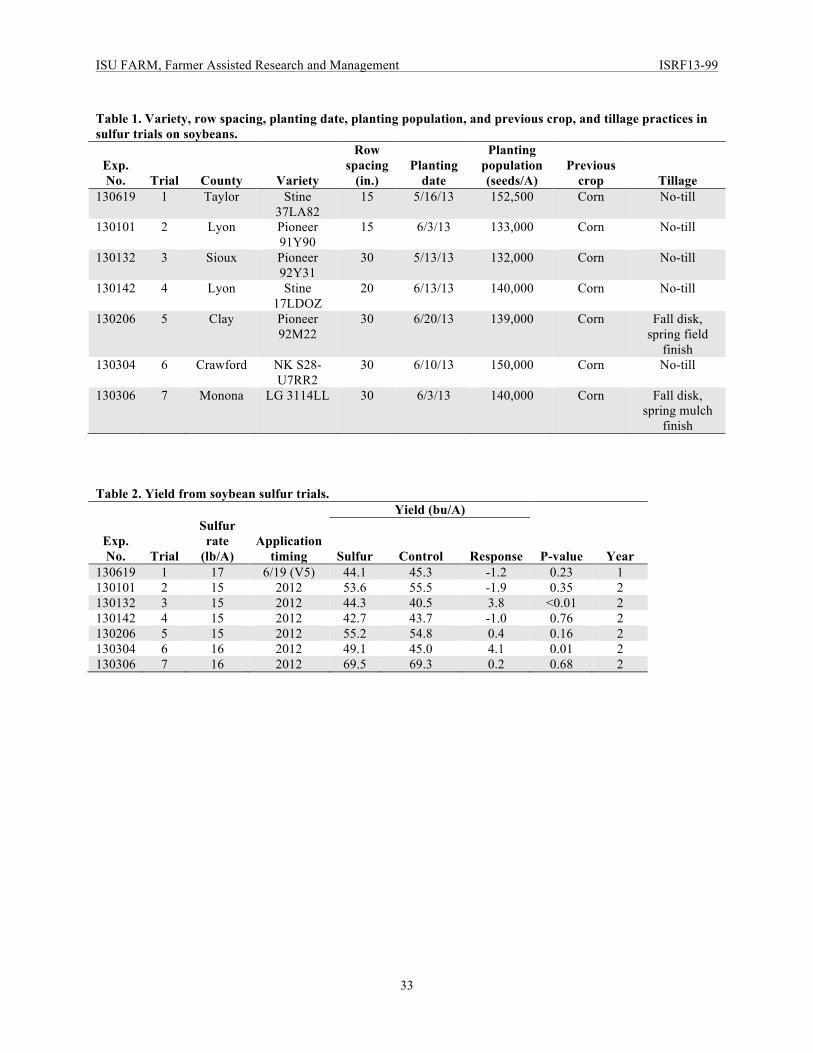
RFR-A1318 Sulfur (S) fertilizer applications can offer yield increases where S deficiencies are present. The objective of these trials was to evaluate potential for S deficiency and grain yield response in soybeans to S applications. Methods In 2012, S was applied to six cornfields with no manure history to test the response of corn in 2012 to S application and the response of soybeans in 2013 to residual S (the prior-year S application). In addition, S was applied to one soybean field in 2013 when soybeans were at V5 growth stage to test the response to S in the year of application. Calcium sulfate (gypsum) was the source of S in all trials, with the exception of Trial 5, where elemental S was the source. The rate of applied S ranged from 15 to 17 pounds S/acre. The S was applied in strip plots with three or more replications per treatment in each trial. All trials were conducted in western Iowa. See Table 1 for details on the seven trials. Results First-year trial There was no effect of S fertilization on the soybean grain yield in Trial 1 where S was applied in 2013 (Table 2). Second-year residual There was a statistically significant increase in soybean yield with the S application in two of the trials (Table 2). There was no yield increase due to S application in the other four trials. These trials indicate that S application can increase soybean yields in some fields and the yield increase can occur at least one year after the application is made. Across the two years of all ISU FARM trials with S application (first-year or residual-year in corn and soybean), there was a 29 percent positive yield response rate to S application. For further information on these trials and other research on S fertilization, contact John Sawyer, professor, Department of Agronomy, Iowa State University Extension and Outreach ([email protected]).
ISU FARM, Farmer Assisted Research and Management ISRF13-99
33
Table 1. Variety, row spacing, planting date, planting population, and previous crop, and tillage practices in sulfur trials on soybeans.
Exp. No. Trial County Variety
Row spacing
(in.) Planting
date
Planting population (seeds/A)
Previous crop Tillage
130619 1 Taylor Stine 37LA82
15 5/16/13 152,500 Corn No-till
130101 2 Lyon Pioneer 91Y90
15 6/3/13 133,000 Corn No-till
130132 3 Sioux Pioneer 92Y31
30 5/13/13 132,000 Corn No-till
130142 4 Lyon Stine 17LDOZ
20 6/13/13 140,000 Corn No-till
130206 5 Clay Pioneer 92M22
30 6/20/13 139,000 Corn Fall disk, spring field
finish 130304 6 Crawford NK S28-
U7RR2 30 6/10/13 150,000 Corn No-till
130306 7 Monona LG 3114LL 30 6/3/13 140,000 Corn Fall disk, spring mulch
finish Table 2. Yield from soybean sulfur trials.
Yield (bu/A)
Exp. No. Trial
Sulfur rate
(lb/A) Application
timing Sulfur Control Response P-value Year 130619 1 17 6/19 (V5) 44.1 45.3 -1.2 0.23 1 130101 2 15 2012 53.6 55.5 -1.9 0.35 2 130132 3 15 2012 44.3 40.5 3.8 <0.01 2 130142 4 15 2012 42.7 43.7 -1.0 0.76 2 130206 5 15 2012 55.2 54.8 0.4 0.16 2 130304 6 16 2012 49.1 45.0 4.1 0.01 2 130306 7 16 2012 69.5 69.3 0.2 0.68 2
ISU FARM, Farmer Assisted Research and Management ISRF13-99
34
On-farm Micronutrient Fertilization of Soybean Trials
RFR-A1319 Methods Ten side-by-side micronutrient trials were conducted on soybeans in 2013 (Table 1). The treatments in most of the trials were a foliar application on approximately V6 soybeans that contained a mixture of boron, zinc, and manganese. This was compared with an untreated control. The mixture was one part Winfield® Max-in ZMB (1 qt/acre) and one part Max-in Boron (1 pt/acre) applied in 15 gallons of water/acre. Soil and plant samples were collected in most of the trials before spraying near the time of the foliar application and analyzed for nutrients. The treatment in Trial 2 was a foliar application of 2 pt/acre of Max-in Boron. Treatments in all trials were replicated three or more times. Results Soil and plant tissue sample results can be found in Table 2. Soil also was sampled, analyzed for phosphorus and potassium, and found to be at the optimum level or higher. There was a significant yield increase of nearly four bushels/acre in Trial 6, and a yield increase of 1-2 bushels/acre in Trials 4 and 5 that approached significance (Table 3). Although no plant or soil samples were analyzed in Trial 6, the trial was conducted on soil that was somewhat eroded, with a history of low fertilizer applications, so it may have been deficient in one or more micronutrients. In the trials where soil and plant analyses were conducted, no yield increases from zinc and manganese were expected because soil levels were high according to interpretations from Iowa (zinc only) and the north-central region. There are no interpretations for boron from Iowa. We should have seen a yield increase in all trials according to boron interpretations from Illinois, but no yield increase was expected for any trial according to boron interpretations from South Dakota. There are no interpretations from Iowa or the north-central states for plant-tissue analysis at this growth stage. Results will be used with other ongoing research to establish interpretations for Iowa. For further information on these trials and other information regarding micronutrient research, contact Antonio Mallarino, professor, Iowa State University Extension and Outreach ([email protected]).

ISU FARM, Farmer Assisted Research and Management ISRF13-99
35
Table 1. Variety, row spacing, planting date, planting population, previous crop, and tillage practices for micronutrient trials in soybeans.
Exp. No. Trial County Hybrid
Row spacing
(in.) Planting
date
Planting population (seeds/A)
Previous crop Tillage
130124 1 Lyon Asgrow 2031
22 6/3/13 140,000 Corn Field cultivate
130110 2 Sioux Pioneer 91Y90
30 5/13/13 150,000 Corn No-till
130112 3 Sioux Pioneer 91Y90
30 5/13/13 150,000 Corn No-till
130406 4 Hancock FC 20R299 30 6/19/13 165,000 Corn Conventional 130602 5 Cass Epley 30 6/13/13 150,000 Corn No-till 130313 6 Crawford NK S28-
U7RR2 30 6/10/13 150,000 Corn No-till
130603 7 Cass Epley 30 6/12/13 150,000 Corn No-till 130611 8 Cass Ag 3030 30 6/5/13 128,000 Corn Vertical 130614 9 Cass Pioneer 93
M11 30 6/15/13 160,000 Corn No-till
130612 10 Cass Asgrow 3231
30 5/6/13 128,000 Corn No-till
Table 2. Soil and plant analyses from soybean micronutrient trials.
Soil Plant
Exp. No. Trial
Organic matter
(%) Boron (ppm)
Zinc (ppm)
Manganese (ppm)
Boron (ppm)
Zinc (ppm)
Manganese (ppm)
130124 1 5.41 1.20 5.57 19.19 27 31 54 130110 2 -- -- -- -- -- -- -- 130112 3 3.55 0.75 2.72 22.29 32 37 65 130406 4 5.31 1.18 1.55 12.22 34 32 64 130602 5 3.81 0.59 1.88 28.62 40 34 59 130313 6 -- -- -- -- -- -- -- 130603 7 3.11 0.51 1.73 48.12 31 38 102 130611 8 3.71 0.68 3.53 20.30 31 28 64 130614 9 2.80 0.57 2.97 21.59 32 35 54 130612 10 3.53 0.60 0.92 32.75 38 34 73 Table 3. Yield from soybean micronutrient foliar feeding trials.
Yield (bu/A) Exp. No. Trial Treatment
Application date Treatment Control Response P-value
130124 1 Micro Mix 7/9/13 74.5 73.2 1.3 0.49 130110 2 Boron 7/5/13 66.5 66.0 0.5 0.78 130112 3 Micro Mix 7/5/13 66.5 67.1 - 0.6 0.42 130406 4 Micro Mix 7/19/13 56.2 55.0 1.2 0.12 130602 5 Micro Mix 7/10/13 44.7 42.9 1.8 0.07 130313 6 Micro Mix 7/7/13 52.0 48.4 3.6 0.03 130603 7 Micro Mix 7/11/13 42.3 44.9 - 2.6 0.20 130611 8 Micro Mix 7/3/13 79.0 77.7 1.3 0.79 130614 9 Micro Mix 7/13/13 44.0 45.9 -1.9 0.24 130612 10 Micro Mix 7/1/13 54.5 56.0 -1.5 0.38
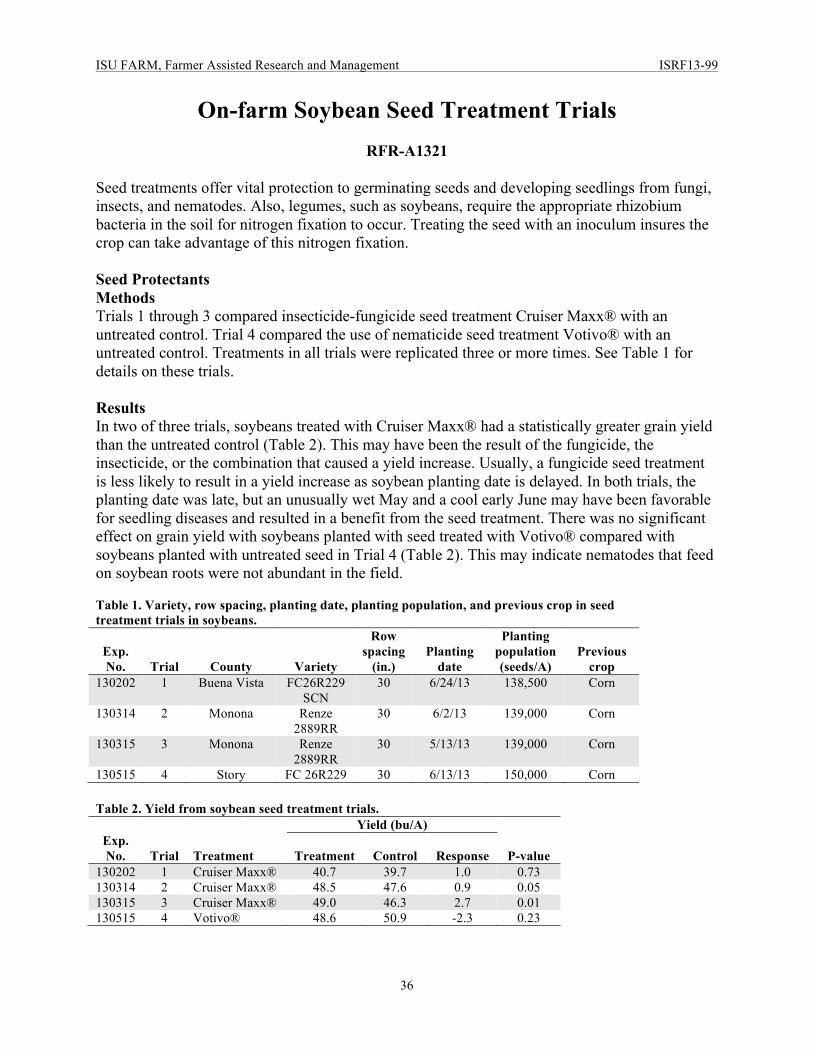
ISU FARM, Farmer Assisted Research and Management ISRF13-99
36
On-farm Soybean Seed Treatment Trials
RFR-A1321 Seed treatments offer vital protection to germinating seeds and developing seedlings from fungi, insects, and nematodes. Also, legumes, such as soybeans, require the appropriate rhizobium bacteria in the soil for nitrogen fixation to occur. Treating the seed with an inoculum insures the crop can take advantage of this nitrogen fixation. Seed Protectants Methods Trials 1 through 3 compared insecticide-fungicide seed treatment Cruiser Maxx® with an untreated control. Trial 4 compared the use of nematicide seed treatment Votivo® with an untreated control. Treatments in all trials were replicated three or more times. See Table 1 for details on these trials. Results In two of three trials, soybeans treated with Cruiser Maxx® had a statistically greater grain yield than the untreated control (Table 2). This may have been the result of the fungicide, the insecticide, or the combination that caused a yield increase. Usually, a fungicide seed treatment is less likely to result in a yield increase as soybean planting date is delayed. In both trials, the planting date was late, but an unusually wet May and a cool early June may have been favorable for seedling diseases and resulted in a benefit from the seed treatment. There was no significant effect on grain yield with soybeans planted with seed treated with Votivo® compared with soybeans planted with untreated seed in Trial 4 (Table 2). This may indicate nematodes that feed on soybean roots were not abundant in the field. Table 1. Variety, row spacing, planting date, planting population, and previous crop in seed treatment trials in soybeans.
Exp. No. Trial County Variety
Row spacing
(in.) Planting
date
Planting population (seeds/A)
Previous crop
130202 1 Buena Vista FC26R229 SCN
30 6/24/13 138,500 Corn
130314 2 Monona Renze 2889RR
30 6/2/13 139,000 Corn
130315 3 Monona Renze 2889RR
30 5/13/13 139,000 Corn
130515 4 Story FC 26R229 30 6/13/13 150,000 Corn Table 2. Yield from soybean seed treatment trials.
Yield (bu/A) Exp. No. Trial Treatment Treatment Control Response P-value
130202 1 Cruiser Maxx® 40.7 39.7 1.0 0.73 130314 2 Cruiser Maxx® 48.5 47.6 0.9 0.05 130315 3 Cruiser Maxx® 49.0 46.3 2.7 0.01 130515 4 Votivo® 48.6 50.9 -2.3 0.23
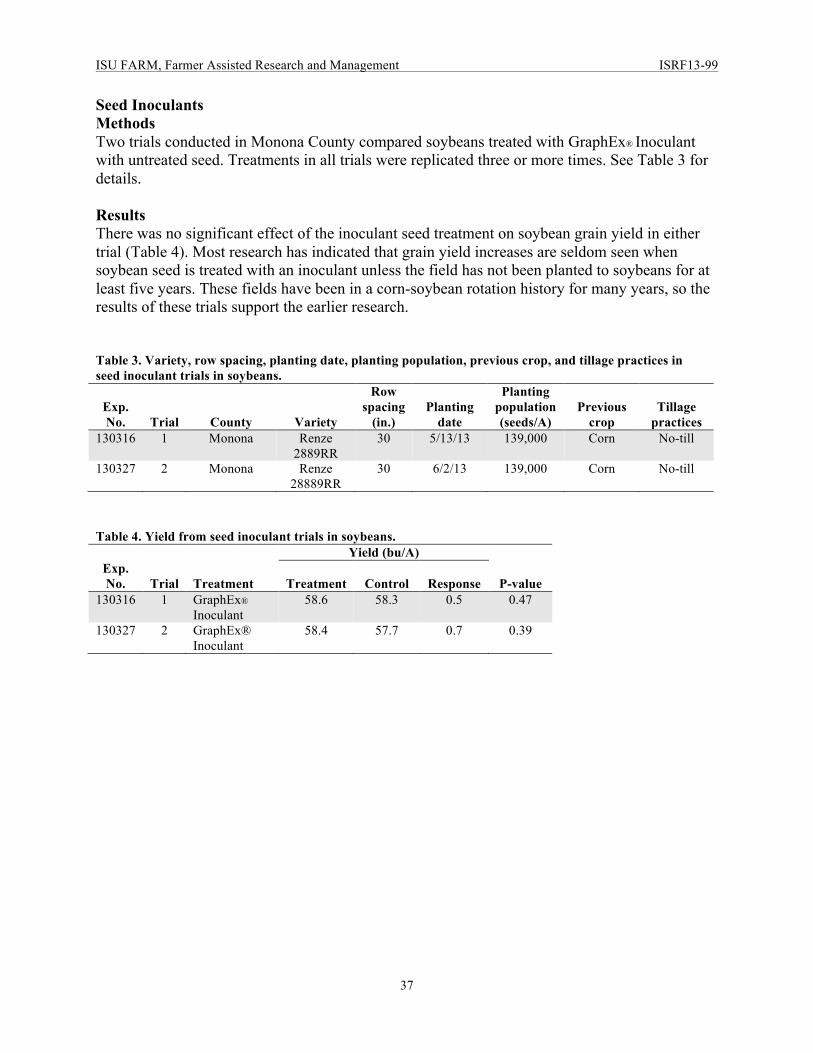
ISU FARM, Farmer Assisted Research and Management ISRF13-99
37
Seed Inoculants Methods Two trials conducted in Monona County compared soybeans treated with GraphEx® Inoculant with untreated seed. Treatments in all trials were replicated three or more times. See Table 3 for details. Results There was no significant effect of the inoculant seed treatment on soybean grain yield in either trial (Table 4). Most research has indicated that grain yield increases are seldom seen when soybean seed is treated with an inoculant unless the field has not been planted to soybeans for at least five years. These fields have been in a corn-soybean rotation history for many years, so the results of these trials support the earlier research. Table 3. Variety, row spacing, planting date, planting population, previous crop, and tillage practices in seed inoculant trials in soybeans.
Exp. No. Trial County Variety
Row spacing
(in.) Planting
date
Planting population (seeds/A)
Previous crop
Tillage practices
130316 1 Monona Renze 2889RR
30 5/13/13 139,000 Corn No-till
130327 2 Monona Renze 28889RR
30 6/2/13 139,000 Corn No-till
Table 4. Yield from seed inoculant trials in soybeans.
Yield (bu/A) Exp. No. Trial Treatment Treatment Control Response P-value
130316 1 GraphEx®
Inoculant 58.6 58.3 0.5 0.47
130327 2 GraphEx® Inoculant
58.4 57.7 0.7 0.39
ISU FARM, Farmer Assisted Research and Management ISRF13-99
38
On-farm Soybean Fungicide Trials
RFR-A1322 Fungicide applications have become more popular among soybean farmers in recent years. The primary use of fungicides has been to control diseases such as Septoria brown spot, Cercospora leaf blight, and frogeye leaf spot. With higher grain prices, the economic return on production-related investments is more easily achieved. However, there are risks involved when applying fungicides during times when disease severity is low, including economic losses and increased chance of pathogens becoming resistant to fungicides. Methods In 2013, nine trials (Table 1) examined the use of fungicides to control foliar disease in soybeans. In Trial 1, Priaxor® was applied at V6. In Trials 2, 3, 4, and 6, Priaxor® was applied at R3-R4, and in Trial 5, Quilt XL® was applied at V5. These treated strips were compared with an untreated control. In Trials 7 and 8, two fungicides applied at R3 (Headline and Priaxor) were compared with an untreated control. In Trial 9, Priaxor and a mixture of Priaxor and the insecticide Cobalt were compared with an untreated control. All applications were made with ground equipment. Soybeans were evaluated for foliar diseases in September in Trials 5 and 7. Treatments were replicated three or more times in each trial. Results There was a statistically significant yield increase of an average of about three bushels/acre with the fungicide applications in Trials 1, 5, 7, and 8 (Tables 2 and 3). In Trial 8, the yield in the plots treated with Priaxor was greater than the plots treated with Headline, and both yields were statistically greater than the yield from the untreated control. There was not a statistically significant yield increase with the fungicide application in the other five trials. Assessment of foliar diseases in Trials 5 and 7 indicated that disease lesions from Septoria brown spot, Cerscospora leaf blight, and frogeye leafspot were common in the mid-upper soybean canopy of the untreated plots and significantly less common in the treated plots. Although evaluations were not done in the other trials, it is possible foliar diseases also may have been present in the other two trials that benefited from the fungicide application. The results of these trials show that foliar applications of fungicide can result in yield increases in soybean, especially if foliar diseases are present.
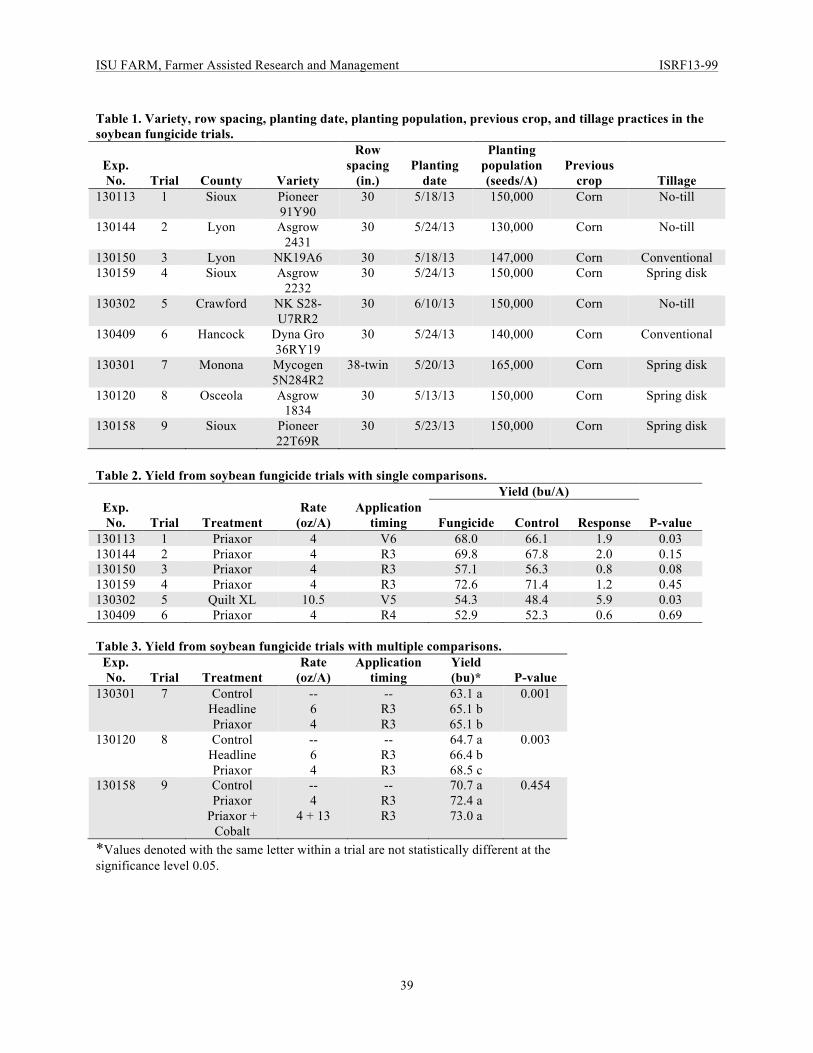
ISU FARM, Farmer Assisted Research and Management ISRF13-99
39
Table 1. Variety, row spacing, planting date, planting population, previous crop, and tillage practices in the soybean fungicide trials.
Exp. No. Trial County Variety
Row spacing
(in.) Planting
date
Planting population (seeds/A)
Previous crop Tillage
130113 1 Sioux Pioneer 91Y90
30 5/18/13 150,000 Corn No-till
130144 2 Lyon Asgrow 2431
30 5/24/13 130,000 Corn No-till
130150 3 Lyon NK19A6 30 5/18/13 147,000 Corn Conventional 130159 4 Sioux Asgrow
2232 30 5/24/13 150,000 Corn Spring disk
130302 5 Crawford NK S28-U7RR2
30 6/10/13 150,000 Corn No-till
130409 6 Hancock Dyna Gro 36RY19
30 5/24/13 140,000 Corn Conventional
130301 7 Monona Mycogen 5N284R2
38-twin 5/20/13 165,000 Corn Spring disk
130120 8 Osceola Asgrow 1834
30 5/13/13 150,000 Corn Spring disk
130158 9 Sioux Pioneer 22T69R
30 5/23/13 150,000 Corn Spring disk
Table 2. Yield from soybean fungicide trials with single comparisons.
Yield (bu/A) Exp. No. Trial Treatment
Rate (oz/A)
Application timing Fungicide Control Response P-value
130113 1 Priaxor 4 V6 68.0 66.1 1.9 0.03 130144 2 Priaxor 4 R3 69.8 67.8 2.0 0.15 130150 3 Priaxor 4 R3 57.1 56.3 0.8 0.08 130159 4 Priaxor 4 R3 72.6 71.4 1.2 0.45 130302 5 Quilt XL 10.5 V5 54.3 48.4 5.9 0.03 130409 6 Priaxor 4 R4 52.9 52.3 0.6 0.69 Table 3. Yield from soybean fungicide trials with multiple comparisons.
Exp. No. Trial Treatment
Rate (oz/A)
Application timing
Yield (bu)* P-value
130301 7 Control Headline Priaxor
-- 6 4
-- R3 R3
63.1 a 65.1 b 65.1 b
0.001
130120 8 Control Headline Priaxor
-- 6 4
-- R3 R3
64.7 a 66.4 b 68.5 c
0.003
130158 9 Control Priaxor
Priaxor + Cobalt
-- 4
4 + 13
-- R3 R3
70.7 a 72.4 a 73.0 a
0.454
*Values denoted with the same letter within a trial are not statistically different at the significance level 0.05.
v
ISU FARM, Farmer-Assisted Research and Management ISRF13-99
1
Research PartnersISU has long-term partnerships that support agricultural research locations (research farms) across Iowa. The following groups have endorsed and supported ISU FARM.
Committee for Agricultural Development
North Central Iowa Research Association
Northeast Iowa Agricultural Experimental Association
Northwest Iowa Experimental Association
Southeast Iowa Agricultural Research Association
Wallace Foundation for Rural Research and Development
Western Iowa Experimental Farm Association
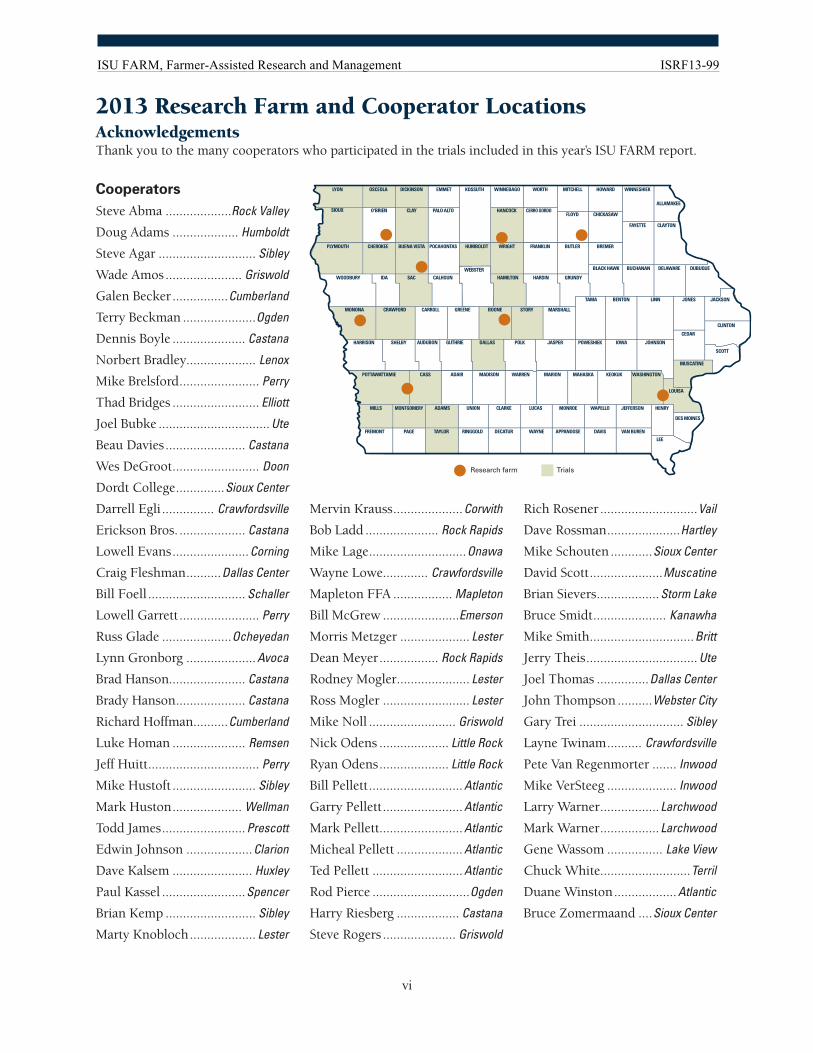
ISU FARM, Farmer-Assisted Research and Management ISRF13-99
1
vi
CooperatorsSteve Abma ...................Rock Valley
Doug Adams ................... Humboldt
Steve Agar ............................ Sibley
Wade Amos ...................... Griswold
Galen Becker ................Cumberland
Terry Beckman .....................Ogden
Dennis Boyle ..................... Castana
Norbert Bradley.................... Lenox
Mike Brelsford ....................... Perry
Thad Bridges ......................... Elliott
Joel Bubke ................................Ute
Beau Davies ....................... Castana
Wes DeGroot ......................... Doon
Dordt College ..............Sioux Center
Darrell Egli ............... Crawfordsville
Erickson Bros. ................... Castana
Lowell Evans ......................Corning
Craig Fleshman ..........Dallas Center
Bill Foell ............................ Schaller
Lowell Garrett ....................... Perry
Russ Glade ....................Ocheyedan
Lynn Gronborg ....................Avoca
Brad Hanson...................... Castana
Brady Hanson .................... Castana
Richard Hoffman ..........Cumberland
Luke Homan ..................... Remsen
Jeff Huitt ................................ Perry
Mike Hustoft ........................ Sibley
Mark Huston .................... Wellman
Todd James ........................Prescott
Edwin Johnson ...................Clarion
Dave Kalsem ....................... Huxley
Paul Kassel ........................Spencer
Brian Kemp .......................... Sibley
Marty Knobloch ................... Lester
2013 Research Farm and Cooperator LocationsAcknowledgementsThank you to the many cooperators who participated in the trials included in this year’s ISU FARM report.
WASHINGTON
LOUISA
TAMA
MARSHALL
JOHNSONIOWAPOWESHIEKJASPER
MARION MAHASKA KEOKUK
MONROE
APPANOOSE
CEDAR
CLINTON
SCOTT
MUSCATINE
VAN BUREN
WAPELLO
DAVIS
JEFFERSON HENRY
DES MOINES
LEE
BENTON LINN JONES JACKSON
DUBUQUEDELAWAREBUCHANANBLACK HAWK
GRUNDY
BREMERBUTLER
ALLAMAKEE
WINNESHIEKHOWARDMITCHELLWORTH
CERRO GORDO
FRANKLIN
FLOYD CHICKASAW
CLAYTONFAYETTE
HARDIN
WRIGHT
KOSSUTH
HUMBOLDT
BOONE
HAMILTON
HANCOCK
WEBSTER
CALHOUN
PALO ALTO
STORY
WINNEBAGO
GREENE
POCAHONTAS
CARROLL
EMMET
SHELBY
SAC
CHEROKEE
DICKINSON
HARRISON
IDA
BUENA VISTA
OSCEOLA
CRAWFORD
WOODBURY
CLAY
LYON
MONONA
PLYMOUTH
O'BRIENSIOUX
TAYLOR RINGGOLD DECATUR
WARREN
POLK
LUCAS
WAYNE
MADISON
DALLAS
CLARKEADAMS
ADAIR
AUDUBON
UNIONMILLS
GUTHRIE
MONTGOMERY
POTTAWATTAMIE CASS
FREMONT PAGE
••
•
•
••
••
• Research farm Trials
Mervin Krauss ....................Corwith
Bob Ladd ..................... Rock Rapids
Mike Lage ............................Onawa
Wayne Lowe ............. Crawfordsville
Mapleton FFA ................. Mapleton
Bill McGrew ......................Emerson
Morris Metzger .................... Lester
Dean Meyer ................. Rock Rapids
Rodney Mogler ..................... Lester
Ross Mogler ......................... Lester
Mike Noll ......................... Griswold
Nick Odens .................... Little Rock
Ryan Odens .................... Little Rock
Bill Pellett ...........................Atlantic
Garry Pellett .......................Atlantic
Mark Pellett ........................Atlantic
Micheal Pellett ...................Atlantic
Ted Pellett ..........................Atlantic
Rod Pierce ............................Ogden
Harry Riesberg .................. Castana
Steve Rogers ..................... Griswold
Rich Rosener ............................Vail
Dave Rossman .....................Hartley
Mike Schouten ............Sioux Center
David Scott .....................Muscatine
Brian Sievers ..................Storm Lake
Bruce Smidt ..................... Kanawha
Mike Smith ..............................Britt
Jerry Theis ................................Ute
Joel Thomas ...............Dallas Center
John Thompson ..........Webster City
Gary Trei .............................. Sibley
Layne Twinam .......... Crawfordsville
Pete Van Regenmorter ....... Inwood
Mike VerSteeg .................... Inwood
Larry Warner .................Larchwood
Mark Warner .................Larchwood
Gene Wassom ................ Lake View
Chuck White..........................Terril
Duane Winston ..................Atlantic
Bruce Zomermaand ....Sioux Center
vii
ISU FARM, Farmer-Assisted Research and Management ISRF13-99
1
Research Sponsors/DonorsWe are proud to provide quality information to farmers in Iowa. Portions of this research were made possible through agri business support, including the donation of products, labor, or funding. We recognize the following companies for their support of ISU FARM research. Please contact project leaders if you would like to become a sponsor.
A&M Green Power ........................................... Massena, IA
Advanced Biologicals Marketing (Vince Wertman) ...........................................Albert Lea, MN
Ag Ventures Alliance ...................................Mason City, IA
American State Bank (Troy Boers) .. Sioux Center, IA
BASF (Marcus Juhl) ........................................Estherville, IA
BASF (Karl Leikvold) ......................................Wakonda, SD
BASF (Max McCoy) ............................................Norwalk, IA
Berne Cooperative (Jerry Theis) ........................ Ute, IA
Calcium Products Inc. .................................Gilmore City, IA
Chem Gro Inc........................................... Mount Pleasant, IA
DuPont (Ron Geis) ........................................ Newcastle, NE
Farm Credit Services of America (David Popkes) ...................................................... Sheldon, IA
Goshorn Seed & Ag Supply (Chris Theilan) .......................................................... Harlan, IA
Hagie Manufacturing ...........................................Clarion, IA
Iowa Soybean Association .............................Ankeny, IA
Pioneer Hi Bred (Darren Hora) ..................Sioux City, IA
Pioneer Hi Bred (Austin Toot) ..........................Kelley, IA
Renze Seeds (Dennis Boyle) .....................Templeton, IA
River Valley Cooperative ...............................Clarence, IA
Sioux County Farm Bureau (Mark Boehner)............................................... Orange City, IA
Sorensen Equipment Co. .................................. Harlan, IA
Steve Jorgensen ................................................... Atlantic, IA
Titan Machinery .......................................................Avoca, IA
Winfield Agri Solutions (Steve Barnhart) ................................................Sioux City, IA

For more information, contact:
Research and Demonstration Farms103 Curtiss Hall Ames, Iowa 50011(515) 294-5045
www.ag.iastate.edu/farms
. . . and justice for allThe U.S. Department of Agriculture (USDA) prohibits discrimination in all its programs and activities on the basis of race, color, national origin, age, disability, and where applicable, sex, marital status, familial status, parental status, religion, sexual orientation, genetic information, political beliefs, reprisal, or because all or part of an individual’s income is derived from any public assistance program. (Not all prohibited bases apply to all programs.) Persons with disabilities who require alternative means for communication of program information (Braille, large print, audiotape, etc.) should contact USDA’s TARGET Center at 202-720-2600 (voice and TDD). To file a complaint of discrimination, write to USDA, Director, Office of Civil Rights, 1400 Independence Avenue SW, Washington, DC 20250-9410, or call 800-795-3272 (voice) or 202-720-6382 (TDD). USDA is an equal opportunity provider and employer.
Issued in furtherance of Cooperative Extension work, Acts of May 8 and June 30, 1914, in cooperation with the U.S. Department of Agriculture. Cathann A. Kress, director, Cooperative Extension Service, Iowa State University of Science and Technology, Ames, Iowa. HD13128
ISU FARM Report Cover 2013.indd 2 10/30/13 8:57 AM