Issues of Sh lShale Gas Experience -...
68
Vidic, Brantley et al., Science 2013 E i t lI fSh l G Environment alIssues of Shale Gas – the Pennsylvania Experience S LB l Susan L. Brantley Pennsylvania State University With thanks to Dave Yoxtheimer , Terry Engelder , Radisav Vidic, Art Rose, Carl Kirby, Lixin Jin, Rick Hooper, Mike Arthur, Paul Grieve, Xin Guin, Candie Wilderman, Julie Vastine, Jorge Abad, others
Transcript of Issues of Sh lShale Gas Experience -...

Vidic, Brantley et al., Science 2013
E i t l I f Sh l GEnvironmental Issues of Shale Gas –the Pennsylvania Experience
S L B lSusan L. BrantleyPennsylvania State University
With thanks to Dave Yoxtheimer, Terry Engelder, Radisav Vidic, Art Rose, Carl Kirby, Lixin Jin, Rick Hooper, Mike Arthur, Paul Grieve, XinGuin, Candie Wilderman, Julie Vastine, Jorge Abad, others

Gas shale plays in the U.S.A. Th t t l f 29 h l 20There are a total of 29 gas shales across 20 states with enough recoverable gas to last the United States 110 years (Entrekin et al., 2011).
Map from Arthur et al., 2008

Locations of Shale Wells – 10,000 well pads by 2030?


Incidents that have happened have created bli h b kpublic push‐back

http://www.fredonia.edu/shaleinstitute/history.asp
Burning the creek…how the natural gas industry began
"The first attempt which has ever been made to apply natural gas to so extensive and useful a purpose”
quoted from the Fredonia Censor newspaper November 25th, 1825

The first gas well preceded the first well drilled for the sole purpose of oil (1859): in Pennsylvania
The first successful oil well drilled for the
sole purpose of oil (1859): in Pennsylvania
well drilled for the sole purpose of finding oil was the Drake Well drilled inDrake Well drilled in Titusville PA in 1859.
Now, Pennsylvania alone has 300,000 oil and gas wells – and the location of maybe 100,000 of them are unknown.
www.historycentral.com

Oil and gas wells in PA (d f l d )(data from PA DEP upload 2012)
Pennsylvania DEP estimates that 350,000 oil and gas wells have been drilled in PA The location of maybewells have been drilled in PA. The location of maybe 100,000 of them are unknown. Red = active, Blue = inactive, Black = abandoned
Interstate Oil and Gas Compact Commission (IOGCC) estimates that hydrofracking is used to stimulate 90% of domestic oil and gas wellshydrofracking is used to stimulate 90% of domestic oil and gas wells (unconventional shales use higher volume). Technique used since 1940s

What is unconventional gas shale?
A shale of low permeability that has significant gas within it: permeability must be increased to extract the gasmust be increased to extract the gas
economically

The natural gas is present as nonadsorbed and adsorbed gasnonadsorbed and adsorbed gas
(Montgomery et al., 2005)
• Adsorbed gas: methane physically or chemically attached to surfaces of organic and mineral material
• Non‐adsorbed gas: free gas in pores + g g pdissolved gas in a liquid

Marcellus shale deposition
315 m years ago: collision slid for 15 my315 m years ago: collision, slid for 15 my
389 million years ago: clay + organic
Schematic of Laurentia/Gondwana at i f d i i f M ll h l
matter + quartz + Fe oxides deposited
300 million years ago: entered the oil time of deposition of Marcellus shale
(Engelder and Lash, American Oil and Gas Reporter, May 2008; after Blakey, R.C. www2 nau edu/rcb7/nam html Right figure from
window
260 million years ago: seals formed that t d i thwww2.nau.edu/rcb7/nam.html; Right figure from
Ettsenohn, 1994trapped in the gas

Depth to MarcellusDepth to Marcellus

Slide from Rudy Slingerland, Penn State

Marcellus porosity ~5%; d d60% gas‐saturated; 36% water‐saturated
Oil wet porosity (hydrophobic) Water wet porosity (hydrophilic)Oil‐wet porosity (hydrophobic)
• Pores in the organic matter• Formed during maturation
Water‐wet porosity (hydrophilic)
• Pores in the matrix silicate materialFormed during maturation
of the organic matter (thus does not show extensive compaction)
• Formed during deposition but shows the effect of compactioncompaction) compaction

FIB SEM image of Marcellus shale (X. Gu, Penn State)

Unconventional gas wells use horizontal drilling + h d lihydraulic fracturing
Average total water use per well in PAwell in PA equals 4 million gallons ..and only about 10‐20% usually returns to the surface

“A lot of us in the field have different mental picturesdifferent mental pictures of…fractures.” (Schlumberger engineer, 2012)
Micro‐seismic data are consistent with a radius of influence of these fractures reaching beyond 300 m from the borehole; after 6 months the frac half‐length < 150 m, Edwards et al. 2011; SPE 140463). At most, the increase in volume is << 1%.


Now the drill 5 20 laterals per pad Distance between laterals in TX isNow the drill 5‐20 laterals per pad. Distance between laterals in TX is about 300 m (Nicot and Scanlan, 2012), and is similar in Marcellus
(Edwards et al., 2011)

In Feb 2011, PA required disclosure of chemicals in fl id (N f d l l i i di l COfluids (No federal law requiring disclosure; CO requires limited disclosure; WY requires public disclosure with some exemptions)
Information available online at FracFocus.org


The 29

Vidic, Brantley, Science 2013

What the EPA is thinking aboutWhat the EPA is thinking about• 1. Water Volume: Will large withdrawals of water impact
drinking water resources? • 2. Hydrofracturing itself: What are the possible impacts of
the injection and fracturing process on drinking water resources?
• 3. Fracking fluids: If hydraulic fracturing fluids are spilled, how will this impact drinking water resources?
• 4. Flowback and Produced Waters: If flowback and produced waters are spilled, how will this impact drinking water resources?
• 5. Wastewater Treatment and Disposal: What are the possible impacts of inadequately treated hydraulic fracturing wastewaters on drinking water resources?g g


Greenhouse gas controversyGreenhouse gas controversy
• 1‐3% of total gas production per well is lost to1 3% of total gas production per well is lost to atmosphere (Kirchgessner et al. 1997, Chemosphere 35: 1365‐1390)Chemosphere 35: 1365 1390)
• Cornell Univ: 3.6‐7.9% of methane from shale‐gas production lost to atmosphere (Howarthgas production lost to atmosphere (Howarth, Santoro, Ingraffea, 2011, Climatic Change doi: 10 1007/s10584 011 0061 5)10.1007/s10584‐011‐0061‐5)

Greenhouse gas emissions: Unpublished from Paula Jaramillo, Carnegie, g
From NAS workshop at Univ of WV, Sept 2012

THE SHALE NETWORKTHE SHALE NETWORK
The ShaleNetwork is creating a central and accessible repository for geochemistry and hydrology data collected by watershed groups, government agencies, industry stakeholders, and universities working together to document natural variability and potential environmentaltogether to document natural variability and potential environmental impacts of shale gas extraction activities.

www.shalenetwork.orgwww.shalenetwork.org
• We are building a ShaleNetwork database ofWe are building a ShaleNetwork database of water quality in stream waters, ground waters, injection flowback and production waters ininjection, flowback, and production waters in the area of Devonian shale gas development. The database is described at shalenetwork orgThe database is described at shalenetwork.organd accessible through HydroDesktop (online program that will allows access to databaseprogram that will allows access to database (download from www.cuahsi.org))

Potential ContaminantsPotential Contaminants
• Drilling muds cuttings D illi d h d li f t iDrilling muds, cuttings• Frack fluids
i i f di l / l i
Drilling and hydraulic fracturing lasts only about 2 months, then the equipment and activity is gone
• Emissions from diesel motors/electric generators into air, some impact on water
• Natural sediments• Methane• Natural contaminants from flowback and production fluidsproduction fluids

Potential Water Quality Impact PathwaysImpact Pathways
• Direct spill of fluids to ground surface via leaking pipes or impoundmentsor impoundments
• Trucking spills (i.e. accidents)
• Methane migration into groundwater/surface water due to faulty well constructiondue to faulty well construction
• Effluent from treatment facility (largely a non‐issue with new treatment standards in PA)
• Erosion and sediment transport from pads and roads• Erosion and sediment transport from pads and roads

Percent of wells drilled each year since 2005 that received at least one Notice of Violation (NOV) in PA has stayed roughly constantNotice of Violation (NOV) in PA has stayed roughly constant
http://www.portal.state.pa.us/portal/server.pt/community/oil_and_gas_compliance_report/20299
Figure 3. Percent of unconventional shale-gas wells in PA drilled each year that received at least one NOV. Colors indicate each category of violation shown in Table 1from onset of inspections for unconventional drilling (5/2005) until 3/2013, after permitting and reporting violations were removed. The percent (shown as a fraction above each bar) was calculated from the number of violations per category after
Brantley et al., 2013, subm. Int. J. Coal Geology
p ( ) p g yduplicates were removed divided by the number of wells drilled during the calendar year. Notices of violations reported by PA DEP were categorized into 9 categories as shown in Table 1 (see also, Appendix). The average percent of wells with at least one NOV per year is 35.4 + 10.8 % and the fraction of wells with NOVs has neither increased nor decreased with time. Since 2008 the relative importance oferosion/sedimentation issues has decreased. In contrast, the relative fraction of issues related to well construction, pollution events, or pits and impoundments have remained relatively constant. (Brantley et al. subm.)

Map showing locations of all wells with violations recorded by PA DEP (permitting or recording violations are not shown). Each well is (p g g )
shown only once even if it has multiple violations
Brantley et al., 2013, subm. Int. J. Coal Geology

Impacts of drilling, injection and hydrofracturing
1. Drilling muds or constituents (i.e., Airfoam)
2 Fracking constituents2. Fracking constituents3. Gas

10 out of 31 identified spill incidents in the NOVs since 2009. E l M d R l L ’ C k 10/19/11Example Mud Release: Larry’s Creek 10/19/11
• The week of 10/19/2011, Larry’s Creek, near a drilling site, was running rich with clay but therunning rich with clay but the settling process was working very well. Then a mud release occurred.
• SRBC saw an increase inSRBC saw an increase in conductivity/turbidity in the creek
Larry’s Creek is near Salladsburg, PA, located in Mifflin Twp., Lycoming Co., PA. Off route 287, north of Jersey Shore, above the junction of Routes 220 and 287

Detail of the days after the incident on 10/19/2011on 10/19/2011
(Shale Network database, HydroDesktop graph)
Increase in turbidity caused by the spill
Day of the Spill
Susquehanna River Basin Commission sensor data Spillsensor data

Comparison of turbidity to kprecipitation in Larrys Creek

Will advective transport of contaminants through porous media or fractures bring fracking
constituents or subsurface brines into near‐surface drinking water resources?

• “To our knowledge there have been a millionTo our knowledge, there have been a million wells fracked, and no documented cases of contamination of groundwater from hydrauliccontamination of groundwater from hydraulic fracturing.” Exxon CEO Rex Tillerson told House Energy and Commerce Committee inHouse Energy and Commerce Committee in January 2010

Myers 2012 concludes that transport to the surface could require 10 to 10s of thousands of years. He simulated pressure of fluids after injection into a well.
The data and his model (MODFLOW‐2000) show return to pre‐injection levels within 300 days.
The model shows new pressure equilibrium reached within 3‐6 y, which he concludes could cause advection upward to aquifers within as little as 10 y.

Hydrofrack constituents do come back up in flowback
Screen Shot from HydroDesktop with ShaleNetwork Data Sites with benzene reported in injection and/or flowback water (data from Hayes )
No known cases of hydrofrackfluids contaminating drinking water from movement at depth in PA (only 2 alleged casesin PA (only 2 alleged cases nationwide, very controversial)

Flowback chemistry versus time from ShaleNetwork in HydroDesktop
Benzene
ShaleNetwork in HydroDesktop(data from Hayes (2009)
2000
2500A
B
C No reports in
1500
tration, ppb
D
E
F
G
H
pPA of constituents in hydrofrackfl ids going into
500
1000
Concen H
I
J
K
L
fluids going into drinking waters due to hydrofracturing
00 10 20 30 40 50 60 70 80 90 100
Days after hydrofracturing
M
N
O
P
itself
Days after hydrofracturing
Graph from Carl Kirby, Bucknell Univ

Does hydrofracturing cause natural gas d kto enter drinking water?
• About 44 million people in USA usepeople in USA use private water supplies for house and farm
• (Hutson, S. et al., 2000; Estimated Use of Water in the United States in 2000; US Geol Survey Circular
)1268)

• Locations of sampling in active sites (within 1 km f d illi ) dof drilling) and
nonactivesites reportedsites reported by Osborn et al.
Osborn S.G., Vengosh A., Warner N.R. (2011) Methane contamination of drinking water accompanying gas well‐drilling and hydraulic fracturing. Proceedings of the National Academy of Sciences. 108: 8172‐8176.

Methane concentrations in drinking water from wells (Osborn et al 2011)water from wells (Osborn et al.,2011)
[Methane][Methane] plotted versus distance from drilling, not taking into
taccount underground horizontalhorizontal activity
Methane saturation at atm pressure = 26 mg CH4/L (20oC) and 42 mg/L (10oC).
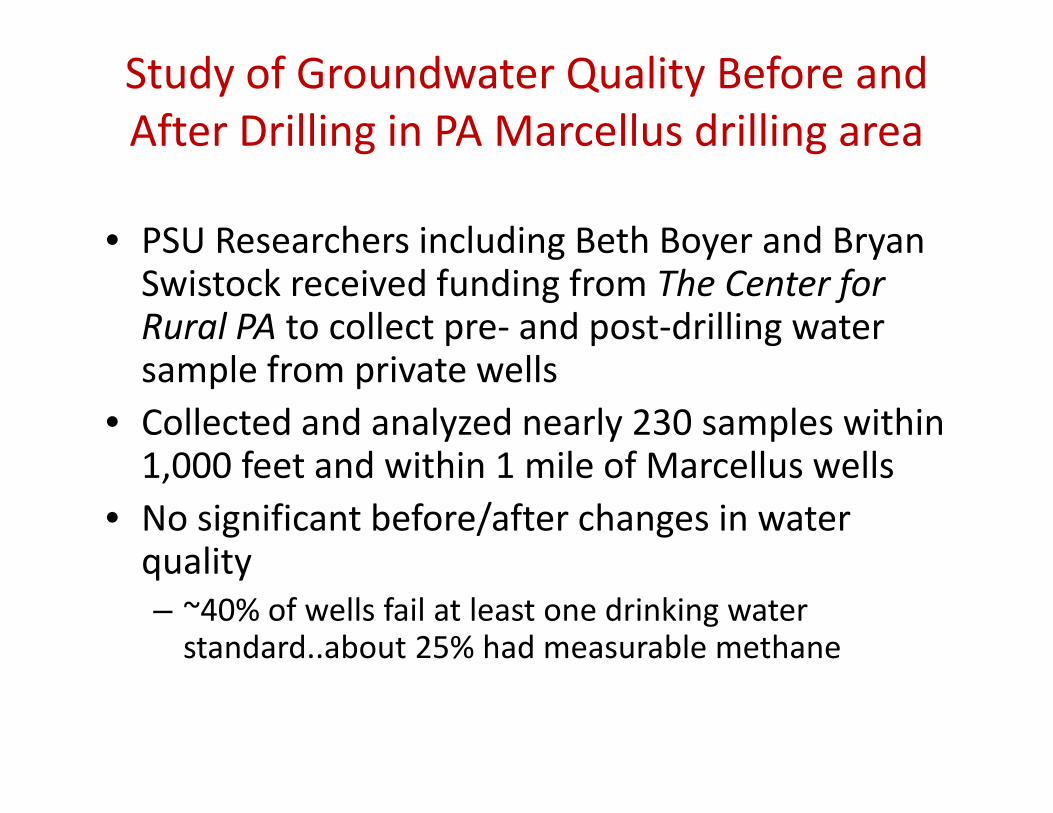
Study of Groundwater Quality Before and After Drilling in PA Marcellus drilling areag g
• PSU Researchers including Beth Boyer and Bryan SU esea c e s c ud g et oye a d yaSwistock received funding from The Center for Rural PA to collect pre‐ and post‐drilling water
l f llsample from private wells• Collected and analyzed nearly 230 samples within 1 000 f t d ithi 1 il f M ll ll1,000 feet and within 1 mile of Marcellus wells
• No significant before/after changes in water qualityquality– ~40% of wells fail at least one drinking water standard..about 25% had measurable methane

Vidic, Brantley et al., Science 2013Vidic, Brantley et al., Science 2013

Methane concentrations in groundwatersMethane concentrations in groundwaters
Most data are inin ShaleNetworkdatabase; figure made by
dPSU grad student Paul Grieve. Similar figure gpublished in Vidic, Brantley et al., Science 20132013

Osborn et al.
• 13C in the methane becomes more like thebecomes more like the thermogenic signature as gas concentration increases
• MethaneMethane concentrations and 13C increase regardless of formation
• Grey areas are typical 13C values for biogenic and thermogenic (Osborn and McIntosh (2010))and McIntosh (2010))
Isotope standard = VDPB (Vienna Pee Dee Belemnite)

Map documenting the % of wells in each county that have received NOVs from the PA DEP from 5/2005 to 3/2013 for / /
casing, cementing or well construction issues
Brantley et al., 2013, subm. Int. J. Coal Geology

PA RegulationsPA Regulations• In PA, unconventional gas companies are presumed responsible for water contamination within 2500 ft and 12 months of well completion if they have no pre‐drill data that shows the water quality did not change. Most q y g(all?) companies therefore test water supplies within 2500 ft before drilling
• Companies do not have to give data to PA DEP,Companies do not have to give data to PA DEP, although to protect themselves legally, they generally give it to DEP. PA DEP cannot readily share the data because it must be redacted PA DEP has shared somebecause it must be redacted. PA DEP has shared some of this data with ShaleNetwork under an MOU between the state and Penn State

Issues related to flowback and production waters
Can briny flowback or production waters get into ground or surface waters? (9 spills of flowback/production/brine waters 6 spillsflowback/production/brine waters, 6 spills of frack components since 2009 in PA)

(1) Wilson, J. M. and VanBriesen, J. M., 2012. Oil and gas produced water management and surface drinking water sources in Pennsylvania.
Environmental Practice doi:10.1017/S1466046612000427.

Flowback chemistry versus time from h l k d kShaleNetwork in HydroDesktop
Cl C
TDS often above 200,000 ppm: Na, Ca, Cl brine (relatively low in Mg, Sulfate)
Cl, Br, Na, K, Ca, Mg, Sr, Ba, Fe, Mn, TDS all usually increasing with time. pH, alkalinity, lf d i hsulfate decrease with
time

363840
No. of Wells / 100
262830323436
ar
No. of Large Spills Cases31 Spills :
Diesel (1)Discharge (1)Ai f (1)
141618202224
mbe
r per
yeaAirfoam (1)
Hydrost. test water (2)Sediment (3)Frack fluids or components (6)
468
101214
NumDrilling muds or fluids (9)
Flowback, prod. water or brine (9)
Brantley et al., 2013, subm. 2008 2010 2012
024
Year
Figure 2. Number of unconventional shale-gas wells drilled in PA since 2004 (black squares, plotted after division by 100) and number of major spills reported for PA (red circles). Data from PA DEP d di Bl i l i di h b f b d d b PA
Int. J. Coal Geology
PA DEP and media reports. Blue triangles indicate the number of broad cases reported by PA DEP where oil or gas development activity was presumed to have caused impact of one or more water supplies. Cases may include more than one water supply and/or more than one gas well.

Private Well TDS Pre‐ and Post‐Drilling
The Impact of Marcellus Gas Drilling on Rural Drinking Water Supplies, Center for Rural PA, October 2011

In contrast to low concentration constituents such as hydrofrackingcompounds, salts are present in flowback/production waters at much higher concentrations A spill or leakage would therefore most likely be identifiedconcentrations. A spill or leakage would therefore most likely be identified by analyzing salts. Here are all locations where PA DEP determined that
shale gas development could be presumed responsible for contamination of d i ki t li ith di l d ltdrinking water supplies with dissolved salts
Brantley et al., 2013, subm. Int. J. Coal Geology
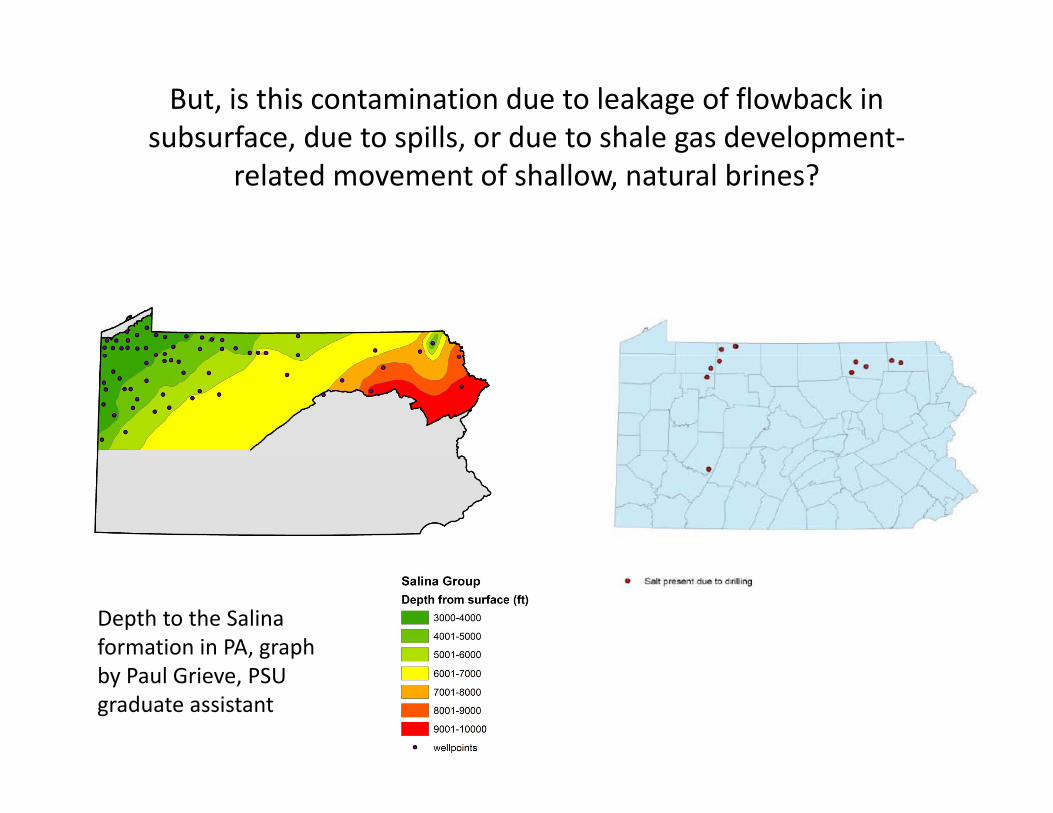
But, is this contamination due to leakage of flowback in subsurface, due to spills, or due to shale gas development‐, p , g p
related movement of shallow, natural brines?
Depth to the Salina formation in PA, graph by Paul Grieve, PSU graduate assistant

In early 2011, several noticed that Br in intake for PWSA was high enough to be problematic…at that time it was legal to send flowbackg p g
waters to municipal water treatment plants for river discharge

Br in Allegheny River water at Pittsburgh d h i i kWater and Sewer Authority intake
Screen shot from Shale Network data in HydroDesktop

Bromide in surface water versus time for all available data in Shale Network database for 40available data in Shale Network database for 40
PA counties with Marcellus drilling107 High concentrations since
105
106
Bromide (EPA STORET) Bromide, dissolved (USGS NWIS) Bromide, total (Shale Network) Bromide, total (PA DEP SAC046)
g/L)
2003 were generally in areas with permitted brine discharge or for Salt Springs Line = 3 above
103
104
cent
ratio
n (
g Springs. Line = 3 above mean from 1960‐2003 for USGS data (early data not shown). Detection limit =
101
102
rom
ide
conc 10 – 200 ug/L. EPA is
considering an MCL for Br = 6000 ug/L
2009 2010 201110-1
100Br
cIncludes data from EPA Storet, USGS NWIS, SRBC, Appal. Geo. Consulting,
Vidic, Brantley, Vandenbossche, Yoxtheimer, Abad, Science 2013
Year ALLARM, PA DEP

Naturally Occurring Radioactive Materials (NORMs) also increase with time in flowback (Rowan et al. 2011)( )

(Rowan et al. 2011)(Rowan et al. 2011)

Very few contamination incidents in Shale Network database due to shale gas industry (why?)
E l SRBC RWQMN t B b’ C kExample: SRBC RWQMN at Bob’s Creek (http://mdw.srbc.net/remotewaterquality/data_viewer.aspx)
A leak in a liner allowed flowback water to run off a well pad site (leak discovered 5/24/2010 but was presumed to have started earlier) and PA DEP thought that some contaminant got into Bob’s creek, a Class A trout stream in Juniata Township, Blair County.

Bob’s Creek: SRBC RWQMN(http://mdw srbc net/remotewaterquality/data(http://mdw.srbc.net/remotewaterquality/data_
viewer.aspx)

Water Management Trends Use of alternative water sources
Groundwater supply wells closer to drilling Municipal wastewater use (3 plants in permitting process) Acid mine drainage
Use of above ground temporary storage
Flowback water reuse is increasing Up to ~90% PA industry-wide now, was ~10% just a couple years ago.
Field recycling and fixed site treatment being utilized increasingly Field recycling ~1.6 mgd (40,000 bpd) in 2011 Fixed treatment plant use ~400,000 gpd (10,500 bpd) in 2011
Cl d l d illi d fl id Closed loop drilling and fluids storage
Lined well pads to minimize releases
Additional centralized treatment facilities in various stages of permitting/construction Additional centralized treatment facilities in various stages of permitting/construction
Beneficial reuse of sludges and solids for landfill cover is occurring at some facilities
UIC disposal well use increasing in OH Was ~5% a year ago now ~20% Was 5% a year ago, now 20%
UIC well sites being pursued in PA
Slide from Dave Yoxtheimer, Penn State Marcellus Center for Outreach and Research

SummarySummary• Data sharing is enabling better understanding of issues related to shale gas development.• The Shale Network team has not identified any incidents where frack fluid components have been
identified in ground water from subsurface transport after or during frackingidentified in ground water from subsurface transport after or during fracking. • Water quality and quantity issues include potential problems during drilling, problems with casings
(3.5% problem rate but problem wells are fixed), problems with salts in fluids when spilled or disposed, problems related to mobilization of methane, and other potential problems.
• Many improvements have been instituted in PA to deal with these issues.• A lot of water quality data are already available – but data are hard to access – and site locations
are not always appropriate or analyses for certain components are missing. Also, releases of data around incidents are restricted. We are building a ShaleNetwork database that is described at shalenetwork.org and accessible through CUAHSI.org to enable sharing and investigation of data.
• The publicly accessible data do not show a high incidence of problems. Why? Probably because the density of monitoring stations that record appropriate analytes in appropriate places is low compared to the number of well pads; the actual rate of problems that are large enough to impact waters is relatively low; it is still hard to get data and information about spills and incidents; often data are not released; analysis of baseline data is lacking.
• Sharing data should be encouraged by all people in industry, government, academia, and in the l bligeneral public.
Acknowledgements : This work was funded by National Science Foundation OCE SEES funding to SAcknowledgements : This work was funded by National Science Foundation OCE SEES funding to S. Brantley (Shale Network Database).

Relevant Federal RegulationsRelevant Federal Regulations• Safe Drinking Water Act (SDWA) Underground Injection Control Program requires
EPA or EPA authorized states to prevent underground injection of fluids that couldEPA or EPA‐authorized states to prevent underground injection of fluids that could endanger drinking water; however, EPA has never regulated hydraulic fracturing under SDWA
• 2005 Energy Policy Act excluded underground injection of fluids or proppantsother than diesel fuels that are related to oil gas geothermal from regulation asother than diesel fuels that are related to oil, gas, geothermal from regulation as “underground injection”
• FRAC Act 2009: bills granting EPA authority over fracking under SDWA were introduced in House and Senate (Fracturing Responsibility and Awareness of Chemicals Act)..neither bill was reported out of committee) p
• FRAC Act reintroduced in 2011 to both houses• Natural gas companies are not required to disclose identity of chemical
constituents in fracturing fluids under federal law; EPA issued a voluntary request to 9 providers in 2010 and indicated they had legal authority to compel disclosurep y g y p
• DOI Secretary Ken Salazar has indicated DOE will require disclosure of chemicals used on public lands
• EPA has an ongoing study of drinking water impacts from hydraulic fracturing, expected in preliminary form in 2012 and completed in 2014p p y p
Information from Osborn et al. http://www.nicholas.duke.edu/cgc/HydraulicFracturingWhitepaper2011.pdf