ISSUE The UMMER 2014 Summit - WAURISA - Home€¦ · GIS tools were leveraged to evaluate elk home...
32
WAURISA: The Washington State Chapter of URISA The Association for GIS Professionals WWW.WAURISA.ORG The Summit W elcome to the summer is- sue of The Summit! As I write this, we’re enjoying a long stretch of fantastic summer weather Washington-style (i.e., no humidity like in Minnesota where I grew up). I trust you are taking some time to enjoy it – it’s not hard to do given the abundance of amazing ge- ography we have to enjoy here in Washing- ton. It’s been a couple of months since the annu- al Washington GIS Conference in Tacoma. You’d think we would take a bit of a breather after the event, but it’s been quite busy. Here are some of the things we’ve been working on: As many of you know, our 2015 conference will be in partnership with the Oregon chapter of URISA next May. Plans are well (Continued on page 27) President’s Column By: Heather Glock Also In This Issue: Dick Thomas Award Summary 3 Dick Thomas Second Place Paper 5 WAURISA GIS Conference Outcomes 9 King County Stormwater Atlas 14 Spring GIS Events Roundup 15 Features & Editorial 28 I SSUE 35 S UMMER 2014 News From and For the Washington GIS Community T he Pierce County Planning and Lands Services department (PALS) uses an assortment of GIS technologies to help make decisions and assist cus- tomers. The mission of PALS is to “Deliver timely, consistent decisions and information to promote the development of better communities within Pierce County.” In order to fulfill this mission, PALS issues building and land development permits and provides property information. GIS technologies are used to help PALS staff in this effort, as well as making community planning and environmental decisions related to constraints and development. What is the Best Permitting Agency? To make PALS a more efficient department, an ambitious goal of “Creating/Being the Best Permitting Agency in the State” was established in early 2011. The program adopted to reach this goal is entitled Best Permitting Agency (BPA). One of the main goals of BPA is to improve the permitting pro- cess. This was to be accomplished by maximizing the deci- Pierce County PALS Aims to be Best Permiing Agency By: Aaron Petersen sion making authority within PALS, improving customer satisfaction, and integrating more technology into the pro- cess. The BPA effort included many improvements to the technolo- gy used by PALS staff and external customers. These im- provements include changes to the department website, to the permitting software, and to the permitting database. Both PALS staff and external customers are now able to utilize online resources to accomplish basic land use and develop- ment business as well as look up property information. Exter- nal customers can sign up to receive automatic updates re- garding submitted projects. Improvements were also made to the GIS data and software. Rapid updates of existing and new applications have greatly improved the availability of information to the external cus- tomer when researching an individual property. At the same time, edits to the underlying GIS data have improved the level of understanding by customers. (Continued on page 2)
Transcript of ISSUE The UMMER 2014 Summit - WAURISA - Home€¦ · GIS tools were leveraged to evaluate elk home...

W A U R I S A : T h e W a s h i n g t o n S t a t e C h a p t e r o f U R I S A
T h e A s s o c i a t i o n f o r G I S P r o f e s s i o n a l s W W W . W A U R I S A . O R G
The
Summit
W elcome to the summer is-
sue of The Summit! As I
write this, we’re enjoying a
long stretch of fantastic summer weather
Washington-style (i.e., no humidity like in
Minnesota where I grew up). I trust you are
taking some time to enjoy it – it’s not hard
to do given the abundance of amazing ge-
ography we have to enjoy here in Washing-
ton.
It’s been a couple of months since the annu-
al Washington GIS Conference in Tacoma.
You’d think we would take a bit of a
breather after the event, but it’s been quite
busy. Here are some of the things we’ve
been working on:
As many of you know, our 2015 conference
will be in partnership with the Oregon
chapter of URISA next May. Plans are well (Continued on page 27)
President’s Column By: Heather Glock
Also In This Issue:
Dick Thomas Award Summary 3
Dick Thomas Second Place Paper 5
WAURISA GIS Conference Outcomes 9
King County Stormwater Atlas 14
Spring GIS Events Roundup 15
Features & Editorial 28
ISSUE 35
SUMMER 2014
N e w s F r o m a n d F o r t h e W a s h i n g t o n G I S C o m m u n i t y
T he Pierce County Planning and Lands Services
department (PALS) uses an assortment of GIS
technologies to help make decisions and assist cus-
tomers. The mission of PALS is to “Deliver timely, consistent
decisions and information to promote the development of
better communities within Pierce County.” In order to fulfill
this mission, PALS issues building and land development
permits and provides property information. GIS technologies
are used to help PALS staff in this effort, as well as making
community planning and environmental decisions related to
constraints and development.
What is the Best Permitting Agency? To make PALS a more efficient department, an ambitious
goal of “Creating/Being the Best Permitting Agency in the
State” was established in early 2011. The program adopted to
reach this goal is entitled Best Permitting Agency (BPA). One
of the main goals of BPA is to improve the permitting pro-
cess. This was to be accomplished by maximizing the deci-
Pierce County PALS Aims to be Best Permitting Agency By: Aaron Petersen
sion making authority within PALS, improving customer
satisfaction, and integrating more technology into the pro-
cess.
The BPA effort included many improvements to the technolo-
gy used by PALS staff and external customers. These im-
provements include changes to the department website, to
the permitting software, and to the permitting database. Both
PALS staff and external customers are now able to utilize
online resources to accomplish basic land use and develop-
ment business as well as look up property information. Exter-
nal customers can sign up to receive automatic updates re-
garding submitted projects.
Improvements were also made to the GIS data and software.
Rapid updates of existing and new applications have greatly
improved the availability of information to the external cus-
tomer when researching an individual property. At the same
time, edits to the underlying GIS data have improved the
level of understanding by customers.
(Continued on page 2)

Since the inception of BPA, PALS has made measurable
strides toward reaching its established goals. Some of the
internal benefits include: staff receiving fewer phone calls
regarding status of a submitted project, 25% fewer costumers
coming into the Development Center, and improved commu-
nications between county departments and other agencies.
Benefits to the public include reduced trips to the PALS office
by an estimated 36-50,000 miles a year, faster turnaround on
information requests, and greatly improved access to infor-
mation.
GIS Software within PALS and Pierce County Within Pierce County government, the Information Technolo-
gy Department, Applications and GIS Services (AGS), is re-
sponsible for the maintenance and creation of GIS packages/
applications. AGS does this work with input from other
county departments and external customers that use GIS.
PALS is an end user of these packages for both staff and ex-
(Continued from page 1) ternal customers. PALS staff makes use of three different soft-
ware packages on a daily basis. The most advanced is an
ESRI desktop product: CountyView Pro. This software is
used for data creation and editing as well as creating custom
maps. Most staff use a web-based application named Coun-
tyView Web for completing site-specific research relating to
permits and projects. This package also allows users to quick-
ly create a map from a list of preset map templates. Another
application named Quickview, also web-based, allows staff to
quickly look up and create a report featuring all of the
mapped details of an individual property.
Pierce County’s AGS has also developed two web-based ap-
plications that can be accessed by external PALS customers to
retrieve information related to the same geographic infor-
mation available to PALS staff. Customers can view infor-
mation about a location of interest in either a tabular format
or an interactive map service. For example, one can use these
applications to determine the zoning of a parcel and if a wet-
land has been mapped on the property. The information is
accessed in About My Property (http://
yakima.co.pierce.wa.us/AboutMyProperty/) or
via Public GIS (http://
matterhorn3.co.pierce.wa.us/publicgis/) direct-
ly from the Pierce County or PALS websites.
The first, About My Property (Figure 1), allows
a user to look up a tax parcel and retrieve site-
specific tabular information using links named
“Tell Me More.” The majority of PALS custom-
ers research existing property constraints, and
how this might influence the development of
the property. Therefore, of particular interest
are the Current Zoning and Possible Site Con-
straints commonly referred to as Critical Areas.
One limitation of this application is that the
research area is limited to a single tax parcel at
a time. If any Possible Site Constraints are
found on the property, the customer has the
option to click and get more information. The
detailed description also includes a link to con-
tact PALS staff and determine if further review
or development proposal alternatives may be
(Continued on page 6)
Pierce County PALS Best Permitting Agency Effort
Page 2 Issue 35
Figure 1. About My Property information return

Page 3 The Summit
T hree students presented their projects at the eighth
annual Richard ‘Dick’ Thomas Memorial Stu-
dent Presentation Competition and Award on
Wednesday, May 14, 2014 at this year’s Washington GIS Con-
ference (May 12-14) at the Greater Tacoma Convention and
Trade Center in Tacoma. The Washington State Chapter of
the Urban and Regional Information Systems Association
(WAURISA) established this award to honor Washington
State GIS pioneer and mentor, Richard ‘Dick’ Thomas by con-
tinuing his work of encouraging students to excel in their
studies and transition successfully into GIS careers.
This year’s topics were quite diverse. Anna Yost presented
her work in modeling and creating elk habitat. William Jons-
son and Haley Duke discussed runoff volume in three Bothell
watershed basins. And Emily Spahn and Sarah Shores
demonstrated for the crowd their implementation of a tree
inventory for Seattle Parks.
First Place: Anna Yost Anna is a student at Central Washington University. Her
project was done with the guidance and support of her Pro-
fessor, Dr. Bob Hickey. Her project was titled “Modeling elk
habitat suitability in the North Cascades.”
Her abstract is as follows:
Abstract: The Washington State Department of Fish and
Wildlife (WDFW) would like to adjust the distribution of elk
on the landscape in the North Cascades to reduce negative
impacts to private property while maintaining a healthy pop-
ulation of elk. Elk management goals can be achieved
through a combination of practices, such as forage enhance-
ment that encourage elk in tolerated areas, and fencing, haz-
ing, and/or hunting of elk in areas of low tolerance. This pro-
ject focused on mapping elk habitat suitability across the
8,000 km2 North Cascades elk management area and then
identifying potential areas of high elk tolerance which would
be suitable for forage enhancement. GIS tools were leveraged
to evaluate elk home ranges using Kernel Density Estimation,
classifying key landscape vegetation parameters using satel-
lite imagery, calibrating a custom elk habitat suitability mod-
el, and evaluating the landscape for potential elk forage en-
hancement locations. Outputs from the GIS analysis were
communicated to WDFW and the Elk Forage Enhancement
Working Group, a collaborative multi-stakeholder committee
who evaluates the predicted elk habitat suitability within the
context of various resource management constraints. Land-
scape-scale elk resource management issues were quantified
using GIS tools, and the realities of land ownership, land use
limitations, seasonal variability, and the dynamic nature of
elk herds were all considered in order to produce final recom-
mendations for elk forage enhancement in the North Cas-
cades.
Anna’s prize included:
Dick Thomas Award Plaque
$1000
One year membership in WAURISA
Free registration to the 2015 Washington-Oregon Region-
al GIS Conference in Vancouver, WA
Publication of paper in The Summit
In addition, her professor, Dr. Bob Hickey, was awarded a
cash prize of $250.
(Continued on page 4)
Dick Thomas Award Winners By: Sarah Myers, GISP

Page 4 Issue 35
Second Place: William G. Jonsson and Haley J.
Duke William and Haley are students at the University of Washing-
ton, Bothell. Their advisor was Santiago Lopez, PhD and their
presentation was titled “Flow accumulation and runoff vol-
ume of three watershed basins in the City of Bothell.”
Their abstract and paper is published in this issue of The
Summit following this overview.
The prize for second place was:
• Dick Thomas Second Place Award Certificate
• $300
• One year membership in WAURISA
• Publication of paper in The Summit
Third Place: Emily Spahn and Sarah Shores Emily and Sarah study at the University of Washington, and
their paper was titled “Development of a Tree Inventory and
Tree Data Collection Framework for Seattle Parks.” Their
advisor was Harvey Arnone.
Here is their abstract:
Tree inventories are useful tools for cities to monitor the cur-
rent urban forest to meet future canopy goals, track mainte-
nance history, assess wildlife habitat, plan work, document
memorial trees, plan volunteer events, and assess tree values.
Though the City of Seattle’s Parks and Recreation Depart-
ment [Parks] has a fair amount of data on existing trees in
parks, the department does not have a tree inventory. For our
student project, we developed a tree inventory and data col-
lection framework for Parks.
Parks has started developing tree inventories several times,
but no efforts were maintained, and only sporadic GIS tree
data are currently available for Parks’ trees. These past efforts
highlight the importance of making a tree inventory simple to
use by many people.
The project required the review of other tree inventories in
the region, and we worked with the University of Washing-
ton, City of Seattle’s Transportation Department, and Seattle
Audubon Society to gather this information. We met with
Parks staff, including arborists, GIS professionals and field
crew personnel, to determine what data should be collected
and to what level of detail.
(Continued from page 3) We developed a framework for field work assignments and
data collection, based on ArcGIS Online and Collector. We
plan to test the system and tools by developed the inventory
for a small Seattle park as a proof-of-concept.
Project deliverables will include a tree inventory which com-
bines the data we collect along with that collected during
earlier efforts, in addition to the mobile tool framework. We
hope that we have made the tools straightforward and easy
to use, and that Parks will adapt our efforts to their needs.
Third place prize was:
• Dick Thomas Third Place Award Certificate
• $200
• One year membership in WAURISA
• Publication of paper in The Summit
Thanks! Thank you to everyone who made the competition a resound-
ing success. A big thank you to the students who submitted
their abstracts and showed us the exciting things they are
doing in the profession.
Dick Thomas Award Winners
Page 5 The Summit
Thank you also to the competition committee, Nick Hetrick,
Molly Jackson, Winston McKenna, Jennifer Schmidt, Steve
Schunzel, and Reuben Weinshilboum. The committee helped
me reach out to professors, review and update the competi-
tion rules, score the abstracts and finally attend the confer-
ence so they could judge the presentations. Without the com-
mittee, the students and dedication professors, the competi-
tion could not happen!
This year like others, the presentations were exceptional, and
we were pleased with the turnout and dedication of the stu-
dents. However, there is always room for improvement, and
for finding new and different ways to encourage students. If
you are interested in exploring how to improve the competi-
tion, or you’re interested in being a judge for our next confer-
ence, please contact Sarah Myers, [email protected].
We look forward to seeing you next year at the ninth annual
Richard ‘Dick’ Thomas Memorial Student Presentation
Competition and Award at the Washington-Oregon Regional
GIS Conference (May 4 - 6, 2015) at the Hilton Hotel in Van-
couver, WA. Student presentations will be Wednesday, May
6, 2015.
Sarah Myers (right) presents the Dick Thomas Award Plaque
to first-place award winner Anna Yost.
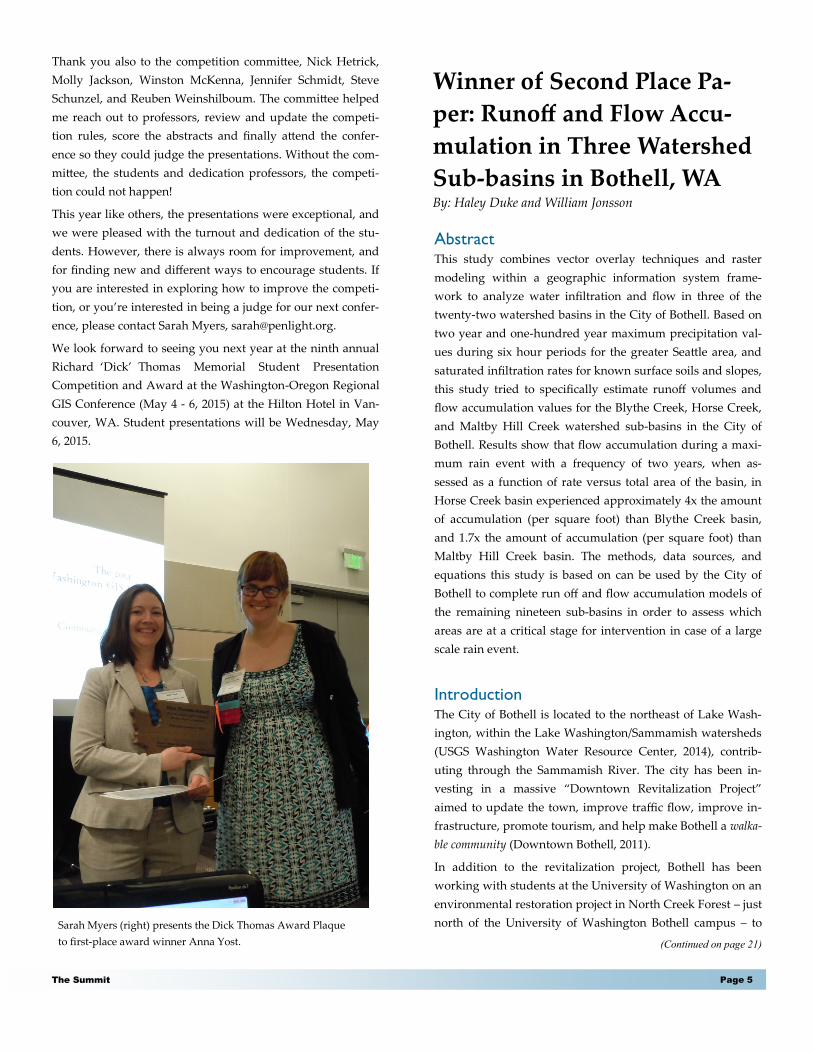
Winner of Second Place Pa-
per: Runoff and Flow Accu-
mulation in Three Watershed
Sub-basins in Bothell, WA By: Haley Duke and William Jonsson
Abstract This study combines vector overlay techniques and raster
modeling within a geographic information system frame-
work to analyze water infiltration and flow in three of the
twenty-two watershed basins in the City of Bothell. Based on
two year and one-hundred year maximum precipitation val-
ues during six hour periods for the greater Seattle area, and
saturated infiltration rates for known surface soils and slopes,
this study tried to specifically estimate runoff volumes and
flow accumulation values for the Blythe Creek, Horse Creek,
and Maltby Hill Creek watershed sub-basins in the City of
Bothell. Results show that flow accumulation during a maxi-
mum rain event with a frequency of two years, when as-
sessed as a function of rate versus total area of the basin, in
Horse Creek basin experienced approximately 4x the amount
of accumulation (per square foot) than Blythe Creek basin,
and 1.7x the amount of accumulation (per square foot) than
Maltby Hill Creek basin. The methods, data sources, and
equations this study is based on can be used by the City of
Bothell to complete run off and flow accumulation models of
the remaining nineteen sub-basins in order to assess which
areas are at a critical stage for intervention in case of a large
scale rain event.
Introduction The City of Bothell is located to the northeast of Lake Wash-
ington, within the Lake Washington/Sammamish watersheds
(USGS Washington Water Resource Center, 2014), contrib-
uting through the Sammamish River. The city has been in-
vesting in a massive “Downtown Revitalization Project”
aimed to update the town, improve traffic flow, improve in-
frastructure, promote tourism, and help make Bothell a walka-
ble community (Downtown Bothell, 2011).
In addition to the revitalization project, Bothell has been
working with students at the University of Washington on an
environmental restoration project in North Creek Forest – just
north of the University of Washington Bothell campus – to
(Continued on page 21)
Page 6 Issue 35
Pierce County PALS Best Permitting Agency Effort
needed.
The second web-based application, Public GIS (Figure 2),
allows a user to view most of this same information through
an interactive map application. A PALS customer can view
zoning, additional development information, possible site
constraints, and wetlands. A user can also view aerial photo-
graphs and terrain when using the Public GIS application. An
additional benefit is that a user can research information over
a larger area than just one property.
GIS Updates and BPA Implementation of the BPA program allowed PALS staff the
chance to review how the GIS system (data and software)
were supporting the permitting process. This review resulted
in a number of improvements to both the
data and software. AGS released the
current version of Public GIS at the
same time PALS was going through
the implementation of BPA. This up-
dated version provided PALS the
opportunity to increase the number of
datasets that were available to the public.
In the previous version of Public GIS, only a few datasets
such as zoning and urban/rural designations were available
to the public. In the new version, PALS was able to expand
the list to include commonly requested items such as wet-
lands and related data, shoreline environments, and all possi-
ble site constraints.
Some of the GIS datasets were redesigned for improved sym-
bolization and interpretation. For example, a new wetland
dataset was created for the Public GIS application. PALS uti-
lizes three different wetland surveys as sources to display
and monitor wetlands. A new dataset containing all three
inventories allows users to more easily determine if a wet-
land may exist and its official source.
At the same time as the Public GIS application enhancements,
improvements were also made to the About My Property
application. The largest change was reformatting the function
known as “Tell Me More.” This function is found on each
returned line (Figure 1) in the table and is used as a key to
access the results. An example of the reformatted “Tell Me
More” result is found in Figure 3. This change has made the
user query more comprehensive and understandable at the
(Continued from page 2) same time. A user of About My Property can now determine
if the parcel being researched has a history of land use or
building permits. If there are previous permits, a direct link
to the online permit website is provided. One last change
made to About My Property is the ability to easily link the
parcel and information being researched to Public GIS, where
more detailed information on wetlands, for example, can be
found in an interactive map viewer.
Results and the Future GIS has played a vital role in achieving two goals of BPA:
improving customer satisfaction and integrating more tech-
nology into the process. PALS customers can now retrieve a
great deal of information via Public GIS and About My Prop-
erty websites. Customers now save time, as fewer need to
come in person to the PALS office looking for information
about a location of interest. If they have
taken advantage of accessing these por-
tals, they are usually more informed
when contacting PALS staff to discuss a
property. Since customers are finding
more information online any time that is
convenient to them, the PALS Develop-
ment Center is less crowded. As a result,
PALS staff is more efficient in assisting customers applying
for land use and/or building permits. External customers and
PALS staff can now discuss geographic information over the
phone while looking at this same mapped information
through the same interface.
PALS will continue to make improvements to the GIS data
and software as part of the BPA effort. PALS is currently
working with the Pierce County IT department on making
upgrades to the About My Property website. The application
website will be branded to look like other Pierce County web-
sites. Additionally, PALS is working to include additional
pertinent information from the permit tracking software and
database. From the “Tell Me More” link, a customer will be
able to see detailed staff comments regarding items such as
critical areas and zoning for a parcel the has previously been
reviewed. Next, PALS is hoping to automate the creation of a
dataset that will display and attribute permits as they are
initiated.
Benefits to the public include
reduced trips to the PALS office
by an estimated 36-50,000 miles
a year.

Page 7 The Summit
Figure 2. Public GIS window.
Figure 3. About My Property return of
wetlands “Tell Me More”.

Page 8 Issue 35

Page 9 The Summit
WAURISA GIS Conference Outcomes
A primary goal for WAURISA’s 2014 Washington
GIS conference was to support the theme of Com-
municating Our World by trying out some ap-
proaches for encouraging greater communication and net-
working opportunities for attendees. One of these approaches
was the inclusion of theme tables at lunchtime on the first
day of the conference. A larger endeavor was the establish-
ment of what we called a “Thought Leaders” group to help
gather ideas and stimulate conversations related to the con-
ference theme, with a particular focus on the three questions
that were originally asked in the Call for Papers:
How have you communicated the value of GIS to your
organization or clients?
How has your use of GIS supported a communication
effort?
How have you improved communication between par-
ticipants in your GIS projects?
As well as compiling ideas from direct conversations and
presentations, we also established a “Contribution Collection
Station,” where attendees could record their thoughts on ea-
sel pads, rate the comments using sticky dots, and discuss the
points that were raised. The Thought Leaders then helped
orchestrate a new closing discussion during which contribu-
tions to the conference theme were summarized and the audi-
ence was invited to elaborate on the summary. The make-up
of the group and the results of the exercise are presented be-
low. Since this was the first time we’d tried the approach,
reflections on the process itself are also included and may
serve to help others who wish to implement something simi-
lar at future events.
The Thought Leaders The following individuals kindly agreed to be members of
the Thought Leaders group:
Breece Robertson - National GIS Director, The Trust for
Public Land and conference keynote presenter
Geoff Almvig - GIS Manager, Skagit County
Stephen Beimborn - GIS Manager, Seattle Public Utilities
Tami Faulkner - GIS/IT Supervisor, Thurston GeoData
Center
Parker Wittman - GIS Manager, Aspect Consulting, LLC
Discussion Topics As it turned out, contributions to the conference theme from
the collection station, presentations and discussions often
spanned more than one of the three theme questions listed
above and typically related to two of them. It made sense,
therefore, to frame our closing discussion in terms of general
topics rather than the three questions themselves.
Four general topics were identified to provide the foundation
for the discussion:
Standards and Best Practices
GIS Turf Wars
Becoming the GIS Yoda
Education and Interaction
The Thought Leaders developed summary slides to introduce
each topic and seed audience participation in the closing dis-
cussion. We allowed ten minutes of discussion time per topic
and all participants were asked to state their name and organ-
ization to provide some context for their thoughts. The seed
points and a brief set of responses are provided below (with
the responses treated anonymously out of respect for the par-
ticipants). Without the context of the full discussion, some of
the points may be a little unclear, but I’m sure fellow
attendees would be willing to elaborate. The goal of the
whole exercise is, after all, to encourage positive interaction.
1. Standards and Best Practices
Conversation seed points from initial attendee contributions
Retaining/fostering institutional knowledge
Mentoring
Documenting business needs/practices
(Continued on page 10)
T he 2014 WAURISA GIS Conference was held May 12-14 at the Tacoma Convention Center, thanks to the efforts of the Con-
ference Committee led by Chuck Buzzard. Three submissions regarding the conference have been combined in this section:
first you will find an overview of the Thought Leaders and Closing Session by David Howes, followed by the Board of Di-
rectors election results by Ian Von Essen and the Map Poster Contest results by Suzanne Shull. Congratulations to Dr. Sabah Jabbouri
on winning The Summit Award—GIS Person of the Year. You can look forward to reading his story in the Fall issue of The Summit.
Thought Leaders and Closing Session - by David A. Howes

Page 10 Issue 35
What does it mean?
What should they do?
Educate others about GIS
Avoid esoteric GIS jargon
Create metadata and documentation
Facilitate interagency cooperation
Closing discussion responses
What is meant by “yoda”? The master, teacher
Yoda translated knowledge, helped get past struggles
Need to keep language simple enough
Help get people over difficult hurdles
“GIS therapy:”
Ask participants in a project what’s the most important thing
for them and listen carefully
Consider time, image and cost in assessing suitable responses
(from Don Barden’s book The Perfect Plan, referred to in the
Keys to Independent GIS Consulting session)
From a 911 manager who’s visited all 39 counties: continually
looking for “yoda” skills in local offices
“Don't do this" list
How do you prioritize your work?
Importance of project management
Closing discussion responses
A mentor/mentee database would be helpful
Washington now has a “Women in GIS and Technology”
group, which was active at the conference, promoting, for
example, networking and personal branding (the topic of a
session in the GIS Communication track)
Prioritization:
Use the food chain approach - address the most important
items first
Meet as a team and assign priorities, apply executive decision
making
Ensure good communication - always ask if in doubt
“Duke it out” - conduct an ROI evaluation, use facts and data
to make decisions
Documenting: adopt a wiki approach
2. GIS Turf Wars
Conversation seed points from initial attendee contributions
Cease-fire? Earned 10 dots at the Collection Station
Bomb away? Earned 3 dots
Closing discussion responses
IT people tend not to be knowledgeable with respect to GIS -
a combined GIS/IT degree program may be helpful (and
could be in development locally)
Some have had a good experience with IT staff
From a former school teacher and IT person who taught ap-
plications: Application users tend to be IT-ignorant, IT people
tend to be application-ignorant
It’s a matter of understanding others; e. g., IT people, from
their perspective, need to take time to “cross the tracks”, it’s a
learning process, “walk a mile in their shoes”
From someone who has worked with CAD, IT etc. for many
years: Took CAD and surveying classes, very helpful in un-
derstanding others and their needs
Need to move beyond simply describing turf wars and look
for positive ways to resolve differences
3. Becoming the GIS Yoda
Conversation seed points from initial attendee contributions
(Continued from page 9)
WAURISA GIS Conference Outcomes

Page 11 The Summit
Maps are very helpful in creating “a-ha” moments, people
quickly see their value
4. Education and Interaction
Conversation seed points from initial attendee contributions
What GIS-related skills are
Well addressed in education?
Not well addressed in education?
How do you replicate/build on the value of conferences
within your organization?
How can we enhance communication with/between ex-
ecutives and elected officials?
Closing discussion responses
Need new presentations and required skills
From a part-time GIS analyst:
See IT needs in a lot of GIS job descriptions
Feel unqualified because many jobs are increasingly becom-
ing IT-/web-based
May be a problem for “middle-agers”
From a certificate program student: Most jobs require a bach-
elor-level degree
It would be helpful if GIS hirers would communicate with
Human Resources departments to explain what’s really re-
quired, which may help them realize the value of certificate
programs
URISA is working on promoting the value of certificate pro-
grams at the national level and developing educational stand-
ards
A GIS career demands lifelong learning - instead of
“conferences,” it may be better to refer to events as
“symposiums” or something that expresses “learning oppor-
tunities” (i.e., professional development)
Become a GIS evangelist
Expand on the GIS “fan base” - introduce GIS to a broader
audience
From a GIS educator: Talk to non-GIS professionals and get
them excited about the technology and how they can use it
Create vertical career opportunities
There is no single “vanilla” GIS flavor, accept diversity
From a GIS educator: At San Diego State University, GIS pro-
fessionals served as course advisors and presented on topics
such as how to find a GIS job
GIS should be a standard class in K-12 programs
Leverage the holistic nature of GIS
Deliverables An important goal for the closing discussion was to develop a
set of deliverables in the form of short statements that, ideal-
ly, summarized key positive points from the conference con-
(Continued on page 12)
David Howes (far left) moderates the Thought Leaders at the Closing Session (L-R:) Stephen Beimborn, Tami Faulner, Geoff Almvig, Breece Robert-
son, Parker Wittman

Page 12 Issue 35
versation on communication and would serve as a basis for
positive action within the GIS community. The following
statements were identified with support from the attendees:
Walk a mile in their shoes
Create an inspiring teachable moment
Be a mentor to the education community
If everyone who attended the discussion or reads this article
were to take steps based on one of these statements, our GIS
community would benefit significantly. The statements also
provide a basis for ongoing interactions to consider how well
our efforts are working and how we can expand the set to
include other positive intentions. Ideally, this will extend the
spirit of the conference well beyond the closing discussion
and make a strong and positive difference for everyone in-
volved.
Reflections on the Process In general, the Thought Leaders idea seemed to work reason-
ably well, especially for a first attempt. As always, there is
room for improvement and the following comments may be
helpful to anyone wishing to extend and develop the ap-
proach.
After a slow start, the amount of activity at the Contribution
Collection Station grew rapidly. For a two-day event, howev-
er, an earlier push for contributions may help to maximize
the value of the approach.
(Continued from page 11)
WAURISA GIS Conference Outcomes
WAURISA Board Election Results - by Ian
Von Essen
Position 2014 Election Year Time Remaining in
Term
President Heather Glock Odd 1 year
Vice President Ian Von Essen Odd 1 year
Secretary Sarah Myers Odd 1 year
Treasurer Don Burdick* Even 2 years
Past President Ann Stark Odd 1 year
Board position 1 David Howes Odd 1 year
Board position 2 Dana Trethewy Odd 1 year
Board position 3 Josh Sisco Odd 1 year
Board position 4 Josh Greenberg* Even 2 years
Board position 5 Renee Quenneville* Even 2 years
Board position 6 Cort Daniel* Even 2 years
It would have been valuable to have included greater in-
volvement by the Thought Leaders themselves in the closing
discussion. We were keen to encourage as much audience
participation as possible, but the discussion might have bene-
fited from their comments.
Generating audience interaction was slightly difficult to begin
with and it was a little awkward having to choose someone to
start the conversation, but it wasn’t long before we had a
healthy conversation under way.
From the post-conference survey responses, some appreciat-
ed the Thought Leaders concept and enjoyed the closing dis-
cussion and some were ambivalent, although the general
response seemed to be favorable.
As with all other aspects of the conference, this was entirely a
volunteer-led activity and we are grateful to those who com-
plimented us on our activity and provided help. Any sugges-
tions for improving this sort of activity are most welcome,
but please be prepared to help us develop better ideas and
enhance the overall experience for you and your fellow GIS
professionals accordingly. Your contribution will be appreci-
ated.
T he 2014-2015 WAURISA Board of Directors is
shown in the table below. An asterisk indicates the
individual was elected at the 2014 Conference.
Page 13 The Summit
Map Poster Contest Results - by Suzanne Shull, GISP
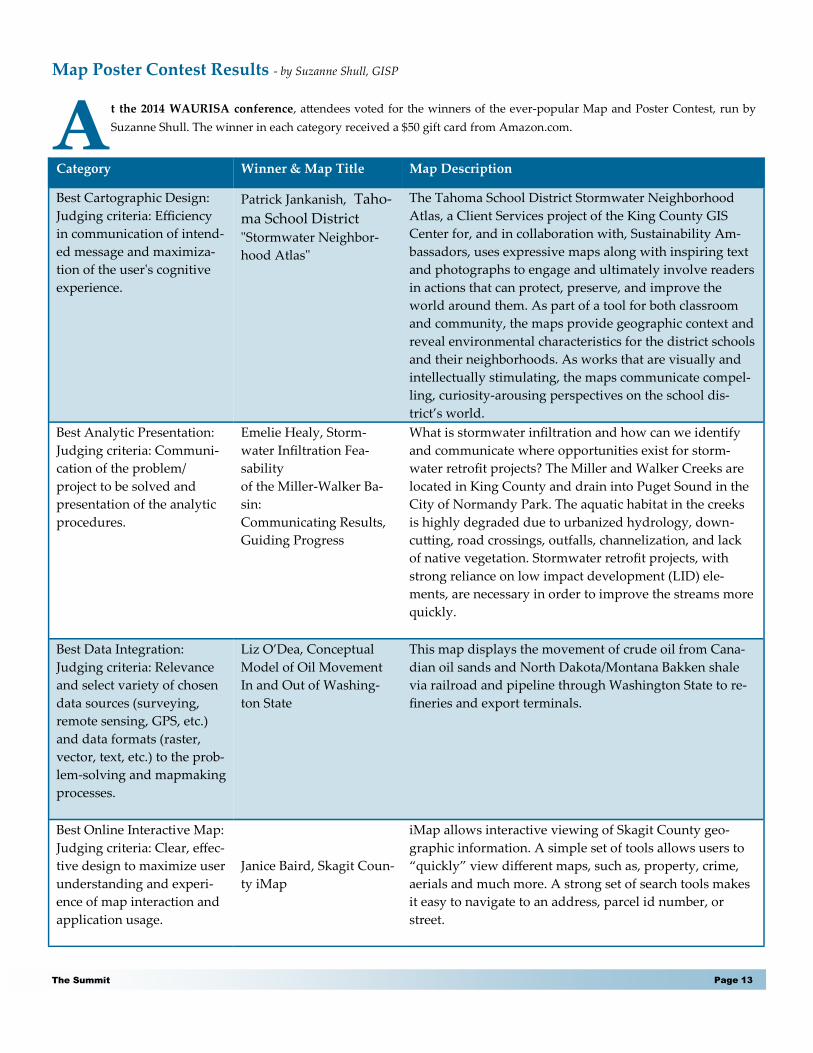
A t the 2014 WAURISA conference, attendees voted for the winners of the ever-popular Map and Poster Contest, run by
Suzanne Shull. The winner in each category received a $50 gift card from Amazon.com.
Category Winner & Map Title Map Description
Best Cartographic Design:
Judging criteria: Efficiency
in communication of intend-
ed message and maximiza-
tion of the user's cognitive
experience.
Patrick Jankanish, Taho-
ma School District "Stormwater Neighbor-
hood Atlas"
The Tahoma School District Stormwater Neighborhood
Atlas, a Client Services project of the King County GIS
Center for, and in collaboration with, Sustainability Am-
bassadors, uses expressive maps along with inspiring text
and photographs to engage and ultimately involve readers
in actions that can protect, preserve, and improve the
world around them. As part of a tool for both classroom
and community, the maps provide geographic context and
reveal environmental characteristics for the district schools
and their neighborhoods. As works that are visually and
intellectually stimulating, the maps communicate compel-
ling, curiosity-arousing perspectives on the school dis-
trict’s world.
Best Analytic Presentation:
Judging criteria: Communi-
cation of the problem/
project to be solved and
presentation of the analytic
procedures.
Emelie Healy, Storm-
water Infiltration Fea-
sability
of the Miller-Walker Ba-
sin:
Communicating Results,
Guiding Progress
What is stormwater infiltration and how can we identify
and communicate where opportunities exist for storm-
water retrofit projects? The Miller and Walker Creeks are
located in King County and drain into Puget Sound in the
City of Normandy Park. The aquatic habitat in the creeks
is highly degraded due to urbanized hydrology, down-
cutting, road crossings, outfalls, channelization, and lack
of native vegetation. Stormwater retrofit projects, with
strong reliance on low impact development (LID) ele-
ments, are necessary in order to improve the streams more
quickly.
Best Data Integration:
Judging criteria: Relevance
and select variety of chosen
data sources (surveying,
remote sensing, GPS, etc.)
and data formats (raster,
vector, text, etc.) to the prob-
lem-solving and mapmaking
processes.
Liz O’Dea, Conceptual
Model of Oil Movement
In and Out of Washing-
ton State
This map displays the movement of crude oil from Cana-
dian oil sands and North Dakota/Montana Bakken shale
via railroad and pipeline through Washington State to re-
fineries and export terminals.
Best Online Interactive Map:
Judging criteria: Clear, effec-
tive design to maximize user
understanding and experi-
ence of map interaction and
application usage.
Janice Baird, Skagit Coun-
ty iMap
iMap allows interactive viewing of Skagit County geo-
graphic information. A simple set of tools allows users to
“quickly” view different maps, such as, property, crime,
aerials and much more. A strong set of search tools makes
it easy to navigate to an address, parcel id number, or
street.

Page 14 Issue 35
King County GIS Center Helps Youth Sustainability Ambassa-
dors Engage Community By: Greg Babinski, GISP
S ustainability Ambassadors is a non-profit organiza-
tion empowering youth to catalyze community sus-
tainability. Founded in 2012 by long time educator
and strategic storyteller, Peter Donaldson, Sustainability Am-
bassadors is an innovative youth leadership program training
exceptionally self-motivated young people (ages 13-21) as
skilled ambassadors capable of tracking and communicating
improvements in sustainable community conditions across
generations and community sectors.
With funding from the State Farm Youth Advisory Board for
a “Stormwater Pollution Solutions” student service-learning
grant, Peter approached the King County GIS Center with the
idea for a sustainability-themed atlas comprised of multiple
stormwater indicator maps for the Tahoma School District in
suburban King County: a “Stormwater Neighborhood Atlas.”
The atlas would serve as a community
outreach tool to show students and the
broader community the environmental
conditions of their neighborhoods. The
atlas would also highlight unique pro-
jects to restore and enhance the environ-
ment at the district’s own school sites,
such as pervious pavement installation
and rainwater harvesting.
Local student Sustainability Ambassa-
dors are working with the school dis-
trict, the Chamber of Commerce, the
Rotary Club and the City of Maple Val-
ley to distribute the Stormwater Neigh-
borhood Atlas in appropriate classrooms
throughout the district, in the public
library, and for casual viewing in doctor
and dentist waiting rooms and in the
lobbies of other public spaces from
coffee shops to city halls. The school
district benefits by using the atlas to
teach about stormwater pollution solu-
tions through geography. The city bene-
fits by using the atlas as a tool for edu-
cating property owners in neighbor-
hoods related to each school campus
about best management practices for
reducing polluted runoff on site. This
helps the city meet their NPDES Stormwater Permit obliga-
tions for public education and outreach.
The process of engaging the community and producing the
Tahoma School District “Stormwater Neighborhood Atlas”
was designed from the beginning to be replicable for addi-
tional school districts and community groups throughout the
Puget Sound region. As the Sustainability Ambassadors pro-
gram engages with more communities, the intention is to
create additional atlases that are similar in nature to the Ta-
homa atlas, but that are customized to each community’s
unique geography and environment. The King County GIS
Center’s process is designed to accommodate additional com-
munity groups as they partner with Sustainability Ambassa-
dors.
The King County GIS Center’s unique cartographic and de-
(Continued on page 15)
Sample Atlas Page showing schools and impervious surface.

Page 15 The Summit
sign capabilities, and its direct access to King County’s exten-
sive GIS data resources, were invaluable to this project. The
KCGIS Center is known for its ability to produce high-quality
cartographic products. While GIS software can be used to
generate maps, the KCGIS Center has developed processes to
employ GIS data, GIS and graphic arts tools, and decades of
design experience to create exceptional maps. Sustainability
Ambassadors desired an end product that would be not just
utilitarian but also beautiful, and could thus inspire the com-
munity as they embarked on environmental restoration pro-
jects. The KCGIS Center’s special talents were essential in this
regard, as was the hands-on design collaboration that oc-
curred between the King County GIS Center, Mr. Donaldson
and the Sustainability Ambassadors student team.
The “Stormwater Neighborhood Atlas,” both intrinsically
and as an example of a collaborative effort, demonstrates the
KCGIS Center’s ability to successfully partner with communi-
ty groups to create beautiful and unique products with an
eye toward the future.
View the digital atlas here: http://
www.sustainabilityambassadors.org/stormwater-atlas
For more information about the King County GIS Center, see:
www.kingcounty.gov/gis
Spring GIS Events Roundup
Editor’s Note: Spring has been a busy time for GIS events both near and far. This section includes the following event overviews:
Hexagon International Users Conference by Ivar Husa, APCO-NENA 911 Conference by Khalid Khan, Green River Community
College GIS Presentations by Heather Glock, and Washington Women in GIS and Technology by Tonya Kauhi.
Hexagon International Users Conference: HxGN Live 2014 - by Ivar Husa
A t HxGN Live 2014, GIS professionals, engineers,
metrologists, and others met in Las Vegas to
share information, attend technical training, and
meet vendors. The scale of the event seemed rather enormous
to me, as it involved over 4,000 participants from around the
globe.
Hexagon is a global conglomerate with arms that engage
with smaller enterprises, such as public safety (my area) to
huge ones such as supertanker construction and open-pit
mining. Creating and managing spatial data was a significant
component of the event.
The theme of the event was Creating Great Stories, and the
CEOs addressing audiences emphasized the value of interact-
ing with one another. By getting to know one another, we
have the opportunity to be inspired to find breakthrough
solutions. Though technical tracks put people into seats to
hear presentations, organizers set aside blocks of time each
day specifically for interaction. Rubbing shoulders with peers
is a great way to expand one’s horizons.
I met people from such far-flung locations as South Africa,
Germany, and Great Britain, but my most meaningful interac-
tions were with GIS professionals from Public Safety Access
Points from around the country. GIS folks from at least four
Washington counties were in attendance.
I had an extended conversation about new energy technology
with a Los Alamos scientist building a 100MW heat exchang-
er having supercritical carbon dioxide as coolant. How ‘cool’
(Continued on page 16)

Page 16 Issue 35
Hexagon International Users Conference: HxGN Live 2014 - by Ivar Husa
is that?
Mobile Apps and The Cloud were probably the technical
themes that spanned the broadest range of companies and
products in attendance. Almost everybody wants to take ad-
vantage of the computing capacity of our smart phones.
The showroom floor was littered with whiz-bang tools and
props. One metrology company touted their surface contour
capturing tool, demonstrating it over a Tesla Model S, all-
electric sedan. Its optical sensing approach gathers data in 4”
wide swaths, where competitors would drag a stylus to cap-
ture a line of measurements instead.
Another exhibitor let you navigate through LiDAR-generated
scenes from a Mayan temple via novel software using a game
controller or Wii. On a related note, one of the more inspiring
exhibitors was CyArk. These people aspire to digitally pre-
serve world heritage sites, before they are erased from the
earth. They plan to have 3-D scanned 500 world heritage sites
in a period of 5 years. They are seeking partners to contrib-
ute expertise, time, and or money to digitally preserve more
sites.
This convention helped me look at the world through a wider
-angle lens as well as develop specific skills I can use support-
ing my 9-1-1 dispatch center. I plan to attend next year. See
you there?
(Continued from page 15)
Public safety is my ‘beat’. Mappers showed their work.
Total Station and scanning surveying equipment (3-D), with the latest features and software were being demonstrated by many vendors. One ven-
dor showed a perhaps improbable vehicle-mounted LiDAR.

Page 17 The Summit
Washington State Chapter of APCO-NENA Conference - by Khalid Khan
I like to evaluate the success of a conference experi-
ence not by the number of presentations I attended but
by the quality of the presentations themselves. This
year’s Public Safety Communication Conference of the Wash-
ington State Chapter of APCO/NENA in Kennewick was
definitely a quality experience.
APCO (Association of Public-Safety Communications Offi-
cials) and NENA (National Emergency Number Association)
are international agencies that present their members’ views
before communications regulatory agencies and policy-
making bodies. GIS plays an important role in Public Safety
communications, and this role will increase with Next Gener-
ation 911 (NG-911).
The GIS tracks were educational and informative. I listened
to presentations on GIS data development for (NG-911),
statewide GIS data collection requirements, and was able to
participate in a question and answer session regarding the
work the State 911 Office is doing to help coordinate GIS data
development statewide. I also had plenty of opportunities to
interact with the GIS professionals that were presenting at the
conference before and after their presentations. This was es-
pecially important to me since opportunities are little bit
more limited at a national level conference where there are so
many more attendees. The vendors were knowledgeable,
inviting and professional when it came to marketing their
hardware, software, and E-911 services.
From the presentations, I got a good understanding of the
work that is being done at the national and local levels to-
wards GIS data development for NG-911. Overall I found the
conference productive, meaningful and the perfect venue to
meet with some of the GIS professionals I’d previously only
met on conference calls. Topics of discussion included ad-
dress point collection, PSAP (Public Safety Answering Point)
polygon boundaries, edge matching and wireless sector cov-
erage areas.
In some of the cases I realized how perspectives differ de-
pending on which side of the mountains you live on. But
(Continued on page 19)

Page 18 Issue 35

however perspectives may differ, our common goal is to
work towards a statewide NG-911 system that can route 911
calls using GIS data. Much work is being done in WA State
related to NG-911 GIS data development, more still needs to
be done - especially for areas in the state that need financial
and technical assistance to help them catch up to NG-911
standards. It is no small task to build a statewide NG-911 GIS
data system for call routing amongst 39 counties with various
levels of GIS functionality. Representatives from the State 911
(Continued from page 17) Office and members of the state NG-911 GIS Subcommittee
who were present at the conference got an earful about what
some of the frustrations are with GIS data development,
maintenance, financing and professional GIS support in areas
of WA State where GIS technology and expertise is limited.
Chapter conferences like APCO/NENA give us opportunities
to work together, discuss, identify, resolve and offer our ser-
vices to one another for solutions that some of us have re-
solved and other will experience as we move towards NG-
911 statewide.
Page 19 The Summit
Washington State Chapter of APCO-NENA Conference - by Khalid Khan
Green River Community College GIS Student Presentations - by Heather Glock
G reen River Community College (GRCC) held its
6th edition of graduating GIS Student project
presentations on the afternoon of June 12, 2014. I
was lucky enough to be able to attend several of the presen-
tations. Joining me were a handful of other GIS profession-
als, GRCC administration staff, and non-program students
interested in seeing GIS technology applied to the real-
world.
This event was well-organized (including a delicious lunch!),
and portions of it were filmed by a student videographer.
Students presented on projects ranging from
analysis of campus population de-
mographics to the history of the fur
trapping industry across North Amer-
ica. Their project work benefited de-
partments within the college as well
as outside interests. Presenters came
from backgrounds ranging from Run-
ning Start Program, worker retraining, advance
degree holders, veterans, as well as traditional college stu-
dents.
Every presentation was well-prepared, invited questions,
and shared the humor and frustration that comes along with
doing project work. Though a scheduling conflict meant I
wasn’t able to see all of the presentations, highlights from
those I did see included:
Henry Isenberg, a Running Start student, studied demo-
graphic analysis to benefit the college’s Institutional Re-
search Office. He was approached by the director of institu-
tional research, Cynthia Requa, and asked to help analyze
demographics of current enrollments along with those of the
college’s service area in order to find areas for increased out-
reach to attract new students. Henry’s work will be carried
forward next fall by new students entering the program.
Joshua Prescott, a Navy veteran, developed a data model and
used it to field-inventory the campus stormwater system. His
colleague, Scott Nickels, did the same for the campus natural
gas network. For the first time, the college facility department
has access to this information digitally as a network dataset.
Under the guidance of Rob Huxford, a program graduate
now employed by the campus facility department, the work
these two students did has significantly in-
creased the facilities department’s mainte-
nance and planning efficiency.
Vanessa Sawyer, a photogrammetrist
graduating the program as a worker
retraining student, also used 3D analy-
sis to show the interesting relationship
between City of Renton hazard areas and
new housing developments on the waterfront. Her analysis
indicates people seem willing to accept the trade-off of living
in beautiful new housing with water views even though the
housing is sited adjacent to hazard areas (e.g., old chemical
sites) that may pose a health risk.
Kenneth Liesse, another worker retraining student, shared
ground-breaking work for the campus Aviation department
using 3D GIS to help aviation students understand airspace
classifications. Using his work, the students are now able to
understand these airspace concepts in half the time it used to
take when the lecture methods used paper and 2D illustra-
tions.
(Continued on page 20)
Kenneth Liesse used 3D GIS to
help students understand
airspace concepts in half the time
it used to take.

Page 20 Issue 35
Green River Community College GIS Student Presentations - by Heather Glock
Mary Lotfield, a Master’s student, presented her work done
on behalf of local author Joy Keniston-Longrie, mapping the
history of the North American fur trapping industry. Mary’s
maps will be featured in Keniston-Longrie’s book on the sub-
ject.
Aside from their curriculum workload, the GIS program stu-
dents also belong to the college’s GIS Alliance, where they
work with area high school and middle school classes to in-
troduce students to the geospatial industry. This adds an
enriching dimension to their studies, and hopefully, this out-
reach will result in some of these middle and high-school
students eventually becoming GIS students at the college.
The Green River Community College GIS program has been
led by Dr. Sabah Jabbouri since 2006. Sabah has worked tire-
lessly with the advice of a GIS Advisory committee to turn
out well-educated GIS analysts using modern GIS technolo-
gies and current analysis methods. Most of his students grad-
uate with job offers in place, or plans to continue their educa-
tion by applying their GIS education to their major. In addi-
tion to running the program, Sabah spends time advocating
(Continued from page 19)
GRCC student Joshua Prescott explains his stormwater system inven-
tory results.
Washington Women in GIS and Technology - by Tonya Kauhi
for colleges across our state to recognize introductory GIS
classes as a requirement for degree completion regardless of
major, as is done with English and math courses. Sabah was
the recipient of WAURISA’s Summit Award this year. We
wish Sabah and all of his students many years of continued
success!
W hat has the Washington Women in GIS and
Technology (WWGT) group been doing this
spring?
In May numerous members of WWGT group attended the
WAURISA 2014 Washington GIS conference. Thanks to the
coordination of Amanda Taub, we gathered for a breakfast
meeting on the second day of the conference where over 25
women including Breece Robertson, the National GIS Direc-
tor for The Trust for Public Land and the conference key-
note speaker, started the day together. Several WWGT
members also presented at the conference. Jennifer Radcliff
(Port of Tacoma) participated in a panel with other GIS co-
ordinators to discuss GIS communication. Renee Quenne-
ville (Pierce County) discussed asset management using
ESRI’s Collector application. Heather Glock (ESRI) partici-
pated in a session about Data Visualization. Joanne Markert
(Leon Environmental) and Maria Sevier (NW GIS Consult-
ing) participated in a panel on GIS Professional Networking
and Business Building. Amber Raynsford (The Watershed
Co.), Tonya Kauhi (GeoEngineers, Inc,) and Christina Gon-
zales (GeoEngineers, Inc,) presented a session on Personal
Branding.
At our June meeting, Jason Taylor (Floyd|Snider) provided
an interactive demonstration of Python, ArcGIS, and a hand-
ful of open source tools (such as GDAL) to develop raster-
based modeling and interpolation processes. GeoEngineers
hosted the event at their Tacoma office.
The Washington Women in GIS and Technology group was
created for South Puget Sound women working in GIS and
technology to meet, network, brainstorm and learn from one
another. The group meets quarterly.
The group has recently expanded beyond the South Puget
Sound; in fact during our last call, we had one person call in
from Spokane. And it is not just for women anymore; we
have had interest from a couple of men wanting to partici-
pate. Although our group was started by women who share
the GIS profession, whoever shares this interest is welcome to
join.
Please join us for the next meeting scheduled for Wednesday,
August 13th, 2014 at the GeoEngineers Tacoma office; 1101
South Fawcett Ave, Suite 200, Tacoma, WA, 98402.
Follow us here on LinkedIn.

Page 21 The Summit
City of Bothell’s Streams (City of Bothell, 2014). After com-
pleting the initial impervious surface analysis for the city, we
wanted to examine the potential effects increased impervious
surface area has on runoff volume. How does an increase in
impervious surface in a watershed affect the flow accumula-
tion and total volume of runoff from a significant rain event?
Methods We selected three separate watershed sub-basins
within the city with disparate total areas and imper-
vious surface percentages: Blythe Creek, Horse
Creek, and Maltby Hill Creek (see table 1 for details
on each basin). Each of these sub-basins was then
overlaid with soil, elevation, and impervious surface
data, provided by the City of Bothell’s GIS depart-
(Continued on page 23)
help encourage indigenous species to continue living in the
area, and to improve connectivity to the various animal com-
munities near the I-405 corridor. Community partners
(Friends of North Creek Forest, 2013) and university students
have also been assisting the city by performing stream health
assessments along North Creek and its tributaries, and sur-
veying slope degradation in Queensborough/Crystal Creek.
Some of the programs at UW that have assisted the city in-
clude the UW Restoration Ecology Network, the Hydrogeolo-
gy, Geomorphology and GIS classes at UW Bothell.
Part of improving the city’s infrastructure includes improv-
ing the mechanisms for handling surface water runoff within
the twenty-two sub-basins (see Map 1: Watershed Sub-Basins
used for Flow Accumulation and Total Runoff Volumes in the City
of Bothell, Washington). One major project the city is currently
undertaking is rerouting Horse Creek. Horse Creek is one of
the largest sub-basins within the city, and is channelized un-
derground in downtown. According to Andy Loch, the Sur-
face Water Program Coordinator for the City of Bothell, when
the creek is rerouted, it will be widened to better accommo-
date the increased flow volume it has received in recent
years.
A contributing factor to the amount of runoff is the amount of
impervious surface within each basin. Bothell’s Surface Water
Management department requested an impervious surface
analysis of each of their sub-basins, in January 2014, to help
quantify the significance of each impervious surface within
the basins, and to help determine where funding could be
invested most effectively to reduce the amount of runoff
within each basin. This impervious surface data will be incor-
porated into the next revision of the Health Assessment of
(Continued from page 5)
Winner of Second Place Paper: Runoff and Flow Accumulation
in Three Watershed Sub-basins in Bothell, WA
Table 1: Total impervious surface within Blythe Creek, Horse Creek, and
Maltby Hill Creek. Impervious surface area is expressed in m2, total surface
area is expressed in km2, and the ratio of impervious surface to total surface
area is expressed as a percentage. Values are based on vector-polygon
shapefiles provided by the City of Bothell's GIS department.
Basin
Impervious
Area (m2)
Total Area
(km2)
% Impervious
Surface
Blythe Creek 2817.25 0.08603 3.27%
Horse Creek 1028985.04 2.89035 35.60%
Maltby Hill Creek 331627.37 1.23185 26.92%

Page 22 Issue 35
Figure 1. Manley (1977) equation. Used to calculate rate of run-
off for an individual cell (q) with an established rainfall rate (w),
and saturated hydraulic conductivity (Ksat).
Figure 2. Runoff volume adaptation of Manley’s equa-
tion, where total rate of runoff for an area (R) is calcu-
lated by multiplying the rate of runoff (q) by the total
area of a given surface type (A).
Winner of Second Place Paper: Runoff and Flow Accumulation
in Three Watershed Sub-basins in Bothell, WA
Figure 4. Graphical comparison of peak flow accumulation rates per km2 for Blythe Creek (left), Horse Creek (right),
and Maltby Hill Creek (center) basins in 2 year peak (r= 0.944; n=3) and 100 year peak (r= 0.833; n=3) rainfall events.
Values represent the highest rate of flow through measured in an individual cell per hour, and normalized by dividing
by the total area of the basin. See table 4 for raw numerical values, and attached maps for flow accumulation models.
See Maps for 2 year and 100 year flow accumulation models of Blythe Creek, Horse Creek, and Maltby Hill Creek.
Figure 3. Graphical comparison of runoff rates per km2 for Blythe Creek (left), Horse Creek (right), and Maltby Hill
Creek (center) basins in 2 year peak (r=1.00; n=3) and 100 year peak (r=1.00; n=3) rainfall events. Values represent
the total runoff in the basin per hour, and normalized by dividing by the total area of the basin. See table 4 for raw nu-
merical values.
(continued from page 21)

Page 23 The Summit
Table 3: Rainfall rates for Bothell, Washington based on
maximum volumes measured in 6-hour increments with a
2 year and 100 year frequency as measured by the Na-
tional Oceanic and Atmospheric Administration (Miller,
Frederick and Tracy, 1973). Rate in inches per hour is a
mean value calculated from the total volume measured in
6 hours.
Frequency
Rate (in/6 hrs)
Rate (In/hr)
2 years 0.90000 0.15000
100 years 1.90002 0.31667
Table 2: Saturated hydraulic conductivity estimates for soil
types found within the Blythe Creek, Horse Creek, and Malt-
by Hill Creek sub-basins. Ksat values are represented in units
of inches per hour. Higher values indicate that water is able to
travel through a soil more readily. Water bodies and impervi-
ous surface were assumed to allow no infiltration. Values are
calculated from estimates provided by the US EPA (US EPA,
1986) and the Soil Survey Staff at the Natural Resource Con-
servation Service (Soil Survey Staff, NRCS, USDA, 2014).
Soil Type Ksat
Alderwood gravelly sandy loam 67.00000
Alderwood urban land complex 65.00000
Alderwood-Everett gravelly sandy loam 67.00000
Arents, Alderwood material 6.00095
Custer fine sandy loam 1.99984
Everett gravelly sandy loam 67.00000
Impervious 0.00000
Indianola loamy fine sand 1.99984
Kitsap silt loam 0.85093
McKenna gravelly silt loam 53.50000
Mukilteo muck 0.42520
Norma loam 1.27559
Puget silty clay loam 0.42520
Ragnar-Indianola 67.00000
Seattle muck 0.42520
Terric medisaprists 1.27559
Water 0.00000
separated according to their sedimentary distribution using
the Soil Characterization guide from the Natural Resources
Conservation Service (Soil Survey Staff, NRCS, USDA, 2008).
The sedimentary distributions were then categorized accord-
ing to their hydraulic conductivity, using data provided by
the US EPA and the Soil Survey Staff at the Natural Resource
Conservation Service (US EPA, 1986; Soil Survey Staff, NRCS,
USDA, 2014; see table 2 for hydraulic conductivity values).
Precipitation rates were calculated using maximum rainfall
data collected by the National Oceanic and Atmospheric Ad-
ministration (Miller, Frederick and Tracy, 1973). Using the 2
year and 100 year maximum rainfall for rain events lasting 6
hours in the Bothell area, we calculated the mean rainfall rate
for a typical heavy rain (2 year frequency) and an exception-
ally heavy rain (100 year frequency; see table 3 for rainfall
rates). We constructed weight rasters for each sub-basin by
overlaying the impervious surface data on top of the soil data
and applying the Manley (1977) equation to each rain event,
using map algebra (see figure 1 for equation). Due to the de-
sign of the Manley equation, as the hydraulic conductivity
approaches 0, the calculated runoff approaches infinity. To
account for this discrepancy, areas covered in impervious
surface or water bodies were assumed to allow no infiltration,
and therefore all precipitation from these areas was assumed
to be runoff. We constructed a flow direction raster by con-
verting the contour elevation model into a filled, high-
resolution (2 foot cell size) digital elevation model. Runoff
volume for each cell was then used to calculate the total run-
off volume for each basin (see figure 2 for equation).
Results Comparing total runoff rate and flow accumulation within
the three basins during both 2 year and 100 year frequency
peak rain events, without normalizing for total surface area
of each basin, indicated that there was a significant correla-
tion between the total amount of surface area and the ex-
pected rates of runoff and flow accumulation (2 year runoff:
r=0.895 ; 100 year: r=0.895 ; 2 year flow accumulation: r=0.853 ;
100 year flow accumulation: r=0.852 ; n=3). When runoff vol-
(Continued on page 24)
How does an increase in
impervious surface affect the
runoff from a significant rain
event?
ment. The soil data included characterizations of the most
prominent soil structures in an area. Elevation was provided
in a two-foot interval contour dataset. Impervious surface
data included sub-characterizations in 9 separate categories:
bridges, buildings, decks, driveways, parking lots, patios,
roads, sidewalks, and “other” (to account for all impervious
surfaces that did not fall into one of the other eight catego-
ries).
The soil characterizations provided by the city were then
(Continued from page 21)

Table 4. Summary of Blythe Creek, Horse Creek, and Maltby Hill Creek sub-basins in Bothell Washing-
ton. Total runoff volume and flow accumulation are given as rates in terms of m3 H2O/hour. Area is calcu-
lated in km2.
Characteristic
Blythe Creek Horse Creek Maltby Hill Creek
2 year Peak 100 year Peak 2 year Peak 100 year Peak 2 year Peak 100 year
Peak Total Area
0.086 km2 3.006 km2 1.301 km2
Percentage of Imper-vious Surface
3.27% 35.60% 26.92%
Total Runoff Volume
39.5 m3/hr 148.9 m3/hr 4,103.5 m3/hr 8,962.4 m3/hr 1,351.0 m3/hr 2,978.4 m3/hr
Peak Flow Accumu-lation
1.51 m3/hr 6.26 m3/hr 213.3 m3/hr 464.2 m3/hr 53.1 m3/hr 116.7 m3/hr
umes and flow accumulation rates were then normalized for
total surface area of the basins, by dividing the runoff and
flow accumulation of each basin by the total area of each ba-
sin, the linear correlation between the amount of impervious
surface and the total runoff rate, and flow accumulation rate,
became even more pronounced. Runoff rates as a ratio of m3
runoff per km2 became a direct linear correlation (see figure
3); however, flow accumulation rates as a ratio of m3 accumu-
lated per km2 indicated a possible exponential relationship
(see figure 4).
Conclusions There appears to be a direct, linear correlation between the
percentage of impervious surface in a basin and the total vol-
ume of runoff it produces (see table 4, and figures 3 and 4 for
runoff and flow accumulation rates). Flow ac-
cumulation also appears to have either a
direct or an exponential relationship
with increases in impervious surface
percentages in a basin. However, there
are three main constraints we see as
possibly limiting our ability to draw a
concrete conclusion: sample size, varia-
tion in hydraulic conductivity, temperature,
and increasing hydraulic head.
For this initial study, we selected only three separate basins.
While these three basins contain differing characteristics that
we wanted to account for in our calculations – such as area,
percentage of impervious surface, and mean slope – we feel
that drawing concrete conclusions based on such a small
(Continued from page 23)
Page 24 Issue 35
Winner of Second Place Paper: Runoff and Flow Accumulation
in Three Watershed Sub-basins in Bothell, WA
sample size would be premature. The findings of this study
do, however, indicate that further research including several,
if not all, basins in the City of Bothell is indicated.
Within soils with similar or identical characterizations (e.g.
Alderwood gravelly sandy loam, or Indianola loamy fine
sand) there is significant variation of hydraulic conductivity
rates, as indicated by disparate values presented by the US
EPA Hydraulic Conductivity method manual (1986) and the
Natural Resource Conservation Service Soil Survey Staff
(2014), which depends on a variety of sub characteristics in-
cluding the duration of a rain event, the porosity of a given
sample, the temperature of the soil, how compressed the soil
is, as well as the interconnectedness of gaps in the soil
(Brooks, Ffolliott, Gregersen, and DeBano, 2003).
Increases in soil saturation can change the amount of water
that is absorbed. While we have based our calculations on
completely saturated values, the actual hydrau-
lic conductivity in the beginning of a rain
event will be significantly higher, there-
by reducing the amount of runoff. The
level of compression within a section of
soil will also vary considerably be-
tween two points within an area with a
single soil type. This variation can be the
result of surface disturbance – such as con-
struction – or the amount and duration of weight
applied on the surface – a dirt or gravel road will likely be
more compressed than an open field. As a soil becomes more
compressed and more mixed, the interconnectivity of the
gaps between particulates will be reduced, which will influ-
ence the rate at which it can absorb water. Finally, the hy-
When runoff volumes and flow
accumulation rates were
normalized, the linear
correlation became even more
pronounced.

draulic head, the distance between the surface and the top of
the water table, will vary throughout an area based on the
resistance of the surrounding soils to the movement of water,
the slope and elevation of the soil, and the duration of a re-
cent rain event. As the hydraulic head rises, the more re-
sistant the soil matrix will become to accepting additional
water. To better account for these variables, we recommend
that further research conducted to estimate runoff volume
and flow accumulation will include multiple basins, prefera-
bly more than twenty, to better determine any correlating
factors between basins.
Acknowledgements We would like to give special thanks to Santiago Lopez and
Rob Turner from the University of Washington Bothell, and
Andy Loch from the City of Bothell for all their help and sup-
port in completing this project. Santiago Lopez was our GIS
mentor throughout the project. Rob Turner was instrumental
in giving us advice on using the data we had available to
calculate runoff. Andy Loch, our contact from the Surface
Water Management Department in the City of Bothell, was
tremendously helpful in getting the raw data we needed to
complete the project.
Works Cited Brooks, K.N., Ffolliott, P.F., Gregersen, H.M., DeBano, L.F.
(2003). Infiltration, Runoff, and Streamflow. In Hydrology and
the Management of Watersheds 3rd Ed (p77-87). Hoboken, NJ:
Blackwell Publishing.
City of Bothell. (2014). Health Assessment of City of Bothell’s
Steams: 2010-2013 (Version 2013-01, revised January 2014).
Bothell, WA. Print.
Downtown Bothell (2011). Downtown Bothell Continues to
Grow. Retrieved from: http://downtownbothell.com
Friends of North Creek Forest (2013). Stunning Biodiversity in
an Urban Setting. Retrieved on 10 May 2014 from: http://
www.friendsnorthcreekforest.org
Manley, R.E. (1977). The Soil Moisture Component of Mathemati-
cal Catchment Simulation Models. Journal of Hydrology; 35(3-
4): p. 341-356.
Miller, J.F., Frederick, R.H., Tracy, R.J. (1973). NOAA Atlas 2:
Precipitation-Frequency Atlas of the Western United States Vol. IX
– Washington. NOAA: Silver Spring, MD. p. 35.
Soil Survey Staff, NRCS, USDA (2008). Official Soil Series De-
scriptions. Retrieved on 9 April 2014 from http://
soilseries.sc.egov.usda.gov/osd_index.html
Page 25 The Summit
Soil Survey Staff, NRCS, USDA (2014). Saturated hydraulic
conductivity. Retrieved on 13 April 2014 from http://
www.nrcs.usda.gov/wps/portal/nrcs/detail/soils/survey/
office/ssr10/tr/?cid=nrcs144p2_074846
US EPA (1986). SW-846 Method 9100: Saturated Hydraulic
Conductivity, Saturated Leachate Conductivity, and Intrinsic Per-
meability. Retrieved on 9 April 2014 from: http://
www.epa.gov/osw/hazard/testmethods/sw846/pdfs/9100.pdf
USGS Washington Water Resource Center (2014). Lake Wash-
ington Basin - Real-time Sites. Retrieved on 30 June 2014 from
http://wa.water.usgs.gov/cgi/realtime.data.cgi?
basin=lwashington
Maps continue on following page.

Page 26 Issue 35
Winner of Second Place Paper: Runoff and Flow Accumulation
in Three Watershed Sub-basins in Bothell, WA

Page 27 Issue 35
underway with WAURISA Secretary Sarah Myers serving as
our conference chair. And lucky for us, the 2015 URISA GIS-
Pro will be held in Spokane in October. WAURISA, along
with the Northwest GIS Users’ Group and the Northern
Rockies Chapter of URISA, will join forces to support
this event. This will serve as a great oppor-
tunity for our members east of the Cas-
cades to have a conference in their back-
yard.
We have resurrected our dormant Out-
reach Committee. This committee is
now called the Community Engage-
ment Committee, and it is headed up by
Anna Yost, a recent Master’s graduate from
Central Washington University. The focus of
the committee will be to promote geospatial technology
awareness in business verticals including K-16 education,
business, legislature, as well as geospatial-related industries
such as surveying. We’re developing a compendium of re-
sources for our membership to draw from to engage these
(Continued from page 1)
President’s Column
communities, and we’re working on a way to connect mem-
bers seeking to collaborate on these engagements.
Recently, WAURISA was made aware of a proposed state
rule here related to the practice of land surveying that could
dramatically impact the work of GIS practitioners if it were
enacted. We contacted International URISA’s
Advocacy committee for help in crafting a
response to the proposed rule. The Ad-
vocacy committee came through with
flying colors, and we are truly im-
pressed with the knowledge, experi-
ence, and enthusiasm embodied by
this group. The experience kicked-off
interest between URISA chapters and
International URISA to share know-how in
the area of effective advocacy. We’re actively
working with URISA to bring these skills to our chapter. It’ll
add a great benefit to what we can offer to our members in
addition to the education and networking opportunities we
make available.
Finally, I want to acknowledge our annual election results
by welcoming Renee Quenneville to our board, and congrat-
ulating returning board members Don Burdick, Josh Green-
berg, and Cort Daniel. These folks keep us fiscally sound,
keep our business systems running, and develop great
workshop content for our members and the greater geospa-
tial community. Combined with the other seven mid-term
board members, we continue to move forward, constantly
looking for ways to provide more value to our members.
If you have an education, networking, or advocacy idea
you’d like to discuss, please drop me a line at presi-
Cherish the rest of these summer days. I’ll see you in the fall!
The Advocacy committee came
through with flying colors, and
we are truly impressed with
the knowledge, experience, and
enthusiasm embodied by this
group.

Editorial By: Eadie Kaltenbacher, GISP
W hat an exciting time to be part of GIS in
Washington State. WAURISA's annual con-
ference just came to a close, and attendees
walked away inspired to try new GIS tools and techniques; as
well as improve their communication. At least three other GIS
events took place in the State (see Spring GIS Events Round-
up beginning on Page 15), and more are planned soon. Also at
this time of year, many students are graduating from GIS
programs and looking to bring their energy and new-found
knowledge to the workplace.
It is a great honor to collect submissions related to these activ-
ities (and many more) and gather them into The Summit. Over
the past few issues, I have been lucky to have the editing help
of GIS community leaders Karl Johansen and Greg Babinski.
These editors would provide edits within a week of the publi-
cation date.
However, some of the proposed edits offered more oppor-
tunity than a week's worth of turnaround could provide. For
example, an editor might propose providing more detail on
certain aspects of the story, or streamlining other aspects. I
want to give authors the chance to take advantage of these
suggestions with enough time to implement them. So we will
be trying out a new process beginning with the Autumn Is-
sue.
Page 28 Issue 35
Public Maps
in Washington
“S he bought a plan of Paris, and with the tip of
her finger on the map she walked about the cap-
ital. She went up the boulevards, stopping at
every turning, between the lines of the streets, in front of the
white squares that represented the houses. At last she would
close the lids of her weary eyes, and see in the darkness the
gas jets flaring in the wind and the steps of carriages lowered
with much noise before the peristyles of theatres.
-from Madame Bovary, by Gustave Flaubert
The Summit is the newsletter of WAURISA. To encourage the
discussion of issues and ideas of importance to the Washing-
ton GIS community, we welcome letters to the editor or opin-
ion essays. Letters should be a maximum of 100 words and
essays should be limited to 500 words.
Chief Editor: Eadie Kaltenbacher
Editorial Board: Eadie Kaltenbacher, Greg Babinski, Effie
Moody
Interview Editor: Michelle Lortz
Copy Editing: Karl Johansen, Greg Babinski
For subscriptions, content, comments, or suggestions, email:
Pictorial map
illustrating points
of interest; spotted
just outside Cle
Elum.
Literary Corner
Authors will now be welcome to submit an optional "First
Draft" version of their story for review of content. The dead-
line for First Drafts will be a month before the Final Draft
deadline.
All Final Drafts will continue to go through proofreading for
typos and grammatical errors. The deadline to submit Final
Drafts will remain the same (one week prior to publication).
Please see the table below for upcoming deadlines.
I hope this process will help to build up the high quality of
The Summit by showcasing your stories in the best possible
light.
UPCOMING DEADLINES
Submit articles to The Summit for publication by:
Autumn Issue Winter Issue
9/17/2014 12/16/2014 First Draft
(optional)
10/17/2014 1/16/2015 Final Draft

Page 29 The Summit
Since 1986, Cityworks® has been providing innovative GIS-centric management
software to public agencies that own and care for infrastructure and property. Built exclusively on Esri’s ArcGIS technology, Cityworks is a powerful, scalable, and affordable platform for asset management, permitting, licensing and more.
Time-tested and proven technology, Cityworks is Empowering GIS® at more than 500 user sites around the world.
Esri’s geographic information system (GIS) software gives you the power to think and plan geographically. GIS is used in more than 350,000 organizations world-
wide. It helps cities, governments, universities, and Fortune 500 companies save money, lives, and our environment. Whether transporting ethanol or studying landslides, these organizations use GIS to collect, manage, and analyze geographic
information, which helps them see relationships, patterns, and trends. They can then solve problems and make better decisions because they are looking at their data in a way that is quickly understood and easily shared.
David Evans and Associates, Inc. (DEA) is a multidisciplinary consulting firm doing business in the energy, land development, transportation and water markets.
Centered on the core purpose of improving the quality of life while demonstrat-ing stewardship of the built and natural environment, our professional staff work together to understand client needs, provide creative thinking and technical
excellence, and deliver extraordinary service that exceeds expectations. As an infrastructure planning and design firm, DEA was founded and is headquartered in Portland, Oregon, with offices across the Western United States.
Electronic Data Solutions proudly offers sales and support services for Trimble
GPS mapping systems, Esri GIS software, Laser Technology rangefinders, Juniper Systems field computers, In-Situ water level and water quality instrumentation and Teledyne RD Instruments acoustic doppler current profilers. We provide
industry specific software and expert guidance while assisting you to find exactly what you need to efficiently capture field data.
Founded over 30 years ago, Geoline Inc has long been the leading industry of
advanced positioning solutions in the Pacific Northwest. We provide instru-ments, tools, supplies, software, and solutions for all your Geospatial needs. With showrooms in the surrounding areas of both Seattle and Portland, remote
employees in Eastern Washington and Boise Idaho, as well as a Partner dealer in Medford Oregon, our well trained staff is prepared to assist you in any Sales, Service, Rental, Training, or Support needs. Geoline Inc is the only authorized
Trimble Reseller of all Trimble Geospatial products in the territory of Washing-ton, Oregon, and Idaho. Our objective
thanks the following sponsors
for their generous support:

Page 30 Issue 35
The King County GIS Center provides quality service and exceptional value for our clients with one of the most capable GIS organizations in the Pacific North-west. Unlike most consultants, our professional staff members are not merely
theoreticians, but practicing users of the types of GIS solutions government and business require. Why do we offer our services to outside customers? We have a long-term interest in the success of GIS throughout the region. We
know that our success depends on satisfied clients and we are committed to delivering quality GIS business solutions that provide value for our customers. Whether you need consulting, programming, data, mapping, or GIS training - -
Let KCGIS help you put GIS to work!
Latitude Geographics helps organizations succeed with web-based geography by enabling them to make better decisions about the world around them. Geocor-tex software by Latitude Geographics transforms how organizations design,
develop and maintain Esri ArcGIS Server and ArcGIS Online web mapping appli-cations. They do more; faster, at less cost and risk, and with better results. ArcGIS by Esri is the world’s leading GIS platform and Latitude has been an Esri
Platinum Partner since 2010.
CycloMedia’s products offer a complete end-to-end solution for collecting, pro-cessing, and hosting street-level panoramas allowing professionals to leverage the intelligence of updated geo-referenced imagery.
We provide ready-made solutions throughout North America and Europe. Our technology is widely used in government, GIS, public safety, and security mar-kets, as well as in construction, infrastructure management and insurance.
Our technology revolutionizes the way asset and property assessment is man-aged and reported. It reduces field visits and provides accurate feature measure-ments with easy spot-checking. It simplifies maintenance and enables automated
inventory and control processes.
Accela’s GIS-infused software makes government processes easier, faster and more accessible for local, state and federal workers. Accela Automation® auto-
mates tasks associated with permitting, licensing, code enforcement, community development, asset management, emergency response, and more. Tight ArcGIS integration lets workers share data and maps in the office or field.
Pioneers of industry leading Spatial Data Access Solutions, Valtus provides users with an easy and reliable storage, management and distribution solution, with
software agnostic access being gained through multiple protocols such as OGC WMS, WMTS, ArcXML and ArcGIS imagery services, thereby allowing them to derive greater value from their data.

Page 31 The Summit
Hexagon Geospatial helps you make sense of the dynamically changing world.
Hexagon Geospatial provides the software products and platforms to a large variety of customers through direct sales, channel partners, and Hexagon busi-nesses, including the underlying geospatial technology to drive Intergraph Securi-
ty, Government & Infrastructure (SG&I) industry solutions. Hexagon Geospatial is a division of Intergraph Corporation.
With more than 11,000 clients, Tyler Technologies is a leading provider of soft-ware and services for the public sector. Designed with an insider’s understanding of the public sector market acquired from more than 30 years of industry expe-
rience, Tyler Solutions reach all areas of the public sector. Comprehensive and easy-to-use applications streamline processes and improve the flow of infor-mation throughout an organization, empowering local and county governments,
schools and other entities to better serve citizens.
Kroll Map Company - serving the northwest with over 100 years of maps and mapping services. We serve a broad range of organizations with services ranging from Custom Cartography to CAD/GIS Integration to digitizing and geo-
referencing. Current clientele includes utilities, telecommunications, recycling-waste industries, and general business/real estate. Kroll offers general mapping services and products through our affiliate - Metsker Maps of Seattle in the Pike
Place Market and now also at Sea-Tac International Airport.
Salish Coast Sciences is a small
highly skilled GIS consulting firm located in Bellingham, Washington. We can help
evaluate and fine tune your spatial data tools. With a com-bined 60 years of experience
working with environmental
and local government agencies, you get all the benefit of quali-
fied and knowledgeable profes-sionals. We specialize in con-sulting and mentoring on GIS
design and implementation, spatial analysis, web mapping and cartography.
3Di is a leading provider of aerial mapping, LiDAR, and GIS related services with a particular empha-
sis on supporting clients in the Pacific Northwest. Recent pro-
jects have focused on site devel-
opment, floodplain mapping, transportation engineering, land-fills, environmental analysis, facili-
ties engineering, airport master plans, and municipal mapping.

GIS User Groups in Washington
ACSM – Washington State Section
www.wss-acsm.org
Cascadia Users of Geospatial Open Source
groups.google.com/group/cugos
Contact Karsten Venneman
Central Puget Sound GIS User Group
Join Listserve here
Central Washington GIS User Group
Meets the 2nd Wednesday of each month.
Contact Amanda Taub
Cowlitz-Wahkiakum GIS User Group
Meets the last Wednesday of each month at 3:00 pm at the
Cowlitz-Wahkiakum Council of Governments meeting room,
207 North 4th Ave, Kelso WA.
Contact TJ Keiran
King County GIS User Group
www.kingcounty.gov/operations/GIS/UserGroups.aspx
Meets 1st Wednesday every other month at 11:00am at the
KCGIS Center, 201 S. Jackson Street, Seattle WA, Conf Room
7044/7045.
Northwest Washington GIS User Group
www.wwu.edu/huxley/spatial/nwwgis/nwwgis_mtgs.htm
Southeast Washington/Northwest Oregon GIS User Group
http://gisgroup.wordpress.com
Washington Geographic Information Council (WAGIC)
geography.wa.gov/wagic
Join Listserve here
Washington Hazus Users Group
http://www.usehazus.com/wahug
Contact Kelly Stone
WAURISA
1402 Auburn Way North
PBN 158
Auburn WA 98002
WAURISA Contacts
Board of Directors 2013-2014
Heather Glock President
Ian Von Essen Vice President
Sarah Myers Secretary
Don Burdick Treasurer
Ann Stark Past President
Board Members At-Large
Cort Daniel
Joshua Greenberg
David Howes
Renee Quenneville
Josh Sisco
Dana Trethewy
WAURISA Committee Leads
Joshua Greenberg Chapter Advisory Board
Anna Yost Community Engagement
Sarah Myers Conference Lead
Don Burdick Finance
Amanda Taub Marketing
Suzanne Shull Membership
Ian Von Essen Nominating
Joshua Greenberg Professional Development
Cort Daniel Technology
The Summit
Eadie Kaltenbacher Editor-in-Chief
Greg Babinski Editorial Board
Effie Moody Editorial Board
Karl Johansen Copy Editor
Michelle Lortz Interview Editor
To have your GIS-related group or event listed in future issues
of The Summit, notify the editor at: [email protected]
To be added to The Summit mailing list, contact:
Back issues of The Summit are available at:
http://waurisa.org/thesummit/
Interested in volunteering your time to help WAURISA? Con-
tact any Board member listed on the right.
Page 32 The Summit