ISSN (Print): 0976-8629
119
Transcript of ISSN (Print): 0976-8629


ISSN (Print): 0976-8629 www.iitmipujournal.org
ISSN (Online): 2349-9826
Indexed in:
Google Scholar, EBSCO Discovery, indianjournals.com & CNKI Scholar(China National Knowledge Infrastructure Scholar)
IITM Journal of Management and ITVolume 11 Issue 1 January-June 2020
CONTENTS
Research Paper & Articles
• Performance Analysis of Feature-Based Automated Measurement of Mouse Social Behavioral 1Mohammad Muntasir Rahman, Mst. Ashrafunnahar Hena, Bikash Chandra Singh& Mohammad Alamgir Hossain
• Cross-layer Security Solution for Secure Communication of Sensorsin Wireless Sensor Networks 6Rakesh Kumar Saini & Naveen Kumar
• Design of a Solution for a Biometric Face Recognition Task 11Kshitiz Bajagain & Swati Sah
• Deep Neural Network for the Automatic Classification of Vertebral Column Disorders 18Menaka Ramasamy, Sabenabanu Abdulkadhar & Jeyakumar Natarajan
• Tuning Parameters Using Machine Learning for Minimizing Slowness of Traffic in Smart Cities 22J V N Lakshmi
• Blockchain Technology in Banking and Finance 27Heena Arora & Anita Venaik
• Artificial Neural Network in Developing Software Project Telemetry Metrics 36Himanshu Sharma
• Artificial Intelligence and Techniques 42Manu Shree
• Information and Communication Technology Adoption: A Case study of Nigerian TertiaryEducation Regulatory Agency 45
Oladipupo Bello & Yskandar Hamam
• Cooperative Spectrum Sensing with Selection Diversity Reception in Cognitive Radio 52Md. Shahabub Alam, Mohammad Alamgir Hossain, Mst. Ashrafunnahar Hena,Md. Ibrahim Abdullah & Md. Shamim Hossain

• Design and Development of Arduino Based Contactless Thermometer 56Md. Abdullah Al Mamun, Mohammad Alamgir Hossain, M. Muntasir Rahman,Md. Ibrahim Abdullah, & Md. Shamim Hossain
• ProgX-Programmable Extension Board 60Lalit Ahuja, K Kirthik Vasan, V. Manikanta Kushal, Manisha & Mamta Rani
• ICT in Higher Education: A Review of Issues, Challenges and Solutions withSpecial Reference to India 63
Mohit Dixit & Lovish Raheja
• Effects of Video Games on Mental Concentration 69Shriya Pandey
• A Brief Survey of Cryptocurrency Systems 73Sushma Malik & Anamika Rana
• ICT Initiatives and Tools in Higher Education 78Rachita Arora & Romika Yadav
• Digital Signatures 82Pankaj Kumar Varshney, Anmol Kukreja, & Shivam Dewan
• A Study on Mobile Applications in Education 87Ravi Sunitha & Singh Elina
• A Study on Machine Learning Tools 93Shivani Sharmab & Sudhir Kumar Sharma
• Intrusion Detection Techniques for Mobile Cloud Computing in Heterogeneous 5g 98Ishu Chawla, Oshin Vinayak, & Suman Singh
• Usage of Internet of Things in Education 105Romika Yadav & Palak Khurana
• Recommender System: A Review 108Shipranjali & Sudhir Kumar Sharma

1Volume 11, Issue 1 • January-June 2020
Abstract—Automated social behavior analysis in the mammalian animal has become an increasingly popular and attractive alternative to traditional manual human annotation with the advancement of machine learning and video tracking system for automatic detection. In this work, we study a framework of how different features perform on the different classi ers to analyze automatic mice behavior. We conducted experiments on the Caltech Resident-Intruder Mouse (CRIM13) dataset, which provides two types of features: trajectory features and spatio-temporal features. With this feature, we train AdaBoost and Random Decision Forest (TreeBagger) classi ers to classify different mouse behaviors to show which features perform best on which classifier. The experimental result shows that the trajectory features are more informative and provide better accuracy than the widely used spatio-temporal features, and AdaBoost classi er shows better performance than the TreeBagger on these features.Index Terms—Social behaviors recognition, machine learning, trajectory features, spatio-temporal features, classi cation.
I. INTRODUCTION
Detecting and classifying the social behavior of experimental animals is an interesting issue in computer vision and neuroscience research. Social behavior analysis is very important for understanding the connection between neural activity and behavior. In order to understand this connection, many exciting methods have been developed over the years [1], [2], [3], [4], [5]. However, the traditional manual visual observation of animal activities takes a lot of time and manpower to analyze social behavior. With the rapid development of machine learning and video surveillance technology, automatic detection of unusual animal activities and
behavior analysis have become popular to the researchers [6], [7], [8]. It is very difficult to conduct behavior analysis directly on humans. Therefore, research on animals provides a great opportunity for the development of automatic behavior analysis research.In this work, we investigate the automatic mouse behavior analysis on the different features extracted from videos in the home care settings. Our main objective is to classify certain social behaviors of mice, such as ’sniff’, ’attack’, ’eat’ and ’walk’. We use the publicly available Caltech Resident-Intruder Mouse dataset (CRIM13) [9], which contains 237×2 videos (recorded with synchronized top and side view) of pairs of mice engaging in social behavior, divided into 13 different actions. Each video lasts about 10 minutes, a total of 88 hours of videos and 8 million frames. Each video is annotated frame by frame basis by some behavior experts.The automatic behavior categorization typically requires a classification algorithm to characterize the visual information in the videos [10], [11], [9], [12]. In order to identify different behaviors, examples of labeled features are used to determine the parameters in the classification algorithm. For this task, the CRIM13 dataset provides two types of features, namely trajectory features and spatio-temporal features. In this work, supervised machine learning techniques AdaBoost [13] and Random Forest (TreeBagger) [14] classi ers are used to analyze and model the extracted feature data for training. We use trajectory features and spatio-temporal features separately, and we found that the weak trajectory features are superior to widely used spatio-temporal features on these classi ers, especially on the AdaBooste classi er.The remainder of the paper is organized as follows. Section II presents related works. In section III, we formally describe the features of CRIM13 dataset.
Performance Analysis of Feature-Based Automated Measurement of Mouse Social Behavioral
Mohammad Muntasir Rahman†*, Mst. Ashrafunnahar Hena‡, Bikash Chandra Singh§, Mohammad Alamgir Hossain†
†Department of Computer Science and Engineering, Islamic University, Kushtia, Bangladesh‡Department of Electrical & Electronic Engineering, Islamic University, Kushtia, Bangladesh
§Department of Information and Communication Technology, Islamic University, Kushtia, Bangladesh*Corresponding author: [email protected]
2 IITM Journal of Management and IT
We conducted the experiment and provide results in section IV. Finally, section V concludes the paper.
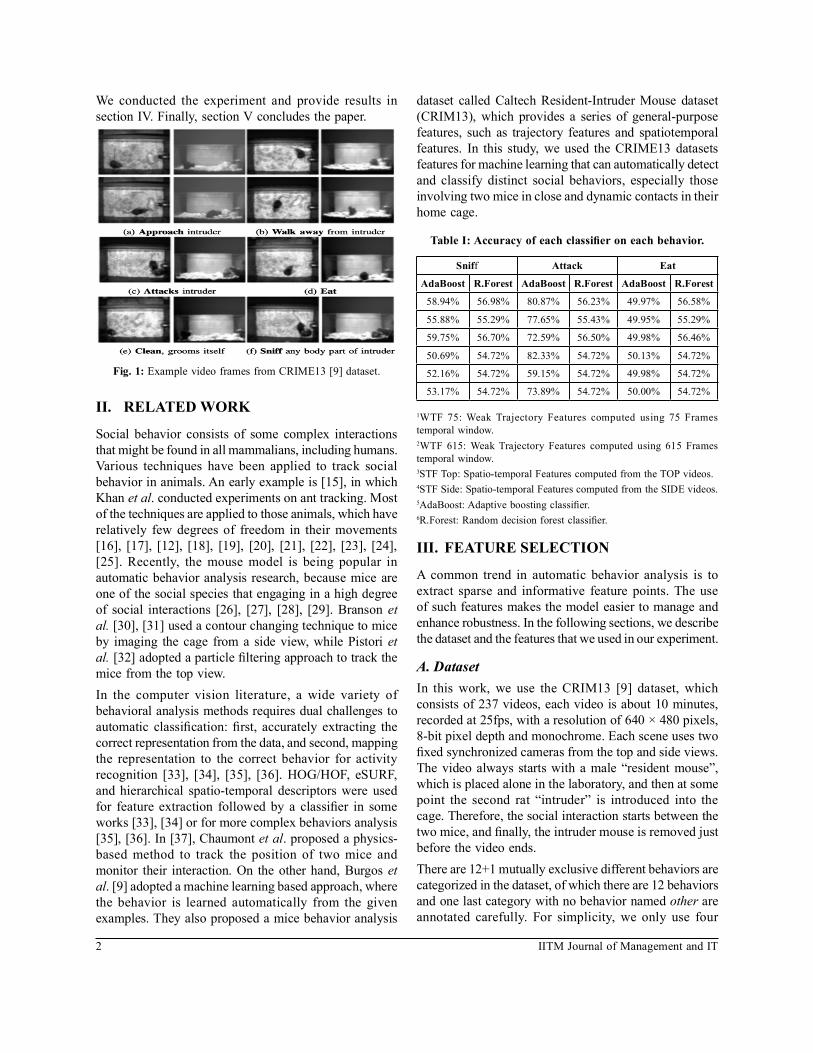
Fig. 1: Example video frames from CRIME13 [9] dataset.
II. RELATED WORK
Social behavior consists of some complex interactions that might be found in all mammalians, including humans. Various techniques have been applied to track social behavior in animals. An early example is [15], in which Khan et al. conducted experiments on ant tracking. Most of the techniques are applied to those animals, which have relatively few degrees of freedom in their movements [16], [17], [12], [18], [19], [20], [21], [22], [23], [24], [25]. Recently, the mouse model is being popular in automatic behavior analysis research, because mice are one of the social species that engaging in a high degree of social interactions [26], [27], [28], [29]. Branson et al. [30], [31] used a contour changing technique to mice by imaging the cage from a side view, while Pistori et al. [32] adopted a particle ltering approach to track the mice from the top view.In the computer vision literature, a wide variety of behavioral analysis methods requires dual challenges to automatic classi cation: rst, accurately extracting the correct representation from the data, and second, mapping the representation to the correct behavior for activity recognition [33], [34], [35], [36]. HOG/HOF, eSURF, and hierarchical spatio-temporal descriptors were used for feature extraction followed by a classi er in some works [33], [34] or for more complex behaviors analysis [35], [36]. In [37], Chaumont et al. proposed a physics-based method to track the position of two mice and monitor their interaction. On the other hand, Burgos et al. [9] adopted a machine learning based approach, where the behavior is learned automatically from the given examples. They also proposed a mice behavior analysis
dataset called Caltech Resident-Intruder Mouse dataset (CRIM13), which provides a series of general-purpose features, such as trajectory features and spatiotemporal features. In this study, we used the CRIME13 datasets features for machine learning that can automatically detect and classify distinct social behaviors, especially those involving two mice in close and dynamic contacts in their home cage.
Table I: Accuracy of each classi er on each behavior.
Sniff Attack Eat
AdaBoost R.Forest AdaBoost R.Forest AdaBoost R.Forest
58.94% 56.98% 80.87% 56.23% 49.97% 56.58%
55.88% 55.29% 77.65% 55.43% 49.95% 55.29%
59.75% 56.70% 72.59% 56.50% 49.98% 56.46%
50.69% 54.72% 82.33% 54.72% 50.13% 54.72%
52.16% 54.72% 59.15% 54.72% 49.98% 54.72%
53.17% 54.72% 73.89% 54.72% 50.00% 54.72%
1WTF 75: Weak Trajectory Features computed using 75 Frames temporal window.2WTF 615: Weak Trajectory Features computed using 615 Frames temporal window.3STF Top: Spatio-temporal Features computed from the TOP videos.4STF Side: Spatio-temporal Features computed from the SIDE videos.5AdaBoost: Adaptive boosting classi er.6R.Forest: Random decision forest classi er.
III. FEATURE SELECTION
A common trend in automatic behavior analysis is to extract sparse and informative feature points. The use of such features makes the model easier to manage and enhance robustness. In the following sections, we describe the dataset and the features that we used in our experiment.
A. DatasetIn this work, we use the CRIM13 [9] dataset, which consists of 237 videos, each video is about 10 minutes, recorded at 25fps, with a resolution of 640 × 480 pixels, 8-bit pixel depth and monochrome. Each scene uses two xed synchronized cameras from the top and side views. The video always starts with a male “resident mouse”, which is placed alone in the laboratory, and then at some point the second rat “intruder” is introduced into the cage. Therefore, the social interaction starts between the two mice, and nally, the intruder mouse is removed just before the video ends.There are 12+1 mutually exclusive different behaviors are categorized in the dataset, of which there are 12 behaviors and one last category with no behavior named other are annotated carefully. For simplicity, we only use four

3Volume 11, Issue 1 • January-June 2020
behaviors in the dataset, namely ‘sniff’, ‘attack’, ‘eat’ and ‘walk’. Fig. 1 shows some frames from CRIME13 dataset.
B. FeaturesFor the experiment, we used the spatio-temporal bag of words features and weak trajectory features provided by the CRIME13 [9] dataset. The features are described in the following:Spatio-temporal bags of words are computed using existing methods outlined in [33], [38] by a sliding window centered at the current frame on each video. Spatio-temporal features are two types: one computed from the TOP videos; and another is computed from SIDE videos.Weak trajectory features are computed from the set of positions of each mouse for each top view video frame t. Then calculate the position and extract meaningful trajectory information, such as the distance between the mouse, the direction of movement, velocities and accelerations. After that, an algorithm is used to generate weak trajectory features in a similar way to what is done for object detection in [39]. Like the spatio-temporal features, there are two types of weak trajectory features: one is calculated using a 75-frame temporal window, and the other is calculated using a 615-frame temporal window.
IV. EXPERIMENT AND RESULTS
Our main goal is to explore the use of supervised machine learning methods to automatically annotate social behaviors. Supervised learning is a method in which classi ers are trained using annotated datasets with the output of the desired classi er. The performance of the classi er is evaluated using a testing set of ground-truth videos that are not used in training. The training set and test set do not overlap and were obtained from separate videos. We use the same error metric de ned in [9], where the error metric is calculated as the average of the diagonal of the confusion matrix, and the values of the confusion matrix are the average agreement per frame between annotations for each pair of behaviors. The average per-frame agreement, which is calculated across all frames, measures the similarity between annotations for that pair of behaviors. Finally, when taking the average of the diagonal, we favor classi ers that achieve a high similarity with the ground truth across all behaviors.We used the spatio-temporal bag of words and weak trajectory features from the CRIM13 [9] dataset to train two supervised learning algorithms, adaptive boosting (AdaBoost) and Random Decision Forest (TreeBagger).
Compared with random decision forest, AdaBoost provides the best performance in terms of prediction accuracy and training speed. We trained four social behavior classi ers (‘sniff ’, ‘attack’, ‘eat’ and ‘walk’) using features from the weak trajectory and spatio-temporal features. These features contain ~100000 frames, and frames are manually annotated frame-by-frame basis. Finally, we compare which feature and which type of feature are more informative and provide better accuracy. For the AdaBoost classi er, we use a depth 2 tree for each weak classi er. For each behavior, a binary classi er is trained by boosting all training frames with labels that indicate the presence or absence of the behavior. Given behavior types, each of the k binary classi ers will output a con dence for that particular behavior being present in frame i. The only two parameters of the binary AdaBoost classi ers are the maximum number of weak classi ers (T) and the number of frames sampled at each training iteration (S). In the experiment, we chose T = 255 and S = 16. Compared with a larger number of frames, sampling a small number of frames can improve performance. As the number of frames increases, the weak classi ers will over t, resulting in reduced performance. For the random decision forest (TreeBagger) classi er, we chose to generate 500 random decision trees.
Table I shows the experimental result of the two classi ers according to each behavior. From this table, we nd that weak trajectory features outperform in both classi ers compared to the spatio-temporal features on the behavior ‘sniff ’, ‘attack’, ‘eat’ and ‘walk’, which indicate that the weak trajectory features are more informative than spatio-temporal features. Furthermore, adaptive boosting provide the best performance in prediction accuracy on the CRIME13 [9] dataset.
V. CONCLUSION
In this work, we study video based animal behavior analysis on mouse. Here we use two types of features form the CRIM13 [9] dataset. We apply Adaboost and random decision forest classifier to each feature to classify four behavior ‘sniff’, ‘attack’, ‘eat’, and ‘walk’. From the experimental results, we found that the weak trajectory features outperform the spatio-temporal features and we also found that the Adaboost classi er performs better than a random decision tree on the features in the CRIME13 [9] dataset. However, due to limited resources, we experimented with only subset of frames of the CRIME13 dataset. Because CRIME13 is the largest and richest behavior dataset, containing over 8 million frames and 12+1 different behavior categories.

4 IITM Journal of Management and IT
REFERENCES[1] F. de Chaumont, E. Ey, N. Torquet, T. Lagache, S. Dallongeville,
A. Imbert, T. Legou, A.-M. Le Sourd, P. Faure, T. Bourgeron et al., “Live mouse tracker: real-time behavioral analysis of groups of mice,” bioRxiv, p. 345132, 2018.
[2] P. K. Thanos, C. Restif, J. R. ORourke, C. Y. Lam, and D. Metaxas, “Mouse social interaction test (most): a quantitative computer automated analysis of behavior,” Journal of Neural Transmission, vol. 124, no. 1, pp. 3–11, 2017.
[3] S. Belongie, K. Branson, P. Doll´ar, and V. Rabaud, “Monitoring animal behavior in the smart vivarium,” in Measuring Behavior. Wageningen The Netherlands, 2005, pp. 70–72.
[4] R. Ulrich, S. Dulaney, M. Arnett, and K. Mueller, “An experimental analysis of nonhuman and human aggression,” in Control of Aggression. Routledge, 2017, pp. 79–111.
[5] G. Lavee, E. eyjolfsRivlin, and M. Rudzsky, “Understanding video events: a survey of methods for automatic interpretation of semantic occurrences in video,” IEEE Transactions on Systems, Man, and Cybernetics, Part C (Applications and Reviews), vol. 39, no. 5, pp. 489–504, 2009.
[6] Y. Nie, I. Ishii, K. Yamamoto, T. Takaki, K. Orito, and H. Matsuda, “High-speed video analysis of laboratory rats behaviors in forced swim test,” in IEEE International Conference on Automation Science and Engineering, 2008, pp. 206–211.
[7] H. Ishii, M. Ogura, S. Kurisu, A. Komura, A. Takanishi, N. Iida, and H. Kimura, “Development of autonomous experimental setup for behavior analysis of rats,” in IEEE/RSJ International Conference on Intelligent Robots and Systems, 2007, pp. 4152–4157.
[8] X. Xue and T. C. Henderson, “Video-based animal behavior analysis from multiple cameras,” in IEEE International Conference on Multisensor Fusion and Integration for Intelligent Systems, 2006, pp. 335–340.
[9] X. P. Burgos-Artizzu, P. Doll´ar, D. Lin, D. J. Anderson, and P. Perona, “Social behavior recognition in continuous video,” in IEEE Conference on Computer Vision and Pattern Recognition, 2012, pp. 1322–1329.
[10] L. Giancardo, D. Sona, H. Huang, S. Sannino, F. Manag`o, D. Scheggia, F. Papaleo, and V. Murino, “Automatic visual tracking and social behaviour analysis with multiple mice,” PloS one, vol. 8, no. 9, p. e74557, 2013.
[11] W. Hong, A. Kennedy, X. P. Burgos-Artizzu, M. Zelikowsky, S. G. Navonne, P. Perona, and D. J. Anderson, “Automated measurement of mouse social behaviors using depth sensing, video tracking, and machine learning,” Proceedings of the National Academy of Sciences, vol. 112, no. 38, pp. E5351–E5360, 2015.
[12] M. Kabra, A. A. Robie, M. Rivera-Alba, S. Branson, and K. Branson, “Jaaba: interactive machine learning for automatic annotation of animal behavior,” nature methods, vol. 10, no. 1, p. 64, 2013.
[13] R. E. Schapire, Y. Freund, P. Bartlett, W. S. Lee et al., “Boosting the margin: A new explanation for the effectiveness of voting methods,” The annals of statistics, vol. 26, no. 5, pp. 1651–1686, 1998.
[14] L. Breiman, “Random forests,” Machine learning, vol. 45, no. 1, pp. 5–32, 2001.
[15] Z. Khan, T. Balch, and F. Dellaert, “Mcmc-based particle ltering for tracking a variable number of interacting targets,” IEEE transactions on pattern analysis and machine intelligence, vol. 27, no. 11, pp. 1805–1819, 2005.
[16] H. Dankert, L. Wang, E. D. Hoopfer, D. J. Anderson, and P. Perona, “Automated monitoring and analysis of social behavior in drosophila,” Nature methods, vol. 6, no. 4, p. 297, 2009.
[17] E. Eyjolfsdottir, S. Branson, X. P. Burgos-Artizzu, E. D. Hoopfer, J. Schor, D. J. Anderson, and P. Perona, “Detecting social actions of fruit ies,” in European Conference on Computer Vision ECCV, 2014, pp. 772–787.
[18] K. Branson, A. A. Robie, J. Bender, P. Perona, and M. H. Dickinson, “High-throughput ethomics in large groups of drosophila,” Nature methods, vol. 6, no. 6, p. 451, 2009.
[19] H.-Y. Tsai and Y.-W. Huang, “Image tracking study on courtship behavior of drosophila,” PloS one, vol. 7, no. 4, p. e34784, 2012.
[20] A. Iyengar, J. Imoehl, A. Ueda, J. Nirschl, and C.-F. Wu, “Automated quanti cation of locomotion, social interaction, and mate preference in drosophila mutants,” Journal of neurogenetics, vol. 26, no. 3-4, pp. 306–316, 2012.
[21] A. Gomez-Marin, N. Partoune, G. J. Stephens, and M. Louis, “Automated tracking of animal posture and movement during exploration and sensory orientation behaviors,” PloS one, vol. 7, no. 8, p. e41642, 2012.
[22] K. J. Kohlhoff, T. R. Jahn, D. A. Lomas, C. M. Dobson, D. C. Crowther, and M. Vendruscolo, “The i y tracking system for an automated locomotor and behavioural analysis of drosophila melanogaster,” Integrative Biology, vol. 3, no. 7, pp. 755–760, 2011.
[23] E. I. Fontaine, F. Zabala, M. H. Dickinson, and J. W. Burdick, “Wing and body motion during ight initiation in drosophila revealed by automated visual tracking,” Journal of Experimental Biology, vol. 212, no. 9, pp. 1307–1323, 2009.
[24] G. Card and M. Dickinson, “Performance trade-offs in the ight initiation of drosophila,” Journal of Experimental Biology, vol. 211, no. 3, pp. 341–353, 2008.
[25] F. W. Wolf, A. R. Rodan, L. T.-Y. Tsai, and U. Heberlein, “High-resolution analysis of ethanol-induced locomotor stimulation in drosophila,” Journal of Neuroscience, vol. 22, no. 24, pp. 11 035–11 044, 2002.
[26] E. Grant and J. Mackintosh, “A comparison of the social postures of some common laboratory rodents,” Behaviour, vol. 21, no. 3, pp. 246– 259, 1963.
[27] G. Gheusi, R.-M. Bluth´e, G. Goodall, and R. Dantzer, “Social and individual recognition in rodents: methodological aspects and neurobiological bases,” Behavioural processes, vol. 33, no. 1-2, pp. 59–87, 1994.
[28] A. Arac, P. Zhao, B. H. Dobkin, S. T. Carmichael, and P. Golshani, “DeepBehavior: A Deep Learning Toolbox for Automated Analysis of Animal and Human Behavior Imaging Data,” Frontiers in systems neuroscience, vol. 13, pp.20, 2019.
[29] Z. Zhang, Y. Yang, and Z. Wu, “Social Behavior Recognition in Mouse Video Using Agent Embedding and LSTM Modelling,” Chinese Conference on Pattern Recognition and Computer Vision (PRCV), 2019, pp. 530-541.
[30] K. Branson and S. Belongie, “Tracking multiple mouse contours (without too many samples),” in Computer Vision and Pattern Recognition, 2005. CVPR 2005. IEEE Computer Society Conference on, vol. 1. IEEE, 2005, pp. 1039–1046.
[31] K. Branson, “Tracking multiple mice through severe occlusions,” Ph.D. dissertation, UC San Diego, 2007.
[32] H. Pistori, V. V. V. A. Odakura, J. B. O. Monteiro, W. N. Gonc¸alves, A. R. Roel, J. de Andrade Silva, and B. B. Machado, “Mice and larvae tracking using a particle lter with an auto-adjustable observation model,” Pattern Recognition Letters, vol. 31, no. 4, pp. 337–346, 2010.
5Volume 11, Issue 1 • January-June 2020
[33] P. Doll´ar, V. Rabaud, G. Cottrell, and S. Belongie, “Behavior recognition via sparse spatio-temporal features,” in Visual Surveillance and Performance Evaluation of Tracking and Surveillance, 2005. 2nd Joint IEEE International Workshop on. IEEE, 2005, pp. 65–72.
[34] C. T. Hsu, P. Doll´ar, D. Chang, and A. D. Steele, “Daily timed sexual interaction induces moderate anticipatory activity in mice,” PLoS One, vol. 5, no. 11, p. e15429, 2010.
[35] H. Jhuang, E. Garrote, X. Yu, V. Khilnani, T. Poggio, A. D. Steele, and T. Serre, “Automated home-cage behavioural phenotyping of mice,” Nature communications, vol. 1, p. 68, 2010.
[36] E. Kyzar, S. Gaikwad, A. Roth, J. Green, M. Pham, A. Stewart, Y. Liang, V. Kobla, and A. V. Kalueff, “Towards high-throughput phenotyping of complex patterned behaviors in rodents: focus
on mouse self-grooming and its sequencing,” Behavioural brain research, vol. 225, no. 2, pp. 426–431, 2011.
[37] F. De Chaumont, R. D.-S. Coura, P. Serreau, A. Cressant, J. Chabout, S. Granon, and J.-C. Olivo-Marin, “Computerized video analysis of social interactions in mice,” Nature methods, vol. 9, no. 4, p. 410, 2012.
[38] H. Wang, M. M. Ullah, A. Klaser, I . Laptev, and C. Schmid, “Evaluation of local spatio-temporal features for action recognition,” in BMVC 2009- British Machine Vision Conference. BMVA Press, 2009, pp. 124–1.
[39] P. Viola and M. Jones, “Rapid object detection using a boosted cascade of simple features,” in Computer Vision and Pattern Recognition, 2001. CVPR 2001. Proceedings of the 2001 IEEE Computer Society Conference on, vol. 1. IEEE, 2001, pp. I–I.

6 IITM Journal of Management and IT
construction expresses a mountain of procedure layers in which each layer function within its precise utility and front line and thus permitting dissimilarities to the fundamental expertise at each layer deprived ofunexpected the essential to modi cation the complete system construction [1][2]. There is additional problematic to provide awell-organized and accessible security explanation. Themainfundamentals of Wireless Sensor Networks are the sensor nodes and the base stations. In fact, they can be preoccupied as the “sensing cells” and the “brain” of the network, constantly. Typically, sensors nodes are organized in anelectedexpanse by aspecialist and then, robotically form a network nished wirelessCommunications.Two main security challenges in secure data aggregation are con dentiality and integrity of data. While encryption is traditionally used to provide end to end con dentiality in wireless sensor network, the aggregators in a secure data aggregation scenario need to decrypt the encrypted data to perform aggregation. This exposes the plaintext at the aggregators, making the data vulnerable to attacks from an adversary. Similarly an aggregator can inject false data into the aggregate and make the base station accept false data. Thus, while data aggregation improves energy ef ciency of a network, it complicates the existing security challenges.In wireless sensor network it is necessary to allow only speci c sensor node to access your wireless sensor network. Each sensor node that is intelligent to interconnect with a wireless sensor network is allotted an exclusive Media Access Control address. Wireless routers regularly have a machinery to permit only devices with speci c media access control reports to admission to the wireless sensor network. Little positioning charges of sensor nodes variety wireless sensor networks nice-looking to handlers. Distribution of sensor nodes in exposed situation also provides attacker the trappings to promotion occurrences on the wireless sensor network [3][4].The design defects in the sanctuary apparatuses of the 802.11. Average also gives growth to a number of probable occurrences, both submissive and dynamic.
Cross-layer Security Solution for Secure Communication of Sensorsin Wireless Sensor Networks
Rakesh Kumar Saini1, Naveen Kumar2
1Department of Computer Science and Application, DIT University, Dehradun, Uttrakhand, India2Department of Computer Science & Engineering, DITUniversity, Dehradun, Uttrakhand, India
Abstract—Safe path-finding is extremely necessary for multi hop wireless systems such as Wireless Sensor Networks. Multihop wireless systems are more unprotected to safetyoutbreaks as associated to single-stage wireless networks.Cross-layerdesign production is a precise signi cant character for wireless sensor network submissions. Advancedsecurity is significant for the achievement of announcement among sensor nodes in wireless sensor network because the numbers composed is regularly less and the network is most vulnerable. Numerous Security methods have been suggested to deliver safety resolutions besides numerous threats to the Cross-layer modi cation techniques in Wireless sensor networks. In this paper we overview the existing schemes for the security of cross-layer design in wireless sensor networks. The proposed Security model will provide more security between sensor nodes and the base station in wireless sensor network.Security is important for the success of the wireless sensor network because the data collected are often sensitive and the network is particularly vulnerable. In the cross-layer design, constraints are substituted between changed layers to protect the well-organized use of energy. In this paper, we propose a secure security model that is based on cross-layer design. It uses a cross-layer optimization Machine. Reproduction consequences con rm that our proposed safety model better in many situations and in unpromising violence-disposed to the situation.Keywords—Security, energy Efficiency, Security Frameworks key management, Wireless Sensor Network.
I. INTRODUCTION
In obsolete broadcast systems, the Open Systems Interconnection (OSI) covered building has been extensively accepted and has helped numerous communications to organization stealthy in the past; however, growing wireless networks of nowadays are extremely exciting to this design idea. The layered

7Volume 11, Issue 1 • January-June 2020
These occurrences empower impostors to overhear on, or interfere with, wireless transmissions. Sensor nodes are fast, mountable, low dynamism effectual and extremely circulated in exposed atmosphere so there is safekeeping is essential for superiority of provision in wireless sensor network [5]. A cross-layer design approach is introduced in Lazos and Poovendran where a key management mechanism in wireless multicast is proposed. With this approach, secret keys to valid group members are deployed in an energy-ef cient way. Authors considered the physical and network layer in combination. There is need of security solution for cross layer design in wireless sensor network because there is one layer can communicate with another layer non-adjacently. Wi-Fi protected access should be used for encryption of data in wireless sensor networks. In this paper we planned a safetyresolution that will affordsafety to coatings in Wireless Sensor Networks [6] [7].
II. REQUIREMENTS OF SECURITY IN WIRELESS SENSOR NETWORKS
Security is a large apprehension when Wireless Sensor Networks are positioned for unusual claims such as ghting and healthcare. Owed to their exclusive arrivals, outdated safe keeping approaches of computer networks would be useless for wireless sensor networks. Hence, de ciency of security apparatuses would origin impositions near those networks. These impositions need to be distinguished and indication approaches should be functional. Two main security encounters in protected data accumulation are privacy and truthfulness of statistics. While encryption is conventionally used to deliver end to end discretion in WSNs, the aggregators in a protected data accumulation situation need to decrypt the translated statistics to achieve accumulation. Maximum of Wireless Sensor Networks are used to intelligence, assemble, and procedure delicate evidence. Statistics discretion and truthfulness is one of the signi cant purposes in such belongings. This sympathetic of objective can be accomplished by manipulative approximately sort of security apparatus particularly permitting security apparatus in direction- nding protocol. Signi cant requirement of any network is to security,privacy, truthfulness, and obtain ability.Explanations for appreciative cross layer security method and to name some we have dissimilar necessities and facilities of requests dominion, cross layer interruption discovery, discovery of self-interested protuberance and non-dismissed security. Wireless Sensor Network contains of spatially disseminated independent instruments to monitor conservation environments of the ground. The expansion of wireless
sensor networks was interested by martial submissions such as battle ground observation. Wireless Sensor Networks are organized at dangerous at comparable observation, checking, air elds, battle ground requests here after safe guarding Wireless Sensor Networks is a very stimulating duty. The foremost requests are measured as the normal security supplies, which are as the following:(a) Data Con dentiality(b) Data Truthfulness(c) Data Availability(d) Freshness(e) Self-Organization(f) Secure Management(g) Quality of Service
(a) Data Con dentialityData confidentiality is about protecting data against unintentional, unlawful, or unauthorized access, disclosure, or theft. Con dentiality has to do with the privacy of information, including authorizations to view, share, and use it.
(b) DataTruthfulnessData truthfulness enforces the service provider to truthfully collect and process real data. The essence of TPDM is to rst synchronize data processing and signature veri cation into the same cipher text space, and then to tightly integrate data processing with outcome veri cation via the homomorphic properties.
(c) Data AvailabilityData availability is a term used by some computer storage manufacturers and storage service providers. Data availability is the process of ensuring that data is available to end users and applications, when and where they need it. It de nes the degree or extent to which data is readily usable along with the necessary Information Technology and management procedures, tools and technologies required to enable, manage and continue to make data available.
(d) FreshnessOne of the many attacks boosted in inconsistency of sensor networks is the message replay attack where an adversary may capture messages exchanged between nodes and repetition them later to cause confusion to the network. Data cleanness impartial safe guards that communications are fresh, meaning that they obey in a message ordering and have not been reused. To accomplish cleanness, network protocols must be considered in a way to

8 IITM Journal of Management and IT
recognize replacement packages and throw away them stopping probable is calculation.(e) Self-OrganizationEach node in a wireless sensor networks should be self-organizing and self-healing. This feature of a wireless sensor networks also poses a great challenge to security. The dynamic nature of a wireless sensor networks makes it sometimes impossible to deploy any pre-installed shared key instrument among the nodes and the base station. A number of key pre-distribution schemes have been proposed in the context of symmetric encryption. However, for application of public-key cryptographic techniques an ef cient mechanism for key-distribution is very much important. It is anticipated that the nodes in a wireless sensor networks self-organize among themselves not only for multi-hop routing but also to takeout key management and developing faithrelatives[13][14].
(f) Secure ManagementManagement is required in every system that is constituted from multi-components and handles profoundmaterial. In the case of sensor networks, we need safe management on base station level; since sensor nodes communication ends up at the base station, issues like key delivery to sensor nodes in order to found encryption and routing information need secure management. Furthermore, clustering requires secure management as well, since each group of nodes may include a large number of nodes that need to be authentic with each other and exchange data in a safe manner. In addition, clustering in each sensor network can change dynamically and fast. Therefore, protected protocols for collectionadministration are mandatory for adding and eliminating associates and con rmingstatistics from assemblies of nodes.
(g) Quality of ServiceQuality of Service impartial is a large annoyance to security. And when we are talking around sensor systems with all the boundaries they have, quality of service develops even more controlled. Safety instrument sobligation be insubstantial so that the above caused for example by encryption must be minimalized and not disturb the concert of the network. Concert and superiority in sensor networks comprise the appropriate transfer of statistics to stop for example broadcast of contamination and the correctness with which the data conveyed match what is really happening in their situation.
III. PROPOSED SECURITY MODEL
Cross-Layer Design (CLD) is a co-operation among numerous layers. Cross layer design permit communication
between layers non-adjacently. We planned a Security model for CLD in wireless sensor network. Fig.1 shown a cross-layer security model for wireless sensor network. In this cross-layer security model we are using a security lter between cross-layer design and cross-layer optimization handler. When sensor node want to send sense data to base station then rst check whether channel free or not if channel is free then sense data forward to security lter. Security lter check the sense data and give a token (time slot) to packet node. After receiving token from security lter sensor node forward sense data to Cross layer optimization handler (CLOH).Cross layer optimization handler is used for merging layers for communication non-adjacently. Cross layer optimization handler Combine the resources and provide communication between layers [15].
Fig1. Proposed Security Model for Cross layer design
Notations used:SF–Security FilterPN –Packets nodeCLOH -Cross layer Optimization HandlerTs-Time SlotCh–ChannelBS-Base StationAlgorithm for security of data1. If Sensor node want to send data to base station2. Check Channel Ch whether it is free or not3. If Ch=0 then set Ch=PN
4. Set SF =PN
5. Set PN=TS
6. PN dispatchfrom SF to CLOH buffer7. CLOH Check Ch is free or not8. If Ch=0 then9. Dispatch PN from CLOH to BS10. Repeat Step 1 to 9

9Volume 11, Issue 1 • January-June 2020
IV. RELATED WORK
Wireless sensor networks has numerous solicitations such as extensive extent investigation for boundaries safety, checking temperature, comprehensive, and compression in an agreed expanse many investigators intentional the security matters in WSNs. There is a signi cant quantity of investigations in the works that deliberate Wireless Sensor Networks knowledge in universal [1][7].The complete collected works examination of safety subjects in cross-layer deliberate in [8][10]. Djallel Eddine Boubiche et al. [8] have planned a new delicate watermarking based protocol to reservation the data accumulation honesty in varied WSN. Proposed procedure is vitality effectual and it progresses the statistics accumulation procedure on the assorted nodes and improves the statistics accumulation accurateness. Geethapriya Thamilarasu et al. [9] have explore the impression of cross-layer practices on safety and network recital using two different types of cross-layer edi ces based on shortest communication between layers and using shared database model. Both enterprise performed improved in positions of sophisticated system stability and lower employment complexity. Pedro Pinto, Antonio Pinto et al. [10] have planned a novel cross-layer admission control (CLAC) instrument to enhance the network performance and increase energy ef ciency of a wireless sensor networks, by avoiding the transmission of possibly useless packages.CLAC augments the inclusive network routine by cumulative the quantity of valuablepackages [16].
V. PERFORMANCE ANALYSIS OF PROPOSED SECURITY MODEL
We develop a simulation environment to evaluate the ef ciency of security model. For this purpose we are using QualNet 5.0.2 simulation modeling tool.The performance of proposed Security model is veri ed with cross layer design in the experimentation, the sensor nodes in WSNs are disseminatederratically in the 100m * 100m area. We are using some limitations in this reproduction that are shown in Table 1.
Table 1: Simulation ParametersParameter Value
Source Sensor nodes 1,2,3,4,5,6,7,8,9,10Destinationnode (Base Station) 11Packets Send 40000Terrain Range 100m x 100m No. of nodes 10Frequencies 2.4GHz Traf c Type CBRChannel Type Wireless channelProtocols AODV
In this simulation environment (Fig. 2) Source sensor nodes 1,2,3,4,5,6,7,8,9,10 are co-operately pass their data to the destination node 11 (BaseStation). Running simulation is shown in Fig. 3.In running simulation sensor nodes are sending packets to destination node 11(Base Station).In Fig.4 shown the result, total packets received by destination sensor node 11 or Base Station. Total packets send by source sensor nodes was 4000.By using Security model, Base station received 100% packets from sensor nodes 1, 2,3,4,5,6,7,8,9,10.Base Station received 4000 packets from Source sensor nodes.By implementing security model with cross layer design we are getting 100% secure data at Base Station.
Fig.2 Simulation Setup
Fig.3 Running Simulation
Fig. 4 Total packets received by Base Station

10 IITM Journal of Management and IT
VI. CONCLUSION
Number of investigators about the ecosphere. Wireless networks are frequently supplementary susceptible to numerous safety pressures as the untraced announcement intermediate is more vulnerable to security occurrences than those of the conducted transmission intermediate. Security is a signi cant constraint and confuses suf cient to set up in dissimilar elds of Wireless Sensor Network. In this paper we proposed a new security model for cross layer design in wireless sensor networks. The planned security model is very valuable for dissimilar requests of wireless sensor networks such as armed claim, Health request and manufacturing monitoring application and so on. In this paper we estimate presentation of projected security model by using Qualnet 5.0.2 Simulator instrument and nd that planned security model provide 100% security between layers.
REFERENCES[1] Ameer Ahmed Abbasi, Mohamed Younis, “A survey on
clustering algorithms for wireless sensor networks”, Computer communication 30(2007)2826-28410.
[2] J. N. Al-Karaki and A. E. Kamal, “Routing Techniques in Wireless Sensor Networks: A Survey”, IEEE Wireless Communication Vol.11, No.6, Dec.2004, pp. 6-28.
[3] Amir Sepasi Zahmati and Bahman Abolhassani, “EPMPLCS: An Ef cient Power Management Protocol with Limited Cluster Size for Wireless Sensor Networks”, Proc. 27th International Conference on Distributed Computing Systems (ICDCS 2007), submitted for publication.
[4] W. B. Heinzelman et al., “An Application-Speci c Protocol Architecture for Wireless Micro sensor Networks,” IEEE Transactions on Wireless Communications Volume 1, No. 4, Oct 2002, pp.660 - 670.
[5] W. R. Heinemann, A. Chandrakasan, and H. Balkrishnan, “Energy-Ef cient Communication Protocol for Wireless Micro sensor Networks”, in Proceedings of 33rd Hawaii International Conference on System Science, Vol. 2, Jan. 2000, pp.1-10.
[6] Amir Sepasi Zahmati,Bahman Abolhassani,Ali Asghar Behesti Shirazi and Ali Shojaee Bakhtiari, ”An Energy-Ef cient protocol with Static clustering for Wireless Sensor Network”, proceedings of world academy of science, Engineering and Technology
volume 22 July 2007 ISSN 1307-6884.[7] SoheilGhiasi, Ankur Srivastava, Xiaojian Yang, and Majid
Sarrafzadeh, “Optimal Energy Aware Clustering in Sensor Networks”, SENSORS Journal, Vol. 2, No. 7, 2002, pp. 258-269.
[8] DjallelEddineBoubiche, Sabrina Boubiche, AzeddineBilami, “A Cross-Layer Watermarking-Based Mechanism for Data Aggregation Integrity in Heterogeneous WSNs.”IEEE Communications Letters, Vol.19.No.5, May 2015.
[9] Geethapriya Thamilarasu, Ramalingam Sridhar, ”Exploring Cross-layer techniques for Security: Challenges and Opportunities in Wireless Networks.”, Proc.IEEE 2007.
[10] Pedro Pinto, Antonio Pinto, Manuel Ricardo, “Cross-Layer Admission Control to Enhance theSupport of Real-time Applications in WSN”, IEEE Sensors Journal, Vol.X.No.X, XX.
[11] Culler, D. E and Hong, W., “Wireless Sensor Networks”, Communication of the ACM, Vol. 47, No. 6, June 2004, pp. 30-33.
[12] Akyildiz, I. F., Su, W., Sankarasubramaniam, Y, and Cayirci, E., “Wireless Sensor Networks: A Survey”, Computer Networks, 38, 2002, pp. 393-422.
[13] Dai, S, Jing, X, and Li, L, “Research and analysis on routing protocols for wireless sensor networks”, Proc. International Conference on Communications, Circuits and Systems, Volume 1, 27-30 May, 2005, pp.407-411.
[14] Pathan, A-S. K., Islam, H. K., Sayeed, S. A., Ahmed, F. and Hong, C. S., “A Framework for Providing E-Services to the Rural Areas using Wireless Ad Hoc and Sensor Networks”, to appear in IEEE ICNEWS2006.
[15] Undercoffer, J., Avancha, S., Joshi, A., and Pinkston, J., “Security for Sensor Networks”, CADIP Research Symposium, 2002, available at,http://www.cs.sfu.ca/~angiez/personal/paper/sensor-ids.pdf.
[16] Perrig, A., Szewczyk, R., Wen, V., Culler, D., and Tygar, J. D., “SPINS: Security Protocols for Sensor Networks”, Wireless Networks, vol. 8, no.5, 2002, pp. 521-534.
[17] Jolly, G., Kuscu, M.C., Kokate, P., and Younis, M., “A Low-Energy Key Management Protocol for Wireless Sensor Networks”, Proc. Eighth IEEE International Symposium on Computers and Communication, 2003. (ISCC 2003) . vol.1, pp. 335 - 340.
[18] Rabaey, J.M., Ammer, J., Karalar, T., Suetfei Li., Otis, B., Sheets, M.,and Tuan, T., “PicoRadios for wireless sensor networks: the nextchallenge in ultra-low power design” 2002 IEEE International Solid-State Circuits Conference (ISSCC 2002), Volume 1, 3-7 Feb. 2002, pp. 200 –201

11Volume 11, Issue 1 • January-June 2020
Abstract—This Biometric Face Recognition is technology which uses modern machine algorithms and techniques to identify face of speci c individuals under different circumstances. Face recognition is famous as well as leading problem in machine learning. The best solution to solve this problem was to develop a Biometric Face Recognition System which can give robust solution and maximum accuracy during recognition of speci c face. Different machine algorithms are deployed during development of this project in order to achieve maximum accuracy.Keywords—component, Face Recognition, Supervised Learning, Classification Problem, Artificial Neural Network (ANN), Principal Component Analysis (PCA), Validation Ratio
I. INTRODUCTION
In the last few years, the growth of Arti cial Intelligence has increased rapidly. It had made the life of human beings to do the tasks easier in different ways. From checkers playing games to self-driving cars, AI has been progressing ahead rapidly. Beside these, the growth of biometric has been very signi cant in last few years. The most common biometrics modes used for recognition is face that is used in applications at a distance, security scenarios and video games. (Vera-Rodriguez, et al., 2000).Face recognition is the process of identifying or verifying the identity of a people using their face from the photos, video, or in real-time (Electronic Frontier Foundation, 2019). The concerned on facial recognition has significantly increased in image processing and computer vision that are used in biometrics, information security, video surveillance, law enforcement, identity authentication, smart cards, and access control system. Generally, the biometrics software representing the facial recognition maps the face mathematically and stores the data as a face print. (Techtarget, 2018)..
II. DESIGN AND IMPLEMENTATIONA. Re ading an Image set The main aim of reading the images is to display the images that are available in the dataset. 50 images of 30
persons each were given in the data set. So, there were total 1500 images available. So, when is code is executed, it gives an output of 1024 x 1500 single matrix which is the vectorized form of 1500 images stored in the variable “ans” in the workspace.
Fig. 1: Matrix value of images stored in variable “ans”
Fig. 2: Reading Image Dataset and analysis of given image dataset
When you analyze the above value, it ranges from 0 to 255 which is the brightness of the pixels of the images.Since the main aim of read image set is to display the images that are available in the dataset.
Design of a Solution for a Biometric Face Recognition Task Kshitiz Bajagain#1, Swati Sah#2
#Patan College for Professional Studies. in collaboration with University of Bedfodshire,U.K [email protected], [email protected]

12 IITM Journal of Management and IT
Fig. 3: Image at its default pixels
Fig. 4: Image after resizing pixels
There are 3 main commands that functions to read the images. They are:1. Imread: It reads a greyscale or color image from
the le of the image type ‘jpg’.2. Imshow: It display the image in the picture box.3. Imresize: It resizes the images into given pixels. In the scripts, the images are resized into 32*32 pixels which create smaller vector and use less processing power for feature extraction.After executing the script of read image set we get the output of X and T in the workspace as follows:
X is the matrix of vectorized images of the persons and T is the matrix with the picture labels for identi cation purposes. Close this le and download the Microsoft Word, Letter le.
B. Split Image SetThe Splitting Image dataset is important process for BFR task. Splitting Image into individual elements is necessary for comparing each unknown elements with already known labelled elements (output of read_image_set ( )) which will ensure the similarities between two images nally resulting into high accuracy. Eigen Face method was used in this assignment to split image dataset .Eigen Face is a set of eigenvectors which is commercially used in face recognition technology. The test image is transformed into its Eigen face components. First we compare line of our input image with our mean image and multiply their difference with each eigenvectors. (Shemi P M, Ali MA, 2012) During execution of split image algorithms, Training set, .validation set and testing set was calculated and stored in variable as: X1 = L by n1 matrix of training set X2 = L by n2 matrix of validation setSimilarly, element of target vector of input images in validation and training set was also calculated and stored in variable as: T1 = n1 element target vector of input images in validation set T2 = n2 element target vector of input images in validation setX1, X2, T1 and T2 were the nal outputs of split_image_set ( ) function which are needed further in applying PCA and training portion.For one input,MN* 1 vector = 1024 * 1For 1500 input,MN * 1500 vector = 1024*1500As given image dataset contains 32*32 pixels 1500 image from 30 person (50 each) .Means, M = N = 32 Np = 30 K = 50 N = Np * K = 1500 Total elements = 1500*32*32 = 1,536,000 your paper and style

13Volume 11, Issue 1 • January-June 2020
For one input,MN* 1 vector = 1024 * 1For 1500 input,MN * 1500 vector = 1024*1500As given image dataset contains 32*32 pixels 1500 image from 30 person (50 each) .Means, M = N = 32 Np = 30 K = 50 N = Np * K = 1500 Total elements = 1500*32*32 = 1,536,000The main of split image is to divide the image dataset into two parts:Part 1: Used to train the Arti cial Neural Network(ANN)Part 2: Used for validating the accuracy. In the split image script, the value of val_ratio is 0.3 which is the default value for the experiments which means 30% of the images will be reserved for validation and 70% images will be used for training the neural network.When the script is executed we get the output as: Z text. All margins, column widths, line spaces, and text fonts are prescribed; please
C. Split Image SetPrincipal component analysis (PCA) is a technique used to emphasize variation and bring out strong patterns in
a dataset. It’s often used to make data easy to explore and visualize (Lehe, 2015). It is an approach that is used for reducing the number of variables in face recognition (Paul & Sumam, 2012)After completion of splitting image by Eigen Face Method, Principal Component Analysis(PCA) is executed to training image set (X1 and X2) obtained from split_image_set( ) function . Image data are processed ef ciently when they are represented as low-dimensional vectors. Principal component analysis (PCA), allowing data to be represented in a low dimensional space of principal components, is a common technique for image representation in face recognition systems (Uglov, J. et al. 2007). Every image in the training image set is represented as a linear combination of weighed Eigen vectors which are already obtained from co-variance matrix of a training image set calculated from split_image_set( ) function. PCA was applied to the training image set X1 and X2 to nd out the component of P1, P2, and matrix of coef cient C and M. After applying PCA to training image set, matrix of components for training set were calculated and stored in PS1(nofpc by n1) and PS2(nofpc by n2 do not alter them.
Fig 8: Low Dimensional Space of Principal Components
Fig: Above gure illustrates how PCA can reduce
14 IITM Journal of Management and IT
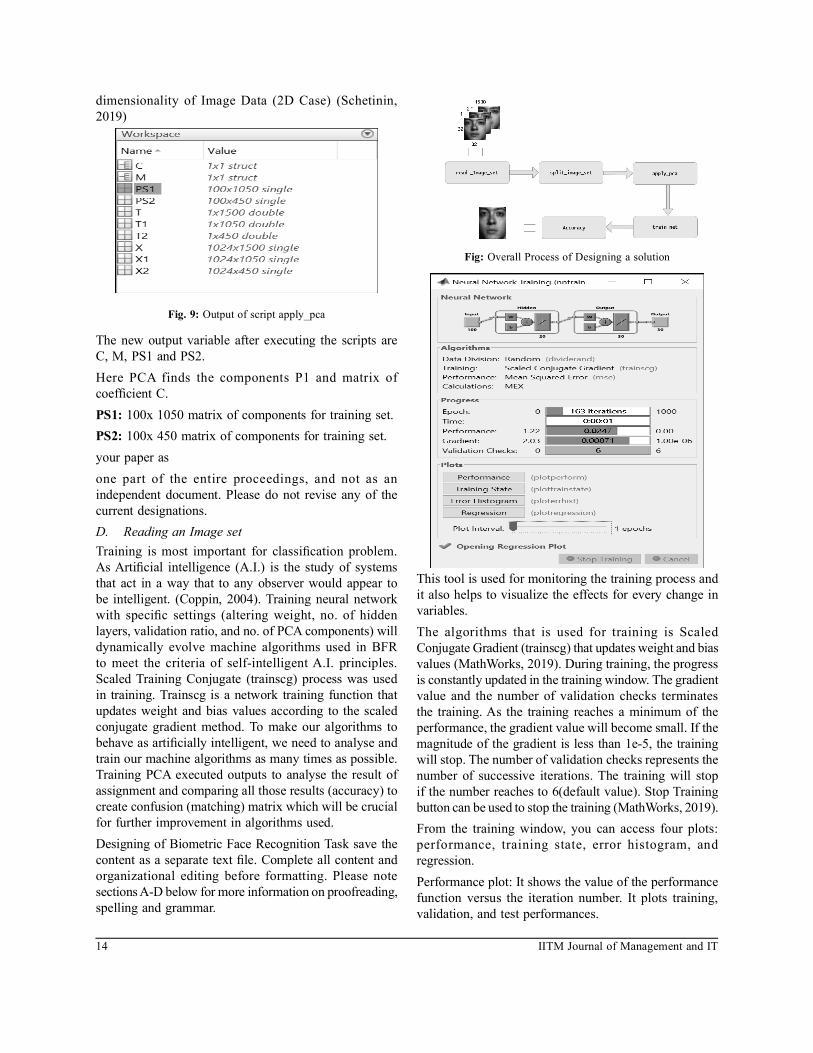
dimensionality of Image Data (2D Case) (Schetinin, 2019)
Fig. 9: Output of script apply_pca
The new output variable after executing the scripts are C, M, PS1 and PS2.Here PCA finds the components P1 and matrix of coef cient C.PS1: 100x 1050 matrix of components for training set.PS2: 100x 450 matrix of components for training set.your paper asone part of the entire proceedings, and not as an independent document. Please do not revise any of the current designations.D. Reading an Image set Training is most important for classi cation problem. As Arti cial intelligence (A.I.) is the study of systems that act in a way that to any observer would appear to be intelligent. (Coppin, 2004). Training neural network with speci c settings (altering weight, no. of hidden layers, validation ratio, and no. of PCA components) will dynamically evolve machine algorithms used in BFR to meet the criteria of self-intelligent A.I. principles. Scaled Training Conjugate (trainscg) process was used in training. Trainscg is a network training function that updates weight and bias values according to the scaled conjugate gradient method. To make our algorithms to behave as arti cially intelligent, we need to analyse and train our machine algorithms as many times as possible. Training PCA executed outputs to analyse the result of assignment and comparing all those results (accuracy) to create confusion (matching) matrix which will be crucial for further improvement in algorithms used.Designing of Biometric Face Recognition Task save the content as a separate text le. Complete all content and organizational editing before formatting. Please note sections A-D below for more information on proofreading, spelling and grammar.
Fig: Overall Process of Designing a solution
This tool is used for monitoring the training process and it also helps to visualize the effects for every change in variables.The algorithms that is used for training is Scaled Conjugate Gradient (trainscg) that updates weight and bias values (MathWorks, 2019). During training, the progress is constantly updated in the training window. The gradient value and the number of validation checks terminates the training. As the training reaches a minimum of the performance, the gradient value will become small. If the magnitude of the gradient is less than 1e-5, the training will stop. The number of validation checks represents the number of successive iterations. The training will stop if the number reaches to 6(default value). Stop Training button can be used to stop the training (MathWorks, 2019).From the training window, you can access four plots: performance, training state, error histogram, and regression.Performance plot: It shows the value of the performance function versus the iteration number. It plots training, validation, and test performances.

15Volume 11, Issue 1 • January-June 2020
Training state plot: It shows the progress of other training variables, such as the gradient magnitude, the number of validation checks, etc. Error histogram plot: It shows the distribution of the network errors.Regression plot: It shows a regression between network outputs and network targets. You can use the histogram and regression plots to validate network performance (MathWorks, 2019)
III. EXPERIMENTS
Keep your text and graphic les separate until after the
Test nofpc (default = 100) val_ratio nofhn Accuracy
1 100 0.3 20 0.800
2 100 0.3 20 0.844
3 100 0.3 20 0.802
4 100 0.3 20 0.791
5 100 0.3 20 0.831
6 100 0.3 20 0.809
7 100 0.3 20 0.878
8 100 0.3 20 0.829
9 100 0.3 20 0.809
10 100 0.3 20 0.820
11 100 0.3 20 0.813
12 100 0.3 20 0.800
13 100 0.3 20 0.871
14 100 0.3 20 0.824
15 100 0.3 20 0.776
16 100 0.3 20 0.787
17 100 0.3 20 0.791
18 100 0.3 20 0.816
19 100 0.3 20 0.820
20 100 0.3 20 0.813
21 100 0.3 20 0.760
22 100 0.3 20 0.833
23 100 0.3 20 0.827
24 100 0.3 20 0.840
25 100 0.3 20 0.864
26 100 0.3 20 0.796
27 100 0.3 20 0.847
28 100 0.3 20 0.782
29 100 0.3 20 0.807
30 100 0.3 20 0.853
Maximum of 0.878(87.8%) accuracy was achieved while executing given ANN with default settings.
Changing Default nofhn Keeping nofpc Constant (Series-2)De ne abbreviations and acronyms the rst time they are used in the text, even after they have been de ned in the abstract.
Nofpc nofhn (default = 20) Accuracy
100 20 0.844
100 50 0.891
100 100 0.900
100 150 0.913
100 180 0.923
100 200 0.933
Changing default nofpc keeping nofhn constant (Series-3):
nofpc (default = 100) nofhn Accuracy
80 20 0.800
120 20 0.862
150 20 0.824
180 20 0.822
200 20 0.816
220 20 0.842
Changing both default nofpc and default nofhn keeping val_ratio constant(Series-4):
nofpc(default=100) val_ratio nofhn(default=20) Accuracy
80 0.3 30 0.909
120 0.3 50 0.936
150 0.3 100 0.931
150 0.3 150 0.942
200 0.3 150 0.929
200 0.3 200 0.942
Every series has 6 set of different parameters except default setting (30 test taken).Changing all default nofpc and default nofhn and default val_ratio(0.3) ( Series-5)
nofpc val_ratio nofhn Accuracy
150 0.22 150 0.968
150 0.15 150 0.952
100 0.112 180 0.946
150 0.10 150 0.960
190 0.298 110 0.926
180 0.169 125 0.957
150 0.30 150 0.942
170 0.289 125 0.926
150 0.345 150 0.817
16 IITM Journal of Management and IT
125 0.369 145 0.762
150 0.40 150 0.802
165 0.412 132 0.825
150 0.16 150 0.948
185 0.145 122 0.940
150 0.15 200 0.933
200 0.16 220 0.953
130 0.28 190 0.950
160 0.123 200 0.946
190 0.21 210 0.952
Abbreviations such as IEEE, SI, MKS, CGS, sc, dc, and rms do not have to be de ned. Do not use abbreviations in the title or heads unless they are unavoidable.A. Units
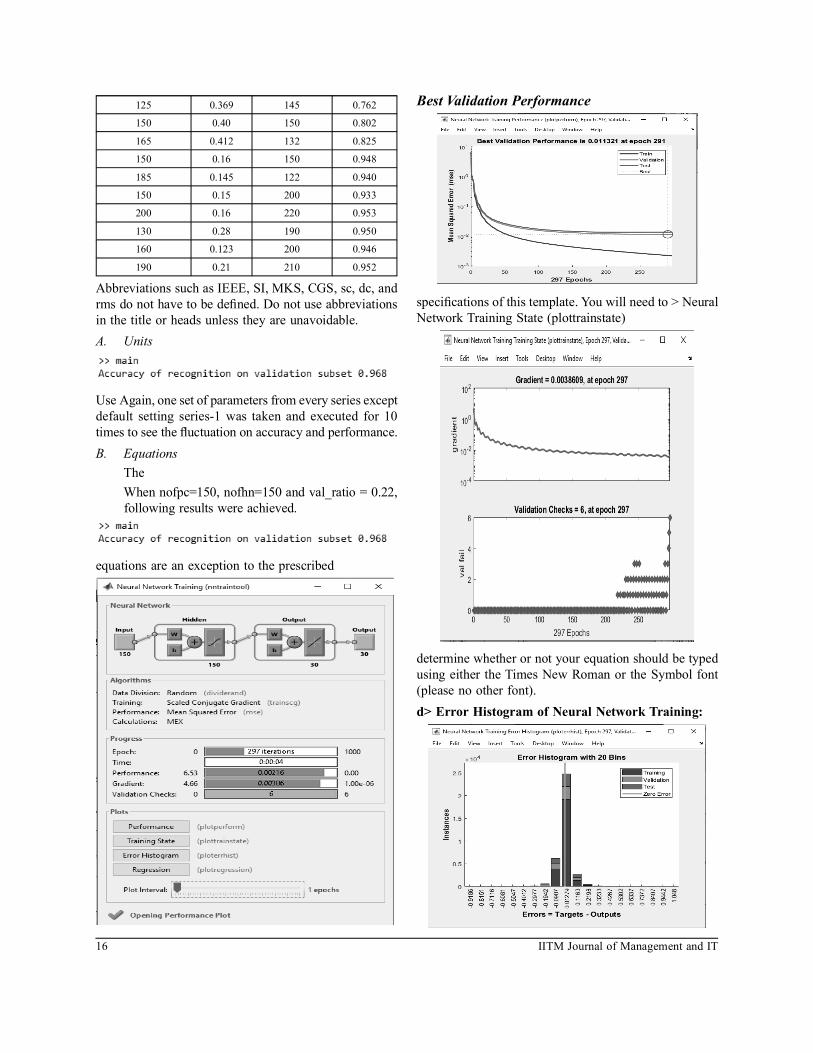
Use Again, one set of parameters from every series except default setting series-1 was taken and executed for 10 times to see the uctuation on accuracy and performance.B. Equations The When nofpc=150, nofhn=150 and val_ratio = 0.22,
following results were achieved.
equations are an exception to the prescribed
Best Validation Performance
speci cations of this template. You will need to > Neural Network Training State (plottrainstate)
determine whether or not your equation should be typed using either the Times New Roman or the Symbol font (please no other font).d> Error Histogram of Neural Network Training:

17Volume 11, Issue 1 • January-June 2020
e>Neural Network Training Regression:To create multileveled equations, it may be necessary to treat the equation as a graphic and insert it into the text after your paper is styled.
IV. CONCLUSION
Biometric Face Recognition is Supervised Learning based classi cation problem where validation image dataset is used as valid (template) image for recognizing given input images. At rst given image dataset was read by running read_image_set ( ) to obtain X and T. And further to obtain validation (training) image set, split_image_set ( ) function was run and X1, X2, T1 & T2 were the matrix obtained used further for applying PCA and training portion. After splitting PCA was applied which helped to reduce dimension because low dimension principal components PS1 and PS2 will make face recognition more convenient and robust. Finally, training ANN was carried out by using transcg training method. After training with different set of parameters, analysis of result (accuracy) was gured out. Analysis of result is shown below:a. Executing the same ANN with nofpc (100), nofhn
(20) and val_ratio (0.3) several times, average of 81.8~ 82% was found.
b. Executing the same ANN by changing only nofhn (No. of hidden networks) keeping all default, accuracy got increased on increasing nofhn.
c. Executing the same ANN by changing only nofpc (No. of PCA) keeping all default, accuracy got increased at rst and decreased on increasing nofpc.
d. Executing the same ANN by changing all nofhn, nofpc and val_ratio keeping all default, maximum accuracy of 0.968(96.8%) was achieved when nofpc=150,nofhn=150 and val_ratio = 0.22.
REFERENCES[1] Techtargetcom. 2019. SearchEnterpriseAI. [Online]. [17 February
2019]. Available from: https://searchenterpriseai.techtarget.com/de nition/facial-recognition
[2] Shemi P M, Ali M A, A Principal Component Analysis Method for Recognition of Human Faces: Eigenfaces Approach, International Journal of Electronics Communication and Computer Technology (IJECCT),Volume 2 Issue 3 (2012).
[3] Uglov J. et al. 2007. Comparing Robustness of Pairwise and Multiclass Neural-Network Systems for Face Recognition.EURASIP Journal on Advances in Signal Processing. 116(1), pp. 1-5.
[4] Coppin, B (2004). Arti cial Intelligence Illuminated. (1st ed.). United States of America: Jones and Bartlett Publishers.
[5] Popova E. et al. 2018 Deep Neural Networks for Face Recognition: Pairwise Optimisation
[6] Schetinin, V. (2019) ‘Principal Component Analysis for Face Recognition’ [PowerPoint presentation]. Available at: https://drive.google.com/open?id=1wotwxmLj3xBvzdvuBQHV6tr7oC3B_27kHIa7cLWacb0 (Accessed: 17 February 2019).
[7] Machinelearningmasterycom. 2016. Machine Learning Mastery. [Online]. [2 March 2019]. Available from: https://machinelearningmastery.com/over tting-and-under tting-with-machine-learning-algorithms/
[8] Epifano, C. M. & Quaglia, A., 2012. Face Recognition: Methods, Applications and Technology, s.l.: Nova Science Publishers.
[9] Caudill, M., 1989. Neural Network Primer: Part I. s.l.:s.n.[10] Dans, E., 2018. Forbes. [Online] Available at: https://www.forbes.
com/sites/enriquedans/2018/06/25/facial-recognition-and-future-scenarios/#72a393811ac9 [Accessed 17 February 2019].
[11] Electronic Frontier Foundation, n.d. Facial Recognition. [Online] Available at: https://www.eff.org/pages/face-recognition[Accessed 13 February 2019].
[12] Lehe, L., 2015. Principal Component Analysis. [Online] Available at: http://setosa.io/ev/principal-component-analysis/[Accessed 23 February 2019].
[13] MathWorks, 2019. Scaled Conjugate Gradient Backpropagation- MATLAB trainscg. [Online] Available at: https://www.mathworks.com/help/deeplearning/ref/trainscg.html [Accessed 24 February 2019].
[14] MathWorks, 2019. Train and Apply Multilayer Shallow Neural Networks. [Online] Available at: https://www.mathworks.com/help/deeplearning/ug/train-and-apply-multilayer-neural-networks.html [Accessed 24 February 2019].
[15] Paul, L. C. & Sumam, . A. A., 2012. International Journal of Advanced Research in Computer Engineering & Technology (IJARCET). Face Recognition Using Principal Component Analysis Method, I(9), p. 135.
[16] Techtarget, 2018. Facial Recognition. [Online] Available at: https://searchenterpriseai.techtarget.com/definition/facial-recognitio [Accessed 13 February 2019].
[17] Vera-Rodriguez, R., Fierrez, J., Tome, P. & Ortega-Garcia, J., 2000. Advances in Intelligent and Soft Computing, s.l.: Springer.
18 IITM Journal of Management and IT
Abstract—In the human body, the vertebral column consists of vertebras, nerves, invertebrate discs, medulla, joints, and muscles, which provides support for body and movement axle. Dysfunction to any of the above components in this complex system creates disorders like Disc hernia and Spondylolisthesis. Manually classifying these disorders is a difficult task. Recently Machine learning (ML) techniques were applied in automating the vertebral column disorder classi cation. In this work, we applied Deep Neural Network (DNN) to classify the vertebral column dataset with three classes (Normal, Disk Hernia, and Spondylolisthesis). The vertebral column dataset was collected from the UCI machine learning database repository and has 310 records for training and testing with six biomechanical attributes. The classi cation accuracy and F-score for the DNN classi er in the vertebral column dataset is 85% and 83% respectively. Comparison with existing ML systems shows that our DNN based classi cation approach exhibits promising results.Keywords—Vertebral column; Classi cation; Machine Learning; Deep Neural Network.
I. INTRODUCTION
Biomedical research is increasingly dependent on the automatic analysis of the databases and literature to determine correlations and interactions amongst biomedical entities, functional roles, phenotypic traits and disease states [1],[2]. Vertebral column or the spine is a complex system composed of vertebrae, disk, nerves and its associated muscles. Several types of abnormalities in the spine can result either due to congenital reasons or as a result of poor posture or unequal muscle pull [3]. While the disc region provides a cushioning effect for mechanical loads, the vertebral body bears the load as well as provides a protective case to the spine [4].
Classifying defects in spinal card is a challenging task and it requires a more skill of an experienced radiologist for analyzing MRI and CT images [5],[6]. Different types of computational approaches were used to classify the spinal disorders [7],[8]. The most commonly faced issue in classifying spinal disorders is the class imbalance problem due to the number of subjects, accessibility to the scans, feature extraction, and number of features [9],[10]. Traditional machine learning approaches such as Support Vector Machines (SVM), Radial Basis Function (RBF), etc., required a vast amount of features and domain knowledge to classify spinal disorders [11],[12]. Designing features manually is a time-consuming process. To overcome this problem automated feature extraction techniques such as deep learning, deep neural networks etc., gained popularity in recent times [13]. Deep learning is one such a technique to extract the features without any supervision [14]. Deep learning nds convoluted structure in vast informational resources by utilizing the back propagation algorithm to demonstrate how a machine should change its interior parameters that are utilized to gure out the representation in each layer from the representation in the previous layer [15]. Recently text mining and natural language processing (NLP) researchers have developed different models of deep learning architectures for classi cation such as Convolution Neural Networks (CNN) [16], Recursive Neural Networks (RNN)[17], Recurrent Convolution Neural Networks (RCNN)[13], Deep Neural Networks (DNN) [18].
In this study, we employed a DNN based approach to classify the vertebral column dataset. In the remaining sections, section 2 explains the proposed materials and methods. Section 3 details the results and discussions. Section 4 shortly concludes our work and future perspectives.
Deep Neural Network for the Automatic Classi cation of Vertebral Column Disorders
Menaka Ramasamy #1, Sabenabanu Abdulkadhar #2, Jeyakumar Natarajan*#3
#Data Mining and Text Mining LaboratoryDepartment of Bioinformatics, Bharathiar University, Coimbatore-641046,Tamilnadu,India
[email protected]@hotmail.com

19Volume 11, Issue 1 • January-June 2020
Fig. 1: Architecture of our proposed approach
II. MATERIALS AND METHODS
We present a deep learning-based architecture to address the vertebral column disease classi cation problem. Our method focuses on deep neural network models to classify the datasets. Fig. 1 depicts the architecture of our system.A. Data Pre-processing and CleaningData pre-processing includes the removal of zero values, empty values and unnamed or NaN columns from the datasets.
Deep Neural Networks (DNN’s)Deep neural networks use efficient mathematical modeling to process data in complex ways. It employs unsupervised feature learning can learn discriminative and effective features from a large amount of unlabeled data [15],[18],[19]. A deep neural network is a neural network with a speci c degree of unpredictability, a neural network with multiple layers. The DNN based vertebral column disease classi cation problem is designed by following.Let we have assume the disease classi cation proposed method as ϴ = (N, x1,x2,x3…..xn). Here each input sequence of vertebral column disease was considered independently. Given an input sample, the network with parameter ϴ outputs the vector, where the ith component contains the score for disease instance. To attain the conditional probability, then, we have applied the softmax operations overall disease types.
(1)
Given all training examples T= we can calculate the log-likelihood of the parameters as follows
(2)To compute network parameter ϴ, we maximize the log-likelihood by employing a simple optimization
technique called stochastic gradient descent (SGD). The (N, x1,x2,x3…..xn)are randomly initialized because the parameters are in different layers of neural networks. We implement the back-propagation algorithm, the differentiation chain rule is applied through the network until the softmax layer is reached by iteratively selecting an example () and applying the following the update rule.
III. RESULTS AND DISCUSSIONS
A. Dataset and EvaluationThe dataset was retrieved from UCI (University of California, Irvine) machine learning database [20]. It contains 310 instances and each containing six features named pelvic incidence, pelvic tilt numeric, lumbar lord sis angle, sacral slope, pelvic radius and degree Spondylolisthesis [21],[22]. The dataset was organized into two types of classi cation tasks. The rst task consists in classifying patients as belonging to one out of three categories: Normal (100 patients), Disk Hernia (60 patients) or Spondylolisthesis (150 patients). The second task is the categories Disk Hernia and Spondylolisthesis that were merged into a single category labeled as ‹abnormal›. Thus, the second task consists in classifying patients as belonging to one out of two categories: Normal (100 patients) or Abnormal (210 patients). Our study focused on the rst type of classi cation. The partition of vertebral column dataset includes 50-50 split, which means that 50% dataset used for training, 50% dataset used for testing. Tables I AND II represents Biomechanical features used for classi cation of the vertebral column, Dataset splitting. The standard evaluation metrics such as Precision (P), Recall(R), F-score (F), and Accuracy were used to evaluate the performance of the proposed approach [23].
Table I: Biomechanical features used for classi cation of vertebral column
S.no Features1 Pelvic incidence2 Pelvic tilt3 Lumbar lordosis angle4 Sacral slope5 Pelvic radius6 Degree-spondylolisthesis
Table II: Dataset splittingDataset Count
Train 50% (155 instances)Test 50% (155 instances)
20 IITM Journal of Management and IT
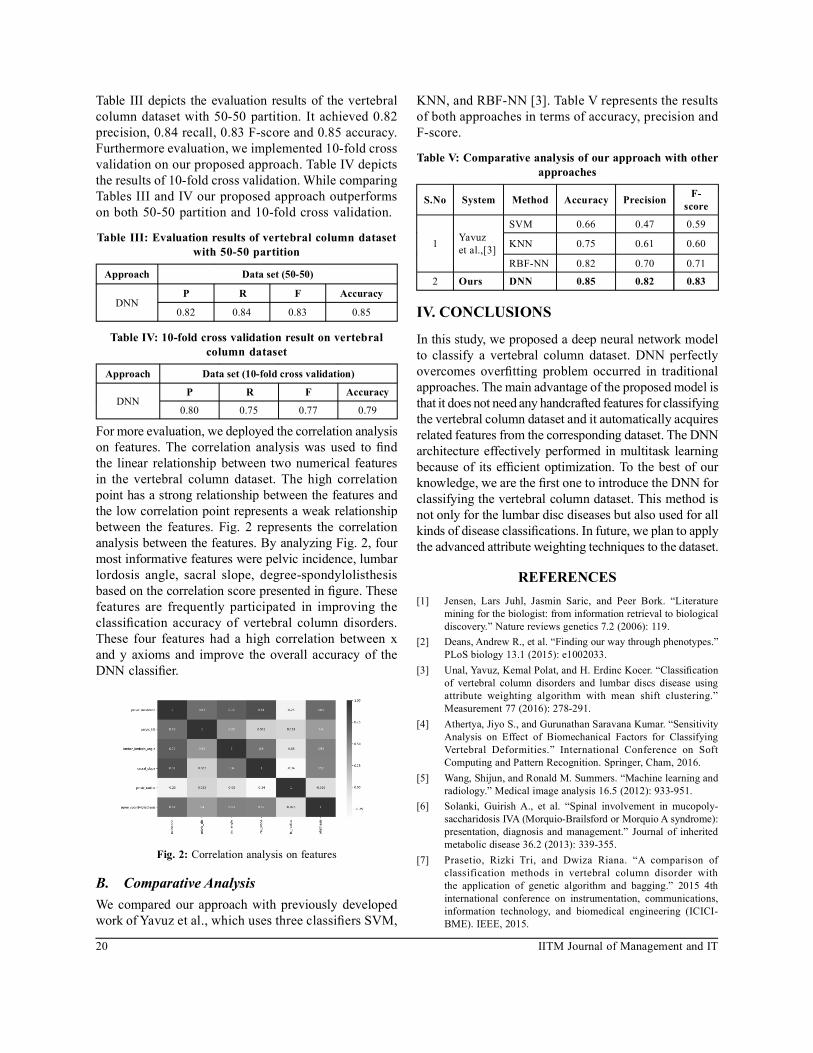
Table III depicts the evaluation results of the vertebral column dataset with 50-50 partition. It achieved 0.82 precision, 0.84 recall, 0.83 F-score and 0.85 accuracy. Furthermore evaluation, we implemented 10-fold cross validation on our proposed approach. Table IV depicts the results of 10-fold cross validation. While comparing Tables III and IV our proposed approach outperforms on both 50-50 partition and 10-fold cross validation.
Table III: Evaluation results of vertebral column dataset with 50-50 partition
Approach Data set (50-50)
DNNP R F Accuracy
0.82 0.84 0.83 0.85
Table IV: 10-fold cross validation result on vertebral column dataset
Approach Data set (10-fold cross validation)
DNNP R F Accuracy
0.80 0.75 0.77 0.79
For more evaluation, we deployed the correlation analysis on features. The correlation analysis was used to nd the linear relationship between two numerical features in the vertebral column dataset. The high correlation point has a strong relationship between the features and the low correlation point represents a weak relationship between the features. Fig. 2 represents the correlation analysis between the features. By analyzing Fig. 2, four most informative features were pelvic incidence, lumbar lordosis angle, sacral slope, degree-spondylolisthesis based on the correlation score presented in gure. These features are frequently participated in improving the classi cation accuracy of vertebral column disorders. These four features had a high correlation between x and y axioms and improve the overall accuracy of the DNN classi er.
Fig. 2: Correlation analysis on features
B. Comparative Analysis We compared our approach with previously developed work of Yavuz et al., which uses three classi ers SVM,
KNN, and RBF-NN [3]. Table V represents the results of both approaches in terms of accuracy, precision and F-score.
Table V: Comparative analysis of our approach with other approaches
S.No System Method Accuracy Precision F-score
1 Yavuz et al.,[3]
SVM 0.66 0.47 0.59
KNN 0.75 0.61 0.60
RBF-NN 0.82 0.70 0.71
2 Ours DNN 0.85 0.82 0.83
IV. CONCLUSIONS
In this study, we proposed a deep neural network model to classify a vertebral column dataset. DNN perfectly overcomes over tting problem occurred in traditional approaches. The main advantage of the proposed model is that it does not need any handcrafted features for classifying the vertebral column dataset and it automatically acquires related features from the corresponding dataset. The DNN architecture effectively performed in multitask learning because of its ef cient optimization. To the best of our knowledge, we are the rst one to introduce the DNN for classifying the vertebral column dataset. This method is not only for the lumbar disc diseases but also used for all kinds of disease classi cations. In future, we plan to apply the advanced attribute weighting techniques to the dataset.
REFERENCES[1] Jensen, Lars Juhl, Jasmin Saric, and Peer Bork. “Literature
mining for the biologist: from information retrieval to biological discovery.” Nature reviews genetics 7.2 (2006): 119.
[2] Deans, Andrew R., et al. “Finding our way through phenotypes.” PLoS biology 13.1 (2015): e1002033.
[3] Unal, Yavuz, Kemal Polat, and H. Erdinc Kocer. “Classi cation of vertebral column disorders and lumbar discs disease using attribute weighting algorithm with mean shift clustering.” Measurement 77 (2016): 278-291.
[4] Athertya, Jiyo S., and Gurunathan Saravana Kumar. “Sensitivity Analysis on Effect of Biomechanical Factors for Classifying Vertebral Deformities.” International Conference on Soft Computing and Pattern Recognition. Springer, Cham, 2016.
[5] Wang, Shijun, and Ronald M. Summers. “Machine learning and radiology.” Medical image analysis 16.5 (2012): 933-951.
[6] Solanki, Guirish A., et al. “Spinal involvement in mucopoly-saccharidosis IVA (Morquio-Brailsford or Morquio A syndrome): presentation, diagnosis and management.” Journal of inherited metabolic disease 36.2 (2013): 339-355.
[7] Prasetio, Rizki Tri, and Dwiza Riana. “A comparison of classification methods in vertebral column disorder with the application of genetic algorithm and bagging.” 2015 4th international conference on instrumentation, communications, information technology, and biomedical engineering (ICICI-BME). IEEE, 2015.
21Volume 11, Issue 1 • January-June 2020
[8] Ansari, Sana, et al. “Diagnosis of vertebral column disorders using machine learning classifiers.” 2013 International Conference on Information Science and Applications (ICISA). IEEE, 2013.
[9] Ravì, Daniele, et al. “Deep learning for health informatics.” IEEE Journal of biomedical and health informatics 21.1 (2016): 4-21.
[10] Liu, Feng, et al. “Classi cation of different therapeutic responses of major depressive disorder with multivariate pattern analysis method based on structural MR scans.” PloS one 7.7 (2012): e40968.
[11] Siuly, Siuly, and Yanchun Zhang. “Medical big data: neurological diseases diagnosis through medical data analysis.” Data Science and Engineering 1.2 (2016): 54-64.
[12] Rahman, Md Mahmudur, Bipin C. Desai, and Prabir Bhattacharya. “Medical image retrieval with probabilistic multi-class support vector machine classi ers and adaptive similarity fusion.” Computerized Medical Imaging and Graphics 32.2 (2008): 95-108.
[13] Abdulkadhar, Sabenabanu, Gurusamy Murugesan, and Jeyakumar Natarajan. “Recurrent convolution neural networks for classi cation of protein-protein interaction articles from biomedical literature.” 2017 Third International Conference on Research in Computational Intelligence and Communication Networks (ICRCICN). IEEE, 2017.
[14] Sun, Yi, Xiaogang Wang, and Xiaoou Tang. “Deep learning face representation from predicting 10,000 classes.” Proceedings of the IEEE conference on computer vision and pattern recognition. 2014.
[15] LeCun, Yann, Yoshua Bengio, and Geoffrey Hinton. “Deep learning.” nature 521.7553 (2015): 436.
[16] Abdel-Hamid, Ossama, et al. “Applying convolutional neural networks concepts to hybrid NN-HMM model for speech recognition.” 2012 IEEE international conference on Acoustics, speech and signal processing (ICASSP). IEEE, 2012.
[17] Luong, Thang, Richard Socher, and Christopher Manning. “Better word representations with recursive neural networks for morphology.” Proceedings of the Seventeenth Conference on Computational Natural Language Learning. 2013.
[18] Deng, Li, Geoffrey Hinton, and Brian Kingsbury. “New types of deep neural network learning for speech recognition and related applications: An overview.” 2013 IEEE International Conference on Acoustics, Speech and Signal Processing. IEEE, 2013.
[19] Zeng, Daojian, et al. “Relation classi cation via convolutional deep neural network.” (2014).
[20] Newman, David J., et al. “UCI repository of machine learning databases, 1998.” (2008).
[21] Hamodi, Yaser Issam. “Rule Extraction in Diagnosis of Vertebral Column Disease.” International Journal on Recent and Innovation Trends in Computing and Communication 3.3 (2015): 1120-1124.
[22] Huang, M., Y. Hung, and D. Liu. “Diagnostic prediction of vertebral column using rough set theory and neural network technique.” Inf Technol J 13.5 (2014): 874-884.
[23] Sokolova, Marina, Nathalie Japkowicz, and Stan Szpakowicz. “Beyond accuracy, F-score and ROC: a family of discriminant measures for performance evaluation.” Australasian joint conference on arti cial intelligence. Springer, Berlin, Heidelberg, 2006.

22 IITM Journal of Management and IT
Abstract—In recent years a drastic change is noticed in a traf c ow that has undergone signi cant changes such as competition, work style, heavy duties, and hectic timings. In regards to these changes, the main concern is the environment, commercial market, customer satisfaction, restrictions, and a competitive edge. Urban logistics and consumer markets highly depend on the moment and travel. Due to which the traf c in ows and out ows are increased drastically. To manage such huge ow’s traf c is monitored and behavior is observed from the analytical end. In this article, urban traf c parameters are considered which affect the slowness in ow. These parameters are tuned using machine learning methods. The study extracts certain parameters that are critical and attention is majorly required. The extracted parameters are thereby tuned by facilitating requirements in order to improve the ow of traf c. Tuning uses machine learning methods for predicting the behavior of traf c for a week’s time in urban cities. Keywords—Machine Learning, Smart Cities, Traffic, Tuning, cross validation, Transportation;
I. INTRODUCTION
Traf c control and management in metropolitan cities is tedious task during peak hours. Many solutions are provided by constructing y over, under pass and building more roads still the problem persists. Many solutions were provided such as changing the timings of many organizations and increase the amount of people travelling in each vehicle (Affonso, Sassi, & Ferreira, 2011). Though people do work in day and night shifts still the congestion on roads transit is not diminishing. Yet, an ef cient path with laid and structured infrastructure could regulate traf c ow. Novel traf c controlling strategies are required to handle the scenario in peak hours for better progress of the country (Ferreira & Sassi, 2010). With the current estimates of number of vehicles on roads there is a need to estimate exponential growth of the vehicles in upcoming years. Model or the solution, which is expected, should be able to cope with uncertain situations by incorporating
necessary measures.The traffic congestion in urban life inflicts delay, frustration in people, accidents and mental tension to all classes of people. Although many counter measures are initiated and implemented still people face dif culties and dissatisfaction during their journey. On the other hand, transit accompanies the nancial and economic activities through an increase in demand of trade, exchange and connectivity. This movement of people and goods from one place to another increases the revenue for the government following that, increases the global marketing of products and changes in demand and supply. These effects will change share market value globally. Research study on traf c reveals a variety of policies were executed for reducing the traf c congestion. Political measures appeal is more in peak period travel. These vehicles are undermined in the exible hours. Due to these measures some complex behavioral changes are determined which effect organization upgrades or nancial enticements. These properties arouse the dif culties in signi cant wealth transfers and distrust exceptionally problematic to ratify in a democracy. The percentage of vehicles such as cars, two wheels, bus, railway and walk are basic people’s transit modes are 45%, 25%, 10%, 18% and 12% respectively. The traf c congestion is not only the problem, people are advancing the modes of travel as they are automobile dependent and on the other end this even increases the social and environmental problems. The present study focuses on peculiar challenge in combining different parameters to enable comprehensive evaluations in order to tune for a better transit. These parameters are tuned using machine learning algorithms with a view to adapt as per the requirements.
II. RELATED WORK
A brief overview of these techniques in order to track and control the congestion is discussed in this section.• Anders Kofed-Petersen et.al presented a prototype-
based system which uses past vehicle counts
Tuning Parameters Using Machine Learning for Minimizing Slowness of Traf c in Smart Cities
J V N LakshmiAssociate Professor Jain University Bangalore, India
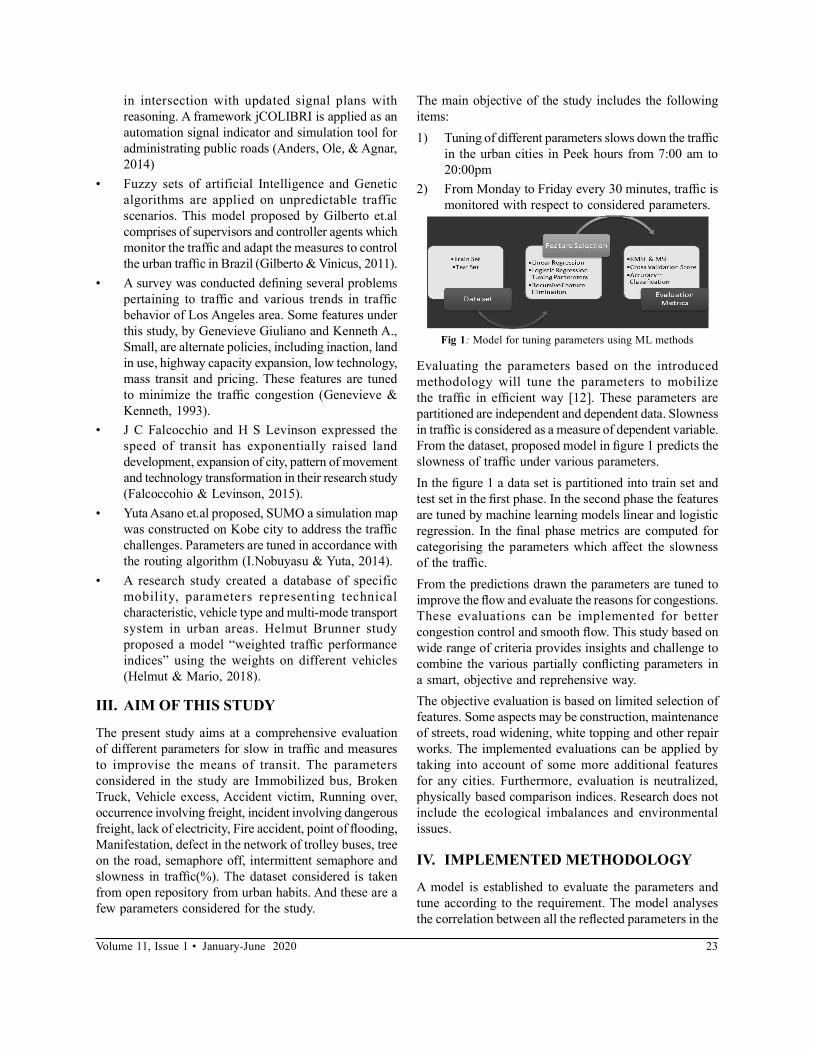
23Volume 11, Issue 1 • January-June 2020
in intersection with updated signal plans with reasoning. A framework jCOLIBRI is applied as an automation signal indicator and simulation tool for administrating public roads (Anders, Ole, & Agnar, 2014)
• Fuzzy sets of artificial Intelligence and Genetic algorithms are applied on unpredictable traffic scenarios. This model proposed by Gilberto et.al comprises of supervisors and controller agents which monitor the traf c and adapt the measures to control the urban traf c in Brazil (Gilberto & Vinicus, 2011).
• A survey was conducted de ning several problems pertaining to traf c and various trends in traf c behavior of Los Angeles area. Some features under this study, by Genevieve Giuliano and Kenneth A., Small, are alternate policies, including inaction, land in use, highway capacity expansion, low technology, mass transit and pricing. These features are tuned to minimize the traf c congestion (Genevieve & Kenneth, 1993).
• J C Falcocchio and H S Levinson expressed the speed of transit has exponentially raised land development, expansion of city, pattern of movement and technology transformation in their research study (Falcoccohio & Levinson, 2015).
• Yuta Asano et.al proposed, SUMO a simulation map was constructed on Kobe city to address the traf c challenges. Parameters are tuned in accordance with the routing algorithm (I.Nobuyasu & Yuta, 2014).
• A research study created a database of specific mobility, parameters representing technical characteristic, vehicle type and multi-mode transport system in urban areas. Helmut Brunner study proposed a model “weighted traf c performance indices” using the weights on different vehicles (Helmut & Mario, 2018).
III. AIM OF THIS STUDY
The present study aims at a comprehensive evaluation of different parameters for slow in traf c and measures to improvise the means of transit. The parameters considered in the study are Immobilized bus, Broken Truck, Vehicle excess, Accident victim, Running over, occurrence involving freight, incident involving dangerous freight, lack of electricity, Fire accident, point of ooding, Manifestation, defect in the network of trolley buses, tree on the road, semaphore off, intermittent semaphore and slowness in traf c(%). The dataset considered is taken from open repository from urban habits. And these are a few parameters considered for the study.
The main objective of the study includes the following items:1) Tuning of different parameters slows down the traf c
in the urban cities in Peek hours from 7:00 am to 20:00pm
2) From Monday to Friday every 30 minutes, traf c is monitored with respect to considered parameters.
Fig 1: Model for tuning parameters using ML methods
Evaluating the parameters based on the introduced methodology will tune the parameters to mobilize the traf c in ef cient way [12]. These parameters are partitioned are independent and dependent data. Slowness in traf c is considered as a measure of dependent variable. From the dataset, proposed model in gure 1 predicts the slowness of traf c under various parameters. In the gure 1 a data set is partitioned into train set and test set in the rst phase. In the second phase the features are tuned by machine learning models linear and logistic regression. In the nal phase metrics are computed for categorising the parameters which affect the slowness of the traf c. From the predictions drawn the parameters are tuned to improve the ow and evaluate the reasons for congestions. These evaluations can be implemented for better congestion control and smooth ow. This study based on wide range of criteria provides insights and challenge to combine the various partially con icting parameters in a smart, objective and reprehensive way.The objective evaluation is based on limited selection of features. Some aspects may be construction, maintenance of streets, road widening, white topping and other repair works. The implemented evaluations can be applied by taking into account of some more additional features for any cities. Furthermore, evaluation is neutralized, physically based comparison indices. Research does not include the ecological imbalances and environmental issues.
IV. IMPLEMENTED METHODOLOGY
A model is established to evaluate the parameters and tune according to the requirement. The model analyses the correlation between all the re ected parameters in the
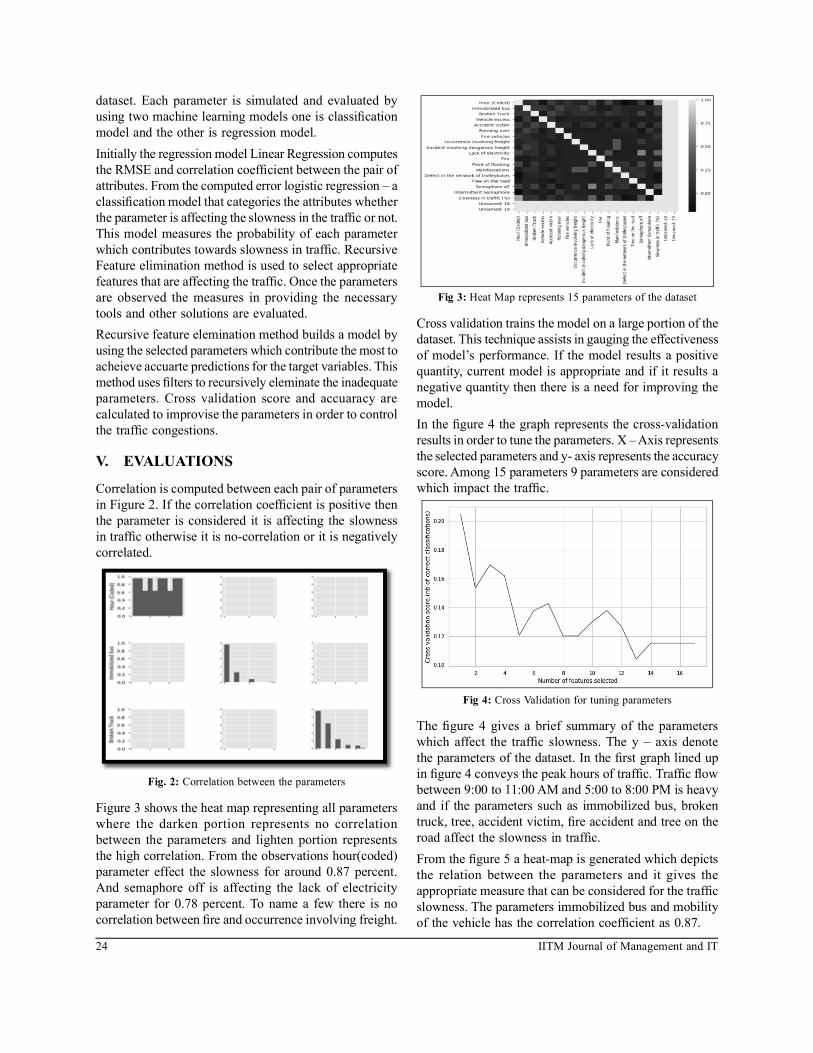
24 IITM Journal of Management and IT
dataset. Each parameter is simulated and evaluated by using two machine learning models one is classi cation model and the other is regression model. Initially the regression model Linear Regression computes the RMSE and correlation coef cient between the pair of attributes. From the computed error logistic regression – a classi cation model that categories the attributes whether the parameter is affecting the slowness in the traf c or not. This model measures the probability of each parameter which contributes towards slowness in traf c. Recursive Feature elimination method is used to select appropriate features that are affecting the traf c. Once the parameters are observed the measures in providing the necessary tools and other solutions are evaluated. Recursive feature elemination method builds a model by using the selected parameters which contribute the most to acheieve accuarte predictions for the target variables. This method uses lters to recursively eleminate the inadequate parameters. Cross validation score and accuaracy are calculated to improvise the parameters in order to control the traf c congestions.
V. EVALUATIONS
Correlation is computed between each pair of parameters in Figure 2. If the correlation coef cient is positive then the parameter is considered it is affecting the slowness in traf c otherwise it is no-correlation or it is negatively correlated.
Fig. 2: Correlation between the parameters
Figure 3 shows the heat map representing all parameters where the darken portion represents no correlation between the parameters and lighten portion represents the high correlation. From the observations hour(coded) parameter effect the slowness for around 0.87 percent. And semaphore off is affecting the lack of electricity parameter for 0.78 percent. To name a few there is no correlation between re and occurrence involving freight.
Fig 3: Heat Map represents 15 parameters of the dataset
Cross validation trains the model on a large portion of the dataset. This technique assists in gauging the effectiveness of model’s performance. If the model results a positive quantity, current model is appropriate and if it results a negative quantity then there is a need for improving the model. In the gure 4 the graph represents the cross-validation results in order to tune the parameters. X – Axis represents the selected parameters and y- axis represents the accuracy score. Among 15 parameters 9 parameters are considered which impact the traf c.
Fig 4: Cross Validation for tuning parameters
The gure 4 gives a brief summary of the parameters which affect the traf c slowness. The y – axis denote the parameters of the dataset. In the rst graph lined up in gure 4 conveys the peak hours of traf c. Traf c ow between 9:00 to 11:00 AM and 5:00 to 8:00 PM is heavy and if the parameters such as immobilized bus, broken truck, tree, accident victim, re accident and tree on the road affect the slowness in traf c.From the gure 5 a heat-map is generated which depicts the relation between the parameters and it gives the appropriate measure that can be considered for the traf c slowness. The parameters immobilized bus and mobility of the vehicle has the correlation coef cient as 0.87.

25Volume 11, Issue 1 • January-June 2020
The parameter broken truck, Accident victim and Semaphore Off have the correlation of 0.56, 0.43 and 0.38 respectively. Lack of electricity and Point of ooding parameters have the major effect on traf c slowness from the graph i.e. 0.92 and 0.89 respectively. These two peculiar parameters affect the major portion in traf c slowness. From this result it is evident these parameters listed above need to improve for better movement of traf c and reduce the slowness. If these parameters are tuned by providing necessary measures and availing the requirements slowness in the traf c can be controlled which de nitely increases the traf c ow.
Fig 5: Heat Map representing 9 parameters after cross validation
VI. IMPROVEMENT STRATEGY
In cities without acceptable urban structuring this issue may to become by permanent. Some places a jam causes traf c due to which re-routing is required. The traf c needs to be observed accordingly and need to be re-routed using dynamic routing algorithms for ef cient movement of vehicles.
Fig 6: Stages of Moving Truck at time of traf c jam
By applying dynamic re-routing algorithms, a moving truck is travelling in the path as shown in gure 6 of (A) then after travelling a little distance, traf c got slow down. That is observed from gure (B) of there is a jam
and the yellow line represent the traf c is slow due to heavy congestion. Then in (C) a re-route technique is applied to nd a new way there so minimal congestion and that is depicted using green lines. Due to this jam many other areas are affected those lines are represented using red lines.Application of dynamic re-routing uses certain critical parameters for learning the behaviour and depicts the complexity for re-routing the vehicles. It uses various levels such as link level which is based on time dependency.
Fig 7: Slowness in Traf c in regards to parameters
Route level examines the longest or shortest path for optimal bene t. Demand level clears the traf c in case of emergency and reroutes in an ef cient way to avoid slowness parameter. The route choice can be chosen necessarily or computed against each time interval of travel. Hence, one of these three levels are used by dynamic algorithms to re-route accordingly.
Fig 8: Hours and Slowness of Traf c
Figure 7 describes the slowness in traf c in percentages due to various parameters. This histogram and a normal bell curve show the variations in the traffic due to parameters. Each parameter is affecting the traf c so

26 IITM Journal of Management and IT
strategic planning would be to interpret the behaviour of traf c that affects the slowness %. In gure 8 the graph represents two histograms and normal curves. Blue histogram represents the hours and yellow represents the slowness. From this graph it is evident that which parameters contribute to slowness of traf c. Each bin is considered as time slots and the curve in the middle region shows the highest peak for time between 8:00 Am to 11:00 Am and another peak is for 5:00 Pm to 8:00 Pm.
VII. CONCLUSION
The stu dy provides a database with speci c mobility related criteria and parameters which usually, affect the slowness in traf c. From the above study the movement of heavy vehicles during the peak hours affects the slowness. Considering various parameters among which certain should be tuned by making available necessary tools, requirements and equipment.
Some of the observations need to be addressed for improving the urban mobility are listed below:
• Individual taxi vehicles dominated more than private cars
• Small vehicles can be ef cient mode of transport• Heavy vehicle mobility should be restricted during
the peak hours.• Use of public transport such as Buses, Metro Trains
or walk mode should be preferred.• Sensor need to be installed to track the congestion
during peak hours.The prediction of traf c behaviour can contribute to decision making prior to routing and supports in transit, even if distance is a little bigger, and there is a savings in time and fuel. From the study some parameters that are affecting the traf c slowness can be detected and those regions are needed to be monitored for proper channelling and congestion control.
REFERENCES[1] Sassi, R. J., Silva, L. A., Hernandez, D. M. E. ‘A methodology
using neural networks to cluster validity discovered from a marketing database’. In: 10th Brazilian Symposium on Neural Networks (SBRN), Salvador.IEEE Proc. of Sbrn. V. 1. (2008), pp. 03-08.
[2] Affonso, C., Sassi, R. J., Ferreira, R. P. ‘Traf c ow breakdown prediction using feature reduction through rough-neuro fuzzy networks. In: IEEE Proc. Int. Joint Conf. on Neural Networks (IJCNN), 2011, San Jose, California, USA pp. 1943- 1947.
[3] Sassi, R. J., Affonso, C., Ferreira, R. P. ‘Rough Neuro-Fuzzy Network Applied to Traf c Flow Breakdown in The City of Sao Paulo’. In: IEEE Proc. Int. Conf. on Management and Service Science (Mass), 2011, Wuhan, China, August 12-14, pp. 1-5.
[4] Ferreira, R. P., Affonso, C., Sassi, R. J. Dynamic Routing Combined to Forecast the Behavior of Traf c in The City of Sao Paulo Using Neuro Fuzzy Network. Journal of Computer Technology and Application (JCTA), (2011) 2, (1) pp 36-41.
[5] Ferreira, R. P., Sassi, R. J. ‘A Proposal for Dynamic Routing of Vehicles in The City of Sao Paulo Using Intelligent Routing’. In 3rd Int. Conf. on Information Systems, Logistics and Supply Chain. (2010) – Casablanca (Morocco), 3, pp 1-13.
[6] Ricardo P, Carlos A, Renato J. S. ‘Combination of AI technique for prediction behaviour of urban vehicular traf c in city of SAO PAULO’, in Brazilian congress Computational Intelligence on November at SBIC, Brazil. (2011), pp 1-7.
[7] Anders, F., Ole, J., Agnar, A., ‘Case-based Reasoning for improving Traf c ow in urban intersections’ in ICCBR at Switzerland, LNCS 8765, (2014) pp. 215–229.
[8] Genevieve, G., Kenneth, S., ‘Alternate strategies for coping with traf c congestion’ in Egon-Sohmen-Foundation Symposium on Urban Agglomerations and Economic Growth, Zurich, (1993) pp 20-23.
[9] Falcoccohio, J., Levinson, H., ‘How Transportation Technology Has Shaped Urban Travel Patterns in Road Traf c Congestion: A Concise Guide, Springer Tracts on Transportation and Traf c’ 7, DOI 10.1007/978-3-319-15165-6_2 (2015).
[10] Yuta, A., Nobuyasu, I., et al., ‘Traf c Simulation of Kobe-City’ Proc. of the Int. Conf. on Social Modeling and Simulation, DOI 10.1007/978-3-319-20591-5_23 (2014).
[11] Helmut, B., Mario, H., et al., ‘Evaluation of various means of transport for urban areas in Energy’, Sustainability and Society, (2018) DOI 10.1186/s13705-018-0149-0.
[12] Gilberto, N., Vinicus, S., ‘Urban Traf c Control and Monitoring – An Approach for the Brazilian Intelligent Cities Project’, Practical Applications of Intelligent Systems, AISC 124, (2011), pp. 543–551

27Volume 11, Issue 1 • January-June 2020
Abstract— Blockchain Technology has proven to be or will prove to be a very essential Technology in the coming future, as it secures and safeguards the information- or here referred to as a transaction. This Technology enables in the elimination of the third-party involvement, which is needed for the level of trust in the exchange of data- transaction. This is one of the root causes of this Technology to impact the business models throughout the industries, it will affect the working of the industries and these industries will have to substantially change their business models and structure to actually grow with the growing Technology. Keywords—Blockchain technology, Banking and nance, applications, future, regulation, opportunities and implementation
I. INTRODUCTION
Blockchain is a public electronic ledger which is built around a system that can be openly shared among the users to create an unchangeable record of transactions. Theses transactions are posted on the public ledger and is veri ed by the different parties to the transaction. Every time a new set of transactions is added, that data become another block in the chain hence further initiating this process. Once the data is entered into the chain it can never be erased. Blockchain can only be updated by the consensus between the participants in the system and once this data is entered it can never be erased. It is a write-once and add many technologies, making it a safe and veri able record pf each transaction that is being recorded in the blocks of the chain. A. Working of BlockchainTo explain the working of Blockchain, lets consider 5 participants in our Blockchain, A, B, C, D and E, who are on a decentralized and distributed network. This example of Blockchain will help us understand the Blockchain Technology in the bitcoin system.A wants to send 100 bitcoins to B.
The transaction of A sending 100 bitcoins to B will represent online as a block. This block is then broadcasted to each and every participant in the network (C, D and E). In this example, C, D and E acts as validators in the network. Which will approve for the transaction validity.The block containing the information or the transaction of 100 bitcoins is added to the Blockchain.
The 100 bitcoins are then transferred from A to B.
In step 3, C, D and E, the validators, execute the cryptographic algorithms and hold an evaluation and verify the history of the individual Blockchain under consideration. If the evaluation further proves that the history and hash values are valid, then the transaction is accepted. This process of acceptance by validators is known as distributed consensus.
If supposing, in this C, D and E for some reason cannot validate the information in the Blockchain, then the data is rejected and entry for the block is denied and the block is not added to the Blockchain.
A Blockchain is said to be valid if:
• All the blocks that are present in the Blockchain are valid.
• All the transactions in the blocks are valid.• And the Blockchain starts with a genesis block
(genesis block is the rst block and is different from the other blocks, meaning that it doesn’t contain or carry any hash value of some other block or the previous block, as every block in the Blockchain carries a hash value of the previous block).
B. Bene ts of Blockchain Technology in different sectors
Bene ts of Blockchain in Real EstateBlockchain has brought a new fresh outlook on how the real estate sector operates. It offers multiple bene ts, including the following.
Blockchain Technology in Banking and FinanceHeena Arora#1, Anita Venaik*2
#Amity Business School, Amity UniversitySector 125, Noida, Uttar Pradesh, India
*Amity Business School, Amity UniversitySector 125, Noida, Uttar Pradesh, India

28 IITM Journal of Management and IT
• Tokenization: With blockchain, it will become possible to tokenize actions. This means that properties can be rented out for a certain period using pre-de ned code.
• Proper tenant and investor identity: Digital identities can help both investor and tenant to create digital identities that are easy to verify and work with.
• Property sale: Property sale can be automated with smart contracts. It enables legal agreements that are traceable and executable if a certain condition is met.
• Real-time accounting: With blockchain, it is possible to do real-time accounting
Bene ts of Blockchain in GovernmentMany governments around the world are not in favour of the cryptocurrency, but they do understand the importance of blockchain and what it has to offer. The government can utilize blockchain in many ways, and the bene ts include the following• Proper identity management: The government can
use identity management for every citizen. This way, they can manage the transactions, credentials, and also do data management.
• Do elections: They can also utilize the blockchain to do transparent elections where there is no chance of frauds
• Finance management: Engage in a better way to do nance management. They can also allocate budget with transparency, ef ciency, and effectiveness.
Bene ts of Blockchain in HealthcareHealthcare also requires a complete change if they want to be more effective in providing service to their patients. Blockchain brings a lot of bene ts to the table. Let’s go through them below.• Universal patient pro le: The use of a decentralized
ledger means a uni ed patient pro le. Patients do not have to carry their papers anymore as everything can be stored and shared through a secure ledger.
• Drug traceability: Drug traceability will also improve with blockchain. As everything is tracked in real-time and in a decentralized network, there are next to impossible chances for it to get hampered.
• Better clinical trials: Patient’s data is secured and stored in a decentralized network.
• Electronic Health Records (EHRs): With blockchain, health organizations can easily manage electronic records.
II. LITERATURE REVIEW
• Tejal Shah (2018, July). Applications of Blockchain Technology in Banking & Finance: The application of Blockchain in the banking and nancial industry and how it can be implemented. It concluded that, regulators should engage and shape the innovation. Blockchain Technology is becoming a crucial factor around the world and is generating significant interest across the industries
• Soonduck Yoo (2017, December). Blockchain based nancial case analysis and its implications: The financial market is going through a lot of changes and is moving towards more adaptation to change. The author after examining the case and the situation in the banking industry and what all are the possible application of Blockchain Technology in the nancial markets, suggested various methods and ways Blockchain Technology can be applied.
• Denny Nack (2018, September). Blockchain technology and the nancial services market: This paper talked about the benefits that blockchain could provide and bene t the nancial sector at a large scale. It talks about the removal of third parties, decrease in costs and increase in pro ts for various industries. It also talked about the different blockchains and the way it can be used in different situations and industries.
• Magnus Vitso (2017, June). A study on blockchain technology as a resource for competitive advantage: Blockchain technology is still its nascent stage and has the potential to eliminate the third parties or the mediators. It was found that the link between application areas and entrepreneurial opportunities were super cially covered for blockchain technology.
• Stefan k. Johansen (2016, November). A compre-hensive literature review on the Blockchain as a technological enabler for innovation: Decentralization and digital innovation was the main talked about concepts in the paper, as blockchain is the combination of these two components. Researchers have found various applications of blockchain technology but there is still is a long road ahead in actually implementing the blockchain technology in the industries
• Thomas Kitsantas (2019, July). A review of Blockchain Technology and its application in the business environment: This paper focussed on the different application of Blockchain in different industries or sectors. The author mentions that there is much more beyond cryptocurrencies which a
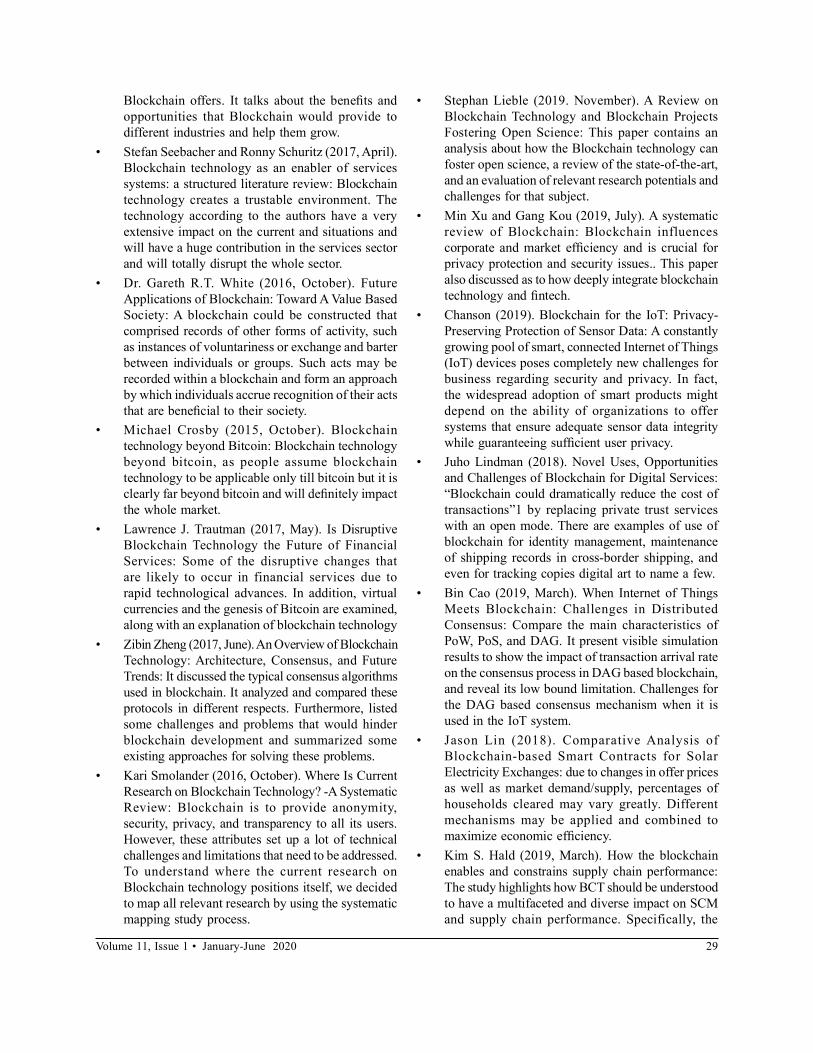
29Volume 11, Issue 1 • January-June 2020
Blockchain offers. It talks about the bene ts and opportunities that Blockchain would provide to different industries and help them grow.
• Stefan Seebacher and Ronny Schuritz (2017, April). Blockchain technology as an enabler of services systems: a structured literature review: Blockchain technology creates a trustable environment. The technology according to the authors have a very extensive impact on the current and situations and will have a huge contribution in the services sector and will totally disrupt the whole sector.
• Dr. Gareth R.T. White (2016, October). Future Applications of Blockchain: Toward A Value Based Society: A blockchain could be constructed that comprised records of other forms of activity, such as instances of voluntariness or exchange and barter between individuals or groups. Such acts may be recorded within a blockchain and form an approach by which individuals accrue recognition of their acts that are bene cial to their society.
• Michael Crosby (2015, October). Blockchain technology beyond Bitcoin: Blockchain technology beyond bitcoin, as people assume blockchain technology to be applicable only till bitcoin but it is clearly far beyond bitcoin and will de nitely impact the whole market.
• Lawrence J. Trautman (2017, May). Is Disruptive Blockchain Technology the Future of Financial Services: Some of the disruptive changes that are likely to occur in financial services due to rapid technological advances. In addition, virtual currencies and the genesis of Bitcoin are examined, along with an explanation of blockchain technology
• Zibin Zheng (2017, June). An Overview of Blockchain Technology: Architecture, Consensus, and Future Trends: It discussed the typical consensus algorithms used in blockchain. It analyzed and compared these protocols in different respects. Furthermore, listed some challenges and problems that would hinder blockchain development and summarized some existing approaches for solving these problems.
• Kari Smolander (2016, October). Where Is Current Research on Blockchain Technology? -A Systematic Review: Blockchain is to provide anonymity, security, privacy, and transparency to all its users. However, these attributes set up a lot of technical challenges and limitations that need to be addressed. To understand where the current research on Blockchain technology positions itself, we decided to map all relevant research by using the systematic mapping study process.
• Stephan Lieble (2019. November). A Review on Blockchain Technology and Blockchain Projects Fostering Open Science: This paper contains an analysis about how the Blockchain technology can foster open science, a review of the state-of-the-art, and an evaluation of relevant research potentials and challenges for that subject.
• Min Xu and Gang Kou (2019, July). A systematic review of Blockchain: Blockchain influences corporate and market ef ciency and is crucial for privacy protection and security issues.. This paper also discussed as to how deeply integrate blockchain technology and ntech.
• Chanson (2019). Blockchain for the IoT: Privacy-Preserving Protection of Sensor Data: A constantly growing pool of smart, connected Internet of Things (IoT) devices poses completely new challenges for business regarding security and privacy. In fact, the widespread adoption of smart products might depend on the ability of organizations to offer systems that ensure adequate sensor data integrity while guaranteeing suf cient user privacy.
• Juho Lindman (2018). Novel Uses, Opportunities and Challenges of Blockchain for Digital Services: “Blockchain could dramatically reduce the cost of transactions”1 by replacing private trust services with an open mode. There are examples of use of blockchain for identity management, maintenance of shipping records in cross-border shipping, and even for tracking copies digital art to name a few.
• Bin Cao (2019, March). When Internet of Things Meets Blockchain: Challenges in Distributed Consensus: Compare the main characteristics of PoW, PoS, and DAG. It present visible simulation results to show the impact of transaction arrival rate on the consensus process in DAG based blockchain, and reveal its low bound limitation. Challenges for the DAG based consensus mechanism when it is used in the IoT system.
• Jason Lin (2018). Comparative Analysis of Blockchain-based Smart Contracts for Solar Electricity Exchanges: due to changes in offer prices as well as market demand/supply, percentages of households cleared may vary greatly. Different mechanisms may be applied and combined to maximize economic ef ciency.
• Kim S. Hald (2019, March). How the blockchain enables and constrains supply chain performance: The study highlights how BCT should be understood to have a multifaceted and diverse impact on SCM and supply chain performance. Specifically, the

30 IITM Journal of Management and IT
study develops a set of propositions, each of which highlights a different path of how these impacts might manifest.
• Bhupendra Pratap Singh (2019, March). Secured decentralized archiving healthcare data using blockchain with IoT: Overall it shows that Blockchain offers numerous opportunities for usage in the healthcare sector, e.g. in public health management, user-oriented medical research based on personal patient data as well as drug counterfeiting.
• Dr. Anita Venaik (2019, October). Information Security Parameters Used By Aadhar, Uidai And It’s Impact: The study of this topic was to analyse the use of Aadhar cards issued by governments and its impact. The reliability and the reasons of reliability are highlighted through this study. The key security parameters used in aadhar are tested and evaluated. The research highlights various benefits among which the reduced data breaches, the portability, easy to use are few features of aadhar. According to the study the availability and the con dentiality is the biggest drawback in the aadhar system. To ensure proper veri cation so that no loopholes are their various veri cations are done such as face authentication, KYC, virtual ID.
• Dr. Anita Venaik (2019, May). Moving from Cash to Cashless Economy: - A Study of Consumer Perception Towards Digital Transactions: There is a long way for India to become a cashless economy. People still lack trust and con dence while using digital payment methods. A lot of development in the eld of infrastructure is required to make the dream of Digital India a reality. There are many people who are still not aware about the cashless economy not only in India but outside of India. Government has faced a lot of criticism in the past from the public for the various plans implemented on the public. There are a lot of challenges in ful lling the dream of digital India but in the long run cashless economy will help in growth and will bring a lot of bene ts and opportunities with it.
• Dr. Anita Venaik. Blockchain technology and its utilization in tracking milk process: This paper suggested a model related to blockchain technology for supply chain and gave an insight to reimagine supply chain as “virtual supply chain”. The block chain/DLT do have functionality that can be useful in enabling the global food security. These technologies can facilitate distributed and secure digital identities and so as part of an information architecture is concerned, it incorporates the secure smart devices
on packaging, logistics operations, detectors etc. The applications of permissioned distributed ledger technology could contribute towards enabling the global food security. It will help eradicate the middle man and help the process to be smooth & integral.
• Dr. Anita Venaik & Dr. Vijit Chaturvedi (2019, December). Blockchain technology as an Innovative Tool For Agriculture sustenance: This paper propose a model for agriculture sustenance and talked about the Agriculture 4.0 and about the prediction accuracy technology for facilitating the agriculture using AI technology. Blockchain will serve as a necessary element in ensuring sustainability of most basic sector of our economy and will help in improving varied aspect of development indicators right from social transformation, security, innovative working, low risk, nancial strength of farmers, selection based on correct and accurate information and above all independence in making decision.
• Dr. Anita Venaik & Nikhil Budhiraja (2018, August). Cryptocurrency – Could it be a menace to the society: People use various international banks to send and receive money across the world, which generally takes time and leads to higher transaction fees, thus ending paying huge amount of their hard-earned money, but with the cryptocurrency there is no issue of transacting the huge amount of money, because it’s a peer to peer form of transaction, thus there is no middle-men required and there are no conversion charges dealt with it.
III. RESEARCH METHODOLOGY
A. Research Objectives• To study the possible applications of Blockchain
technology in Banking and Finance.• To analyse the challenges in implementation of
Blockchain technology in Banking and Finance.• To identify the opportunities and challenges of
Blockchain technology for future prospects in India.
B. Research type and data collectionSecondary research or desk research is used. It is a research method that involves using already existing data. Existing data is summarized and collated to increase the overall effectiveness of research.The data collected in this study is secondary data through research papers, articles, publications, newspapers, magazines, includes research material published in

31Volume 11, Issue 1 • January-June 2020
research reports and similar documents. Secondary data is used for the purpose of the study.
IV. CONTENT ANALYSIS
A. Blockchain Technology in Banking and FinanceBlockchain Technology holds the power to drastically transform the whole banking and nance sector, though there are a lot of roadblocks but they are continuously worked upon to bring this Technology effective in the industry with full potential. Blockchain Technology will be very useful for the baking industry, as it will reduce the cost and increase the ef ciency. The companies are constantly looking for the ways to apply Blockchain Technology in the banking and finance industry and various other industries or sectors as well. Every region of the world is giving their bit developing this Technology and are constantly working upon it to make it successful. Financial institutions and banks are showing their interest in this disruptive technology, big names like JP Morgan Chase have shown their faith and trust in the future of blockchain technology. It has started a new division named as Quorum division which is speci cally assigned for research and implementation of the Blockchain technology. This division is a distributed ledger and smart contract platform for the businesses that supports fast transactions and addresses the challenges in the nancial industry and banks. B. Possible Applications of Blockchain Technology in
Banking and Financial Services Following are the areas where blockchain technology holds the potential to bring about change and make them more ef cient:• Trade finance: Blockchain aims to disrupt the
old -fashioned paper -based business and systems. The focus is on reducing the cost and boosting the speed and obviously increasing the transparency of the international trade with digital accounts in the digital distributed ledger. The point here is, that, cross- border payments and nancing are based on the inef cient model, which has changed a little in these decades. The adoption of digital trade nance can be used to settle the payments or the letter of credit in only a few hours as compared with ten days in the old system. The delays in the updating and transferring of the bill of lading to con rm the ownership, the consignments siting in the ports leads to heavy penalties. But, blockchain will make the sellers get the payments faster and the frauds will be reduced hugely, and the back-of ce work for
drafting documents will witness a huge reduction in overheads.
• Payments: The blockchain technology -based payments platform will enable low processing cost, minimal manual work, speedy transaction and will save time. The cost of sending the payments will decrease with banks using the blockchain technology drastically. This will also eliminate the veri cation of the third parties relating to the bank transfers. Therefore, Blockchain can be used to make payments in real-time globally, with real time execution with complete transparency and fraud analysis and prevention and also reduced costs.
• Know Your Customer (KYC): The blockchain databases have an inbuilt system, which makes the data stored in them more trustworthy and secure. If the nancial services sector, implements blockchain for the KYC veri cation, they will be able to verify quickly from a reliable source. With the adoption of the Blockchain enabled KYC veri cation process, will store the veri cation information of the client done by any bank or institution will be accessible for all other trustworthy organisation or banks for their veri cation process. This will at a large scale reduce cost, time and increase ef ciency. And the duplication of efforts will be eliminated and the veri cation could be made in real time.
• Smart Contracts: Smart contracts provide a whole lot of bene ts. The rst one being, speed and accuracy, the smart contracts are digital and automated, so you need not spend time in the processing of paperwork and correcting the errors that are often made in the documents. The second one being, trust, smart contracts automatically executes the contracts on the acceptance of the prede ned set of rules and conditions, so it eliminates the chances of altering of information for personal bene ts. The third bene t being, security, blockchain transactions records are encrypted and this makes it very dif cult to hack and the information can neither be deleted or revised which makes it secure. The last one being, savings, smart contracts remove the need of intermediaries which saves time and money.
• Consortium Lending: With the involvement of the blockchain based system for consortium lending, it will ease the process and benefit the parties to the contract to easily facilitate the process. Blockchain technology holds the power to solve these current pains by providing solution. Since the original consortium lending or banking is a very time-consuming process, blockchain can provide
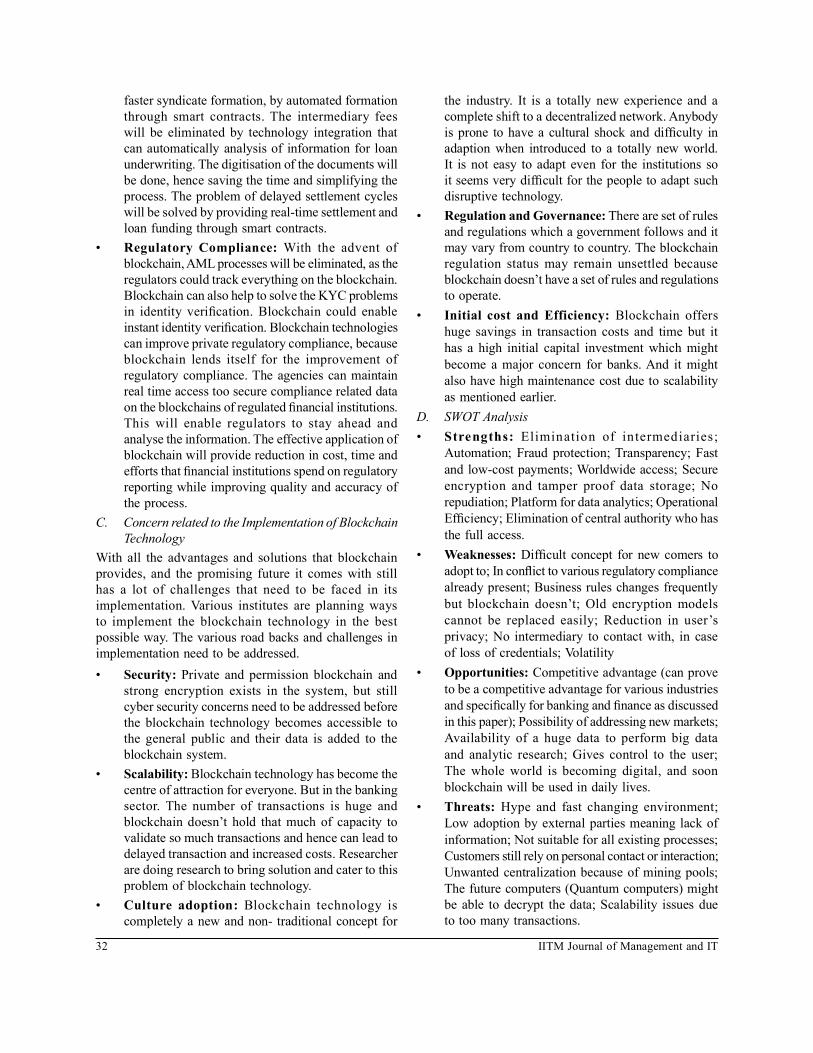
32 IITM Journal of Management and IT
faster syndicate formation, by automated formation through smart contracts. The intermediary fees will be eliminated by technology integration that can automatically analysis of information for loan underwriting. The digitisation of the documents will be done, hence saving the time and simplifying the process. The problem of delayed settlement cycles will be solved by providing real-time settlement and loan funding through smart contracts.
• Regulatory Compliance: With the advent of blockchain, AML processes will be eliminated, as the regulators could track everything on the blockchain. Blockchain can also help to solve the KYC problems in identity veri cation. Blockchain could enable instant identity veri cation. Blockchain technologies can improve private regulatory compliance, because blockchain lends itself for the improvement of regulatory compliance. The agencies can maintain real time access too secure compliance related data on the blockchains of regulated nancial institutions. This will enable regulators to stay ahead and analyse the information. The effective application of blockchain will provide reduction in cost, time and efforts that nancial institutions spend on regulatory reporting while improving quality and accuracy of the process.
C. Concern related to the Implementation of Blockchain Technology
With all the advantages and solutions that blockchain provides, and the promising future it comes with still has a lot of challenges that need to be faced in its implementation. Various institutes are planning ways to implement the blockchain technology in the best possible way. The various road backs and challenges in implementation need to be addressed.• Security: Private and permission blockchain and
strong encryption exists in the system, but still cyber security concerns need to be addressed before the blockchain technology becomes accessible to the general public and their data is added to the blockchain system.
• Scalability: Blockchain technology has become the centre of attraction for everyone. But in the banking sector. The number of transactions is huge and blockchain doesn’t hold that much of capacity to validate so much transactions and hence can lead to delayed transaction and increased costs. Researcher are doing research to bring solution and cater to this problem of blockchain technology.
• Culture adoption: Blockchain technology is completely a new and non- traditional concept for
the industry. It is a totally new experience and a complete shift to a decentralized network. Anybody is prone to have a cultural shock and dif culty in adaption when introduced to a totally new world. It is not easy to adapt even for the institutions so it seems very dif cult for the people to adapt such disruptive technology.
• Regulation and Governance: There are set of rules and regulations which a government follows and it may vary from country to country. The blockchain regulation status may remain unsettled because blockchain doesn’t have a set of rules and regulations to operate.
• Initial cost and Efficiency: Blockchain offers huge savings in transaction costs and time but it has a high initial capital investment which might become a major concern for banks. And it might also have high maintenance cost due to scalability as mentioned earlier.
D. SWOT Analysis • Strengths: Elimination of intermediaries;
Automation; Fraud protection; Transparency; Fast and low-cost payments; Worldwide access; Secure encryption and tamper proof data storage; No repudiation; Platform for data analytics; Operational Ef ciency; Elimination of central authority who has the full access.
• Weaknesses: Dif cult concept for new comers to adopt to; In con ict to various regulatory compliance already present; Business rules changes frequently but blockchain doesn’t; Old encryption models cannot be replaced easily; Reduction in user’s privacy; No intermediary to contact with, in case of loss of credentials; Volatility
• Opportunities: Competitive advantage (can prove to be a competitive advantage for various industries and speci cally for banking and nance as discussed in this paper); Possibility of addressing new markets; Availability of a huge data to perform big data and analytic research; Gives control to the user; The whole world is becoming digital, and soon blockchain will be used in daily lives.
• Threats: Hype and fast changing environment; Low adoption by external parties meaning lack of information; Not suitable for all existing processes; Customers still rely on personal contact or interaction; Unwanted centralization because of mining pools; The future computers (Quantum computers) might be able to decrypt the data; Scalability issues due to too many transactions.
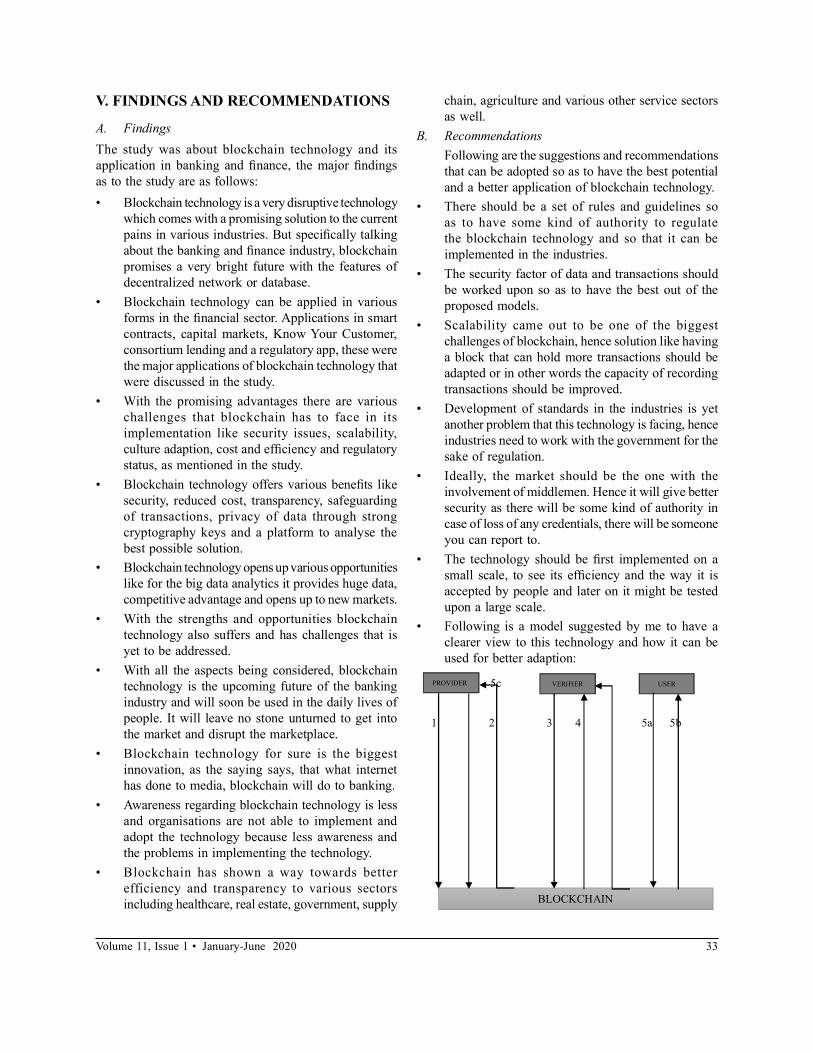
33Volume 11, Issue 1 • January-June 2020
V. FINDINGS AND RECOMMENDATIONS
A. FindingsThe study was about blockchain technology and its application in banking and nance, the major ndings as to the study are as follows:• Blockchain technology is a very disruptive technology
which comes with a promising solution to the current pains in various industries. But speci cally talking about the banking and nance industry, blockchain promises a very bright future with the features of decentralized network or database.
• Blockchain technology can be applied in various forms in the nancial sector. Applications in smart contracts, capital markets, Know Your Customer, consortium lending and a regulatory app, these were the major applications of blockchain technology that were discussed in the study.
• With the promising advantages there are various challenges that blockchain has to face in its implementation like security issues, scalability, culture adaption, cost and ef ciency and regulatory status, as mentioned in the study.
• Blockchain technology offers various bene ts like security, reduced cost, transparency, safeguarding of transactions, privacy of data through strong cryptography keys and a platform to analyse the best possible solution.
• Blockchain technology opens up various opportunities like for the big data analytics it provides huge data, competitive advantage and opens up to new markets.
• With the strengths and opportunities blockchain technology also suffers and has challenges that is yet to be addressed.
• With all the aspects being considered, blockchain technology is the upcoming future of the banking industry and will soon be used in the daily lives of people. It will leave no stone unturned to get into the market and disrupt the marketplace.
• Blockchain technology for sure is the biggest innovation, as the saying says, that what internet has done to media, blockchain will do to banking.
• Awareness regarding blockchain technology is less and organisations are not able to implement and adopt the technology because less awareness and the problems in implementing the technology.
• Blockchain has shown a way towards better efficiency and transparency to various sectors including healthcare, real estate, government, supply
chain, agriculture and various other service sectors as well.
B. Recommendations Following are the suggestions and recommendations
that can be adopted so as to have the best potential and a better application of blockchain technology.
• There should be a set of rules and guidelines so as to have some kind of authority to regulate the blockchain technology and so that it can be implemented in the industries.
• The security factor of data and transactions should be worked upon so as to have the best out of the proposed models.
• Scalability came out to be one of the biggest challenges of blockchain, hence solution like having a block that can hold more transactions should be adapted or in other words the capacity of recording transactions should be improved.
• Development of standards in the industries is yet another problem that this technology is facing, hence industries need to work with the government for the sake of regulation.
• Ideally, the market should be the one with the involvement of middlemen. Hence it will give better security as there will be some kind of authority in case of loss of any credentials, there will be someone you can report to.
• The technology should be rst implemented on a small scale, to see its ef ciency and the way it is accepted by people and later on it might be tested upon a large scale.
• Following is a model suggested by me to have a clearer view to this technology and how it can be used for better adaption:
5c
1 2 3 4 5a 5b
VERIFIER PROVIDER USER
BLOCKCHAIN

34 IITM Journal of Management and IT
Explanation of the Proposed Model:The following operations are executed in sequence in the main ow of the example scenario: 1. The data provider creates project information and
its project attributes. Then he/she inserts created project information into project information pool.
2. The data provider grants access rights for the project information via project attributes.
3. The verification request is made to inform the veri ers.
4. a. The veri er checks whether project information is proper and veri es it. Veri cation result determines the value of the project information rating. b. The veri er receives tokens when the veri cation
process is completed. 5. a. The data user queries project information pool
with respect to certain criteria to obtain the project information data set that he/she want to use. Project information that the data user has access rights is displayed. b. The data user pays tokens for using project
information. c. Token payment is made to the owners of project
information used by the data user.Data Provider: The data provider can insert project information to project information pool and manages access controls of already inserted project information. Access controls are managed by associating data users (or user groups to be de ned) with project attributes that the data provider wants to grant access to. By this way, project information sharing is enabled per allowed attribute. Only the data provider owning project information is authorized to manage access controls. The data provider receives tokens in return for project information used by the data user. If the data provider does not give access right to anyone, he/she cannot earn tokens. Yet the data provider can access and use his/her own private project information. Veri er: When the data provider adds project information, a number of data providers who have similar project attributes are assigned as veri ers. Similarity decision can be made by using project attributes like project type such as embedded system and project size measures such as functional size. Veri ers are selected from data providers who have been granted access to project information. Therefore, the veri cation cannot be done if the data provider does not give access to any other data provider. The reliability rating of inserted project information is determined according to the verification results. The
value of rating which is veri ed by more veri ers will be higher. This value indicates the reliability of project information for data users. The veri er wins tokens after completing the verification process. Data User: The data user makes queries in project information pool and uses project information that is granted access by data providers. Access to project information will be allowed on the project attribute basis. The data user pays tokens in exchange for using project information. The data user can evaluate the reliability of a project information according to its rating value. The project information which has higher rating value is more reliable because it is veri ed by more veri ers.The scenario described above can be realized by developing a software application that will use the underlying blockchain technology. Smart contracts can be implemented for the data store and access control mechanism. This can overall improve ef ciency and can increase transparency and authenticity. This blockchain-based software project information sharing is to encourage stakeholders for sharing and using project information by defining an access control mechanism. In order to make stored project information more reliable, an incentive mechanism that bene ts all roles is employed. The features of blockchain technology make the model more secure and reliable. This infrastructure will not be speci c to project information, and it can be adapted for other kind of information sharing and storage problems. This work can be bene cial for companies that need to make estimations with software project data and for organizations, which want to make comparisons with software project information, like research centers, technology transfer of ces etc. The blockchain technology to be used for a system using this model is a critical decision. The basic requirement of the model, i.e., the restricted access control, implies that private blockchains with more features in this respect are more suitable than public blockchains
VI. CONCLUSION
Blockchain technology has evolved in the last twenty years from just a database to a full- edged globally distributed cloud computing platform. Although blockchain was initiated to serve as an infrastructure for cryptocurrencies, it has invaluable potential uses in many industries like nancial services, property registries, medical records, and government services.Although the potential of Blockchain is widely claimed to be at par with early commercial Internet, banking rms needs to understand the key features of the technology and how it can solve the current business issues as on

35Volume 11, Issue 1 • January-June 2020
one hand, internet enabled exchange of data while on other, the Blockchain can involve exchange of value. Banks need to identify opportunities, determine feasibility and impact, and test proof of concepts. However, the questions around regulations will have to be resolved through focused discussions with competent regulatory authorities and incorporation of their thought-process.Through this study, I would like to conclude that there are various possible applications of blockchain technology and these applications like payments, smart contracts etc which can be adopted and increase transparency, security and ef ciency in transaction. The other part of the study discussed different challenges that the industry might face in implementing the technology and the concerns regarding it. Later the study moved towards the opportunities and challenges that blockchain has in its way and how it will disrupt the whole marketplace.
REFERENCES[1] Stefan K. Johansen (2016, November). A comprehensive
literature review on the Blockchain as a technological enabler for innovation
[2] Tejal Shah & Shailak Jani (2018, July). Applications of Blockchain Technology in Banking & Finance
[3] Thomas Kitsantas (2019, July). A review of Blockchain Technology and its application in the business environment
[4] Soonduck Yoo (2017, December). Blockchain based nancial case analysis and its impications
[5] Dr. Eric G. Krause & Denny Nack (2018, September). Blockchain technology and the nancial services market
[6] Stefan Seebacher and Ronny Schuritz (2017, April). Blockchain technology as an enabler of services systems: A structured literature review
[7] Magnus Vitsø, Bjørnstad Joar Gunnarsjaa Harkestad & Simen Krogh (2017, June). A study on blockchain technology as a resource for competitive advantage
[8] Dr. Gareth R.T White (2016, October). Future applications of Blockchain: Toward a value based society.
[9] Michael Crosby, Nachiappan, Pradhan Patnayak, Sanjeev Verma & Vignesh Kalyan Raman (2015, October). Blockchain technology beyond Bitcoin
[10] Lawrence J. Trautman (2017, May). Is Disruptive Blockchain Technology the future of Financial services
[11] Zibin Zheng, Shaoan Xie, Hongning Dai, Xiangping Chen, and Huaimin Wang (2017, June). An Overview of Blockchain Technology: Architecture, Consensus, and Future Trends
[12] Jesse Yli-Huumo, Deokyoon Ko, Sujin Choi, Sooyong Park, and Kari Smolander (2016, October). Where Is Current Research on Blockchain Technology? - A Systematic Review
[13] Stepehen Lieble (2019, November).A Review on Blockchain Technology and Blockchain Projects Fostering Open Science
[14] Min Xu and Gang Kou (2019, July). A Systematic review of Blockchain
[15] Chanson (2019) Blockchain for the IoT: Privacy-Preserving Protection of Sensor Data
[16] Juho lindman (2019). Novel Uses, Opportunities and Challenges of Blockchain for Digital Services
[17] Bin Cao (2019, March). When Internet of Things Meets Blockchain: Challenges in Distributed Consensus
[18] Kim S. Hald ( 2019, March). How the blockchain enables and constrains supply chain performance
[19] Bhupendra Pratap Singh (2019, February). Secured decentralized archiving healthcare data using blockchain with IoT Jason Lin (2018). Comparative Analysis of Blockchain-based Smart Contracts for Solar ElectricityExchanges.

36 IITM Journal of Management and IT
Abstract—Software development is very slow process, expensive process & error prone usually resulting in the products with a huge number of problems which cause serious and major mistakes in usability, reliability, and performance. To overcome this problem, software measurement provides a systematically and empirical-guided approach to control and Improve software development process. However, due to high cost linked with “metrics collection” and the dif culties in “metrics decision-making,” measurement is not universally adopted by software organizations. However Software Project Telemetry is still one of the nest Solutions to this problem. The Conventional approach in software project telemetry is to use few automatic sensors to collect all metrics & further decision making is done based on them. But the main problem comes when it becomes very difficult to classify the collected metrics data & that’s why if we need trained intelligent sensor based software project telemetry, it is ideal to use arti cial neural network.Keywords—software project telemetry, metrics collection, metrics decision making, arti cial neural network
I. INTRODUCTION
Software Development is a slow process, hours of work is needed to frame any software .The process is expensive because it requires support resources & lot of efforts. Also this process is error prone because of the logic & problem solution writing is complex, while writing long codes it is natural to be mistaken. To overcome all these problems, and making software development quick and easy the computer itself needed to be smart. And the method should be opt by which one can guide the software development process, by giving direction, how mistakes not done and the code writing become quick also. For all this the whole software development process should be overlooked by a smart computer process. Now the point is how a computer process make smart-“if the computer can learn” ?
For a computer to become smart,You can either write a totally xed program for it – or you can also enable the computer to learn on its own. As we know the Living beings do not have any programmer writing a program for developing their own skills, which then only has to be executed de nitely. They learn by themselves – without having the previous knowledge from any external impressions – and thus they can solve problems better than any computers today. What qualities are needed to achieve such a brilliant behavior for devices like computers? Can such features be adapted from biology?
II. NEURAL NETWORKS
There are a lot of problem categories that cannot be solved as an algorithm. Problems those depend on many subtle factors, for example the purchase & sale price of a real estate which our brain can calculate approximately. Without an algorithm one computer cannot do the same. Therefore the question to be asked is de nitely: How do we learn to explore such kind of problems?Exactly – we learn; a capability today’s computers obviously do not have. Humans have a brain that can fairly learn. Computers have some processing units and memory. They together allow the computer to perform most complex numerical calculations in a short time, but they are not adaptive. If we compare computer and brain, we will note that, theoretically, the computer should be more powerful than our brain: It comprises 108 transistors with a switching time of 10−8 seconds. The brain contains 1012 neurons, but these only have a switching time of about 10−3 seconds. The largest part of the brain is working continuously, while the largest part of the computer is only passive data storage. Thus, the brain is parallel and therefore
Table 1.1: The ( awed) comparison between brain and computer at a glance
Brain Computer
No. Of Processing Units ≈ 1012 ≈ 108
Type of Processing Unit Neurons Transistors
Arti cial Neural Network in Developing Software Project Telemetry Metrics
Himanshu SharmaCS Department, Aligarh College Of Engineering & Technology, Aligarh, Uttrar Pradesh, India
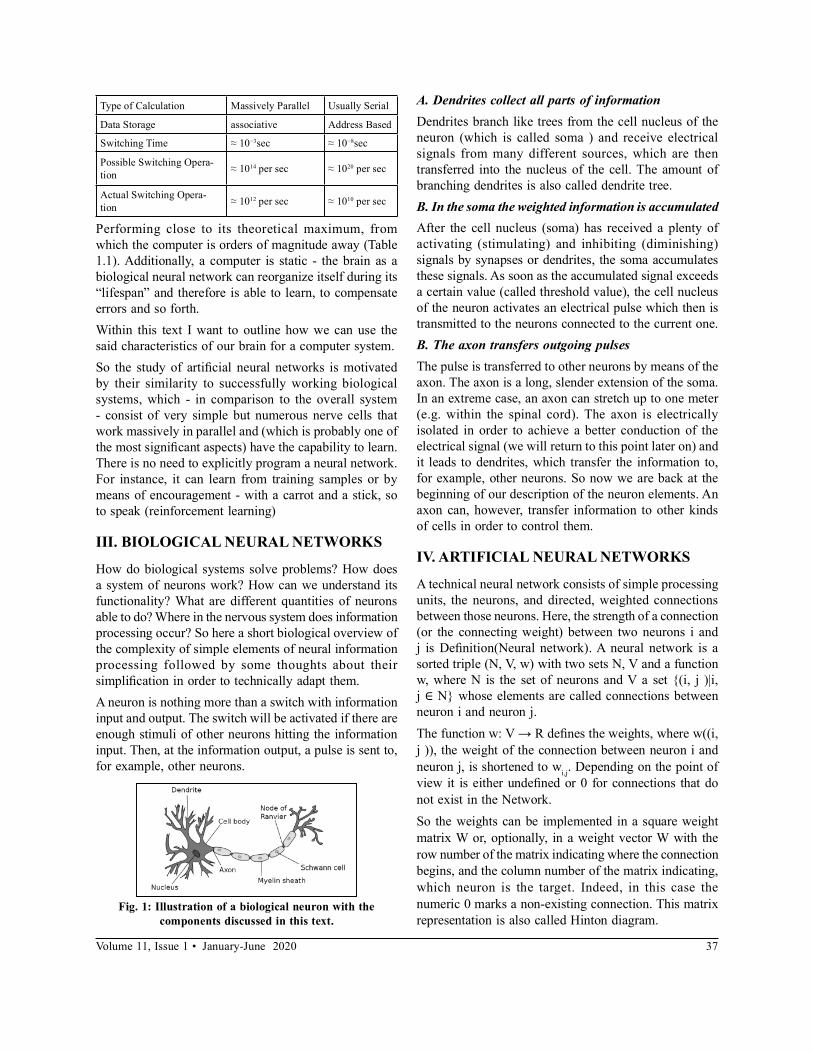
37Volume 11, Issue 1 • January-June 2020
Type of Calculation Massively Parallel Usually Serial
Data Storage associative Address Based
Switching Time ≈ 10−3sec ≈ 10−8sec
Possible Switching Opera-tion ≈ 1014 per sec ≈ 1020 per sec
Actual Switching Opera-tion ≈ 1012 per sec ≈ 1010 per sec
Performing close to its theoretical maximum, from which the computer is orders of magnitude away (Table 1.1). Additionally, a computer is static - the brain as a biological neural network can reorganize itself during its “lifespan” and therefore is able to learn, to compensate errors and so forth.Within this text I want to outline how we can use the said characteristics of our brain for a computer system.So the study of arti cial neural networks is motivated by their similarity to successfully working biological systems, which - in comparison to the overall system - consist of very simple but numerous nerve cells that work massively in parallel and (which is probably one of the most signi cant aspects) have the capability to learn. There is no need to explicitly program a neural network. For instance, it can learn from training samples or by means of encouragement - with a carrot and a stick, so to speak (reinforcement learning)
III. BIOLOGICAL NEURAL NETWORKS
How do biological systems solve problems? How does a system of neurons work? How can we understand its functionality? What are different quantities of neurons able to do? Where in the nervous system does information processing occur? So here a short biological overview of the complexity of simple elements of neural information processing followed by some thoughts about their simpli cation in order to technically adapt them.A neuron is nothing more than a switch with information input and output. The switch will be activated if there are enough stimuli of other neurons hitting the information input. Then, at the information output, a pulse is sent to, for example, other neurons.
Fig. 1: Illustration of a biological neuron with the components discussed in this text.
A. Dendrites collect all parts of informationDendrites branch like trees from the cell nucleus of the neuron (which is called soma ) and receive electrical signals from many different sources, which are then transferred into the nucleus of the cell. The amount of branching dendrites is also called dendrite tree.B. In the soma the weighted information is accumulatedAfter the cell nucleus (soma) has received a plenty of activating (stimulating) and inhibiting (diminishing) signals by synapses or dendrites, the soma accumulates these signals. As soon as the accumulated signal exceeds a certain value (called threshold value), the cell nucleus of the neuron activates an electrical pulse which then is transmitted to the neurons connected to the current one.B. The axon transfers outgoing pulsesThe pulse is transferred to other neurons by means of the axon. The axon is a long, slender extension of the soma. In an extreme case, an axon can stretch up to one meter (e.g. within the spinal cord). The axon is electrically isolated in order to achieve a better conduction of the electrical signal (we will return to this point later on) and it leads to dendrites, which transfer the information to, for example, other neurons. So now we are back at the beginning of our description of the neuron elements. An axon can, however, transfer information to other kinds of cells in order to control them.
IV. ARTIFICIAL NEURAL NETWORKS
A technical neural network consists of simple processing units, the neurons, and directed, weighted connections between those neurons. Here, the strength of a connection (or the connecting weight) between two neurons i and j is De nition(Neural network). A neural network is a sorted triple (N, V, w) with two sets N, V and a function w, where N is the set of neurons and V a set {(i, j )|i, j ∈ N} whose elements are called connections between neuron i and neuron j. The function w: V → R de nes the weights, where w((i, j )), the weight of the connection between neuron i and neuron j, is shortened to wi,j. Depending on the point of view it is either unde ned or 0 for connections that do not exist in the Network.So the weights can be implemented in a square weight matrix W or, optionally, in a weight vector W with the row number of the matrix indicating where the connection begins, and the column number of the matrix indicating, which neuron is the target. Indeed, in this case the numeric 0 marks a non-existing connection. This matrix representation is also called Hinton diagram.

38 IITM Journal of Management and IT
Fig. 2: Data processing of a neuron. The activation function of a neuron implies the threshold value.
A. Connections carries information that is processed by neurons
Data are transferred between neurons via connections with the connecting weight being either excitatory or inhibitory. The de nition of connections has already been included in the de nition of the neural network.B. The propagation function converts vector inputs to
scalar network inputsLooking at a neuron j, we will usually nd a lot of neurons with a connection to j, i.e. which transfer their output to j .For a neuron j the propagation function receives the outputs oi1, . . ., oin of other neurons i1, i2, . . ., in (which are connected to j ), and transforms them in consideration of the connecting weights wi,j into the network input netj that can be further processed by the activation function. Thus, the network input is the result of the propagation function.De nition (Propagation function and network input). Let I = {i1, i2, . . ., in} be the set of neurons, such that ∀z ∈ {1, . . ., n}: ∃wiz, j . Then the network input of j, called netj, is calculated by the propagation function f prop as follows: netj = fprop(oi1, . . .,oin,wi1,j, . . .,win,j) ------- (3.1)Here the weighted sum is very popular: The multiplication of the output of each neuron i by wi,j, and the summation of the results: netj = ∑i∈I ( oi* wi,j ) - -------- (3.2)C. The activation is the “switching status” of a neuronBased on the model of nature every neuron is, to a certain extent, at all times active, excited or whatever you will call it. The reactions of the neurons to the input values depend on this activation state. The activation state indicates the extent of a neuron’s activation and is often shortly
referred to as activation. Its formal de nition is included in the following de nition of the activation function. But generally, it can be de ned as follows:De nition (Activation state / activation in general). Let j be a neuron. The activation state aj, in short activation, is explicitly assigned to j, indicates the extent of the neuron’s activity and results from the activation function.D. Neurons get activated if the network input exceeds
their threshold valueNear the threshold value, the activation function of a neuron reacts particularly sensitive. From the biological point of view the threshold value represents the threshold at which a neuron starts ring. The threshold value is also mostly included in the de nition of the activation function, but generally the de nition is the following:De nition (Threshold value in general). Let j be a neuron. The threshold value Θj is uniquely assigned to j and marks the position of the maximum gradient value of the activation function.E. The activation function determines the activation of
a neuron dependent on network input and threshold value
At a certain time – as we have already learned – the activation aj of a neuron j depends on the previous activation state of the neuron and the external input.
De nition (Activation function and Activation). Let j be a neuron. The activation function is de ned as
aj(t) = fact( netj(t), aj (t − 1), Θj ) ……… (3.3)It transforms the network input netj, as well as the previous activation state aj(t − 1) into a new activation state aj(t), with the threshold value Θ playing an important role, as already mentioned.Unlike the other variables within the neural network (particularly unlike the ones de ned so far) the activation function is often de ned globally for all neurons or at least for a set of neurons and only the threshold values are different for each neuron. We should also keep in mind that the threshold values can be changed, for example by a learning procedure. So it can in particular become necessary to relate the threshold value to the time and to write, for instance Θj as Θj(t) (but for reasons of clarity, I omitted this here). The activation function is also called transfer function.F. An output function may be used to process the
activation once again The output function of a neuron j calculates the values which are transferred to the other neurons connected to j. More formally:

39Volume 11, Issue 1 • January-June 2020
Definition (Output function). Let j be a neuron. The output function fout(aj ) = Oj -------- (3.4)calculates the output value Oj of the neuron j from its activation state aj.Generally, the output function is de ned globally, too. Often this function is the identity, i.e. the activation aj is directly output: fout(aj ) = aj, so Oj= aj -------- (3.5)Unless explicitly speci ed differently, we will use the identity as output function within this text. G. Learning strategies adjust a network to t our needsSince we will address this subject later in detail and at rst want to get to know the principles of neural network structures, I will only provide a brief and general de nitionhere:De nition(General learning rule). The learning strategy is an algorithm that can be used to change and thereby train the neural network, so that the network produces a desired output for a given input.
V. SOFTWARE PROJECT TELEMETRY
Software Project Telemetry is a project management technique that uses software sensors to collect metrics automatically and unobtrusively. It then employs a domain-speci c language to represent telemetry trends in software product and process metrics. Project management and process improvement decisions are made by detecting changes in telemetry trends and comparing trends between different periods of the same project. Software project telemetry avoids many problems inherent in traditional metrics models, such as the need to accumulate a historical project database and ensure that the historical data remains comparable to current and future projects. It addresses the “metrics collection cost problem” through highly automated measurement machinery: software sensors are written to collect metrics automatically and unobtrusively. It addresses the “metrics decision-making problem” through a domain-speci c language designed for the representation of telemetry trends for different aspects of software development process.
VI. METRICS COLLECTION
The metrics collection is the core thing by which we can overlook and guide the software development process. Through this metric collection all the patterns of the mistakes in the software development that are usually done by code writers are identi ed and suggested to
make correct. Now there are two methods by which these metrics are collected. A. Sensor-based Data CollectionIn software project telemetry, metrics are collected automatically by sensors that unobtrusively monitor some form of state in the project development environment. Sensors are pieces of software collecting both process and product metrics.Software process metrics are the metrics that assist in monitoring and controlling the way software is produced. Sensors collecting process metrics are typically implemented in the form of plug-ins, which are attached to software development tools in order to continuously monitor and record their activities in the background. Some examples are listed below:• A plug-in for an IDE (integrated development
environment) such as Visual Studio, and Eclipse. It can record individual developer activities automatically and transparently, such as code editing effort, compilation attempts, and results, etc
• A plug-in for a version control system, such as Clear Case, CVS, and SVN. It can monitor code check-in and check-out activities, and compute diff information between different revisions.
• A plug-in for a bug tracking or issue management system, such as Bugzilla, and Jira. Whenever an issue is reported or its status is updated, the sensor can detect such activities and record the relevant information.
• A plug-in for an automated build system, such as Cruise Control. It can capture information related to build attempts and build results.
Software product metrics are the metrics that describe the properties of the software itself. Sensors collecting product metrics are typically implemented as analyzers for software artifacts. These analyzers usually need to be scheduled to run periodically in order to acquire the continual ow of metrics required by telemetry streams. To automate these tasks, one can use a Schedule tasker job, or run them as tasks in automated build system. Some examples are listed below:• An analyzer that parses program source code to
compute size or complexity information.• An analyzer that parses the output of existing tools,
such as Clover, and JBlanket, and converts them to a data format that can be used by software project telemetry.
There are many other possibilities. One can even imagine an exotic sensor that retrieves project cost and payroll information from a company’s accounting database, if
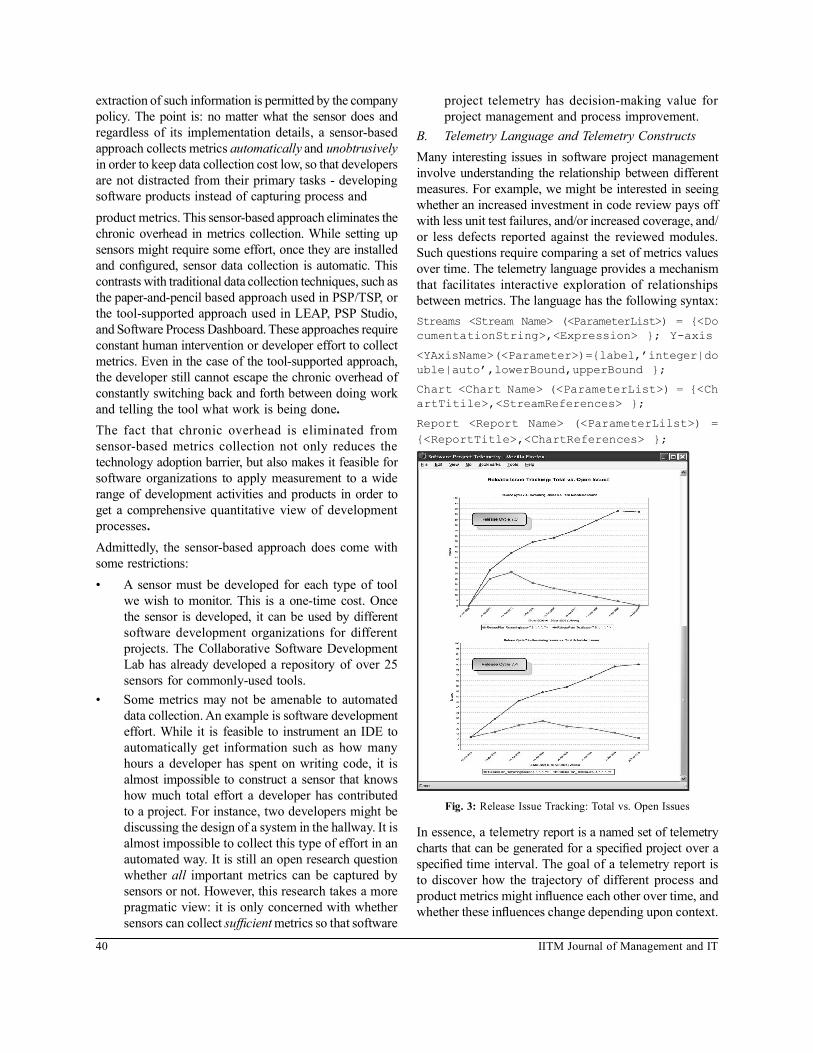
40 IITM Journal of Management and IT
extraction of such information is permitted by the company policy. The point is: no matter what the sensor does and regardless of its implementation details, a sensor-based approach collects metrics automatically and unobtrusively in order to keep data collection cost low, so that developers are not distracted from their primary tasks - developing software products instead of capturing process and product metrics. This sensor-based approach eliminates the chronic overhead in metrics collection. While setting up sensors might require some effort, once they are installed and con gured, sensor data collection is automatic. This contrasts with traditional data collection techniques, such as the paper-and-pencil based approach used in PSP/TSP, or the tool-supported approach used in LEAP, PSP Studio, and Software Process Dashboard. These approaches require constant human intervention or developer effort to collect metrics. Even in the case of the tool-supported approach, the developer still cannot escape the chronic overhead of constantly switching back and forth between doing work and telling the tool what work is being done.The fact that chronic overhead is eliminated from sensor-based metrics collection not only reduces the technology adoption barrier, but also makes it feasible for software organizations to apply measurement to a wide range of development activities and products in order to get a comprehensive quantitative view of development processes.Admittedly, the sensor-based approach does come with some restrictions:• A sensor must be developed for each type of tool
we wish to monitor. This is a one-time cost. Once the sensor is developed, it can be used by different software development organizations for different projects. The Collaborative Software Development Lab has already developed a repository of over 25 sensors for commonly-used tools.
• Some metrics may not be amenable to automated data collection. An example is software development effort. While it is feasible to instrument an IDE to automatically get information such as how many hours a developer has spent on writing code, it is almost impossible to construct a sensor that knows how much total effort a developer has contributed to a project. For instance, two developers might be discussing the design of a system in the hallway. It is almost impossible to collect this type of effort in an automated way. It is still an open research question whether all important metrics can be captured by sensors or not. However, this research takes a more pragmatic view: it is only concerned with whether sensors can collect suf cient metrics so that software
project telemetry has decision-making value for project management and process improvement.
B. Telemetry Language and Telemetry ConstructsMany interesting issues in software project management involve understanding the relationship between different measures. For example, we might be interested in seeing whether an increased investment in code review pays off with less unit test failures, and/or increased coverage, and/or less defects reported against the reviewed modules. Such questions require comparing a set of metrics values over time. The telemetry language provides a mechanism that facilitates interactive exploration of relationships between metrics. The language has the following syntax:Streams <Stream Name> (<ParameterList>) = {<DocumentationString>,<Expression> }; Y-axis
<YAxisName>(<Parameter>)={label,’integer|double|auto’,lowerBound,upperBound };
Chart <Chart Name> (<ParameterList>) = {<ChartTitile>,<StreamReferences> };
Report <Report Name> (<ParameterLilst>) = {<ReportTitle>,<ChartReferences> };
Fig. 3: Release Issue Tracking: Total vs. Open Issues
In essence, a telemetry report is a named set of telemetry charts that can be generated for a speci ed project over a speci ed time interval. The goal of a telemetry report is to discover how the trajectory of different process and product metrics might in uence each other over time, and whether these in uences change depending upon context.

41Volume 11, Issue 1 • January-June 2020
A telemetry chart is a named set of telemetry streams. The goal of a telemetry chart is to display the trajectory of one or more process or product metrics over time.
Fig. 4: Telemetry Report Analysis
The y-axis construct is used to specify the vertical axis of a telemetry chart. Note, however, that a telemetry chart de nition does not include the information about its horizontal axis, because such information can be automatically inferred from the time interval over which the telemetry analysis is performed. A telemetry stream is a sequence of a single type of software process or product metrics.
VII. CONCLUSIONS
So how arti cial neural network contributes in software project telemetry As we discussed previously the approaches in this eld of software project telemetry are
Sensory based data collection & Language constructs. Both of these approaches are limited because of the lacking of learning factor that’s why use of arti cial neural network can suf ciently improve the required results.The Purpose of this study is to improve software development process; The method is Software Project Telemetry which is only based on metrics approach & has two main approaches Sensory based data collection or Language constructs but both approaches lacks in learning metrics for collection & decision making. That’s why there is a scope of using Arti cial Neural Networks, as Arti cial Neural Network can help in developing these metrics & metrics decision making well.( g. 1)The Software Project Telemetry is an emerging eld of computer science and there is a lot of possibility of renowned researches in this, as Arti cial Neural Network is one of the best approach to apply intelligence in any software that’s why these two elds are the focus of attraction for the future researchers.
ACKNOWLEDGMENT
I like to express our special thanks and gratitude to Dr.Anand Sharma, HOD, CS Department, Aligarh College of Engineering & Technology, Aligarh,(Uttar Pradesh) to inspire me to write Some Work. Also I like to Thank Dr.Vinod Sharma, Director, Aligarh College of Engineering & Technology, Aligarh,(Uttar Pradesh) to provide us Platform where we can grow in this fast paced professional environment with limited abilities.
REFERENCES[1] Dav id Kriesel, “A brief introduction to: Neural Networks, (2005)[2] Philip Johnson, Qin Zhang-Improving software development
process & project management with software project telemetry (2005)
[3] Dr. Qadri Hamarsheh -Neural Networks & Fuzzy Logic[4] Kenji Suzuki, Artificial Neural Networks-Methodological
Advances & Biomedical Applications (2011) [5] Hristev, R. M. “The ANN Book”,Edition-1,(1998)

42 IITM Journal of Management and IT
Abstract—In this paper we discuss about what is arti cial intelligence? Awareness is only marginally relevant to arti cial intelligence (AI), because to most researchers in the eld other problem seem more pressing. However, there have been proposals for how awareness would be accounted for in a complete computational theory of mind. Arti cial intelligence is also science of automating intelligence behaviors currently achievable by humans. There is a large amount of subjectivity in what exactly constitutes arti cial intelligence. And the power system has grown tremendously over a few decades, as the size and complexity of the power system consisting of generations, transmission line, and distribution transformation etc. increase the possibility of inviting faults. In the future, intelligent machines will replace or enhance human capabilities in many areas. Arti cial intelligence exhibited by machine or software. It is the sub eld of computer science. Application areas of arti cial intelligence is having a huge impact on various eld of life as expert system is widely used these days to solve the complex problem in various areas as science, engineering, weather forecasting. It will consider the areas employing the technology of arti cial intelligence. This paper will brie y discus some of the technology and the application areas. Keywords—Introduction, Neural network (computer), Fuzzy logic, Evaluating process, Conclusion.
I. INTRODUCTION
Arti cial intelligence (AI) is the ability of a computer program or a machine to think and learn. It is also a eld of study which tries to make computers smart. John McCarthy came up with the name arti cial intelligence in 1955. In general use, the term arti cial intelligence means a machine which mimics human cognition. At least some of the things we associate with other minds, such as learning and problem solving can be done by computers, though not in the same way as we do. An ideal (perfect) intelligent machine is a exible agent which perceives its environment and takes actions to maximize its chance of success at some goal. As machines become increasingly capable, mental facilities once thought to
require intelligence are removed from the de nition. For example, optical character recognition is no longer perceived as an exemplar of arti cial intelligence. It is just a routine technology. At present we use the term AI for successfully understanding human speech, competing at a high level in strategic game systems (such as Chess and Go), self-driving cars, and interpreting complex data. Some people also consider AI a danger to humanity if it progresses unabatedly. An extreme goal of AI research is to create computer programs that can learn, solve problems, and think logically. In practice, however, most applications have picked on problems which computers can do well. Searching data bases and doing calculations are things computers do better than people. On the other hand, perceiving its environment in any real sense is way beyond present-day computing. AI involves many different fields like computer science, mathematics, linguistics, psychology, neuroscience, and philosophy. Eventually researchers hope to create a general arti cial intelligence which can solve many problems instead of focusing on just one. Researchers are also trying to create creative and emotional AI which can possibly empathize or create art. Many approaches and tools have been tried.[1]
II. ARTIFICIAL INTELLIGENCE
Artificial intelligence (AI) is that computers simply mimic behaviors of humans that would be regarded as intelligent if a human being did them. However, within this de nition, several issues and views still con ict because of ways of interpreting the results of AI programs by scientists and critics. The most common and natural approach to AI research is to ask of any program, what can it do? What are the actual results in comparison to human intelligence? For example, what matters about a chess-playing program is how good it is. Can it possibly beat chess grand masters? There is also a more structured approach in assessing arti cial intelligence, which began opening the door of the arti cial intelligence contribution into the science world. According to this theoretical approach, what matters is not the input-output relations of the computer, but also what the program can tell us
Arti cial Intelligence and TechniquesManu Shree
Assistant professor (IT), School of Law, Chandraprabhu Jain College of Higer Studies, New [email protected]

43Volume 11, Issue 1 • January-June 2020
about actual human cognition. [2] Arti cial intelligence is the study and developments of intelligent machines and software that can reason, learn, gather knowledge, communicate, manipulate and perceive the objects. John McCarthy coined the term in 1956 as branch of computer science concerned with making computers behave like humans. It is the study of the computation that makes it possible to perceive reason and act. Arti cial intelligence is different from psychology because it emphasis on computation and is different from computer science because of its emphasis on perception, reasoning and action. It makes machines smarter and more useful. [3]
III. NEURAL NETWORK
Arti cial Neural Networks are relatively crude electronic models based on the neural structure of the brain. The brain basically learns from experience. It is natural proof that some problems that are beyond the scope of current computers are indeed solvable by small energy ef cient packages. This brain modeling also promises a less technical way to develop machine solutions. This new approach to computing also provides a more graceful degradation during system overload than its more traditional counterparts. These biologically inspired methods of computing are thought to be the next major advancement in the computing industry. Even simple animal brains are capable of functions that are currently impossible for computers. Computers do rote things well, like keeping ledgers or performing complex math. But computers have trouble recognizing even simple patterns much less generalizing those patterns of the past into actions of the future. Now, advances in biological research promise an initial understanding of the natural thinking mechanism. This research shows that brains store information as patterns. Some of these patterns are very complicated and allow us the ability to recognize individual faces from many different angles. This process of storing information as patterns, utilizing those patterns, and then solving problems encompasses a new eld in computing. This eld, as mentioned before, does not utilize traditional programming but involves the creation of massively parallel networks and the training of those networks to solve speci c problems. This eld also utilizes words very different from traditional computing, words like behave, react, self organize, learn, generalize, and forget. Whenever we talk about a neural network, we should more popularly say Arti cial Neural Network (ANN). ANN are computers whose architecture is modeled after the brain. They typically consist of hundreds of simple processing units which are wired together in a complex communication network. Each unit or node is
a simpli ed model of real neuron which sends off a new signal or res if it receives a suf ciently strong Input signal from the other nodes to which it is connected. Traditionally neural network was used to refer as network or circuit of biological neurons, but modern usage of the term often refers to ANN. ANN is mathematical model or computational model, an information processing paradigm i.e. inspired by the way biological nervous system, such as brain information system. ANN is made up of interconnecting arti cial neurons which are programmed like to mimic the properties of m biological neurons. These neurons working in unison to solve speci c problems. ANN is con gured for solving arti cial intelligence problems without creating a model of real biological system. ANN is used for speech recognition, image analysis, adaptive control etc. [4]
Fig. 1: A simple neural network diagram.
IV. FUZZY LOGIC
Fuzzy Logic (FL) in PSS (Power system stabilizer): In 1964, Lot Zadeh developed FL to address inaccuracy and uncertainty which usually exist in engineering problems [10]. A design process for a fuzzy logic based PSS (FLPSS) was proposed for a multi-machine power system. The input signal to FLPSS is the speed deviation of the synchronous generator and its derivative. For the robustness of the FLPSS, ve generator power systems were used and for designing a normalized sum-squared deviation index were used. This A novel input signal based FLPSS was applied in the multi-machine environment. [5] In mathematics, fuzzy sets are sets whose elements have degrees of membership. Fuzzy sets were introduced by Lot A. Zadeh and Dieter Klaua in 1965 as an extension of the classical notion of set. ... In fuzzy set theory, classical bivalent sets are usually called crisp sets.[6]

44 IITM Journal of Management and IT
Fig. 2: Bivalent sets of to characterize the temp. of a room
A fuzzy set operation is an operation on fuzzy sets. These operations are generalization of crisp set operations. ... The most widely used operations are called standard fuzzy set operations. There are three operations: fuzzy complements, fuzzyintersections, and fuzzy unions.
Fig.3: Union set and Intersection set
V. ADVANTAGE OF AI
• It can help improve our way of life.• Machines will be able to do jobs that require detailed
instructions.• There will be less injuries and stress to human beings.• Many of our health problems now have possible
solutions with the use of Arti cial Intelligence in studies at universities.
VI. DISADVANTAGE OF AI
• Limited Ability.• Slow Real Time Response.• Can’t Handle Emergency Situation.
VII. REFERENCES[1] http://www.123helpme.com/view.asp?id=46156 [2] https://en.wikipedia.org/wiki/Arti cial_intelligence[3] h t t p : / / w w w . i j e i t . c o m / Vo l % 2 0 4 / I s s u e % 2 0 1 0 /
IJEIT1412201504_15.pdf[4] http://www.ijritcc.org/download/Research%20Paper%20on%20
Basic%20of%20Arti cial%20Neural%20Network.pdf[5] h t t p : / / w w w . i j e i t . c o m / Vo l % 2 0 4 / I s s u e % 2 0 1 0 /
IJEIT1412201504_15.pdf[6] https://en.wikipedia.org/wiki/Fuzzy_set

45Volume 11, Issue 1 • January-June 2020
Abstract—This research study examines the factors that in uence adoption of ICT in an organisation that regulates tertiary education in Nigeria based on UTAUT model. Loading factor and Kaiser-Meyer-Olkin (KMO) were used to validate the model. The results of the study show that social factors have positive signi cant impact on the intention to adopt ICT. The study foun d that organisational, economic and individual factors are not statistically signi cant with intention to adopt ICT. This suggests that public organisations should encourage use of social networks to perform their mandates and encourage employees to interact freely to enhance their skills.Keywords—Perceived usefulness, virtual networking; innovativeness, adoption, incentives, productivity
I. INTRODUCTION
Information and Communication Technology (ICT) is an indispensable tool in the twenty rst century that is driving economic and social transformations leading the world to a digital society.ICT is a pervasive technology with wide spread applications, growing potentials and global impact. It has contributed immensely to enhance the capabilities of individuals and performance of organisations to achieve their goals. The future success or failure of organisations will continue to depend on whether they adopt ICTs or not. According to the World Bank, ICT is de ned as “the set of activities which facilitate by electronic means, the processing, transmission and display of information” [1]. It invariably denotes the wide range of technologies that support sharing, distribution, communication and retrieval of information through computers and internetworking of computers (Internet).The combined usage of computers, smart devices and Internet has led to availability of unprecedented services to individuals, enterprises, corporations and Governments all over the world in almost all areas of human endeavours [2].
ICT adoption is reshaping, reorganising and restructuring work methods, business models and organisations. ICT adoption has been found to be instrumental to the integration of markets across different borders and increase the market size of international rms at little or no cost. It augments research and development endeavours in institutions and organisations at reduced cost and with more accurate outputs. ICT adoption is facilitating the development of different business platforms such as micro-manufacturing, innovation marketplace, e-commerce, online marketing and digital utilities are emerging to enable entrepreneurs to start their enterprises easily. These digital platforms are being used not only to match consumers with goods but increasingly to match employees with jobs. In order for private and public organisations to achieve their goals, meet the preferences of their customers, provide excellent services and innovative products, and expand their operations in line with the global best practices, there is a need for adequate adoption and diffusion of ICT within these organisations [2]-[4], [10]. Despite this aforementioned importance of ICT adoption by individuals and organisations, many of the developing countries are still having challenges of adopting and using ICT effectively to transform their socio-economic conditions of their countries. The Global Information Technology Report that rates ICT development globally using the Networked Readiness Index (NRI), ranked Nigeria as 119th among 139 countries investigated in 2016 [5].The data shows that Nigeria is not among the rst 50 nations in the world that is leveraging ICTs for increased competitiveness and national prosperity. The Global IT report further shows that there is a low level of readiness to harness the huge bene ts of ICTs and seize the opportunities that comes along with digital
Information and Communication Technology Adoption: A Case study of Nigerian Tertiary Education
Regulatory AgencyOladipupo Bello1, Yskandar Hamam2
1National Board for Technical Education, Kaduna, [email protected]
2Tshwane University of Technology, Pretoria, South [email protected]

46 IITM Journal of Management and IT
transformation. Nigeria is thus far behind among ICT developed countries. Based on the current status of ICT development in Nigeria, it is desirable that a study be carried out to identify the factors that in uence the adoption and subsequently the usage of ICT innovations in Nigeria with special focus on public organisations. Currently, not every public organisation is adopting and using ICT to perform their statutory functions. This often leads to delay in completion of assignments, poor quality of job, inef cient service delivery, job dissatisfaction and loss of productivity. It is thus imperative to investigate the factors responsible for the adoption of ICT innovations in organisations, examine the contributions of each factor on ICT adoption and indirectly on organisational productivity.Despite the motivations provided by Governments and practitioners to public organisations to adopt ICT innovation, very little research studies have been carried out to investigate the ICT adoption among government owned organisations in Africa. The in uencing factors of ICT adoption in the public organisations in Nigeria, has not been studied extensively. Majority of the studies in Nigeria have focussed on Small and Medium Scale Enterprises (SMEs). For instance, in a study based on interviews conducted by [6] among owner-managers, heads of IT departments or IT professionals, and some other staff in 25 SMEs in Lagos, showed that the key drivers for ICT adoption amongst SMEs in Nigeria are the need for competitive advantage, customers satisfaction, and need to save time and cost. Reference [7] examined how social augmented parameters impact the adoption of ICT by small scale agribusinesses operating in Ebonyi State. The study based on focus group research method revealed that active social networks and government supports are the factors that affect ICT adoption among the agribusiness proprietors.In [8], factors that affected the adoption of Information and Communication Technology in 17 industrial SMEs in different parts of Lagos State was carried out. Data collected using questionnaires and analyzed with logistic regression technique showed that ICT cost was the most potent factor in the adoption of ICT by SMEs in Nigeria. Availability of ICT infrastructure, Government and management supports are also important factors that determine the adoption of ICT by SMEs in Nigeria. Moreover, a study by [9] investigated how perceived usefulness, perceived ease of use, perceived cost of deploying ICT, owner, top management support and organizational readiness affect the use of ICT system amongst SMEs in Rivers State. Results obtained from the study revealed that perceived usefulness of ICT
and cost of deploying ICT are the determinants of ICT adoption by SMEs.In a related study, [12] assessed the determinants of ICT adoption for improved SMEs performance at Awka, Nnewi, Ekwolobia and Onitsha in Nigeria. The study concluded that capital base, turnover and asset values of businesses have signi cant in uence on ICT adoption. A study by [10] investigated the determinants of ICT adoption by Micro and Small Enterprises in the Federal Capital Territory, Abuja in Nigeria. The empirical study based on multiple regression analysis identi ed competitive pressure, Government support, employer’s skill and knowledge are the key factors that in uence the adoption of ICT by these enterprises. There is thus a limited or no research study that focuses on the factors that in uence or impede the adoption of ICT innovations in the Nigerian public organisations. It is therefore imperative to perform a study to ll this gap by extending the previous work by [12] based on UTAUT model. The following hypotheses are formulated for the study:H(1): Individual factors have no influence on ICT adoption.H(2): Organizational factors have no impact on ICT adoption.H(3): Social factors have no in uence on ICT adoption.H(4): Economic factors have no impact on ICT adoption.This research study is thus undertaken to ll the existing gap in the literature, that is, to investigate the factors that in uence adoption of ICT innovations in a tertiary education regulatory agency in Nigeria.
II. MATERIALS AND METHOD
A. Adoption of ICT innovations in the Nigerian Public Organisations
Public organisations are the backbone of policies and programmes implementation of the Government at the Federal or State level. In the Nigerian context, their main focus is to provide and serve as catalyst for affordable and quality service delivery to the general public. These essential services in the areas of oil and gas, power, public nance, agriculture, commerce and industry, education, defence, transportation, manufacturing, health, sport administration, communication, infrastructural and housing development among others are provided to improve the welfare and standard of living of the citizenry, and may be complemented by the private sector. In other instances, public organisations are established to regulate firms operating in a particular industry or sector of the economy.

47Volume 11, Issue 1 • January-June 2020
However, the effectiveness and ef ciency of public sector organisations in Nigeria and other developing countries are generally below average. It is marked with low quality and access, lack of fairness, justice and equity, discrimination, favouritism, absenteeism, lack of motivation, obsolete of ce equipment and operational vehicles, poor work environment, inadequate funding, poor maintenance culture, corrupt and unethical practices. Hence, there is a need to reform public sector organisations in order to improve their service to satisfy public needs, please people and rms as much as possible, favour good governance and national competitiveness [13].Typewriters, analogue landline telephones, televisions, facsimiles, radios, telegraphy, telex, Private Automated Branch Exchange were the rst set of electronic resources used in the Nigerian public organisations as far back as colonial era until the late 1980s when personal computers (PCs) became available in the Nigerian markets. Although, few mainframe computers existed in Nigeria before then, but their use were restricted to few universities, research institutes and military institutions in Nigeria. The introduction of PCs to perform word processing, desktop publishing, data processing, accounting and statistical analysis in the ministries, department and agencies (MDAs) in Nigeria marked the beginning of diffusion of ICT-based resources into the public organisations. Furthermore, motivation for ICT adoption in the Nigerian public organisations could also be traced to the introduction of Internet service to Nigeria in 1995 through the Regional Informatics Network for Africa (RINAF) project sponsored by the United Nations Educational Scientific and Cultural Organisations (UNESCO), licensing of Global System for Mobile Communications (GSM) operations in 2001, mandatory computer appreciation training workshops for the public service employees and massive award of contracts for ICT based resources in the last two decades in the public service. Subsequently, some MDAs has websites to establish their online presence and making their activities, reports and relevant information available to interested members of the public. B. Conceptual FrameworkThe conceptual framework for this study is based on previous study on SMEs by [12]. The study was based on UTAUT model. The motivational or in uencing factors for ICT adoption were grouped into three main factors: - Individual factors: These are made up of three
variables: Perceived usefulness, Experience; and Innovativeness.
- Organisational factors: These consist of three
variables: Training, Managerial support, and Incentives.
- Social factors: These consist of three variables: Virtual networking, Peers and Government’s role.
- The fourth factors that were added to the model, referred to as the economic factors. These consist of three variables: Income, Cost, and In ation.
The proposed research model for this study is shown in g. 1.1. Individual factors: Perceived usefulness is de ned
as “degree to which an individual considers that adopting particular technological innovation would improve his or her working performance” [14]. Experience refers to the number of years an individual has being using ICT-based resources or technological innovation. Personal innovativeness is de ned “as the willingness of an individual to learn and adopt any technological innovations” [15]. It relates to the positive attitudes of individuals toward adoption of technological innovation and usage [12].
2. Organisational factors: Training can be de ned as systematic activities to improve the knowledge, attitude, competency and skills of employees in an organisation. Management support is regarded as the conscious effort of the Management to create a conducive environment and allocate greater resources to ICT infrastructure in an organisation. Incentives are integral parts of the reward and punishment systems within organisations. Incentives such as commissions, bonus, promotion, national and international recognition/awards are presented to employees who performed well to meet organisational goals while punishment or penalties such as warning, suspension and demotion are given to employees who performance woefully in the course of their duties [12].
3. Social factors: Virtual networking is described as community of Internet users that interact with each other through specific websites or social media networks. It offers huge opportunities for users to connect with each other irrespective of their locations [16]. Employees have important roles to play in providing encouragement, innovation and moral support to their peers within the same organisation. They interact, communicate and work with one another. Government and its agencies are expected to be active in supporting the adoption of ICT innovation in organisations. Government has responsibility to develop comprehensive policies that will promote adoption of ICT innovation and improve organisation performance and productivity.

48 IITM Journal of Management and IT
4. Economic factors: Income denotes the aggregate of all the salaries, wages, pro ts, interest payments, allowances, benefits, rents and other kinds of earnings received by an individual within a given period of time. Consumers’ income is an important determinant of the purchasing power of individuals to consume or demand for goods and services such as ICT innovation. Cost refers to the total cost of deploying ICT based resources in an organisation. It re ects all the expenses associated with adding and integrating ICT-based resources into the workplace. In ation is an economic condition that shows a sustained rise in the general price level of goods and service in an economy over a speci ed period of time. In ation re ects a reduction in the purchasing power of a nation’s currency. This means that fewer items are purchased by the monetary unit during the in ation period [8].
Fig. 1: Model for conceptual framework
C. Data CollectionThe study involved a population of 120 respondents. The source list was obtained from the Human Resources Department of the tertiary education regulatory agency in Nigeria. The data collected from the 105 respondents out of 120 were processed, tabulated and analysed with Stata 13 statistical software package. The survey questionnaires were distributed to collect data for the research study in two phases. The rst phase was the pilot survey to test and modify the questionnaire while the second phase was the actual data survey and collection. All questions
stated in the questionnaire were linked to the indicators in the conceptual framework or model proposed for the study in g 1.The graphic rating scales were used to measure the attitudes, opinions or responses of the respondents. Each statement in the questionnaires had simple alternative or multiple choice of responses that the respondents chose from a 5-level of Likert scale of agreement or disagreement.D. Model Speci cationsICT adoption (ICTA) is the dependent variable while the independent variables are: individual factors (IF), organisational factors (OF), social factor (SF), and economic factors (EF). The model for study is thus speci ed as:
, , ,ICTA f IF OF SF EF ...(1)
0 1 2 3 4i i i i iICTA IF OF SF EF e ...(2)Where
0 = model intercept or constant
1 2 3 4, , , = beta coef cients of the model
e = model error term
III. RESULTS
A. Descriptive StatisticsTable I showed the descriptive statistics for the variables of this study. The mean of individual factors was 3.720635, the minimum and maximum values were 2.5 and 4.833333, respectively. The standard deviation was .5160331. It showed that the variations of individual factor values from the mean value were small. The mean of organizational factors was 3.755556, the minimum and maximum values were 1.833333 and 4.833333, respectively. The standard deviation was .495744. It showed that the variations of organizational factor values from the mean value were small. The mean of social factor values was 4.142857, the minimum and maximum values were 1.166667 and 5, respectively. The standard deviation was .6164711. It showed that the variations of the social factor values from the mean value were small. The mean of economic factor values was 3.604762, minimum and maximum values were 1.833333 and 4.833333, respectively. The standard deviation was .5127942. It showed that the variations of economic factor values from the mean value were small. The mean of ICT adoption values was 4.093651and minimum and maximum values were 1.333333 and 5, respectively. The standard deviation was .5449476. It showed that the variations of ICT adoption values from the mean value were small.

49Volume 11, Issue 1 • January-June 2020
Table I: Descriptive statistics of the variables of the study
Variable Obs Mean Standard Deviation Minimum Maximum
IF 105 3.721 .516 2.5 4.833
OF 105 3.755 .496 1.833 4.833
SF 105 4.142 .616 1.167 5
EF 105 3.604 .513 1.833 4.833
ICTA 105 4.093 .545 1.333 5
B. Correlation AnalysisTable II shows the results of correlation analysis of the data used for the study. A review of the correlation matrix revealed that there are signi cant relationship between the dependent and independent variables. The correlation coef cient between individual factors and organizational factor was 0.067. It showed a weak and positive association between the two variables. The correlation coef cient between individual factors and social factors was 0.251. It indicated a weak and positive relationship between the two variables. The correlation coef cient between individual factors and economic factors was 0.2873. It showed a weak and positive relationship between the two variables. The correlation coef cient between individual factors and ICT adoption was 0.212. It indicated a weak and positive association between the two variables. The correlation coef cient between organizational factors and social factors was 0.556. It showed moderate and positive association between the two variables. The correlation coef cient between organizational factors and economic factors was 0.167. It showed a weak and positive association between the two variables. The correlation coef cient between organizational factors and ICT adoption was 0.455. It indicated a moderate and positive relationship between the two variables. The correlation coef cient between social factors and economic factors was 0.394. It showed a moderate and positive relationship between the two variables. The correlation coef cient between social factors and ICT adoption was 0.645. It showed a moderate and positive association between the two variables. The correlation coef cient between economic factors and ICT adoption was 0.3784. It indicated that a moderate and positive association between the two variables.
Table II: Correlation matrix of the variables for the study
Variable IF OF SF EF ICTA
IF 1.000
OF 0.0667 1.000
SF 0.251 0.556 1.000
EF 0.287 0.167 0.394 1.000
ICTA 0.212 0.455 0.645 0.378 1.000
C. MulticolinearityThe results of multicollinearity test are shown in Table III. It was observed that the highest Variance In ation Factor (VIF) and lowest tolerance were 1.73 and 0.579693respectively for individual factors and the lowest VIF and highest tolerance were 1.12 and 0.889579 respectively for economic factors. The mean value of VIF was obtained as 1.39. The results showed that all the VIF values were below 4 and tolerance values were above 0.2. The degree of multicollinearity in the data was very low (Hair et al., 2006).
Table III: Results of multicollinearity test
Variable VIF 1/VIF
IF 1.73 0.579693
OF 1.46 0.683636
SF 1.24 0.804753
EF 1.12 0.889579
Mean VIF 1.39
D. ReliabilityTable IV shows the Cronbach’s Alpha as 0.7287. This shows that the instrument has good reliability. This is as a result of the Cronbach’s Alpha value that is higher than recommended value of 0.7.
Table IV: Results of reliability test
Variables Observations Cronbach’s Alpha
IF 105 0.7585
OF 105 0.6979
SF 105 0.5887
EF 105 0.7045
ICTA 105 0.6251
Test Scale 0.7287
E. ValidityThe validity test of the model was carried out using Kaiser-Meyer-Olkin (KMO) measure of sampling adequacy and factor loading. The results of the validity test are shown in Table V. The KMO values for all the variables are more than 0.5. Factor loading of all variables are more than 0.3. This validates the model as suitable for the study.
Table V: Results of validity test
Variable KMO Factor Loading
IF 0.7487 0.4234
OF 0.7289 0.6814
SF 0.6905 0.8677
EF 0.7793 0.6132
ICTA 0.7532 0.8225

50 IITM Journal of Management and IT
F. Normality The Shapiro-Wilk test was used in this study to test the normality of the data. From the results in Table VI, the W value is 0.80028. This value is high and indicates that the sample was normally distributed.
Table VI: Results of normality test
Variable Obs W V Z Prob> z
res 105 0.800 17.18 6.325 0.000
G. Regression AnalysisThe results of the regression analysis using Stata 13 package is shown in Table VII. From the results of the regression analysis, 45.1% of the variance on ICT adoption can be explained by the predictor variables of individual factors, organizational factors, economic factors and social factors.Social factors had regression coef cient β of .4345212 with a t value of 5.05 and a p-value of .001. These indicated that as social factors increased by a unit, ICT adoption was positively in uenced by 0.4345212 units. It is found that social factors with highest in uence on ICT adoption in organisations. Organisational factors had regression coef cient β of .1703025 with a t value of 1.73 and a p-value of .087. These showed that as organizational factors increased by a unit, ICT adoption was positively influenced by .1703025units. This is considered as the second most in uencing factors to ICT adoption in organisations.Economic factors had regression coef cient β of .1580302 with a t value of 1.80 and a p-value of .075. These indicated that as economic factors increased by a unit, ICT adoption is positively in uenced by .1580302 units. It was observed as the third most in uencing factor to ICT adoption in organisations. Individual factors had regression coef cient β of .0372911 with a t value of .45 and a p-value of .654. These showed that as individual factors increased by a unit, ICT adoption was positively in uenced by .0372911 units. This is found to be the least in uencing factor to ICT adoption in organizations.
Table VII: Results of the regression analysis
Variables Coef cient Standard Error t P(t)
IF .0372911 .08293 0.45 0.654
OF .1703025 .0984717 1.73 0.087
SF .4345212 .0859943 5.05 0.000
EF .1580302 .0877419 1.80 0.075
const .9455031 .4432036 2.13 0.035
R-squared = 0.4514Adj R-squared = 0.4295
IV. DISCUSSIONS
The results of hypothesis test showed that adoption of ICT is statistically in uenced by social factors. The p-value of performance expectancy was .0001 and was less than .05. Therefore, the null hypothesis was rejected. The study showed that the respondents believed that social factors determine behavioural intention to ICT adoption. The findings of the study suggested that integrating social networks into the activities of a regulatory agency improved employees’ performance as well as support from Government enhances ICT adoption. It shows that employees adopt ICT to gain new knowledge and practices when the energy they will expend to get such information from the sources within or outside their organisations are minimal. Employees also adopt ICT when they perceive it as a useful and friendly medium to communicate with other employees within organisations. It also suggests that interaction of employees with their peers that are computer pro cient improve ICT adoption in the organization. The implication of this nding is that employees adopt ICT because it facilitates open and honest communication between individuals within organisations that develop strong bond and synergies. Thus, the behaviour of peers who show positive attitude towards adoption of the ICT within organisations inspires their colleagues to adopt the technologies. The interventions of Government to develop comprehensive policies and plans to develop ICT enable employees to adopt ICT. In addition, Government supports for research and development also plays an important role in adopting ICT.The p-value of organizational factors was 0.087 and greater than .05. The results supported the null hypothesis formulated for this study. The result showed that ICT adoption is not statistically in uenced by organizational factors. The ndings suggest that ICT adoption in the organization does not depends on elaborate training, support and motivation provided by its management. It could be deduced that employees do not depends on the organization to provide them with ICT based resources to perform their activities. They have decided to adopt ICT due to the bene ts associated with it. The ndings of the study further suggest that the policies, strategies, decisions and actions of the Management may not be solely responsible for employees to adopt ICT within the organisation. The nding also shows that ICT adoption does not depends on incentives such as commissions, bonus, promotion, recognition or awards presented to employees who performed well to meet organisational goals or punishment or penalties such as warning, suspension and demotion are given to employees who performance woefully in the course of their duties.

51Volume 11, Issue 1 • January-June 2020
The p-value of economic factors was .075 and greater than .05. Therefore, the null hypothesis was support. It means that economic factors have no signi cant impact on ICT adoption. The ndings showed that ICT adoption in the organization does not depends on the in ation and cost of the ICT-based resources, and income of the employees. The importance of ICT to employees’ performance on the job usually motivates employees to adopt the technology rather than its cost or prevailing economic conditions. The implication of these nding is thatthe cost of installing new ICT systems, providing security systems, providing back-up power supply, and extending building spaces may not affect the behavioural intention to adopt ICT. The p-value of individual factors was .654 and greater than .05. Therefore, the null hypothesis that individual factors have no signi cant in uence on ICT adoption was supported. The results showed that ICT adoption does not depends on current and past experience of employees on ICT and related issues. It further suggests that ICT adoption is not related to enthusiasm of the employees to use the technology. Organizations may adopt ICT not because it improves performance and effectiveness of their employees but as a result of organizational and Government policies that require that its operations be digitalized.
V. CONCLUSION
There is a noticeable increase in the adoption of ICT in public organisations in Nigeria but no research studies have been undertaken to determine the factors that in uence this development in the public organisations to the best our knowledge. The focus of this study is to investigate the factors that in uence intention to adopt ICT in a tertiary education regulatory agency in Nigeria. In order to perform the study a model is proposed and validated. The empirical results show that the social factors have direct positive effect on the adoption of ICT in a public organisation in Nigeria. The study also finds that economic factors, organisation factors and individual factors do not have signi cant impact on ICT adoption. This implies that Government should provide incentives and supports to organisations in order to boost ICT adoption among public organisations. Future studies may be carried out to cover a large number of public organisations in Nigeria to con rm the ndings of this study.
ACKNOWLEDGMENT
The suggestions from Dr. O.A. Yahaya of the Nigerian Defence Academy, Kaduna is gratefully acknowledged.
REFERENCES[1] F. Rodriguez, and E.J Wilson. Are poor countries losing the
information revolution, 2000. The World Bank Infodev. [Online] Available: www.infodev/library/wilsonrodriguez.doc
[2] V. Peansupap and D. Walker, “Exploratory factors in uencing information and communication technology diffusion and adoption within Australian construction organizations: A micro analysis”, Construction Innovation, 5(3), 135-157, 2005.
[3] T. Bhatti, “Exploring factors in uencing the adoption of Mobile commerce”,, Journal of Internet Banking and Commerce, 12(3), 1-12, 2007.
[4] M. Talukder, H. Harris, and G. Mapunda, “Adoption of innovations by individuals within organizations: An Australian study”, Asia Paci c Management Review, 2008, 13 (2), 463-480.
[5] S. Baller, S. Dutta, and B. Lanvin (2016) The Global Information Technology report. [Online] Available: http://www3.weforum.org/docs/GITR2016/WEF_GITR_Full_Report.pdf
[6] I. Apulu and A. Latham, “Drivers for information and communication technology adoption: A case study of Nigerian small and medium sized enterprises”, International Journal of Business and Management, 6(5), 51-60, 2010.
[7] B. Aleke, U. Ojiako, and D. Wainwright, “ICT adoption in developing countries: Perspectives from small-scale agribusinesses”, Journal of Enterprise Information Management, 24(1), 68-84, 2011.
[8] I.A. Ire n, I. Abdul-Azeez, and A.A. Tijani, “An investigative study of the factors affecting the adoption of information and communication technology in small and medium scale enterprises in Nigeria”, Australian Journal of Business and Management Research, 2-7, 2012.
[9] O. Onyedimekwu, and K.M. Oruan, Factors In uencing the adoption and use of ICT by Small and Medium Sized Enterprises in Nigeria, 4-14, 2013.
[10] H. Hassan and A.A Ogundipe (2016) ICT Adoption by Micro and Small Scale Enterprises in Nigeria: A Case Study of the Federal Capital Territory, Abuja. [Online] Available: SSRN: http://dx.doi.org/10.2139/ssrn.2951901
[11] M.O. Olise, U.A. Anigbogu, T.D. Edoko and M.I. Okoli. “Determinants of ICT Adoption for improved SME’s performance in Anambra State, Nigeria”, American International Journal of Contemporary Research, 4(7), 163-176, 2014
[12] M. Talukder, M. and A. Quazi. “Exploring the factors affecting employees’ adoption and use of Innovation”, Australasian Journal of Information Systems 16 (2), 1-29, 2010
[13] C. Carvalho, C. Brito, and J.S. Cabral. (2010).Towards a conceptual model for assessing the quality of public service, [Online] Available http://www.carlosmelobrito.com/.../Artigo
[14] F.D. Davis, “Perceived usefulness, perceived ease of use, and user acceptance of information technology”, MIS Quarterly, 1989, 13(3), 319–342.
[15] R. Agarwal, and J. Prasad (1998). “The antecedents and consequents of user perceptions in information technology adoption”. Decision Support Systems, 22(1), 15-29.
[16] M. Talukder, A. Quazi and D. Djatikusumo. “Impact of social in uence on individuals’ adoption of social networks in SMEs”, Journal of Computer Science, 2013, 9(12), 1686-1694.

52 IITM Journal of Management and IT
Abstract— Cognitive radio (CR) is a promising technology where spectrum sensing is the key factor for the recent and future generations. Detection is compromised when a person reports shadowing or fading consequences and that’s why performance of spectrum sensing is developed by cooperative spectrum sensing methods. This paper emphasizes on the performance of Cooperative Spectrum Sensing with Selection Diversity Reception in CR. Fusion rule is played at the data fusion center (FC) to take the hard decision by performing the operation of the received signal from different CR users and eventually, the paper shows that the OR rule has better performance than AND as well as MAJORITY rule in Rayleigh fading. Keywords—Cognitive radio, fusion rules, cooperative spectrum sensing, fading channels, energy detection
I. INTRODUCTION
The radio frequency (RF) spectrum is currently managed by government agencies under an exclusive usage scheme. Due to the explosive development of wireless applications, it is evident that the available frequencies cannot meet the increasing demand. Current investigations con rmed that there are present good sized underutilization of the allotted frequencies [1]. The spectral underutilization can be resolved by means ofpermitting a secondary user to entrée an authorized band whilst the primaryconsumer (PU) is absent. CR is appreciably agreed to be the maximum encouraging approach for assuaging RF spectral insufficiency. Present day investigations confirmed that there be presentsizeable underutilization of the allotted frequencies. The spectral underutilization can be resolved viaallowing a secondary person to entrée a certi ed band whilst the primaryuser (PU) is absent.
CR is notably agreed to be the maximum encouraging technique for assuaging RFSpectral ef ciency. Energy detection [2] is normallyutilized in spectrum sensing, as it has a low execution issue and does now notwant to channel kingdomrecords (CSI) [3]. Because of the a few multipath fading, a cognitive radio may additionally fail to assert the presence of the PU and then will entrée the licensed channel and purpose interference to the PU.The act of cooperative spectrum sensing with disposing of cognitive radios in Rayleigh fading channel has been expected in [7-12]. It improves the detection performance. Previouswork on cooperative spectrum sensing has shown that areadiversity can increase the chance of detection [13]–[16]. The use of most ratio combining (MRC), selection combining (SC), square-law combining (SLC), and square law selection (SLS) information fusion schemes.Rayleigh fading channels became researched in [17-20]. In this paper, we only studied selection combining (SC) data fusion schemes based in F. F. Digham by cooperating with four number of CR users.The restof this paper is organized as follows. Firstly, in section II, the system model is presented. Secondly, in section III, detection and false alarm probability are demonstrated. Thirdly, Cooperative spectrum sensing is derived in section in IV. Eventually, the simulation result and dialogue are offered in section V as well as it is drawn in conclusion in section VI.
II. SYSTEM MODEL
The local spectrum sensing is to decide between the following two hypotheses,
1
0
HH
tnthstn
tx
...(1)
Cooperative Spectrum Sensing with Selection Diversity Reception in Cognitive Radio
Md. Shahabub Alam1, Mohammad Alamgir Hossain2, Mst. Ashrafunnahar Hena3, Md. Ibrahim Abdullah4, Md. Shamim Hossain5
Lecturer1, Department of Computer Science & Engineering German University Bangladesh, Gazipur-1702, Dhaka.
Assistant Professor3 Department of Electrical and Electronic EngineeringIslamic University, Kushtia
Assistant Professor2&5, Professor4 Department of Computer Science & EngineeringIslamic University, Kushtia
*Corresponding Author: [email protected]

53Volume 11, Issue 1 • January-June 2020
Where x(t) is the signal received by secondary users and s(t) is primary user’s transmitted signal, n(t) is the additive white Gaussian noise (AWGN) and h is the amplitude gain of the channel. The energy collected in the frequency domain is denoted by Y which serves as a decision statistic. Following the work of Urkowitz, Y may be shown to have the following distribution,
1
0
,22
22
2 HH
YTW
TW
...(2)
where TW22
and 222
TW denote central and non-central chi-square distributions respectively, each with 2TW degrees of freedom and a non-centrality parameter of 2γ for the latter distribution. For simplicity we assume that time-bandwidth product, TW, is an integer number which we denote by u.
III. DETECTION AND FALSE ALARM PROBABILITIES
In thisphase, we provide the average detection chance over Rayleigh fading channels and in closed shape [21]. In communications principle, Rayleigh distributions are used to model scattered signals that attain a receiver with the aid ofmore than one path. In non-fading surroundings the commonchance of false alarm, the commonchance of detection, and the commonopportunity of missed detection are given, respectively,
,2| 1 ud QHYPP ...(3)
u
uHYPPf 2/,| 0
...(4)and
dm PP 1 ...(5)where λ denotes the energy threshold. Γ(.) and Γ(.,.) are complete and incomplete gamma functions respectively [22] and .,.uQ is the generalized Marcum Q-function de ned as follows,
dxaxIe
axbaQ u
ax
u
u
u 10
21
22
,
where .1uI is the modi ed Bessel function of (u−1)th order.In this case, the averageprobability of detection can be derived through averaging (three) over fading statistics [23]
dxxfQPx
ud ,2 ...(6)
wherein f(x) is the probability distribution characteristic (PDF) of SNR beneath fading.
A. Rayleigh fading channelsWhen the received signal consists of a largequantity of aircraft waves, for somesorts of scattering environments, the receivedsignal has a Rayleigh distribution [24]. Follows an exponential PDF is given by
exp1f , 0 ...(7)
In this example, a closed-shapeformulation for dP may be obtained (after some manipulation) by substituting
xf in (6), 1
2
0
2 12!
1
uu
k
k
dRayk
eP
2
0 12!1
212
u
k kee ...(8)
B. Selection CombiningIn the SC diversity scheme, the branch with maximum
SNR, max , is to be selected. The PDF of max for IID Rayleigh branches is known to be given by
/1/1max
eeL
fL
...(9)
This PDF can be rewritten as
1
0
1
1/11
11
max
L
i
ii
eii
Li
Lf ...(10)
The PDF in (10) represents a weighted sum of exponential
variates each with parameter 1i . Hence, the average dP
for the SC diversity scheme, dSCP , can be evaluated as
1
0 11
11L
idRay
i
dSCi
Pi
Li
LP ....(11)
IV. COOPERATIVE SPECTRUM SENSING
With a difficultdecision counting rule, the fusion center implements an n–out-of-M rule that decidesat thesignalgifthypothesiseach timeat leastk out of the N CR userselections indicate 1H . The probability of detection at the fusion center [25] is given by
N
kl
lNid
lidd PP
lN
P ,, 1
...(12)

54 IITM Journal of Management and IT
Where idP , is the probability of detection for each individual CR user.In AND-rule, if all the local selections dispatched to the decision maker are one, the nal decision made by means of the decision maker is one. The fusion middle’s decision is calculated through logic AND of the received tough decision records. When OR-rule if someone of the local selections sent to the decision maker is a logical one, the nal selection made through the decision maker is one. On the other hand, MAJORITY-rule, where half or greater of the neighborhood decisions dispatched to the selection maker are the nal decision made with the aid of the selection maker is one.
V. SIMULATION RESULT AND DISCUSSION
All simulation was done on MATLAB over Rayleigh fading channel. This paper represents complementary ROC curves for different values of probability of false alarm and CR user where rstly, in Fig. 2(a) presents for complementary ROC curves with L-branch SC reception for u=5, N=4, SNR=20 as well as L=1, 2, 3, 4 following AND rule. Secondly, Fig. 2(b) provides the complementary ROC curves with L-branch SC reception for u=5, N=4, SNR=20 in addition to L=1, 2, 3, 4 following OR rule. What’s more Fig. 2(c) depicts the complementary ROC curves for L-branch SC reception where u=5, N=4, SNR=20 also L=1, 2, 3, 4 following MAJORITY rule. In this simulation, 20 dB and 5 are conserved for average SNR and U respectively. The simulated result is provided that OR rule has the betterperformance than others AND as well as MAJORITY rule.
Fig. 2(a) Complementary ROC curves for L-branch SC reception (u=5, N=4, SNR=20, L=1, 2, 3, 4)
Fig. 2(b) Complementary ROC curves for L-branch SC reception (u=5, N=4, SNR=20, L=1, 2, 3, 4 )
Fig. 2(c) Complementary ROC curves for L-branch SC reception (u=5, N=4, SNR=20, L=1, 2, 3, 4 )
Fig. 2(a), 2(b) and 2(c) show complementary ROC curves of the 4 user’s spectrum sensing in Rayleigh fading following AND rule, OR rule and MAJORITY rule respectively. Fig. 2(a), it clearly depicts that the probability of false alarm increases under probability of missed detection where AND fusion rule is used for processing incoming data from the sensing element of the system. Otherwise, Fig. 2(b) indicates the probability of false rate decrease dramatically in case of probability of missed detection using the data fusion center for OR rule. Likewise, the gure clearly shows that suddenly changing the probability of false depends on several users which gives the desired results of OR rule. Eventually, in the last Fig. 2(c) presents the comparison of probability
55Volume 11, Issue 1 • January-June 2020
of false alarm for how much is increased with Fig. 2(a) & Fig. 2(b), Moreover in this case data fusion center uses MAJORITY rule for processing the received acknowledgement. The reason why compared among the simulated results, it is outlined that OR rule gives better performances than other fusion rules.
VI. CONCLUSION
This paper describes hard decision based cooperative spectrum sensing over Rayleigh fading channel for measuring the performance of cooperative spectrum sensing. It has been demonstrated that probability of missed detection is decreased by using different hard decision fusion rules where the OR rule has the better performance than others AND as well as MAJORITY rule in Rayleigh channels.
REFERENCES[1] FCC, “Spectrum Policy Task Fo rce,” 11/2002, ET Docket 02-
135.[2] H. Urkowitz, “Energy detection of unknown deterministic
signals,” in IEEE Proceedings, vol. 55, no. 4, April 1967, pp. 523–531.
[3] H. Sun, D. Laurenson, and C.-X. Wang, “Computationally tractable model of energy detection performance over slow fading channels,” IEEE Comm. Letters, vol. 14, no. 10, pp. 924 –926, Oct. 2010.
[4] G. Ganesan and Y. (G.) Li, “Cooperative spectrum sensing in cognitive radio–part I: two user networks,” IEEE Trans. Wireless Commun., vol. 6, no. 6, pp. 2204–2213, June 2007.
[5] G. Ganesan and Y. (G.) Li, “Cooperative spectrum sensing in cognitive radio part II: multiuser networks,” IEEE Trans. Wireless Commun., vol. 6, no. 6, pp. 2214–2222, June 2007.
[6] S. M. Mishra, A. Sahai, and R. W. Brodersen, “Cooperative sensing among cognitive radios,” in Proc. IEEE Int. Conf. on Commun. June, 2006, vol. 4, pp. 1658–1663.
[7] S. Nalgonda, S. D. Roy and S. Kundu, “Performance of cooperative spectrum sensing with censoring of cognitive Radios in Rayleigh Fading Channel”, in Proc. of IEEE INDICON 2011, December.
[8] S. Nalgonda, S. D. Roy and S. Kundu, “Cooperative spectrum sensing with censoring of cognitive Radios in Rayleigh Fading Channel”, accepted in Proc. of IEEE Eighteenth National conference on Communications (NCC 2012), February.
[9] S. Nalgonda, S.D Roy and S. Kundu, “Performance of Cooperative Spectrum Sensing in Log-normal Shadowing and Fading under Fusion Rules”, Int. Jour. Of Energy. Infor. And Comm. pp. 15-28, Vol. 3, Aug. 2012.
[10] M. H Alamgir, M. H Shamim and M. A Ibrahim, “Cooperative Spectrum Sensing over Fading Channel in Cognitive Radio,”
International Journal of Innovation and Applied Studies, vol. 1, no. 1, pp. 84–93, Nov. 2012.
[11] M. H Alamgir, S Ahmed, M. H Shamim and M. A Ibrahim, “Performance of Cooperative Spectrum Sensing for Different Number of CR users in Cognitive Radio”, International Journal of Science and Research (IJSR), India Online ISSN: 2319-7064, pp. 145-149, Volume 1 Issue 3, December 2012.
[12] S Ahmed, M. H Alamgir, M. H Shamim and M. A Ibrahim, “Cooperative Spectrum Sensing over Rayleigh Fading Channel in Cognitive Radio”, IJCSE,Volume1,Number 4, pp. 2583-2592, ISSN 2277-1956/V1N4-2583-2592.
[13] Q. Chen, F. Gao, A. Nallanathan, and Y. Xin, “Improved cooperative spectrum sensing in cognitive radio,” in Proc. IEEE VTC 2008 Spring, 2008, pp. 1418 –1422.
[14] Q. Chen, M. Motani, W.-C. Wong, and A. Nallanathan, “Cooperative spectrum sensing strategies for cognitive radio mesh networks,” IEEE J-STSP, vol. 5, no. 1, pp. 56 –67, Feb. 2011.
[15] C.-X. Wang, H.-H. Chen, X. Hong, and M. Guizani, “Cognitive radio network management: tuning in to real-time conditions,” IEEE Vehicular Technology Magazine, vol. 3, no. 1, pp. 28–35, Mar. 2008.
[16] C.-X. Wang, X. Hong, H.-H. Chen, and J. S. Thompson, “On capacity of cognitive radio networks with average interference power constraints,” IEEE Trans. Wireless Comm., vol. 8, no. 4, pp. 1620 –1625, Apr. 2009.
[17] F. F. Digham, M.-S. Alouini, and M. K. Simon, “On the energy detection of unknown signals over fading channels,” IEEE Trans. Communications, vol. 55, no. 1, pp. 21 –24, 2007.
[18] S. Herath, N. Rajatheva, and C. Tellambura, “Uni ed approach for energy detection of unknown deterministic signals in cognitive radio over fading channels,” in Proc. IEEE ICC Workshops, June 2009, pp.1 –5.
[19] ——, “On the energy detection of unknown deterministic signals over Nakagami channels with selection combining,” in Proc. CCECE, May 2009, pp. 745 –749.
[20] S. P. Herath and N. Rajatheva, “Analysis of diversity combining in energy detection for cognitive radio over nakagami channels,” in IEEE ICC 2009 CD-ROM, vol. 32, no. 1, 2009, pp. 2913–2917.
[21] F. F. Digham, M.-S. Alouini, and M. K. Simon, “On the energy detection of unknown signals over fading channels,” in Proc. IEEE ICC, 2003, pp. 3575–3579.
[22] I. S. Gradshteyn and I. M. Ryzhik, Table of Integrals, Series, and Products, 7th ed. Academic Press, 2007.
[23] S. H Lee, Y. H. Lee, S, “Hard Decision Combining-based Cooperative Spectrum Sensing in Cognitive Radio Systems”.
[24] G. L. Stuber, Principles of Mobile Communications, second ed. Norwell, MA: Kluwer Academic Publishers, 2002.
[25] Spyros Kyperountas, NeiyerCorreal, Qicai Shi and Zhuan Ye, “Performance analysis of cooperative spectrum sensing in Suzuki fading channels,” in Proc. of IEEE International Conference on Cognitive Radio Oriented Wireless Networks and Communications (CrownCom’07), pp. 428-432, June 2008.

56 IITM Journal of Management and IT
Abstract— In present situations, social distancing is the most important fact. Furthermore, the fact is COVID-19 patient’s first symptom is body temperature is high. The reason why, measuring body temperature is most important, but needs to maintain social distancing. While traditional thermometers can’t make sure of social distancing, where our developed contactless thermometer can achieve temperature on display by using Arduino unoR3 as the main control device as well as MLX90614 as the infrared (IR) thermometer sensor. As a result, compared with the traditional thermometer, it shows strong points such as convenient reading, wide range of temperature measurement, and accuracy where temperature output is displayed digitally. Besides, it would be used everywhere because of its easy-handling. Keywords— IR, Thermometer, Arduino, UNO Contactless thermometer, MLX90614.
I. INTRODUCTION
In recent times, World is going towards a bad situation due to the Coronavirus disease (COVID-19). Where most of the country in hugely are suffering from this disease as well as everyone is endangered for unseen viruses. An infrared thermometer is a thermometer which infers temperature from a portion of the thermal radiation sometimes called black-body radiation emitted by the object being measured. They are sometimes called laser thermometers as a laser is used to help aim the thermometer, or non-contact thermometers or temperature guns, to describe the device’s ability to measure temperature from a distance. Infrared thermometers can be used to serve a wide variety of temperature monitoring functions. A few examples provided include checking mechanical or electrical equipment for temperature and hot spots, measuring the temperature of patients in a hospital without touching them, checking heater or oven temperature, for calibration and control, checking for hot spots in re- ghting, monitoring materials in processes
involving heating or cooling [1]. A traditional thermometer which is now being developed and used for measuring body temperature from objects is high risk for all because of keeping nearly touch that is not long distance from the affected people. In that case, contactless thermometers can be used everywhere such as normal places or risky places. For example, to measure hot bodies temperature in industries and research laboratories. Furthermore, in the medical eld, where a badly infected/burned patient’s body temperature measurement is unsafe and insecure. In this place a contactless thermometer is much helpful. It is easy, safe and accurate to measure temperature. In this paper we describe the principle of making contactless thermometers. In this system, an Arduino UNO, MLX90614 temperature sensor, OLED Display and battery as power source are included for providing the developed system. In our thermometer wide -70 to 380˚C range temperature measurement with accuracy of 0.5˚C [1]. The digital display system for the output of the temperature is simple and economic, operation reliable and environmental friendly. This paper is organized as follows: Firstly, section II explains the design principles. Secondly, section III describes Flowchart, Block Diagram and Circuit Design. Thirdly, Section IV, discuss the Result and Output of the developed system. Eventually conclusion is drawn in section V.
II. DESIGN PRINCIPLES
The traditional thermometer is used to body contact for measuring temperature. On the other hand our thermometer does not need any contact to measure temperature. MLX90614 temperature sensor and OLED display are connected to Arduino UNO [2]. The two components are connected to an analog pin of the Arduino UNO [3]. When the desired body or object is in the range of the thermometer then MLX90614 reads the temperature and shows it on display. There is a led/
Design and Development of Arduino Based Contactless Thermometer
1Md. Abdullah Al Mamun, 2*Mohammad Alamgir Hossain, 3M. Muntasir Rahman, 4Md. Ibrahim Abdullah, 2Md. Shamim Hossain
1 B.Sc., 2Assistant Professor, 3Associate Professor, 4Professor Department of Computer Science and Engineering Islamic University, Kushtia, Bangladesh
*Corresponding Author: [email protected]

57Volume 11, Issue 1 • January-June 2020
IR light for accurate target for measuring temperature of objects. When the switch is on, the Arduino gets power and the MLX90614 reads temperature. The IR-thermometer MLX90614 having access by 2 wire serial SMBus compatible protocol (0.02°C resolution) or via 10-bit PWM (Pulse Width Modulated) output of the device is used [4-6]. The measured temperature can be read directly and easily, and then be converted to meet the design requirements. The Flowchart, block diagram and circuit diagram is shown in gure-1, gure-2 and gure-3 respectively. Which describes the detailed design of the system along with various components present in it.
III. FLOWCHART, BLOCK DIAGRAM AND CIRCUIT DESIGN
Flowchart- The owchart of the developed system is shown in Fig. 1. To begin with the pressing power switch, the Arduino becomes on and temperature sensor on too, Following this, the temperature sensor reads object or body temperature and shows the result on display. Firstly, the system initializes analog pins A4 and A5 as well as initializes OLED power. If the power switch is held on, the system continuously reads and provides the temperature. Otherwise, it will delay some time and end the loop. In addition, if the power switch is pressed, the loop repeats the same process.
Fig. 1: Flow Chart for the developed system
Block Diagram- The block diagram is shown in Fig. 2 where it depicts all the equipment which are connected to each other. Firstly, the MLX90614 temperature sensor reads data from body or object. Secondly, the received data is sent to Arduino for further processing and after performing the operations, the system displays the results.
Fig. 2: Block Diagram
Circuit Diagram- The circuit diagram is depicted in Fig. 3 with showing the circuit design of the system. In where, MLX90614 temperature sensor and even OLED display are connected with Arduino analog pin-4 and pin-5. At the same time, MLX90614 temperature sensor SCL is also connected with clock pic and SDA is with data pin simultaneously. To some extent, MLX90614 Infra-Red thermometer is a four pin, SMBus based device produced by Melexis Company [7-8]. It possesses characteristics including simple circuit, smaller size, wider applications and more economical. The on-site temperature is transmitted directly by “bus line” digital mode, which greatly enhances the anti-jamming system. It’s suitable for on-site temperature measurement in harsh environments such as: environmental control, equipment or process control, electronic consumables which need proximity type temperature measurement. Fig. 3 represents the MLX90614 Schematic and picture which helps the circuit understanding. The main features for MLX90614:• On ly two por ts were needed to achie ve
Communication.• Each component of the DS18B20 has a unique serial
number.• Realize temperature measurement without external
components.• Measuring temperature range between –70 to 380
°C for object temperature• Digital IR thermometer Measurement resolution of
0.02°• Having Power saving mode, low noise ampli er,
high resolution 17-bit ADC and powerful DSP unit of MLX90302.
OLED displays are also known as organic light-emitting diodes. Here we used a 0.96inch OLED display.Features of OLED display:• OLED Driver IC: SSD1306• Resolution: 128 x 64

58 IITM Journal of Management and IT
• Visual Angle: >160°• Input Voltage: 3.3V ~ 6V• Compatible I/O Level: 3.3V, 5V• Mini Size: 2.7 x 2.8cm• Only Need 2 I/O Port to Control.The Arduino Uno R3 is a microcontroller board based on the ATmega328. It has 16 MHz crystal oscillator, 14 digital input/output pins (of which 6 can be used as PWM outputs), 6 analog inputs, a power jack, a USB connection, an ICSP header, and a reset button. It simply connects it to a computer with a USB cable or power it with an AC-to-DC adapter or battery to get started.Main features:• Operating Voltage: 5V• Microcontroller: ATmega328• Input Voltage (recommended): 7-12V• Clock Speed: 16MHz
Fig. 3: Circuit Diagram
IV. RESULT AND OUTPUT
After completing our project it is the output. Here we can see the desired contactless thermometer which is used for measuring temperature without any contact. Fig. 4 is shown in room temperature. In this system we make a target for measuring temperature which would be someone’s body or object. Moreover, the temperature will show in the OLED display. Fig. 5 is also shown the front view of the thermometer. Here we can see MLX90614 temperature sensor and a led/IR light for accurate target of desired object or body. Besides, the last Fig. 6 is provided with the side view of the contactless thermometer. At this time, the system considers a switch where if the switch is pushed down the Arduino gets power and the MLX90614 sensor reads temperature.
Fig. 4: Showing Room temperature
Fig. 5: Front view of contactless thermometer
Fig. 6: Side view of contactless thermometer

59Volume 11, Issue 1 • January-June 2020
V. CONCLUSIONS
The system depicts the development of a contactless thermometer. Where we are fighting against unseen viruses which increase day by day contacting by person to person. So we need to maintain social distancing and need to measure body temperature without any contact. This system will help for making any contactless thermometer and measuring temperature without contact. In addition, the contactless thermometer is more advantageous in the application especially in the medical eld. The system is successfully implemented and evaluated using highly advanced ICs and with the help of growing technology.
REFERENCES[1]. http ://en.wikipedia.org/wiki/Proximity sensor.[2]. http://arduino.cc.[3]. Brian W. Evans “Arduino Programming Notebook”.[4]. Mario Bohmer, Beginning Android ADK with Arduino[5]. http://arduino.cc/en/uploads/Main/arduino_Uno_Rev3-02-TH.zip.[6]. http://arduino.cc/en/uploads/Main/Arduino_Uno_Rev3-
schematic.pdf.[7]. http://arduino.cc/en/Main/ArduinoBoardUno[8]. Mlx90614 datasheet[9]. http://www.digikey.com/catalog/en/partgroup/mlx90614-
15/20353?WT.srch=1
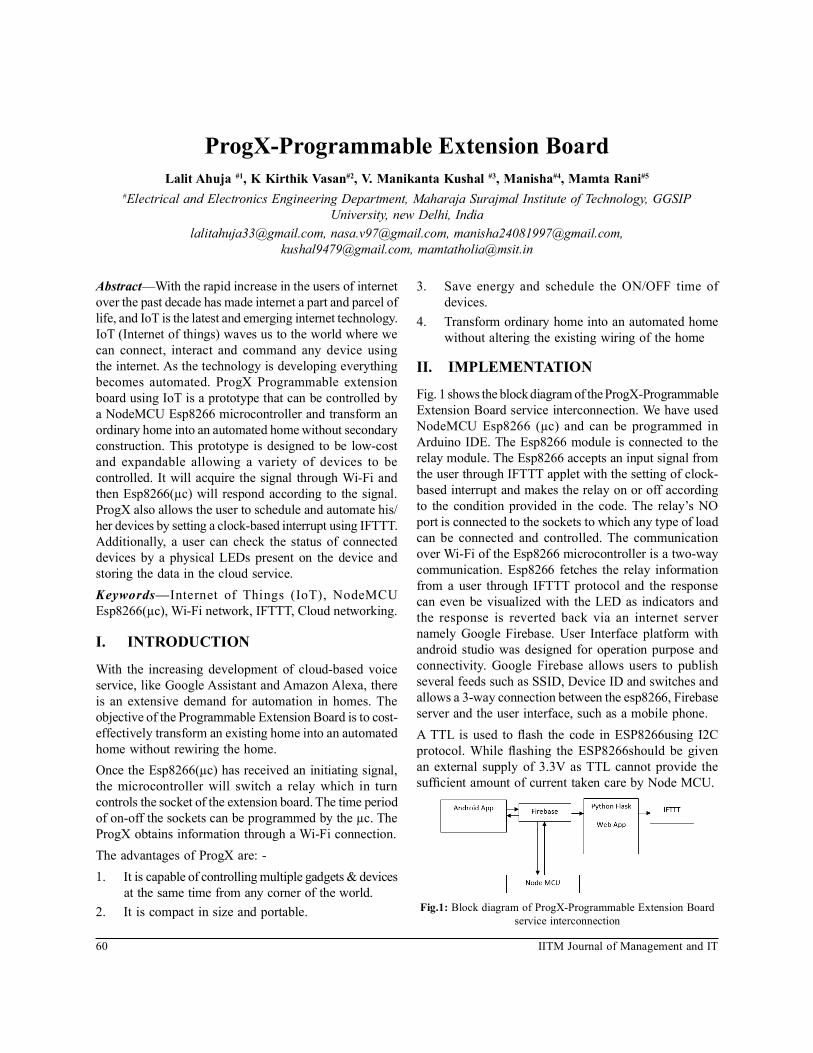
60 IITM Journal of Management and IT
Abstract—With the rapid increase in the users of internet over the past decade has made internet a part and parcel of life, and IoT is the latest and emerging internet technology. IoT (Internet of things) waves us to the world where we can connect, interact and command any device using the internet. As the technology is developing everything becomes automated. ProgX Programmable extension board using IoT is a prototype that can be controlled by a NodeMCU Esp8266 microcontroller and transform an ordinary home into an automated home without secondary construction. This prototype is designed to be low-cost and expandable allowing a variety of devices to be controlled. It will acquire the signal through Wi-Fi and then Esp8266(µc) will respond according to the signal. ProgX also allows the user to schedule and automate his/her devices by setting a clock-based interrupt using IFTTT. Additionally, a user can check the status of connected devices by a physical LEDs present on the device and storing the data in the cloud service.Keywords—Internet of Things (IoT), NodeMCU Esp8266(µc), Wi-Fi network, IFTTT, Cloud networking.
I. INTRODUCTION
With the increasing development of cloud-based voice service, like Google Assistant and Amazon Alexa, there is an extensive demand for automation in homes. The objective of the Programmable Extension Board is to cost-effectively transform an existing home into an automated home without rewiring the home. Once the Esp8266(µc) has received an initiating signal, the microcontroller will switch a relay which in turn controls the socket of the extension board. The time period of on-off the sockets can be programmed by the µc. The ProgX obtains information through a Wi-Fi connection. The advantages of ProgX are: -1. It is capable of controlling multiple gadgets & devices
at the same time from any corner of the world. 2. It is compact in size and portable.
3. Save energy and schedule the ON/OFF time of devices.
4. Transform ordinary home into an automated home without altering the existing wiring of the home
II. IMPLEMENTATION
Fig. 1 shows the block diagram of the ProgX-Programmable Extension Board service interconnection. We have used NodeMCU Esp8266 (µc) and can be programmed in Arduino IDE. The Esp8266 module is connected to the relay module. The Esp8266 accepts an input signal from the user through IFTTT applet with the setting of clock-based interrupt and makes the relay on or off according to the condition provided in the code. The relay’s NO port is connected to the sockets to which any type of load can be connected and controlled. The communication over Wi-Fi of the Esp8266 microcontroller is a two-way communication. Esp8266 fetches the relay information from a user through IFTTT protocol and the response can even be visualized with the LED as indicators and the response is reverted back via an internet server namely Google Firebase. User Interface platform with android studio was designed for operation purpose and connectivity. Google Firebase allows users to publish several feeds such as SSID, Device ID and switches and allows a 3-way connection between the esp8266, Firebase server and the user interface, such as a mobile phone.A TTL is used to ash the code in ESP8266using I2C protocol. While ashing the ESP8266should be given an external supply of 3.3V as TTL cannot provide the suf cient amount of current taken care by Node MCU.
Fig.1: Block diagram of ProgX-Programmable Extension Board service interconnection
ProgX-Programmable Extension BoardLalit Ahuja #1, K Kirthik Vasan#2, V. Manikanta Kushal #3, Manisha#4, Mamta Rani#5
#Electrical and Electronics Engineering Department, Maharaja Surajmal Institute of Technology, GGSIP University, new Delhi, India
[email protected], [email protected], [email protected], [email protected], [email protected]

61Volume 11, Issue 1 • January-June 2020
Fig. 2 shows inside view of the Automatic Extension Board. It consists of a relay module (middle), a 5 volt adapter (right corner) for ESP8266 node mcu and relay module supply, the Esp8266-12e microcontroller (middle right), AC supply and sockets (extreme left),from the mains from the mains running to the relays common port then to the sockets via NO ports of relay module.
Fig. 2: Schematic of hardware implementation
Fig. 3 shows the inside view of the prototype. Most power strips are a set of buses that run the length of the strip One bus controls the phase wire and the other one controls the neutral wire. The phase wire is connected to the NC port of the relay and is shared with all the relays. The NO ports of the relays are connected to the sockets 1, 2, 3, and 4 respectively as depicted in schematic Fig 2.
Fig. 3: Inside view of prototype
Fig. 4: Complete Prototype
Table I: The Components Used in the Prototype
PART NAME UNIT
NODE MCU ESP8266 1
4-Channel Relay Circuit 1 1
5 v Adapter 1
Sockets 4
LED Indicator 4
Miscellaneous parts (wires, insulation tape)
III. SOFTWARE
A. Arduino IDEArduino Integrated Development Environment (IDE) is an open-source software that makes it easy to write and upload code to the board. It runs on Windows, Mac OS X, and Linux. The code can be written in languages like C/C++ and Embedded C. In Arduino IDE, we need to include the Adafruit MQTT library. The library can be added through include library option in sketch in IDE and then in manage libraries search for Adafruit IO Arduino & Adafruit MQTT library and install. The code can be uploaded only after uploading the libraries of Esp8266 and MQTT in the software.
B. Android Studio Fig. 5 Designed UI using Android Studio. The Android Studio was used to develop a mobile app user interface with backend data storage, real-time synchronization, and user-event logging uses Firebase. Java servlets running in the Google Cloud Platform (GCP) App Engine exible environment listen for new user logs stored in Firebase and process them.
Fig. 5: Designed UI using Android Studio
C. IFTTTIFTTT stands for If this, then that. We can control this extension board with the help of Google Assistant. IFTTT plays the major role in doing so. We can create a custom voice commands for our Google Assistant. There are many

62 IITM Journal of Management and IT
applets in which we can alter Google Assistant according to ourselves. After creating an applet for this, we just need to command Google Assistant and the work will be done.
IV. CONCLUSION
In this paper, a prototype of ProgX-Programmable Extension Board is presented. It can transform an ordinary home socket into an automated home socket and convert any standard device into an automated device. The difference between the ProgX Extension Board and ordinary Extension board is that in ProgX Extension Board we can control individual sockets. Furthermore, it can be controlled via voice command, timed automation or a using touch sensor which adds special features to ProgX.
REFERENCES[1] S. Mahmud, S. Ahmed and K. Shikder, “A Smart Home
Automation and Metering System using Internet of Things (IoT),” 2019 International Conference on Robotics,Electrical and Signal Processing Techniques (ICREST), Dhaka, Bangladesh, 2019, pp. 451-454, doi: 10.1109/ICREST.2019.8644232.O. Hamdan, H. Shanableh, I. Zaki, A. R. Al-Ali and T. Shanableh, “IoT-Based Interactive Dual Mode Smart Home Automation,” 2019 IEEE International Conference on Consumer Electronics (ICCE), Las Vegas, NV, USA, 2019, pp. 1-2, doi: 10.1109/ICCE.2019.8661935.
[2] S. Shakthidhar, P. Srikrishnan, S. Santhosh and M. K. Sandhya, “Arduino and NodeMcu based Ingenious Household Objects Monitoring and Control Environment,” 2019 Fifth International Conference on Science Technology Engineering and Mathematics (ICONSTEM), Chennai, India, 2019, pp. 119-124, doi: 10.1109/ICONSTEM.2019.8918730.
[3] N. Aktar, I. Jaharr and B. Lala, “Voice Recognition based intelligent Wheelchair and GPS Tracking System,” 2019 International Conference on Electrical, Computer and Communication Engineering (ECCE), Cox’sBazar, Bangladesh, 2019, pp. 1-6, doi: 10.1109/ECACE.2019.8679163.
[4] G. Eason, B. Noble, and I. N. Sneddon, “On certain integrals of Lipschitz-Hankel type involving products of Bessel functions,” Phil. Trans. Roy. Soc. London, vol. A247, pp. 529–551, April
1955. (references)H. K. Singh, S. Verma, S. Pal and K. Pandey, “A step towards Home Automation using IOT,” 2019 Twelfth International Conference on Contemporary Computing (IC3), Noida, India, 2019, pp. 1-5, doi: 10.1109/IC3.2019.8844945.
[5] W. Li, C. Yen, Y. Lin, S. Tung and S. Huang, “JustIoT Internet of Things based on the Firebase real-time database,” 2018 IEEE International Conference on Smart Manufacturing, Industrial & Logistics Engineering (SMILE), Hsinchu, 2018, pp. 43-47, doi: 10.1109/SMILE.2018.8353979.
[6] S. Sarkar, S. Gayen and S. Bilgaiyan, “Android Based Home Security Systems Using Internet of Things(IoT) and Firebase,” 2018 International Conference on Inventive Research in Computing Applications (ICIRCA), Coimbatore, 2018, pp. 102-105, doi: 10.1109/ICIRCA.2018.8597197.
[7] V. H. Goh and Y. Wen Hau, “Android-based Mobile Application for Home-based Electrocardiogram Monitoring Device with Google Technology and Bluetooth Wireless Communication,” 2018 IEEE-EMBS Conference on Biomedical Engineering and Sciences (IECBES), Sarawak, Malaysia, 2018, pp. 205-210, doi: 10.1109/IECBES.2018.8626603.
[8] Kodali, Ravi & Jain, Vishal & Boppana, Lakshmi. (2016). IoT based smart security and home automation system. 1286-1289. 10.1109/CCAA.2016.7813916. W. Bower and M. Ropp, “Evaluation of islanding detection methods for utility-interactive inverters in photovoltaic systems,” Sandia Nat. Lab., Albuquerque, NM, Rep. SAND2002-3591, Nov. 2002.
[9] Ranjan, Praful. (2017). Home Automation Using IOT. 10.21742/ijsh.2017.11.09.01.
[10] J. Clerk Maxwell, A Treatise on Electricity and Magnetism, 3rd ed., vol. 2. Oxford: Clarendon, 1892, pp.68–73.
[11] I. S. Jacobs and C. P. Bean, “Fine particles, thin lms and exchange anisotropy,” in Magnetism, vol. III, G. T. Rado and H. Suhl, Eds. New York: Academic, 1963, pp. 271–350.
[12] K. Elissa, “Title of paper if known,” unpublished.[13] R. Nicole, “Title of paper with only rst word capitalized,” J.
Name Stand. Abbrev., in press.[14] Y. Yorozu, M. Hirano, K. Oka, and Y. Tagawa, “Electron
spectroscopy studies on magneto-optical media and plastic substrate interface,” IEEE Transl. J. Magn. Japan, vol. 2, pp. 740–741, August 1987 [Digests 9th Annual Conf. Magnetics Japan, p. 301, 1982].
[15] M. Young, The Technical Writer’s Handbook. Mill Valley, CA: University Science, 1989.

63Volume 11, Issue 1 • January-June 2020
Abstract—The advancements achieved in the eld of Information and Communication Technology (ICT) has its implications in almost all the elds known and Education is one of them. Education is itself referred to as a communication process, so the progress in ICT has proven to be playing an essential supportive role for the same. Higher Education is education, training and research guidance taking place at the post-secondary level. And at this level, the student is expected to understand higher-order concepts which are many times hard to assimilate. The use of ICT proposes various ways to simplify the approach. ICT helps in increase in the speed of learning, consistent instruction, higher and strengthened understanding, effective evaluation, simpli ed training management, obtaining ef cient output and similar other bene ts. But dealing related issues, on the other hand, is equally important. Ensuring the quality of content, attitudes of teachers and students, lack of technical support and cost are the major issues of ICT in educational implementation. Making Arti cial Intelligence compatible with educational needs and making it able for emotion-involved communication is the main future challenge. Level of ICT awareness and continuous development of the ICT tools for educational implementation is must for the ICT enabled learning to grow in higher education. Educators are required to be aware of the effective use of ICT which ensures the highest level of mental development of the students so that their mental growth is not disturbed because it is easy to represent the content applying visual technology but that does not let the student-run his mind for conceptualization. That is why proper training programs focusing especially on this issue are required to be conducted by the respective authorities. The research article mainly focuses upon all these issues and challenges and propose effective solutions. Keywords—ICT, Higher Education, Challenges and Solutions, Arti cial Intelligence.
I. INTRODUCTION
Information and Communication Technologies (ICT) have brought us in a new world which is now referred to
as a small village. Quick and easy access to knowledge has given us the opportunity to develop ourselves. It has implications in almost all the elds including education. But education which is itself referred to as a communication process is yet to adapt to the highest possible and optimal level of Information and Communication Technologies. Especially, higher education where concepts are to be developed in-depth and visualization are necessary. This research article mainly discusses the issues, challenges and solutions for the advanced development of ICT for educational implications at a higher level.
II. OBJECTIVES OF THE STUDY
To understand the concept of Information and Communication Technologies (ICTs)To conceptualize the need for ICT in the Indian scenarioTo identify the issues and challenges in the implementation of ICTs in the educational systemTo think of possible solutions after the analysis of issues and challenges
III. LITERATURE REVIEW
In order to understand the development made on the issues, challenges and solutions for the implementation of ICT programs in higher education, the related researches have been studied, the review of which is given below:Pegu (2014) in his study “Information and Communication Technology in Higher Education in India: Challenges and Opportunities” [21] examined the role of ICT in higher education in India. The study reported poor penetration of ICT programs in higher education and also due to the lingual diversities there are needs to create content in local/regional languages. Further, there are tremendous opportunities as these programs have high potential to achieve expected learning outcomes ef ciently.Chandha (2015) in her study titled “ICT & Present Classroom Scenario” [4] presented her opinion on technological learning tools for learning. She described
ICT in Higher Education: A Review of Issues, Challenges and Solutions with Special Reference to India
Mohit Dixit#1, Lovish Raheja#2
#Parishkar College of Global Excellence, Shipra Path, Mansarovar, Jaipur, University of Rajasthan, Jaipur, [email protected], [email protected]

64 IITM Journal of Management and IT
various ways to incorporate ICTs to the mainstream of classroom teaching and tried to ensure a positive approach towards the successful implementation of ICTs and suggested practical ideas to do so. Deol (2015) in his research work on “Effectiveness of CAI Programs on the Achievement in Teaching of Social Studies” [5] tried to nd out the effectiveness of Computer Assisted Instruction (CAI) programs on the achievement in the teaching of social studies. He took a sample of 50 students (both male and female) of 9th class of Sant Sundar Singh Public School of district Ludhiana (Punjab). He finalized the sample by conducting the Standard Progressive Matrices Test (developed by Raven) and the students whose scores were falling on average were taken. Then he randomly selected 14 students in the control and experimental group each and then conducted his research. He found that after the treatment of the CAI program to the experimental group, achievements of the experimental group were higher as compared to the control group. This implies that ICT programs had helped in better understanding of the content.Kaur (2015) in her study titled “ICT Culture in Teacher Education” [14] found that the transformation to technology embedded classrooms requires the transformation of teacher-training. Making student-educators aware of ICTs and assure their compatibility to innovative technologies, she suggested various types of inputs in teacher training such as knowledge of basic hard drive skills, understanding system software, using multimedia, introduction to open-source software, and social, legal, ethical and health issues etc. which worth implementation in teacher-training programs.Sandhu (2015) in her study titled “Integration of ICT in Teacher Education” [24] focused on the issues and concerns related to the integration of ICT in teacher education program. She arose a major issue that making teachers comfortable with innovative technologies is one of the major concerns to be considered as their comfortability will help integrate ICTs to the classroom teaching. For this purpose, teacher education should be transformed in order to prepare the teachers for changing scenarios.Girish & Sureshkumar (2017) in their study “ICT in Teaching-Learning Process for Higher Education: Challenges and Opportunities” [9] focused on the challenges and opportunities for implementing ICT in the classroom for teaching and learning process. They also concentrated on the circumstances which are needed to be converted in order to achieve the full potential of ICT programs for better teaching-learning. They found various challenges such as expensive cost, lack of
essential infrastructure required for the complex operation of ICT enabled tools for learning, and unful llment of basic needs like electric supply, etc. But ultimately there are opportunities for implementation of ICTs as the learning outcomes with their help have improved signi cantly.
MEA NIN GS OF ICT A ND HIGHE R EDUCATION
ICTs are de ned by various institutions and scholars as follows:According to the United Nation Development Program, “ICTs are basically information-handling tools - a varied set of goods, applications and services that are used to produce, store, process, distribute and exchange information.” (UNDP cited in [3])According to Blurton (2002), ICT is de ned as “a diverse set of technological tools and resources to communicate, create, disseminate, store, and manage information.”According to Ifueko Omoigui Okauru, “ICT is the digital processing and utilization of information by the use of electronic computers. It comprises the storage, retrieval, conversion and transmission of information.” [17]Basically, “ICT can be referred to as a set of developing technologies which exist for the purpose of different operations to the information involving communication. These operations include storage, dissemination, creation, management, conversion, retrieval etc.”In the World Conference on Higher Education in 1998 the adopted de nition of higher education as follows, “Higher education comprises all post-secondary education, training and research guidance at educational institutions such as universities that are authorized as institutions of higher education by state authorities.” (World Declaration on Higher Education, 1998)At this stage of education, students have to choose their respective eld of specialization which requires a higher conceptualization than the past. One should have a strong basis to proceed further in his career to achieve a better status in society. Presently, the number of higher education institutions is increasing rapidly. As per the UGC gures (2018), there were total 851 universities/institutions and 244 institutions/universities eligible for central assistance in March 2018 including central, state, state private universities and institutions established through state legislation, and deemed to be universities institutions as gured below (from UGC annual report 2017-18) [1]:

65Volume 11, Issue 1 • January-June 2020
But the main problem is that technological advancements are not as progressive as the number of institutions. Ultimately, we are going toward the increment in quantity and decrement in quality as quality education involves contemporary perspectives being up to date is an essential component of that.The quality of higher education is directly related to vanishing the backwardness of society. The use of ICT eventually improves that quality.
THE NEED OF ICT
The main issue is that all systems have gone through a positive change after the industrial revolution and the development of ICT but educational system have not gone through such effective revolutions. The basic constitution of the classrooms has been the same for the years. The student to teacher ratio is on the peak this time which is one of the main reasons of quality degradation. Now ICT is unanimously helpful in this case, development of personal interaction through arti cial intelligence, 24 x 7 learning because “doubts of 40 students cannot be solved in the 60 minutes of class.” Many private start-ups have emerged for this purpose and are quite successful but this common problem has not got a proper formal response from the government authorities and educational institutions. Though NPTEL and SWAYAM, and e-PG Pathshala are some of the ICT-based schemes of the government for quality higher education [1]. Systems need more advancements. Still, a common student does not have access to much of the authorised content. This is needed to be changed. ICTs are also found to be motivating tools as young minds today are captivated by the new technologies. Also, it promotes co-operative and faster learning, encourages to reach the full potential of the learning and to gain wider reader-base and attention etc. [10]The components of quality education involve the factors related to learners, teachers, environment and the tools
used. Though ICTs are ultimately a tool, these have impacts on the whole system. Their effective use engages the classroom, prevents classroom study to be one-sided, increases and solves the curiosities of the students, make a better and controlled environment. Integration of ICT in Higher Education involves the quality up-gradation of teaching, learning, administration and academic research. Conducting fruitful seminars, management development programs, fast and secure academic activities and transparency are some of the major outcomes of this integration. Also, psychologically the sensory approach used in ICTs is effective to a very high extent, the major element of which is visualisation. [9]. This makes learning fast as well as of great quality.Adam and Cross (cited in [19]) have talked about 4 major rationales of introducing ICTs in education which is classi ed into social, vocational, catalytic and pedagogical. Basically, these are the implicative elds of ICTs. For better social living and lifestyle, one needs to have ICT related skills due to the advanced and deep approach of ICTs in common usages. Further, currently, almost all sectors of the profession are imbibed by the use of ICTs, that is why from the purpose of vocational development the involvement of ICTs is a must. As mentioned earlier the processing through ICTs are faster than the traditional methods which means they allow smooth and rapid processing of administrative and learning activities. Another important aspect is pedagogical advancements as one can use audio-visual aids and mainstream teaching methodologies, projectors etc. for better learning outcomes and conceptual understandings, all as a part of it.In a report prepared by NITI Ayog [26], various bene ts of the ICT have been identi ed which are: instant access to the knowledge for the development of wide sense of understanding, helpful in the customization of the teaching material as per the needs of the students, awakening of the motivation to learn, respecting individual differences, capturing the attention of the students for a longer span of time, formation of a disciplined classroom-environment, etc. Phutela and Dwivedi in their study found [27] that e-learning enhances the interest towards and speed of students’ learning. Students’ become eager to learn especially in a group task.As it is well known that the goal of education is to develop and open our minds, it is not just the super cial learning of concepts. For this purpose, the use of ICTs is to be utilized. Otherwise, we will end up with the student who knows and understands a lot but does not have the problem-solving skills. This is one of the major reasons why many educators have a negative attitude towards

66 IITM Journal of Management and IT
ICT. So, now we list major issues in the implications of ICT in educational programs-
MAJOR ISSUES
The concern of the quality of content prevents one to go online for learning. As said earlier the authorised content has less accessibility in the lack of which misconceptions take place due to which reliability and validity of the accessible content are less.The cost of ICT programs is not necessarily less expensive to purchase or implement than traditional face-to-face learning. [2]Lack of Technical Awareness causes a low con dence level to use online systems. [12]The traditional curriculum framework is not suitable for ICT implications.There is a possibility that advanced use of ICT would cause the Identity Crisis of the teacher.Lack of creative skills for content designing makes the learning boring. [22]Overlooking the cultural and local point of view also hinders ICT’s optimal approach. [7]Language barrier as most of the content available is in English. [16]ICT Tools’ unsuitability to the students with disabilities is an alarming concern. Accomplishing their needs is equally important for bringing inclusiveness and for the pursuance of the goal of development for all.Online learning sometimes causes communication obstacles. [6]Lack of coordination between the executive committees and individuals is also a hindrance. [15]The radiation caused by the currently accessible ICT tools is very dangerous which is harmful to students’ health. [13]Lack of proper training programs for teachers and students.Venkatesh and Davis (cited in [8]) identify the key factors as external variables, perceived usefulness, perceived ease of use, attitude towards use, behavioural intention and social in uence processes which affect the decision of way of the usage of technologies when presented before the teacher. The factors mentioned are also relevant in the present context. External variables include limitations of accessibility, infrastructure, time, training systems, and lack of teacher’s competencies. Perceived usefulness basically refers to those factors which let the
teacher believe in the use of technologies such as job performance, effectiveness, increase in productivity etc. Perceived ease of use includes the understandability, easiness to use, controllability etc. Other factors are related to the individual and social aspects of the teacher. The environment he/she is surrounded by plays an important role and his/her personal views at the same time is important for the proper execution of the technological programs.The fear of technology has also its own consequences resulting in ignorance of the technological upliftment by the educators.A study by Nakaznyi, Sorokina, and Romaniukha [20] identify the insuf ciently developed system of incentives for implementation of information and insufficiently developed regulations for the use of electronic tools in its local research but these issues can also be observed in Indian context as well.Kundu et al. [25] also list some of the very essential issues in their study which are: lack of trained teachers, lack of knowledge for the integration of ICT with school and higher education curriculum, poor administrative support, nancial issues, time-management related problems, lack of the required infrastructure etc.
IV. C H A L L E N G E S ( O B J E C T I V E S F O R M AT I O N T H R O U G H I S S U E S IDENTIFIED)
To increase the number of authorised portals for improving the quality of learning.To promote quality and productive research for direct implementation in the classrooms and gradually applying ideas to reduce the cost.To run accessible and interactive training programs for students and educators.To modify the curriculum framework with respect to contemporary knowledge and make it adaptable to the ICT.To create more and more content in local languages for the preservation of cultural values.To make the authorised content in clear and simple language to avoid miscommunication.To ensure that the use of ICT would involve the human instructor as “emotions” have their unexcelled importance in learning and current technologies have not yet been optimised for emotional interaction.To provide health-related instructions to the users.To structure an integrated authority which monetises all
67Volume 11, Issue 1 • January-June 2020
the factors affecting the grassroots level execution of ICTs and working as an assistant body of the government in ICTs specialization.To develop positive intent towards the use of technologies and innovative approaches among the students and educators.To de ne the role of a teacher in a proper manner while using ICTs (UNESCO cited in [11]).To prepare the students for being new educational agents (Cabero cited in [11]).
SOLUTIONS (AN ANALYTIC APPROACH TO THE CHALLENGES)
Governments need to take initiatives for the creation of the right knowledge. Several conferences and meetings can be organized for this purpose. The international communities like UNESCO may work on the subject contents of global knowledge. Quick up-gradation of global knowledge if possible, through the international level, would bene t a lot and make students a lifelong learner.Research cells should be developed at the most possible micro-levels to encourage young minds and introducing their new ideas of the use of ICTs in educational practices in economic and advanced ways. These research cells may be working under the direct supervision of central or state government authorities. The innovations and ideas proposed by these cells must be taken into consideration. If found useful, these should be promoted for further investigations and advanced research in higher research authorities.Students should be provided proper training for the basic knowledge of ICTs and these pieces of training should be properly reviewed time to time and the curriculum of these pieces of training must be compatible as per the modern needs. They should have a basic introduction not only to the operation of the computer but to the other concepts such as e-business, e-marketing, e-commerce, e-library etc.Teachers and educators’ training are needed to be done in a special manner. Making them technically aware and Training them for effective content delivery, developing the brains of the students are essential. An attitude test must be conducted so to analyze their attitude towards innovative approaches.A team of experts should be constituted which keep analyzing the current curriculum framework from ICT perspectives constantly and give their recommendations to the respective authorities.Local language development organizations should be
framed inside and outside the educational institutions and second/foreign language development skills should be geared up [18].Curriculum design may be done at the institutional level speci cally related to the ICTs in order to have con dent and competent teaching of the subjects [18]. Respect for the teacher must be maintained. Teachers should be using ICT as a supportive tool and not take or understand it as their replacement. Lifestyle teaching should be involved in the curriculum.The constitution of a pace-setting unit has been proposed in prior research. [23] This is basically a controlling, coordinating and execution committee consisting of the experts of many elds which would monitor global advancements in the eld and implement in the country.The educational environment should be designed in such a manner that innovative approaches can be appreciated by both the students and educators.The role shifts of teachers and students can be identi ed as follows. As ICTs make the learning learner-centred which implies it is no more a single-pole concept, the teacher is no more a primary source of information, instead, he/she should take himself/herself as a facilitator of knowledge and a co-learner and let students realize their responsibility by themselves. The student should be active in learning and should develop the expertise of knowledge by himself/herself whenever possible. (Newby cited in [21])
V. CONCLUSION
Higher education is a very important subject to any country as it develops the realization of citizenship and most part of the working force serving the nation. Presently, higher education systems are growing rapidly. To ensure the quality along with quantity it is important to involve innovative approaches and technological advancements in the educational system. ICT is being implemented in all the elds including education. But the implementation of ICT in education is comparatively slow due to the issues mentioned in the article. The increasing use of information and communication technologies (ICTs) has brought changes to teaching and learning at all levels of higher education systems leading to quality enhancements. There are endless possibilities with the integration of ICT in the higher education system. The use of ICT in higher education not only improves classroom teaching-learning process but also provides the facility of e-learning. ICT has enhanced distance learning. The teaching community is able to reach remote areas and learners are able to access qualitative learning environment from anywhere

68 IITM Journal of Management and IT
and at any time. It is important that teachers or trainers should be made to adopt technology in their teaching styles to provide pedagogical and educational gains to the learners. Successful implementation of ICT to lead change is more about in uencing and empowering teachers and supporting them in their engagement with students in learning rather than acquiring computer skills and obtaining software and equipment. Innovative technologies promote quality of education but their implementation is not always easy. We need to take the note of issues, conceptualize challenges and think of possible solutions. This has been tried in this research article. Basically, the solutions lie in the positive attitude towards the new.
REFERENCES[1] “Annual Report 2017-18”, University Grants Commission, New
Delhi, December 2018.[2] M.K. Arora, “E-learning: Issues and Future Perspectives”,
E-Learning: A Boom or Curse, Twenty First Century Publications, Patiala, 2015 ISBN: 9789380748870.
[3] S.H. Budhedeo, “Issues and Challenges in Bringing ICT Enabled Education to Rural India”, International Journal of Science Research and Education (IJSRE) Vol. 4 Iss. 1 January 2016
[4] S. Chandha, “ICT & Present Classroom Scenario, Effectiveness of CAI Programs on the Achievement in Teaching of Social Studies”, E-Learning: A Boom or Curse, Twenty First Century Publications, Patiala, 2015. ISBN: 9789380748870
[5] G.K. Deol, “Effectiveness of CAI Programs on the Achievement in Teaching of Social Studies”, E-Learning: A Boom or Curse, Twenty First Century Publications, Patiala, 2015. ISBN: 9789380748870
[6] S. Dhillon, “Issues and Challenges in E-learning”, E-Learning: A Boom or Curse, Twenty First Century Publications, Patiala, 2015. ISBN: 9789380748870.
[7] M. Dixit, B. Singh, “E-learning in India: Advantages, Disadvantages and Challenges”. E-Learning: A Boom or Curse, Twenty First Century Publications, Patiala, 2015. ISBN: 9789380748870
[8] S. Ghavifekr, T. Kunjappan, L. Ramasamy, A. Anthony, “Teaching and Learning with ICT Tools: Issues and Challenges from Teachers’ Perceptions”, Malaysian Online Journal of Educational Technology, Vol.4 Iss. 2, 2016.
[9] SR Girish, C. Suresh Kumar, “ICT in Teaching-Learning Process for Higher Education: Challenges and Opportunities.” IOSR Journal of Computer Engineering (IOSR-JCE) 19.4 (2017): pp. 24-28.
[10] H. Habib, “Role of ICT in Higher Education, International Journal of Creative Research Thoughts (IJCRT), Vol. 5, Iss. 4, December 2017.
[11] R.M. Hernandez, “Impact of ICT on Education: Challenges and Perspectives”. Propósitos y Representaciones, 5(1), 325- 347. DOI: http://dx.doi.org/10.20511/pyr2017. v5n1.149
[12] M.L Jaidka, Babita, “Challenges and Perspectives in E-Learning”, E-Learning: A Boom or Curse, Twenty First Century Publications, Patiala, 2015. ISBN: 9789380748870
[13] K. Kaur, “Challenges in E-learning”, E-Learning: A Boom or Curse, Twenty First Century Publications, Patiala, 2015. ISBN: 9789380748870
[14] N. Kaur, “ICT Culture in Teacher Education”, Transforming Teacher Education in Changing Scenario, Twenty First Century Publications, Patiala. ISBN: 9789380748856
[15] P. Kaur, “E-learning: Concept, Issues and Solutions in Indian Higher Education System”, E-Learning: A Boom or Curse, Twenty First Century Publications, Patiala, 2015. ISBN: 9789380748870
[16] R. Kaur, “Challenges and Perspectives in E-learning”, E-Learning: A Boom or Curse, Twenty First Century Publications, Patiala, 2015. ISBN: 9789380748870
[17] S. Mathur & C.P. Paliwal, “Critical Understanding of ICT”, Thakur Publications, Jaipur. ISBN: 9789386488008.
[18] K. Matyokurehwa, “Challenges faced in Implementing ICT in Higher Learning Institutions”. A Botswana perspective, International Journal for Infonomics (IJI), Vol. 6, Issues 1/2, March/June 2013.
[19] A. Mondal, J. Mete, “ICT in Higher Education: Opportunities and Challenges”, Bhatter College Journal of Multidisciplinary Studies, (ISSN 2249-3301), Vol. II, 2012. Ed. Pabitra Kumar Mishra.
[20] M. Nakaznyi, L. Sorokina, & M. Romaniukha, “ICT in Higher Education Teaching: Advantages, Problems, and Motives”, International Journal of Research in E-learning Vol. 1(1), pp 49-61.
[21] U. Pegu, “Information and Communication Technology in Higher Education in India: Challenges and Opportunities”, International Journal of Information and Computation Technology, ISSN 0974-2239 Vol. 4, No. 5 (2014), pp. 513-518.
[22] A. Puri, “Challenges and Perspective in E-Learning”, E-Learning: A Boom or Curse, Twenty First Century Publications, Patiala, 2015.
[23] L. Raheja, “ICT for Students and Educators, ICT for Education: A Few Concepts and Researches, New Delhi Publishers. ISBN: 9789386453433.
[24] N .K. Sandhu, “Integration of ICT in Teacher Education”, Transforming Teacher Education in Changing Scenario, Twenty First Century Publications, Patiala. ISBN: 9789380748856.
[25] A. Kundu & D.K. Nath, “Barriers to Utilizing ICT in Education in India with a Special Focus on Rural Areas”, International Journal of Scienti c Research and Reviews (IJSRR), 2018, Vol. 7 Issue 2, pp. 341 -359.
[26] “Use of Information and Communication Technology in Secondary Schools”, Study Commissioned by NITI Ayog, Government of India, New Delhi, June 2019.
[27] N. Phutela, & S. Dwivedi, “Impact of ICT in Education: Students’ Perspective” (April 24, 2019). Proceedings of International Conference on Digital Pedagogies (ICDP) 2019.

69Volume 11, Issue 1 • January-June 2020
Abstract—In modern age, technology has dominated our life so deeply that libraries have shrunk to computer servers and playgrounds have shrunk to gaming consoles. The latter has in uenced the mind and body. Present study which is based on the method of questionnaire surveys young people who have been playing computer games. Here we attempt to nd out if there is any positive or negative impact on the mental concentration power of the gamers. It has been found that there is a positive effect on the power of concentration, but signs are also there of the other way round. Within the limits of this study, it shows some direction for further studies.
Keywords—Video Games, Mental, Cognitive, Neuro, eye-hand-coordination
I. INTRODUCTION
Performance requires mental concentration where the mental concentration is a mental process performed in the brain and re ected in thought process of mind. Our brain is made up of billions of neurons which gather and transmit signals which originate our thoughts and motor functions. The cerebral cortex is the part of the brain where our memory, thought, attention, awareness, and consciousness base. [1]Brain process is nothing but like input-output processing of the computer. Our brain receives and processes the sensory data, and this is transformed into the thought. This process is related to the IQ level, emotive stability and the neurons in the brain are restructured with practise. It can be said that if any one person has a high level of concentration, their intelligence level would also likely be high. Attention, focus, thought, and concentration are interdependent. Without one, it would be dif cult to utilize the others.This study is an attempt to reach a conclusion by conducting a questionnaire-based survey from the respondents.Since this study has been focussing upon the impact of gaming on the mental concentration ability of the
player, the aspects which has been touched upon may be summarised as [2] –• Value attentiveness• Live in the now• Be more aware• Notice the little things • Set goals, and monitor your progress• Identify your targets of attention• Shut out distractions• Fight boredom• Make emotion work for you• Practice attentiveness
II. LITERATURE REVIEW
Video games are electronic games that provide an entertaining way to escape from reality. It has been found that video games can have many bene ts, it changes your brain, according to University of Wisconsin psychologist C. Shawn Green. It alters the brain’s structure in the same manner as it occurs in learning, navigation using a map, or playing a musical instrument. For example, in shooting games like PubG, the character may be running and shooting at the same time. This requires a multifaceted task like a real-world player. It requires to keep track of the position of the character, where he or she is heading, speed, aiming the enemy, looking for the enemy and saving himself and so on. These are some factors once taken into account, the player must then coordinate the brain’s activity to evaluate the situation and then react through the movement in his hands and ngertips. This method requires a great deal of eye-hand coordination and visual-spatial capability to succeed.” [3]It is also said that playing video have only harmful effects on an individual and ignore the positive effects it showcases.According to a study, action shooter games have a solid and powerful effect on the brain. The ability of a player to
Effects of Video Games on Mental Concentration Shriya Pandey
Birla Institute of Technology, Mesra, Noida, [email protected]
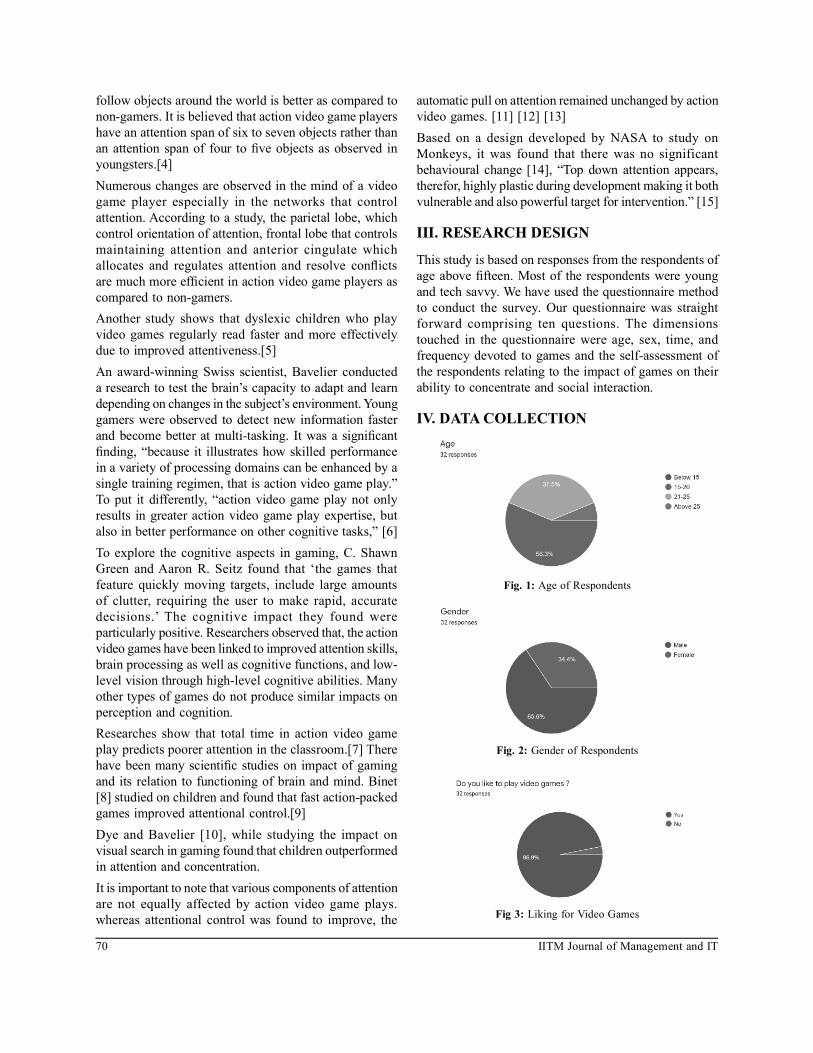
70 IITM Journal of Management and IT
follow objects around the world is better as compared to non-gamers. It is believed that action video game players have an attention span of six to seven objects rather than an attention span of four to ve objects as observed in youngsters.[4]Numerous changes are observed in the mind of a video game player especially in the networks that control attention. According to a study, the parietal lobe, which control orientation of attention, frontal lobe that controls maintaining attention and anterior cingulate which allocates and regulates attention and resolve con icts are much more ef cient in action video game players as compared to non-gamers.Another study shows that dyslexic children who play video games regularly read faster and more effectively due to improved attentiveness.[5]An award-winning Swiss scientist, Bavelier conducted a research to test the brain’s capacity to adapt and learn depending on changes in the subject’s environment. Young gamers were observed to detect new information faster and become better at multi-tasking. It was a signi cant nding, “because it illustrates how skilled performance in a variety of processing domains can be enhanced by a single training regimen, that is action video game play.” To put it differently, “action video game play not only results in greater action video game play expertise, but also in better performance on other cognitive tasks,” [6]To explore the cognitive aspects in gaming, C. Shawn Green and Aaron R. Seitz found that ‘the games that feature quickly moving targets, include large amounts of clutter, requiring the user to make rapid, accurate decisions.’ The cognitive impact they found were particularly positive. Researchers observed that, the action video games have been linked to improved attention skills, brain processing as well as cognitive functions, and low-level vision through high-level cognitive abilities. Many other types of games do not produce similar impacts on perception and cognition. Researches show that total time in action video game play predicts poorer attention in the classroom.[7] There have been many scienti c studies on impact of gaming and its relation to functioning of brain and mind. Binet [8] studied on children and found that fast action-packed games improved attentional control.[9]Dye and Bavelier [10], while studying the impact on visual search in gaming found that children outperformed in attention and concentration.It is important to note that various components of attention are not equally affected by action video game plays. whereas attentional control was found to improve, the
automatic pull on attention remained unchanged by action video games. [11] [12] [13]Based on a design developed by NASA to study on Monkeys, it was found that there was no significant behavioural change [14], “Top down attention appears, therefor, highly plastic during development making it both vulnerable and also powerful target for intervention.” [15]
III. RESEARCH DESIGN
This study is based on responses from the respondents of age above fteen. Most of the respondents were young and tech savvy. We have used the questionnaire method to conduct the survey. Our questionnaire was straight forward comprising ten questions. The dimensions touched in the questionnaire were age, sex, time, and frequency devoted to games and the self-assessment of the respondents relating to the impact of games on their ability to concentrate and social interaction.
IV. DATA COLLECTION
Fig. 1: Age of Respondents
Fig. 2: Gender of Respondents
Fig 3: Liking for Video Games

71Volume 11, Issue 1 • January-June 2020
Fig. 4: Types of Games Played
Fig. 5: How Often Played
Fig. 6: Changes in Concentration
Fig. 7: Changes in Power of Attention
Fig. 8: Change in Attitude Towards the Society
Fig. 9: Is it Bene cial for concentration?
Table I: C hange in concentration power
Age Group Frequency Yes No Maybe
Below 15 0 0 0 0
15-20 18 10 3 5
20-25 12 7 3 2
Above 25 2 0 1 1
Total 32 17 7 8
Table II: Improvement in attention power
Age Group Frequency Yes No Maybe
Below 15 0 0 0 0
15-20 18 12 2 4
20-25 12 8 0 4
Above 25 2 1 1 0
Total 32 21 3 8
Table III: Change in behaviour towards society
Age Group Frequency Yes No Maybe
Below 15 0 0 0 0
15-20 18 6 5 7
20-25 12 9 3 0
Above 25 2 1 0 1
Total 33 16 8 8
Table IV: Beneficial or causing difficulty for concentration power
Age Group Frequency Bene cial Dif culty
Below 15 0 0 0
15-20 18 12 6
20-25 12 9 3
Above 25 2 0 2
Total 30 21 11
V. CONCLUSION
For this study, a questionnaire method was adopted for data collection. A total fty questionnaire were distributed by e-mail out of which only thirty-two responded. As our study relates to technology and above all with gains, the respondents were chosen to be youngsters generally below the age of thirty years. Data so collected has been presented in tables (1),(2),(3) and (4) in which table (1) focuses on change in concentration power, table (2) focuses on improvement in attention power, table (3) focuses on change in behaviour towards society and table (4) focuses on whether it is bene cial or causing for concentration power. Our sample size even at thirty-two cannot be considered as a small sample. Even then the
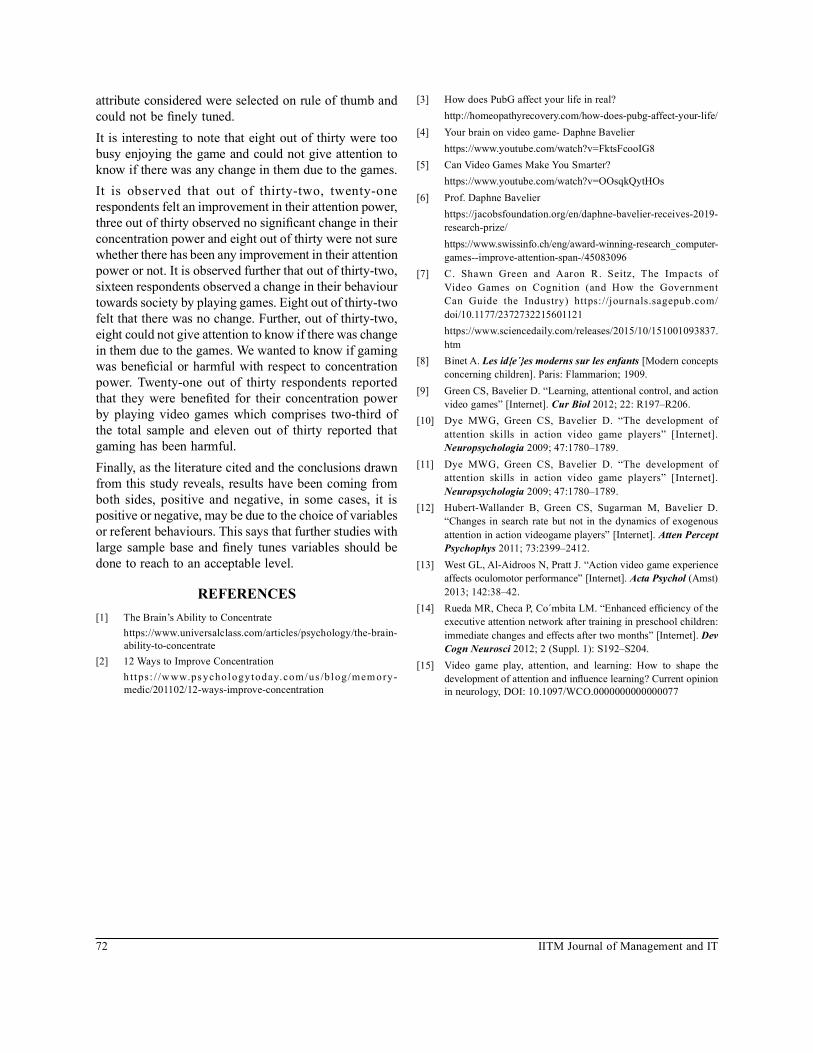
72 IITM Journal of Management and IT
attribute considered were selected on rule of thumb and could not be nely tuned.It is interesting to note that eight out of thirty were too busy enjoying the game and could not give attention to know if there was any change in them due to the games.It is observed that out of thirty-two, twenty-one respondents felt an improvement in their attention power, three out of thirty observed no signi cant change in their concentration power and eight out of thirty were not sure whether there has been any improvement in their attention power or not. It is observed further that out of thirty-two, sixteen respondents observed a change in their behaviour towards society by playing games. Eight out of thirty-two felt that there was no change. Further, out of thirty-two, eight could not give attention to know if there was change in them due to the games. We wanted to know if gaming was bene cial or harmful with respect to concentration power. Twenty-one out of thirty respondents reported that they were bene ted for their concentration power by playing video games which comprises two-third of the total sample and eleven out of thirty reported that gaming has been harmful.Finally, as the literature cited and the conclusions drawn from this study reveals, results have been coming from both sides, positive and negative, in some cases, it is positive or negative, may be due to the choice of variables or referent behaviours. This says that further studies with large sample base and nely tunes variables should be done to reach to an acceptable level.
REFERENCES[1] The Brain’s Ability to Concentrate https://www.universalclass.com/articles/psychology/the-brain-
ability-to-concentrate[2] 12 Ways to Improve Concentration h ttps: / /w ww.ps ychologytoday.com/us /b log/mem ory-
medic/201102/12-ways-improve-concentration
[3] How does PubG affect your life in real? http://homeopathyrecovery.com/how-does-pubg-affect-your-life/[4] Your brain on video game- Daphne Bavelier https://www.youtube.com/watch?v=FktsFcooIG8[5] Can Video Games Make You Smarter? https://www.youtube.com/watch?v=OOsqkQytHOs[6] Prof. Daphne Bavelier https://jacobsfoundation.org/en/daphne-bavelier-receives-2019-
research-prize/ https://www.swissinfo.ch/eng/award-winning-research_computer-
games--improve-attention-span-/45083096[7] C. Shawn Green and Aaron R. Seitz, The Impacts of
Video Games on Cognition (and How the Government Can Guide the Industry) https://journals.sagepub.com/doi/10.1177/2372732215601121
https://www.sciencedaily.com/releases/2015/10/151001093837.htm
[8] Binet A. Les id{e´}es moderns sur les enfants [Modern concepts concerning children]. Paris: Flammarion; 1909.
[9] Green CS, Bavelier D. “Learning, attentional control, and action video games” [Internet]. Cur Biol 2012; 22: R197–R206.
[10] Dye MWG, Green CS, Bavelier D. “The development of attention skills in action video game players” [Internet]. Neuropsychologia 2009; 47:1780–1789.
[11] Dye MWG, Green CS, Bavelier D. “The development of attention skills in action video game players” [Internet]. Neuropsychologia 2009; 47:1780–1789.
[12] Hubert-Wallander B, Green CS, Sugarman M, Bavelier D. “Changes in search rate but not in the dynamics of exogenous attention in action videogame players” [Internet]. Atten Percept Psychophys 2011; 73:2399–2412.
[13] West GL, Al-Aidroos N, Pratt J. “Action video game experience affects oculomotor performance” [Internet]. Acta Psychol (Amst) 2013; 142:38–42.
[14] Rueda MR, Checa P, Co´mbita LM. “Enhanced ef ciency of the executive attention network after training in preschool children: immediate changes and effects after two months” [Internet]. Dev Cogn Neurosci 2012; 2 (Suppl. 1): S192–S204.
[15] Video game play, attention, and learning: How to shape the development of attention and in uence learning? Current opinion in neurology, DOI: 10.1097/WCO.0000000000000077

73Volume 11, Issue 1 • January-June 2020
Abstract—Information and communication Technology (ICT) have change the state of life from the last few years because many activities of daily life have been merged online and they become more productive. Cryptocurrency is specific type of virtual currency which works on the principles of cryptography and electronic medium communication. It gain lots of attention in the recent years. Cryptocurrency has decentralized control and is controlled by non-government bodies. It opposes the centralized digital currency and central banking system because of its decentralized feature. It revolutionizes the digital trade market by creating a free ow trading system which works without any third party. The usage of virtual money or currency has widespread in recent years. this paper highlight the introduction of cryptocurrency, its history, some aspects of it,working of cryptocurrency and also highlight the future of cryptocurrency in India. Keywords—Cryptocurrency, Bitcoin, cryptography, decentralize, centralized, digital currency
I. INTRODUCTION
There is no doubt that this is an era of information and communication technologies because of which many opportunities have been created. Financial and business sector are one of the biggest Sector which took the bene ts from this technology. A large number of online users have activated virtual world concepts and creating a new business phenomenon, a result of this new type trading the transactions and currencies have been arising. One of the biggest nancial forms that have been emerged in past few years is Cryptocurrency. It is a digital currency created with controlling its creation and protecting transactions, with hiding the identity of the user (Jani, 2018). Cryptocurrency is the combination of crypto and currency. Crypto- is short form of “cryptography”, computer technology which is used for security, hiding information, identities. Currency simple means “money mostly in use”. It is a digital form of cash which is designed to work faster, to provide more reliability and to be cheaper than our government issued money or the legal tender.
The basic principle of cryptocurrency is that no individual or organization may control the production of a given currency. The certain pre de ned amount of cryptocurrency is produced by the entire cryptocurrency system. The rate of production is set by a value de ned earlier and is publically known. It provides the permission to transfer the virtual costless cryptocurrency units which also called coins between client applications through peer to peer network (Vejacka, 2014). Instead of trusting a government to create your money and banks for storing, sending, receiving money users transact directly with each other without any intermediate (government) between them and they can store their money themselves. As peoples can directly send, for the purpose of prevention from fraud and manipulation, every user of a cryptocurrency can simultaneously record and verify their own transactions and others transactions as well. Ledger is very well known by the commerce students and even it is known by many of us. Cryptocurrency also used the ledger to store the digital transaction records and it is publicly available to everyone, means anyone can verify the transactions which is done by others. With this public ledger transactions become secure, transparent, ef cient and permanent. With the help of this ledger, user don’t need to trust a bank to hold cryptocurrency and also don’t require to trust the person with user doing the business to actually pay to user. Instead user can see by them the money being sent, received, veri ed and recorded by thousands of people. This system not required a middleman for transactions and transactions are usually very affordable and fast (Li & Wang, 2016).It was mostly used to do illegal deals by drug dealers, smugglers and black marketers for the transaction of their funds as it is the safest, untraceable and fastest method to do all over the world (Kashyap & Chand, 2018).Characteristics of Cryptocurrency technology platform (Thackeray, 2018): Irreversible: After confirmation of transaction, a transaction cannot be reversed.
A Brief Survey of Cryptocurrency SystemsSushma Malik1#, Anamika Rana2*
#Assistant professor (IT), Institute of Innovation in Technology and Management, Janak Puri, New Delhi,India*Assistant professor (IT), Maharaja Surajmal Institute of Technology, Janak Puri, New Delhi, India

74 IITM Journal of Management and IT
Unidenti ed: it works on the decentralized principle, so neither transactions nor accounts are connected to real-world identities. Everything is digitalized with access by means of the internet.
Characteristics of
Cryptocurrency technology
Unidentified
Global Speed
Secure No Gatekeeper
Irreversible
Fig. 1: Characteristics of Cryptocurrency Platform
Global Speed: Transactions are done on the network and are con rmed in a couple of minutes. for veri cation and validation, there are no involvement of third parties.Secure: it become secure with the implementation of strong cryptography algorithms which makes it impossible to break this scheme. No Gatekeeper: Software is freely available for download. After installed anyone can receive and send Bitcoins or other cryptocurrencies.
II. HISTORY OF CRYPTOCURRENCY
The rst cryptocurrency was launched in 2009 named as Bitcoin by Satoshi Nakamoto, Bitcoin was not regulated by a government or institution and no third party was involved, it was open source from peer to peer transfer. This cryptocurrency used blockchain technology.In the 19th century, there have been many attempts to create digital money, but they all failed. After seeing all the failures Satoshi tried to build a digital cash system which is decentralized. Like peer to peer network le sharing (Mukhopadhyay, Skjellum, Hambolu, Oakley, Yu, & Brooks, 2016).
III. BLOCKCHAIN OVERVIEW
The public ledger which stores the transactions of cryptocurrency is called the blockchain. Each and every
transaction is stored in a block and each block consists of variable number of verified transactions. in each cryptocurrency system, the size of block is fixed by providing the upper bound number of transactions. For example the maximum size of bitcoin block is 1MB (Mukhopadhyay, Skjellum, Hambolu, Oakley, Yu, & Brooks, 2016).
Fig. 2: Blockchain
Blocks in n the blockchain are made up of digital pieces of information. Blocks mainly made up of three parts like:1. Block store the transaction related information like
date, time and amount of dollar which user recent purchase.
2. It also stores the user information who did the transaction. it using digital signature of the user instead of user name.
3. Each block store a unique code called a hash that differentiates the block from every other block. Hash is basically the cryptographic codes which created with some algorithms (Reiff, 2020)
IV. TYPES OF CRYPTOCURRENCIES
Types of Cryptocurrencies
Ripple
Zcash
Litecoin Ethereum
Bitcoin
Fig. 3: Types of Cryptocurrency
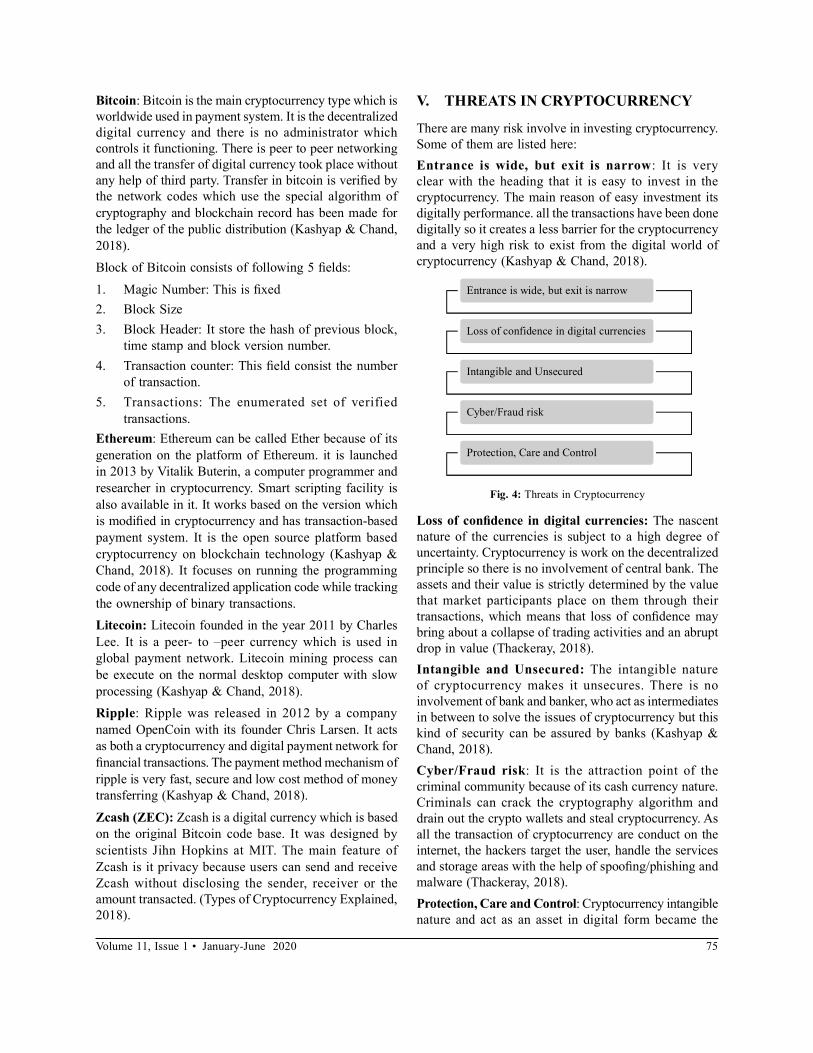
75Volume 11, Issue 1 • January-June 2020
Bitcoin: Bitcoin is the main cryptocurrency type which is worldwide used in payment system. It is the decentralized digital currency and there is no administrator which controls it functioning. There is peer to peer networking and all the transfer of digital currency took place without any help of third party. Transfer in bitcoin is veri ed by the network codes which use the special algorithm of cryptography and blockchain record has been made for the ledger of the public distribution (Kashyap & Chand, 2018). Block of Bitcoin consists of following 5 elds:
1. Magic Number: This is xed2. Block Size3. Block Header: It store the hash of previous block,
time stamp and block version number.4. Transaction counter: This eld consist the number
of transaction.5. Transactions: The enumerated set of verified
transactions. Ethereum: Ethereum can be called Ether because of its generation on the platform of Ethereum. it is launched in 2013 by Vitalik Buterin, a computer programmer and researcher in cryptocurrency. Smart scripting facility is also available in it. It works based on the version which is modi ed in cryptocurrency and has transaction-based payment system. It is the open source platform based cryptocurrency on blockchain technology (Kashyap & Chand, 2018). It focuses on running the programming code of any decentralized application code while tracking the ownership of binary transactions.Litecoin: Litecoin founded in the year 2011 by Charles Lee. It is a peer- to –peer currency which is used in global payment network. Litecoin mining process can be execute on the normal desktop computer with slow processing (Kashyap & Chand, 2018). Ripple: Ripple was released in 2012 by a company named OpenCoin with its founder Chris Larsen. It acts as both a cryptocurrency and digital payment network for nancial transactions. The payment method mechanism of ripple is very fast, secure and low cost method of money transferring (Kashyap & Chand, 2018).
Zcash (ZEC): Zcash is a digital currency which is based on the original Bitcoin code base. It was designed by scientists Jihn Hopkins at MIT. The main feature of Zcash is it privacy because users can send and receive Zcash without disclosing the sender, receiver or the amount transacted. (Types of Cryptocurrency Explained, 2018).
V. THREATS IN CRYPTOCURRENCY
There are many risk involve in investing cryptocurrency. Some of them are listed here: Entrance is wide, but exit is narrow: It is very clear with the heading that it is easy to invest in the cryptocurrency. The main reason of easy investment its digitally performance. all the transactions have been done digitally so it creates a less barrier for the cryptocurrency and a very high risk to exist from the digital world of cryptocurrency (Kashyap & Chand, 2018).
Entrance is wide, but exit is narrow
Loss of confidence in digital currencies
Intangible and Unsecured
Cyber/Fraud risk
Protection, Care and Control
Fig. 4: Threats in Cryptocurrency
Loss of con dence in digital currencies: The nascent nature of the currencies is subject to a high degree of uncertainty. Cryptocurrency is work on the decentralized principle so there is no involvement of central bank. The assets and their value is strictly determined by the value that market participants place on them through their transactions, which means that loss of con dence may bring about a collapse of trading activities and an abrupt drop in value (Thackeray, 2018).Intangible and Unsecured: The intangible nature of cryptocurrency makes it unsecures. There is no involvement of bank and banker, who act as intermediates in between to solve the issues of cryptocurrency but this kind of security can be assured by banks (Kashyap & Chand, 2018).Cyber/Fraud risk: It is the attraction point of the criminal community because of its cash currency nature. Criminals can crack the cryptography algorithm and drain out the crypto wallets and steal cryptocurrency. As all the transaction of cryptocurrency are conduct on the internet, the hackers target the user, handle the services and storage areas with the help of spoo ng/phishing and malware (Thackeray, 2018).Protection, Care and Control: Cryptocurrency intangible nature and act as an asset in digital form became the
76 IITM Journal of Management and IT
biggest issues for the care, control and custody of the cryptocurrency. The experienced investors will provide the security to their cyrptocurrency but who are not aware about the security concerns are become the easily target of the frauds and hackers are easily steal their cryptocurrency (Kashyap & Chand, 2018).
VI. WORKING OF CRYPTOCURRENCY
Blockchain technology makes cryptocurrency a transparent system and a self-run decentralized system. Here, when a transaction is carried out from A to B, then a record of transaction is put on the ledger and the ledger is owned by every user of the cryptocurrency. The record of transaction is put on the ledger after verification process. Veri cation of transactions is done by miners who veri es the transaction and then adds it to the public ledger. For verifying transactions miners are rewarded with cryptocurrencies. Mining involves high quality tools and a very strong computing system.Steps involved in mining are as follows:1. A miner performs a resource-intensive task and
produces a proof that the work has been done. This task prevents a malicious miner from forming false identities and manipulating.
2. The proof produced is veri ed to con rm that the task has been performed.
3. The miner then checks for the validity of the transactions, and if all the transactions in the block prove valid, the block is posted in the Blockchain.
II. REASONS WHY SHOULD GO FOR CRYPTOCURRENCY
The global economy is moving toward the usage of digital eco system. In this internet era, investment to money transfer is going to paperless means can be implemented through internet. The newest and most promising method in the digital payment sector is cryptocurrency. Cryptocurrency is the medium of exchange in digital form. From the last few years, usage of digital currency is increased. Some reasons are highlighted here (Online, 2017):1. Fraud-proof: Currency in cryptocurrency are
decentralized neither government nor bank has any control over it, user just own it. All con rmed transactions are stored in public ledger. All identities of coin owners are encrypted to ensure the legitimacy of record keeping.
2. Identity Theft: the public ledger in cryptocurrency is called the blockchain. Blockchain ensure
secure the transactions of digital currency by the implementation of encryption algorithms and make the entity virtually nonhackable and void the fraud cases.
3. Instant Settlement: after the implementation of blockchain, cryptocurrency get the importance. User just need the smart devices with internet and become the owner of own bank making payments and money transfer.
4. Accessible: This virtual kind of bank are easily accessible by the user from any time and from anywhere with the help of internet.
5. Users become the owner: User become the owner of this virtual bank and own perform the transactions without the usage of third part.
VIII. CRYPTOCURRENCY IN INDIA
Cryptocurrency in the form of bitcoin was introduced in 2012. But now RBI has banned the transaction of Bitcoins in India. That’s why digital money cannot be used for the transaction and payment of goods and services. In the union budget of 2018, the Indian Government declared that usage of cryptocurrency such as bitcoin were illegal in India. There is no security and protection available to those using and trading them or dealing them. Government also said that cryptocurrency is being used by the illegal activities such as drug dealing, terrorism and many more. According to Indian government, people who dealing with cryptocurrency should careful and take caution because there is no lawful protection of this kind of currency and no help can be given by the government side if any fraud is faced by the people (Singh & Singh, 2018).
IX. CONCLUSION
Cryptocurrency offers a new and attractive mode of payment that can enhance the revenues of companies. Virtual money enables the user to perform financial activities like buying, selling, transferring and exchanging easily apart from the real money. Virtual money like cryptocurrency are very recent topic in economy of the country. This paper tries to provide the overview of cryptocurrency and blockchain technology. Also highlight the threats which are included while using the cryptocurrency and also include the some reasons why cryptocurrency get popularity. After the popularity of this kind of virtual money, Indian government has ban its usage in India. Indian government cannot provide any kind of help to the people if fraud case can happen while using cryptocurrency.

77Volume 11, Issue 1 • January-June 2020
REFERENCES[1] Jani, S. (2018). The Growth of Cryptocurrency in India: Its
Challenges & Potential Impacts on Legislation. ResearchGate .[2] Kashyap, S., & Chand, K. (2018). Impact of Cryptocurrency in
India. International Journal of Law Management & Humanities, 2 (1), 1-10.
[3] Li, X., & Wang, C. (2016). The Technology and Economic Determinants of Cryptocurrency Exchange Rates: The Case of Bitcoin. Decision Support System .
[4] Mukhopadhyay, U., Skjellum, A., Hambolu, O., Oakley, J., Yu, L., & Brooks, R. (2016). A Brief Survey of Cryptocurrency Systems. 14th Annual Conference on Privacy, Security and Trust. IEEE.
[5] Online, E. (2017, 10 25). 5 Reasons why you should go for cryptocurrency. Retrieved 05 15, 2020, from economictimes.indiatimes.com: https://economictimes.indiatimes.com/
industry/banking/finance/5-reasons-why-you-should-go-for-cryptocurrency/articleshow/61184608.cms?from=mdr
[6] Reiff, N. (2020, 2 1). Blockchain Explained. Retrieved 5 13, 2020, from investopedia: https://www.investopedia.com/terms/b/blockchain.asp
[7] Singh, A. K., & Singh, K. V. (2018). Cryptocurrency In India-Its Effect and Future on Economy With Special Refernce to Bitcoin. Journal of Advance Management Research, 6 (2), 262-274.
[8] Thackeray, J. (2018, 07 17). 5 Inherent Risks of Cryptocurrency. Retrieved 05 15, 2020, from Financial Executive International: https://daily.financialexecutives.org/FEI-Daily/July-2018/5-Inherent-Risks-of-Cryptocurrency.aspx
[9] Types of Cryptocurrency Explained. (2018, September 21). Retrieved 05 15, 2020, from https://www.trustetc.com/: https://www.trustetc.com/blog/cryptocurrency-types/
[10] Vejacka, M. (2014). Basic Aspects of Cryptocurrencies. Journal of Economy, Business and Financing, 2 (2), 75-83.

78 IITM Journal of Management and IT
Abstract—ICT has changed the picture of Indian higher education system as more and more technological intervention is being infused with the usual ways of teaching. ICT plays a vital role by making available the knowledge resources to every learner as per his/her convenience and just in time. ICT has tremendously upgraded the quality of education through various mechanisms like e – learning, blended learning and distance education. It has increased the access of and imparted equity in higher education through increasing digitization and quality teaching learning which bene ts not just students’ learning but also has open ways to build capacity of educational personnel. This paper is a descriptive analysis of the increasing use of and various initiatives in the eld of education pertaining to the use of ICT in India and its contribution in imparting quality in education and its subsequent bene ts.
I. INTRODUCTION
This As per MHRD’s NMEICT Vision Document, the overall literacy rate in the country as per the Census of 2001 was 64.8%. This implies a lack of formal means to get to know about the potential of the remaining 35.2% of the population1. Development their talent is still a far cry. This point toward the massive underutilization of country’s human resources. As per UGC’s Annual Report of 2011, 14.6 million students pursued Higher Education in India as of 2011. The Report also states that the gross enrolment ratio in rural areas is expected to reach 12.84 % by 2020.2 The UGC report on Higher Education in India 2008 – 11th Five Year Plan Vol. II, states that an increasing number of women are expected to enroll in higher education institutes. The number is estimated to increase from 6.1 million to 12.15 million by 2020.3 Therefore, innovation and changes in curriculum are signi cant to meet this ever-growing demand. The globalized labour market requires students with new skills. With huge lay-offs in IT-industry becoming a trend now a days, people at a large scale, educational institutions
and universities need impart skills to students as well as to enhance their learning.Today, technological interventions are gaining importance in the eld of higher education. ICT driven tools are increasingly helping students to learn, communicate, collaborate and study both on and off campus. Universities too have responded positively to new technological changes and are continuously transforming their learning processes. Digitization of higher education in India is gaining pace as clear from the growing popularity of digital libraries; increased mobile connectivity, cloud based data management, Wi-Fi enabled campuses etc.
II. ICT IN HIGHER EDUCATION
A. e-Learninge-Learning, that is, electronic learning is basically computer - enhanced learning. It may range from technology enabled learning (TEL), computer based instruction and training (CBI/T) or internet based training (IBT). It can be both synchronous, involving webinars and virtual learning environments leading to immediate feedback and asynchronous or self-paced where students do not have admission to instant messaging or they are not able to interact with teachers. According to industry experts, e- learning platforms are changing the Indian education landscape by matching the demand by the corporate sector with the supply of skilled students as these dispense personalized learning outcomes.The demand for online higher education is dominated mainly by post-graduation courses such as MBA and MCA as per the KPMG’s report on “Online Education in India: 2021” according to which 33% students in North, 39% in the West, a whopping 64% in East and 36% in South prefer pursuing MBA/PGDM courses whereas the ratios for the same region respectively for B.Ed./M.Ed./NTT are to 9%, 7%, 2% and 17%. Test Preparation through Online Education Not just the enrolment to predictable courses on e-learning platforms is on rise but there has
ICT Initiatives and Tools in Higher EducationRachita Arora#1, Romika Yadav#2
#Institute of Information Technology and ManagementNew Delhi, India
[email protected]@gmail.com

79Volume 11, Issue 1 • January-June 2020
also been a growing number of students diving to online preparation of various competitive national level tests.4
Table 1: Tier- Wise Adoption of Test Preparation Courses
Tests Tier 1 Tier 2
Engineering 32 26
Medical 23 13
BA/BSc/BBA 17 13
Law 16 6
CA 10 9
Source: KPMG Report: Online Education in India: 2021.
B. UGC - IUC To support the Universities, the University Grants Commission (UGC) has also constituted the UGC InfoNetDigital Library Consortium being executed by INFLIBNET which is an autonomous, Inter- University Centre (IUC) of UGC entrusted with the task of creating infrastructure for sharing of library and information resources among academic and research institutes. The programme is wholly fund by the UGC. Apart from that, it has also established a CEC, that is, Centre for Educational Communication which is yet another IUC. The aim of the Centre is to address the requirements of higher education through the use of the invincible medium called television based on the potential and power of television to act as a means of dissemination of knowledge. To the effect, the UGC started the Countrywide Classroom Programmes in the year 1984. At present, 22 Media Centers known as Educational Multimedia Research Centers (EMRCs) have been made operational towards achieving this goal under the umbrella of CEC, .These EMRCs disseminate knowledge through EDUSAT which is the rst Indian satellite built exclusively for serving the educational sector . It very well highlights India’s assurance to use space technology for national development. It mainly intends to meet the demand for an interactive satellite based distance education system for the country.
III. DIGITAL INITIATIVES IN HIGHER EDUCATION
Government of India has, under its ‘Digital India’ drive, launched various initiatives to make education in India accessible and equitable. Prominent among them include:i) SWAYAM, that is, Study Webs of Active Learning
for Young Aspiring Minds is a programmed that seeks to bridge the digital divide for students who have hitherto remained untouched by the digital
revolution and have not been able to join the mainstream of the knowledge economy. The platform endeavors to host courses in four quadrants viz., video lecture, specially prepared reading material available for downloading/printing; quizzes and tests for self assessment of students and an online discussion forum for doubt sessions. Through the portal, an attempt has been made to make the learning enriching via audio-video and multimedia and state of the art pedagogy/technology.
ii) SWAYAM PRABHA, a group of 32 Direct To Home Channels to telecast high-quality educational programmers, the contents of which are provided by NPTEL, IITs, UGC CEC, IGNOU and NCERT, 24 × 7 basis using GSAT - 15 satellite.
iii) National Digital Library of India (NDL India) is a single-window search facility for accessing digital content like books, articles, videos, audios, thesis and other educational material relevant for users belonging to different educational levels and capabilities.
iv) Virtual Labs Project is an initiative of Ministry of Human Resource Development, Government of India below the aegis of National mission on Education through Information and Communication Technology. The project is a Consortium activity of twelve participating institutes; IIT Delhi being the coordinating institute. The aim of the project is to widen the reach of labs related to various disciplines of Science and Engineering to students living in remote areas reading at undergraduate level, post graduate level as well as to research scholars. The project is a revolution as far as making higher education affordable to students as it strives to share costly tools and resources, which are otherwise available to a limited number of users due to constraints on time and geographical distances.
v) A-VIEW (Amrita Virtual Interactive e-Learning World) is a multimedia e-learning platform and part of the ‘Talk to a Teacher’ program coordinated by IIT Bombay that aims to present an immersive e-learning experience on a real-time basis. The Programme is funded by the Ministry of Human Resource Development (MHRD) under the Indian Government’s National Mission for Education using Information and Communication Technology (NME-ICT) along with various other projects in Virtual Labs and Natural Language Processing. A-VIEW is now deployed at several IITs, NITs and other leading educational institutions across the nation.

80 IITM Journal of Management and IT
IV. TECHNOLOGY IN TEACHING
ICT leads to innovative and effective ways of teaching-learning and research. Indian higher education will see a plethora of technology trend and effects of technology adoption. Of course, most of the global technology trends may not be seen implemented in the near future. But de nitely many global technologies are trending in India too. Technology has a great say in de ning the way higher education is imparted. Here are some of the trends in technology in Indian higher education system:i) Open Education Resources (OER): These refer to
openly licensed text, media, and other digital assets which can be accessed free of cost. These include teaching, learning and research material which can be accessed publicly at no cost and allows users to access and redistribute the material under some licenses. AICTE, IGNOU and UGC are taking efforts to explore and create open education sources prominent among which include Digital Library, SWAYAM, A –VIEW and NPTEL, Shodhganga, CEC, Project Eklavya, Project OSCAR, NMEICT and NIOS. Various technologies like telephony, internet, audio video etc. are being used.
ii) Meta University / Virtual Technical University: Based on the premise ‘Whole is Greater than the Sum of Parts’, Meta University concept marks a shift in higher education in India by allowing students to move between various universities. Students have the freedom to study different subjects at any of the two universities as faculty and resources are shared. It entails the use of India’s growing IT tools, thus, combining traditional systems with new opportunities for enhancing knowledge. The idea relies on the National Knowledge Network. To begin with, Delhi University and Jamia MiIlia Islamia University have come together to set up a Meta university with a course called Masters in Mathematics Education.
iii) Virtual Technical University: As part of the NMEICT, seven of the Indian Institutes of Technology (IITs) namely IIT Mumbai, Delhi, Guwahati, Chennai, Kanpur, Kharagpur and Roorkee have collaborated with Indian Institute of Science (IISc) to set up India’s rst home-grown virtual technology university. The proposed Virtual Technical University (VTU) offers programs in various elds like science, technology, management, architecture, pharmacy and other areas of applied knowledge. The university uses video courses, web-based learning material and live lectures using satellite and internet-based technologies. The VTU
has an archive containing expert-created video courses and a website that hosts learning material. VTU envisages having at least 300 courses for the school of engineering sciences and engaging a large pool of talented faculty from Indian Institutes of Technology (IITs), National Institutes of Technology (NITs), Indian Institute of Science (IISc) and other institutions and retired faculty.
iv) Digitization of Books (E-Textbooks): There is a growing trend toward creation of a digital storehouse for books to make learning interesting and interactive for students. National Mission on Education through ICT strategy to spawn new online course content for UG, PG and Doctoral education. Efforts are now underway to practice course content for 130 courses (UG and PG).
v) Content Delivery using IT/ICT: Now days, there is an emerging trends in higher education institutes to deliver educational content through radio, television and Satellite. Increased proliferation of smart in colleges/universities is viewed as a means to capitalize on feature-rich phones by using those features to the advantage of education. Adoption of such devices that have internet access allows students and faculty to perform a wide range of assignments. Other tasks like administration, sharing class notes, downloading lectures, instant messaging, etc. are possible wherever the cell phone service is available. Mobile phones are as well individual used to right to use computer les from remote locations.
vi) Social Learning: The emergence of blogs and various other social media platforms as well as prevalence of YouTube, iTunes etc. is a leading trend in higher education. Mobile learning or m-learning is gaining reputation. These technologies have remarkably changed the ways in which content is structured and delivered.
V. BENEFITS OF ICT IN EDUCATION
Use of ICT in education is indeed the need of the hour. It offers enormous bene ts to students as it has a wider reach and offers low-cost education. There has been growing blend of ICT tools with the conventional teaching methods in order to impart quality in education. It offers the bene ts of greater access, exible content, learning while working and new-ways of interaction to students on one hand. On the other hand to employers get high quality, cost effective professional development, upgraded employee skills, increased productivity, a new learning culture, increased portability of guidance through the use of ICT-enabled tools in education.

81Volume 11, Issue 1 • January-June 2020
Access and Equity in Higher Education. The demand for higher education is expected to shoot up in the coming years due to increasing Gross Enrolment Ratio at school-level as proposed by the Eleventh Five Year Plan Document which seeks to achieve the target of 15 per cent Gross Enrolment Ratio by 2012 via the dual mechanism of increasing both the intake capacity of existing institutions as well as enhanced institutional capacity.5 The use of ICT in higher education institutions tends to bridge this gap by supplementing the formal education system with distance learning.The major role toward the ful llment of the said goal is played by e-learning which is an emerging strategy for the provision of widespread and easy access to quality higher education. Although, at present the initiatives for development of e-learning in India are intermittent, UGC is advocating and making efforts to enhance the quality of higher education by framing policy guidelines for their integration in classroom and other activities.
VI. E LE VENT H FIVE YE AR PL AN DOCUMENT
The use of ICT in higher education has tremendously improved the quality of teaching and thus, learning. Also, the increasingly globalized world is becoming an emerging knowledge economy where information is supreme. Therefore, the integration of ICT with traditional modes of teaching and learning leads not just to personal growth but also to the formation of knowledge societies. To survive in the erce competitive environment, life-long learning is the only key. In order to strengthen and enhance this knowledge-driven growth, new technologies, skills and capabilities are needed. Conventional teaching-learning processes have transformed immensely. Now, the focus of eminent institutions and government is on such education plans and practices which improve competency. As such the curriculum requires access to diverse sources, forms and types of information; student centered learning environment based on access to timely and quality information and inquiry; problem-oriented and inquiry-based activities and teachers to act as coaches and mentors rather than content experts.
VII. CONCLUSION
The emerging instructional technologies are becoming gateways for the development of education and are constantly re ning its quality. Usage of ICT in education not only builds capacity of personnel involved in education but also enriches learning experiences of students. National level institutes to the likes of IITs and IIMs are largely becoming instrumental in building technical and managerial capabilities in various elds using ICT networks. Technology has facilitated cutting-edge pedagogic methods, unique and advanced ways of learning and interacting and easy sharing of new practices among teaching community, thereby leading to the development of capabilities and promoting competency. ICT enables availability of trained teachers/academic experts to larger set of audiences/students through exible and virtual settings. ICT in education, particularly e-learning and distance learning is best suited to the needs of working professionals facing time constraints, enabling them to pursue professional courses at their convenience and thus adding to the already existing pool of knowledge- driven individuals leading to better communities. One of the biggest advantages of using ICT tools in education is that of increasing access of quality education to various groups as it leads to reduced costs, making education affordable.
REFERENCES[1] Conrad, D. (2013). Assessment challenges in open learning: Way-
nding, fork in the road, or end of the line? Open Praxis, 5(1), 41-47.
[2] Dhanarajan, G. & Abeywardena, I. S. (2013). Higher Education and Open Educational Resources in Asia: An Overview.
[3] G. Dhanarajan & D. Porter (Eds.), Open Education Resources: An Asian Perspective (pp.
[4] Kanwar, A., Kodhandaraman, B., & Umar, A. (2010). Toward sustainable open educational resources: a perspective from the global south. American Journal of Distance Education, 24, 65– 80.doi:10.1080/08923641003696588 University Grants Commission (n.d.) Distance Education.
[5] MHRD (2013). All India Survey on Higher Education. New Delhi: Government of India.

82 IITM Journal of Management and IT
Abstract—There are different types of encryption techniques used to ensure the privacy of data transmitted over internet. Digital Signature is a mathematical scheme that ensures the privacy of conversation, integrity of data, authenticity of digital message/sender and non-repudiation of sender. Digital Signature is embedded in some hardware device or also exits as a le on a storage device. Digital Signature are signed by third party some certifying authority. This paper describes the different key factor of digital signature with the working, through various methods and procedures involved in signing the data or message by using digital signature. It introduces algorithms used in digitalsignatures.Many traditional and newer businesses and applications have recently been carrying out enormous amounts of electronic transactions, which have led to a critical need for protecting the information from being maliciously altered, for ensuring the authenticity, and for supporting nonrepudiation. Just as signatures facilitate validation and veri cation of the authenticity of paper documents, digital signatures serve the purpose of validation and authentication of electronic documents. This technology is rather new and emerging and expected to experience growth and widespread use in the coming years.Keywords—Digital Signature, Validation, Authentication
I. INTRODUCTION
A digital signature is an electronic analogue of a written signature; the digital signature can be used to provide assurance that the claimed signatory signed the information. In addition, a digital signature may be used to detect whether or not the information was modi ed after it signed (i.e., to detect the integrity of the signed data). Often-ally digital signature is generated critical consideration when establishing. A signed message that includes the (purported) signing time provides no assurance that the private key was used to sign the message at that time unless the accuracy ofthe time can be trusted. With the appropriate use of 1) timestamps that are digitally signed by a Trusted Timestamp Authority (TTA), and/or 2) veri er-supplied data that is included in the signed
message, some level of assurance about the time that the message was signed can be provided. A discussion of the establishment and management of a TTA is outside the scope of thisRecommendation.Nowadays the speed of business connections is increasing rapidly. In order to be in the frontline of the world competition, companies are adopting new technologies such as web conferences, distant work places, internet banking, & usage of electronic documents. Electronic documents are efficient in commercial, cost and environment perspectives. Electronic signature concept is growing in its popularity, the new wave of electronic of ce concept will ow over the business world very soon. There are strong drives to replace paper-based document circulation with electronic one, replace handwritten signature with electronic one. However, doing business via internet or signing e-documents require more security, trust, traceability and accountability. The new technology of advanced digital signature has created a base for a secured paperless of ce. Enforceability of electronic documents & digital signatures allows easily exchange legal electronic documents, reduce the process costs & time connecting with mail and printing. Digital signature provides more authenticity in comparison to handwritten signature [4].
In our everyday life Internet became an integral part. Security is an important term in this regard. If serious attack occurs, communication, trade, transaction and other important functions will be affected.Following are some security requirements that must be taken into count during any type of communication through Internet: -
• Integrity: If the message content changes after being sent from the sender, and before reaching to the recipient, then we will take this as a loss of integrity. Hence the message content must not be affected during its travellingtime.
• Availability: As per the principles of availability, resources should be available to authorized persons at all time.
Digital Signatures #Pankaj Kumar Varshney, #Anmol Kukreja, #Shivam Dewan
#Institute of Information Technology & Management, Janakpuri, New Delhi, [email protected],2 [email protected], [email protected]

83Volume 11, Issue 1 • January-June 2020
• Con dentiality: It speci es that contents of message are accessible to nobody, except the sender and intended receiver.
• Authentication: It ensures the proof of identity. The sender and the intended receiver of the message must be correctlyidenti ed.
• Nonrepudiation: Neither sender nor receiver can deny the existence ofmessage.
II. CONVENTIONAL AND DIGITAL SIGNATURE CHARACTERISTICS
A conventional signature has the following salient characteristics: relative ease of establishing that the signature is authentic, the dif culty of forging a signature, the non-transferability of the signature, the dif culty of altering the signature, and the nonrepudiation of signature to ensure that the signer cannot later denysigning.
A digital signature should have all the aforementioned features of a conventional signature plus a few more as digital signatures are being used in practical, but sensitive, applications such as secure e-mail and credit card transactions over the Internet. Since a digital signature is just a sequence of zeroes and ones, it is desirable for it to have the following properties: the signature must be a bit pattern that depends on the message being signed (thus, for the same originator, the digital signature is different for different documents); the signature must use some information that is unique to the sender to prevent both forgery and denial; it must be relatively easy to produce; it must be relatively easy to recognize and verify the authenticity of digital signature; it must be computationally infeasible to forge a digital signature either by constructing a new message for an existing digital signature or constructing a fraudulent digital signature for a given message; and it must be practical to ret copies of the digital signatures in storage for arbitrating possible disputes later.
To verify that the received document is indeed from the claimed sender and that the contents have not been altered, several procedures, called authentication techniques, have been developed. However, message authentication techniques cannot be directly used as digital signatures due to inadequacies of authentication techniques. For example, although message authentication protects the two parties exchanging messages from a third party, it does not protect the two parties against each other. In addition, elementary authentication schemes produce signatures that are as long as the message themselves.
III. BASIC NOTATIONS AND TERMINOLO-GOIES
Digital signatures are computed based on the documents (message/ information) that need to be signed and on some private information held only by the sender. In practice, instead of using the whole message, a hash function is applied to the message to obtain the message digest. A hash function, in this context, takes an arbitrary-sized message as input and produces a fixed-size message digest as output. Among the commonly used hash functions in practice are MD-5 (message digest 5) and SHA (secure hash algorithm). These algorithms are fairly sophisticated and ensure that it is highly improbable for two different messages to be mapped to the same hash value. There are two broad techniques used in digital signature computation—symmetric key cryptosystem and public-key cryptosystem (cryptosystem broadly refers to an encryption technique). In the symmetric key system, a secret key known only to the sender and the legitimate receiver is used [1]. However, there must be a unique key between any two pairs of users. Thus, as the number of user pairs increases, it becomes extremely dif cult to generate, distribute, and keep track of the secret keys [3].A public key cryptosystem, on the other hand, uses a pair of keys: a private key, known only to its owner, and a public key, known to everyone who wishes to communicate with the owner. For con dentiality of the message to be sent to the owner, it would be encrypted with the owner’s public key, which now could only be decrypted by the owner, the person with the corresponding private key. For purposes of authentication, a message would be encrypted with the private key of the originator orsender, who we will refer to as A. This message could be decrypted by anyone using the public key of A. If this yields the proper message, then it is evident that the message was indeed encrypted by the private key of A, and thus only A could have sentit.
IV. CREATING AND VERIFYING A DIGITAL SIGNATURES
A simple generic scheme for creating and verifying a digital signature. A hash function is applied to the message that yields a xed-size message digest. The signature function uses the message digest and the sender’s private key to generate the digital signature. A very simple formof the digital signature is obtained by encrypting the message digest using the sender’s private key. The message and the signature can now be sent to the recipient [6]. The message is unencrypted and can be read by anyone. However, the signature ensures

84 IITM Journal of Management and IT
authenticity of the sender (something similar to a circular sent by a proper authority to be read by many people, with the signature attesting to the authenticity of the message). At the receiver, the inverse signature function is applied to the digital signature to recover the original message digest. The received message is subjected to the same hash function to which the original message was subjected. The resulting message digests compared with the one recovered from the signature. If they match, then it ensures that the message has indeed been sent by the (claimed) sender and that it has not been altered.
Fig. 1: Creating a digital signature
Fig. 2: Verifying a digitalsignature
I. Creating and Opening a Digital EnvelopeA digital envelope is the equivalent of a sealed envelope containing an unsigned letter. The outline of creating a digital envelope is shown in Fig. 3. The message is encrypted by the sender using a randomly generated symmetric key. The symmetric key itself is encrypted using the intended recipient’s public key. The combination of the encrypted message and the encrypted symmetric key is the digital envelope. The process of opening the dig-ital envelope and recovering the contents is shown in Fig. 4. First, the encrypted symmetric key is recovered by a decryption using the recipient’s private key [7]. Subsequently, the encrypted message is decrypted using the symmetric key.
Fig. 3: Creating a digital envelope
Fig. 4: Opening a digital envelope
II. Creating and Opening Digital Envelopes Carrying SignedmessagesThe process of creating a digital envelope containing a signed message is shown in Fig. 5. A digital signature is created by the signature function using the message digest of the message and the sender’s private key[2]. The original message and the digital signature are then encrypted by the sender using a randomly generated key and a symmetric key algorithm. The symmetric key itself is encrypted using the recipient’s public key. The combination of encrypted message and signature, together with the encrypted symmetric key, form the digital envelope containing the signed message. Figure 6 shows the process of opening a digital envelope, recovering the message, and verifying the signature. First, the symmetric key is recovered using the recipient’s privatekey.This is then used to decrypt and recover the message and the digital signature. The digital signature is then veri ed as describedearlier
Fig. 5: Creating a digital envelope carrying a signed message
Fig. 6: Opening a digital envelope and verifying a digital signature

85Volume 11, Issue 1 • January-June 2020
V. DIRECT AND ABRITRATED DIGITAL SIGNATURES
A variety of modes have been pro-posed for digital signatures that fall into two basic categories: direct and arbitrated. The direct digital signature involves only the communicating parties, sender and receiver. This is the simplest type of digital signature. It is assumed that the recipient knows the public key of the sender. In a simple scheme, a digital sig-nature may be formed by encrypting the entire message or the hash code of the message with the sender’s private key. Con dentiality can be provided by further encrypting the entire message plus signature with either the receiver’s public key encryption or the shared secret key, which is conventional encryption. A sender may later deny sending a particular message by claiming that the private key was lost or stolen and that someone else forged his signature. One way to overcome this is to include a time stamp with every message and requiring noti cation of loss of key to the proper authority. In case of dispute, a trusted third party may view the message and its signature to arbitrate thedispute.In the arbitrated signature scheme, there is a trusted third party called the arbiter. Every signed message from a sender A to a receiver B goes rst to an arbiter T, who subjects the message and its signature to a number of tests to check its origin and content. The message is then dated and sent to B with an indication that it has been veri ed to the satisfaction of the arbiter. The presence of T solves the problem faced by direct signature schemes, namely that A might deny sending a message. The arbiter plays a sensitive and crucial role in this scheme, and all parties must trust that the arbitration mechanism is working properly. There are many variations of arbitrated digital- signature schemes. Some schemes allow the arbiter to see the messages, while others don’t. The particular scheme employed depends on the needs of the applications. Generally, an arbitrated digital-signature scheme has advantages over a direct digital-sig-nature scheme such as the trust in communications between the parties provided by the trusted arbiter and in the arbitration of later disputes, if any.
VI. A PUBLIC VERSUS A PRIVATE APPROACH TO DIGITALSIGNATURES
Another way of classifying digital sig-nature schemes is based on whether a private-key system or a public-key sys- tem is used. The public-key system based digital signatures have several advantages over the private-key system based digital signatures. The two most popular and commonly used public-key system based digital signature
schemes are the RSA (named after Rivest, Shamir, and Aldeman, theInventorsof the RSA public-key encryption scheme) and the digital signature algorithm (DSA) approaches. The DSA is incorporated into the Digital Signature Standard (DSS), which was published by the National Institute of Standards and Technology as the Federal Information Processing Standard. It was rst proposed in 1991, revised in 1993, and further revised with minor changes in1996.RSA is a commonly used scheme for digital signatures. In a broad outline of the RSA approach, the message to be signed is input to a hash function that produces a secure hash code of xed length. This hash code is then encrypted using the sender’s private key to form the signature. Both the signature and the message are then concatenated and trans-mitted. The recipient takes the message and produces a hash code. The recipient also decrypts the signature using the sender’s public key. If the calculated hash code matches the decrypted signature, the signature is accepted as valid. This is because only the sender knows the private key, and thus only the sender could have produced a valid signature. The sig-nature generation and veri cation using RSA is identical to the schemes shown in Figs. 1 and 2, respectively.
VII. DIGITAL SIGNATURES IN REAL APPLICATIONS
Increasingly, digital signatures are being used in secure e- mail and credit card transactions over the Internet. The two most common secure e-mail systems using digital signatures are Pretty Good Privacy and Secure/Multipurpose Internet Mail Extension. Both of these systems support the RSA as well as the DSS-based signatures. The most widely used system for the credit card transactions over the Internet is Secure Electronic Transaction (SET). It consists of a set of security protocols and formats to enable prior existing credit card payment infrastructure to work on the Internet [5]. The digital signature scheme used in SET is similar to the RSAscheme.
VIII. CONCLUSION
Many traditional and newer businesses and applications have recently been carrying out enormous amounts of electronic transactions, which have led to a critical need for protecting the information from being maliciously altered, for ensuring the authenticity, and for supporting non- repudiation. Just as signatures facilitate validation and veri cation of the authenticity of paper documents, digital signatures serve the purpose of validation and authentication of electronic documents.

86 IITM Journal of Management and IT
This technology is rather new and emerging and is expected to experience growth and widespread use in the comingyears.Real-time updates are also changing the face of how we interact with digital signage. Real estate agents, restaurants, and retailers are using this level of technology to keep customers up to date with inventory availability.
REFERENCES[1] F.E.S.,Dunbar, 2002. Digital Signature Scheme Variation,
presented in University of Waterloo.
[2] Rivest R. The MD5 message-digest algorithm.2015.[3] Matricial public key cryptosystem-with-digital-signature[4] A comprehensive study on digital signature for internet
security.2016.[5] Digital-signature-scheme-based-on-factoring-and-discrete
logarithms.[6] Hartman B, Flinn DJ, Beznosov K, Kawamoto S Mastering web
services security. John Wiley & Sons; 2018.[7] http://www.engpaper.com/digital-signature-scheme-based-on-
factoring-and-discrete-logarithms.htm[8] http://www.engpaper.com/asymptotically-ef cient-lattice-based-
digital-signatures.htm

87Volume 11, Issue 1 • January-June 2020
Abstract—Mobile applications are the gateway to transfer human knowledge. Learning is a continuous process and the focus has now completely shifted to eLearning. Due to the mobile phones and the various feature-oriented applications, students can learn at their pace and take their time at understanding things, as everything is just a click away. Integration of Mobile in teaching learning process have generated a new era in education. It makes teaching learning process more interactive and effective. It can help to bring quality education to everyone from everywhere. The implementation of mobile Apps and technologies as a whole, can offer many bene ts to the university learning environment. This paper discusses the use of mobile applications in higher education sector and the subject speci c mobile applications. Keywords—M-Learning, Mobile Technology, Mobile Learning Apps, Higher Education, ICT
I. INTRODUCTION
The world is dynamically changing and upgrading in all the existing elds. Be it culture, society, modernity, sports and the categories won’t really come to any end. And one of these super spontaneously growing elds is the technology which is upgrading at an astonishing pace. These days, there have been several changes introduced in the ways we come across technology advancement. There have been numerous of features introduced which not only assist in several day to day activities but also have improvised our standards of living in many ways. This shows how advancement in technology is bringing fruitful results and is also contributing in the overall development in several economic as well as noneconomic spheres we are familiar to.Mobile learning has become an important factor in higher education. Mobile devices such as net books, tablets or smart phones have become ubiquitous in the institutions of higher education. Majority of the students nowadays own mobile devices and about half of them own more
than one. In addition, because these devices are highly personalized and collaborative communication tools, they provide the institutions of tertiary education with exible tools for complementing the existing technologies and extending the learning beyond the classrooms and homes from remote places like train or bus stations where students do not have any access to computers.One of these advancements is the Mobile Applications. As we shuffle back to its history, we would come across the fact the rst ever smart phone invented was the one launched by IBM in the year 1993 with those basic everyday features like calculator, clock, contact book and calendar. Since then, there have been several advancements seen in the up gradation of mobile phones and the features they come with. With the ow of time, several organisations across the world came with new inventions and discoveries which led us savour all what we are served with today, i.e., impeccably designed applications of almost all kinds of services and facilities one may look for. This has been one of the most highly astonishing evolutions our world may have had till date and certainly, its quiet evident to believe that this may grow even more ef ciently in the coming future.Of course, a mobile phone consists of just one evident feature which is solely responsible for its existence and that is the feature of applications. Every new technology today is supported or prompted through some or the other application. Also, almost all the services we use today and the facilities we aim to avail are available to us at just one tap of different applications on our mobiles which makes it possible to access anything and everything simply just through our mobiles. This enables our generation to simplify numerous of day to day activities. This has eventually led to a faster paced life. Thus, mobile applications have uplifted the standards of living by bringing in several changes which are not only bene cial but are also highly ef cient.Mobile(M) learning is the ability to provide educational contents and resources on personal pocket devices such
A Study on Mobile Applications in EducationRavi Sunitha#, Singh Elina*
#Associate Professor, Department of Management Studies, Institute of Information Technology & Management, New Delhi. India,
*Student, Bachelor of Business Administration, Department of Management Studies, Institute of Information Technology & Management, New Delhi, India
88 IITM Journal of Management and IT
as smart phones, tablets, PDAs, i-pads, mobile phones etc., Educational content refers to digital learning resources which includes any form of content available on a personal device. M-learning is de ned as learning multiple contexts, through social and content resources, using personal electronic devices.
II. LITERATURE REVIEW
Karabatzaki et. al; (2018) Technology can possibly improve numerous aspects of our day to day lives, including learning. It has been demonstrated to build students’ engagement and learning results. With latest advancements in the abilities of smart phones and their increasing adaption rate among the students, it is conceivable to exploit these devices through designing proper activities and exercises that encourage student’s knowledge and learning. In this paper we present few of the most notable mobile methodologies that are used for students so as to advance their learning and their abilities. Moreover, its job in those students who face learning and related challenges is explored. Finally, the outcomes of a research that inspected whether there is a connection between the presentation of students in the language lecture, in mathematics lecture and index of intelligence practice, index of verbal intelligence and general index of intelligence are indicated completely.Hans & Harsha (2018) examined the Mobile Learning Application and its usage among Academic Staff and Students in education. The main purpose of this study is to establish ERP software to identify whether it enhance or upgrade the level and support learning in the institute among the college student. Luna-Nevarez Cuauhtemoc and McGovern Enda (2018),As the implementation of technology blends with education, a broad range of new smart gadgets and tech-driven applications is being available to education. Trending examples for such technology are digital magazines, which can assist teachers with improving the learning experience of their students beyond just classroom teaching. This article examines the effect of customised digital magazines, made and distributed among people through a mobile application like Flipboard, in uplifting students’ interest, understanding, and learning of academics-related content. And hence, students responded well to the acceptance of this new tech-driven ideology. Students using mobile applications and reading digital magazines showed more engagement in academics and performed even better in an assessment, as compared to the students in a control environment. Drigas and Angelidakis (2017) Mobile learning has the potential to push the boundaries of education beyond just classroom walls. In light of the
device used, any learner can get an access to a wide range of content. Ranging from podcasts to digital videos, attend a virtual lecture or simply refer to a mentor over the net directly for answers to his questions. These new innovative ways give rise to an interest for reconsidering instructional method and the system of education. Therefore, our examples of mobile applications inside formal or informal education system been made in relation with innovation. Ansari & Tripathi (2017) examined the effectiveness of mobile learning apps in the higher education in India. The study discusses the use of mobile applications in student’s life. The results show that in the higher education environment, the mobile learning apps play a vital role. Also the results indicated that students had adequate knowledge and awareness regarding the use of mobile applications.According to the research of Ekaterina Pechenkina (2017), Mobile applications are a great part of higher education in several numbers of ways, including as organizers for study, for marketing, as learning instruments, and enrollment of new students. Designed with a purpose of simplifying the blending of students’ life with universities’, organiser applications have an ability to help students with different phases of college experience, saving time and vitality for study, while applications utilized as learning instruments can assist students with understanding and comprehending what’s taught in lectures, self assess their insights into the subject, and work together with peers. Regardless of the expansion of higher education applications, there is still no methodical comprehension of this eld, with various signi cant questions staying unanswered, for example, what kinds of applications are most ordinarily found in higher education, what their intricate uses are, and how their functionalities and affordances are adapted by universities and its students. This research tends to bridge this gap. In the wake of dissecting 177 applications partnered with Australian universities, a typology of higher education applications is proposed. Navigation and study management applications rise as the most well-known applications offered to the students in universities, with virtual reality or augmented applications emerging as another key classi cation. New bits of knowledge are offered relating to the complex terrain of higher education mobile applications, and tricky zones emerging from this analysis, for example, student support, equity, safety and privacy, are talked about. Yeap, Ramayah, and Soto-Acosta (2016) examined college students so as to analyse and comprehend the elements that encourage adoption. Two crucial factors were revealed are subjective norms and perceived behavioural control. Along with, the authors discovered that the impact of friends and companions adapting the utilization of m-learning and the
89Volume 11, Issue 1 • January-June 2020
integration of instances of m-learning into the coursework uplifts students’ con dence and potential. Richardson and Lenarcic (2008) analyzed the signi cance of mobile technology to upgrade students’ potential to acquire basic university knowledge and class content. With respect to their outcomes, mobile technology improvised students’ understanding by uplifting the adequacy of staff to student, student to staff, student to student, and college to student interaction. Ji-Hye Bae, Sung-Ki Kim (2014), examined the educational results on the use of applied app on mobile by students. The study attempted to measure the results of students while using mobile apps and instructional strategies in actual education elds. It also focus on the educational effects obtained for the usefulness learning activities.
III. RESEARCH GAP
Since years and years turning history, there have been numerous of researches and studies conducted over mobile applications. And thus, we may have come across several comprehensions and interpretations on the same. But, it’s quite evident that we have been missing an in-depth analysis of the implementation of mobile applications speci cally in the eld of education. There have been a few studies conducted. Though, their sole agenda was not necessarily found to be focused over the eld of education or, didn’t represent the core areas which were somewhere missed out.Therefore, this research is conducted with an agenda to elaborate the in uence of mobile applications speci cally with respect to the eld of education, throwing light over all of its affects, in uences and signi cances it has over education. Through this study, we may take a step to bridge the gap between the previous studies and the present studies by bringing out an in-depth analysis of this particular subject but in terms of growing technology and modern education system.This will also assist us in interpreting the signi cant outcomes that are likely to be expected through this extensive research along with highlighting the crucial aspects for the modern day education system which may push it to higher growth.
IV. RESEARCH METHODOLOGY & OBJECTIVES OF THE STUDY
The study is descriptive in nature. Source of Data collection is secondary data collected from internet and other published sources. The type of research which will be utilized in this study is majorly qualitative research along with some quantitative research. Qualitative
research aims to collect a detailed understanding of human behaviour and therefore the reasons that lead to such behaviour. The discipline studies and analysis the “why” and “how” of the decision making process. Besides this, the research will also examine the phenomenon through some quantitative observations (wherever required) so as to precisely elaborate the study. Additionally, the secondary data is used in this study so as to analyse and examine the overall factors related to the subject of this observation. The study focuses on the following objectives• To study the Advantages of Mobile applications in
Learning Process • To study the subject speci c mobile applications in
education.
V. TYPES OF MOBILE APPS
• There are three types of mobile apps.• Native apps: These are the apps which are installed
through Google Play or apples app store. It has all the features like accelerometer, the GPS, the compass, camera etc. These apps can use the device’s noti cation system and can work of ine.
• Hybrid apps: These apps also depend on HTML. These apps are a part of both native and web apps
• Mobile web Apps: These are the apps which run by a browser and it is written in HTML 5.
VII. ADVANTAGES OF USING MOBILES APPS IN LEARNING
• Learning Methods: The introduction of applications in the education sector has led to the introduction of new learning methods. There are fun games available on mobile applications that indulge the students into a healthy thought process and help them understand things from a different perspective.
• Flexibility of using Mobile apps: Mobile apps have become part and parcel of people’s lives because of the exibility and ease of looking up information that they offer. The power of mobile apps can be leveraged to offer training to learners even when they are not connected to internet.
• eBooks And Online Study: These days, students are generally very fond of online studying. This is where library apps and book search apps come into the picture. These applications make it easy for the students to search the appropriate study material in the mobile application. It keeps them closer to the study material and helps them in segregating their studying materials over the web.

90 IITM Journal of Management and IT
• Easy Accessibility: The mobile learning technology and mobile apps help learners to use them at any time at their convenience.
• Utilization of Free Time: College students always have a lot of free time, which get wasted in useless activities. With the help of e-Learning mobile apps learners can use their free hours to learn something productive.
• Enjoyable and Informal Learning: Students are fed up of boring homework routines. The classroom lectures are quite monotonous. The entertaining graphics and attractive illustrations are way better than regular study patterns. The informal feel of learning apps helps learners towards enhanced learning outcomes.
• Changing Educational Standards: The future of education belongs to technology. The content not only is predominant, but they also need to suit the learner. Table I, Table II and Table II explains the various android apps used by students, various mobile apps used in education and subject speci c mobile applications in Education.
Table I: Different Android Apps used by students
Android Presentation Apps Google SlidesPower PointPrezi Viewer
Android Mind Mapping Apps MindomoMindmeisterSimpleMind
Android Note Taking Apps One noteGoogle KeepEvenote
Android Video Apps Animoto video makerMagisto Video Editor & MakerVideo Editor
Android Portfolio Apps Three RingWeeblySeesaw
Android Reference Apps Cite this for meEasyBibMendeley
Personality Development Apps RementePersonality Development AppThink upElevateLumocityBestifyMeLearn Public Speaking
Table II: Various Mobile Apps used in Education
Mobile Apps for Enhance Teachers Professional Growth
Udemy Mole AppLynda Mobile AppTED Mobile AppEdx Mobile AppTreehouse mobile AppLinkedIn AppCourse Era Mobile AppUdacity Mobile App
Mobile Apps for formative Assessment KahootVersoSocrative teacherPlickersZoho formsNearpodI Click ReefRecapPoll EverywhereClass owClassclickFormative
Mobile Apps for creativity MindmeisterEvernote
Mobile App for Classroom Management EdmodoGoogle ClassroomClassdojo
Mobile App for Communication WhatsappViberTelegramRemind
Digital Survey Tools GoogleformTypeformSurvey monkey
Table III: Subject Speci c Mobile Applications
MathematicsSocraticGeogebraMyScript CalculatorDesmosMaths Mobile App for Teaching and Learning MathsMath TricksMaths Formula FreeGrapherGeometry PadPocket MathematicsAll Math Formula etc.
English DuolingoFluentUMemriseCulipsStudy FlashTalkTalk English etc.
Social Science Today in HistorySSC Social ScienceIndian History in English etc.

91Volume 11, Issue 1 • January-June 2020
Physical Education PE gamesPET Sports appEdu SportsYoga Daily FitnessYoga for weight loss etc.
Science Cell worldMEL ChemistryNASAMath and Science Tutor3D brainScience BankAnatomy 4DScience Experiments VIDEOsBooks of ScienceBrain POP etc.
Computer Science Learn Computer CourseComputer Science DictionaryComputer Science MCQsProgramming Hub: Learn to codeComputer science Quiz etc.
Economics Economics made easyBasic EconomicsMacro Economics etc.
Management Principles of ManagementSales ManagementWrike-Project management etc.
VII. FUTURE SCOPE
Through this extensive research and analyses, this study can be comprehended with a conclusion that mobile applications have a tremendous impact over the lives of people. Considering almost every way of life, mobile applications play a signi cant role and hence, turn out to be a part of day to day activities.
Certainly, it can easily be understood that students tend to explore several kinds of applications serving different needs in day to day life. Thus, it re ects how they’re in uenced by the dynamically growing technology and hence, proving out to be the strongest area to trigger the development factor in them. It is quiet convenient for us to determine the signi cance of mobile applications. But what’s important is that how we manage to blend this technology with education which would ultimately raise the bars of growth and success. The future depends on how we treat our present. Whatever we do today may re ect where we stand in our future. The youth is the key to the progress of the world. Considering the signi cance of education, the ultimate strategy to enforce the strength in the structure of learning could be blending it up with the rising technology. When we would push the boundaries of education beyond the classroom walls, new ideas and
aspirations will start to emerge which may take the future of the world even higher. It would facilitate students with their desired zone of learning which would eventually prosper their growth and development. Certainly, this would also lead to a kick start to an innovative way of learning which would gather a huge adoption by students across the world and would lead to an increase in the spread of convenient education. Mobile applications wouldn’t only serve the purpose of convenient and a smart means of education but would also result in easy accessibility of the academic content anytime, anywhere, without carrying the heavy loads of books.
Also, educating students about the same could lead to an add-on to the agenda of empowering education. The awareness of today’s youth can lead to marvellous progress of the tomorrow’s world. Students must be educated of crucial subjects like technology speci cally in terms of education, where mobile applications are the best suited means to impart knowledge in the most conveniently accessible ways. This would not just expand their knowledge, but also sow the seeds for an extremely successful future in terms of technological as well as educational growth and advancements.
VIII. CONCLUSION
Mobile apps help to develop Critical and thinking skills of Learners. Formative assessment tools are convenient, easily accessible, and inexpensive and it also supports the learning environment. Use of Information and Communication Technology (ICT) in education is one of the most important changes in the Teaching learning. Now a days due to the advancement in technology and mobile phones with feature oriented features, students can learn at their convenience just a click away. Mobile applications play a major role in the Teaching Learning Process. The use of Mobile Applications in Education can offer various bene ts to the learning environment. Mobile phone enables teachers and students to share their knowledge and experience at any time anywhere. Implementation of Mobile applications in education plays a signi cant role in changing the traditional teaching learning process. Mobile learning has gained importance in higher education sector because most of the students own their own mobiles. Now a day’s students need digitized materials and also they want soft copy of notes and power point presentations. Students depend more on internet, e books and mobiles for clarifying their doubts. So Mobile Apps play a signi cant role in the teaching learning evaluation process.
92 IITM Journal of Management and IT
REFERENCES [1] Drigas and Angelidakis (2017) Mobile Applications within
Education An Overview of Application Paradigms in Speci c Categories, International Journal of Interactive Mobile Technologies, Vol 11, No 4 (2017), https://doi.org/10.3991/ijim.v11i4.6589.
[2] Ekaterina Pechenkina (2017), Developing a typology of mobile apps in higher education: A national case-study, Australasian Journal of Educational Technology, 2017, 33(4). 134.
[3] Hans Gaurav & Sidana Harsha (2018) Mobile Learning Application and its usage Among Students in Education, Journal of Emerging Technologies and Innovative Research, Volume 5, Issue 1, (ISSN-2349-5162).
[4] Karabatzaki et. al; (2018) Mobile application Tools for Students in Higher Education: An Overview of Application Paradigms in Specific Categories, International Journal of Interactive Mobile Technologies (IJIM) · March 2018 DOI: 10.3991/ijim.v12i2.8158.
[5] Luna-Nevarez Cuauhtemoc and McGovern Enda (2018),On the Use of Mobile Apps in Education: The Impact of Digital Magazines on Student Learning,Journal of Educational
Technology Systems 2018, Vol. 47(1) 17–31 sagepub.com/journals-permissions DOI: 10.1177/0047239518778514.
[6] Mohd Shoaib Ansari & Aditya Tripathi (2017), An Investigation of Effectiveness of Mobile Learning Apps in Higher Education in India, International Journal of Information Studies & Libraries, Volume 2, Issue 1, 2017.
[7] Ji-Hye Bae, Sung-Ki Kim(2014), Research on Educational Use of Smart-Phone Applications with Smart Clicker Technique, Advances in Computer Science and its Applications, 2014, Volume 279, ISBN: 978-3-642-41673-6.
[8] Richardson, J., & Lenarcic, J. (2008). Text messaging as a catalyst for mobile student administration: The trigger experience. International Journal of Emerging Technologies, 6(2), 140–155.
[9] Yeap, J. A., Ramayah, T., & Soto-Acosta, P. (2016). Factors propelling the adoption of m-learning among students in higher education. Electronic Markets, 26(4), 323–338.
[10] https://www.digitaltrends.com/mobile/best-educational-apps/2/[11] http://www.edudemic.com/most-used-mobile-apps-education/[12] https://elearningindustry.com/mobile-apps-in-education-5-bene ts[13] https://www.edsys.in/12-bene ts-of-using-apps-in-education/

93Volume 11, Issue 1 • January-June 2020
Abstract—The purpose of this paper is to present an idea of machine learning tools that are currently in use or are being studied globally. This work explains the detailed explanation of what is machine learning. This paper introduces a machine learning study by various authors. This work is summarizing the various machine learning tools and their comparisons and recent studies of machine learning tools respectively. The material presented in this paper is the result of a literature review of different research papers and books. This work compares the various tools of machine learning. Keywords— Machine learning, Scikit, Weka, Tensor ow Accord.net.
I. INTRODUCTION
Machine learning is the science of getting computers to act without being explicitly programmed. In the past decade, machine learning has given us self-driving cars, practical speech recognition, effective web search, and a vastly improved understanding of the human genome. Machine learning is so pervasive today that you probably use it dozens of times a day without knowing it.There are several tools we have discuss in this paper that can let you play with data, train models, create your algorithms. You can invest your time by using the good tool instead of giving efforts on making your own. Tools can save time and helps in getting the desire result.
A. Machine learningMachine learning is the part of AI it is basically the ability of machine to learn from their previous knowledge and analyze automatically and progress from that information to give the best outcome. It focuses on the development of computer systems which can access and process data by own. The learning problem is divided into three types:1. Unsupervised learning: It gets a model that is similar
to the origin of the installation experience and can predict what new experience to expect. The computer is trained on the raw data. Here no teacher, in fact a computer can teach you new things after learning
patterns in data, these algorithms are especially useful in situations where a human expert doesn’t know what to look for during data.
While the standard algorithm falls under supervised learning there are Neighborhood, Naive Bay, Decision Making, Linear Extraction, Machine Support (SVM), Neural Networks, guided reading, reinforcement learning [1].
2. Supervised learning: Separate which item belongs to you after seeing examples of items from each category or compression. Supervised learning algorithms for measuring the relationships and dependencies between target outputs and thus input features such as this will predict the output values of brand spanking new data that support this relationship you learned from the previous data set [1].
3. Reinforcement learning: Reinforcement learning can be a form of machine learning, and thus also an AI branch. This type of learning allows machines and software representatives to automatically determine the correct behavior within a speci c context, thus increasing its performance. A simple reward answer is needed for the agent to nd a code of conduct; this is often referred to as a sign of strength.
Learning Stress is de ned by the selected type of problem, and all of its solutions are calculated as Reinforcement Learning algorithms [2].
B. Importance of Machine learningReviving the interest of machine learning thanks to the same things that have made the data processing and Bayesian analysis much popular than before. Things like increasing volume and the types of data available, computer-related processing is cheaper and more powerful, and cheaper data storage.All of the things mean that it is possible to fastly and automatically generate models which can analyze big, complex data and can deliver fast, accurate results - or to a much greater degree. And by making models, the company is investing in better opportunities - or avoiding some unknown risks [3].
A Study on Machine Learning ToolsShivani Sharma1, Sudhir Kumar Sharma2
1,2,3Institute of Information Technology and Management, New [email protected],[email protected]
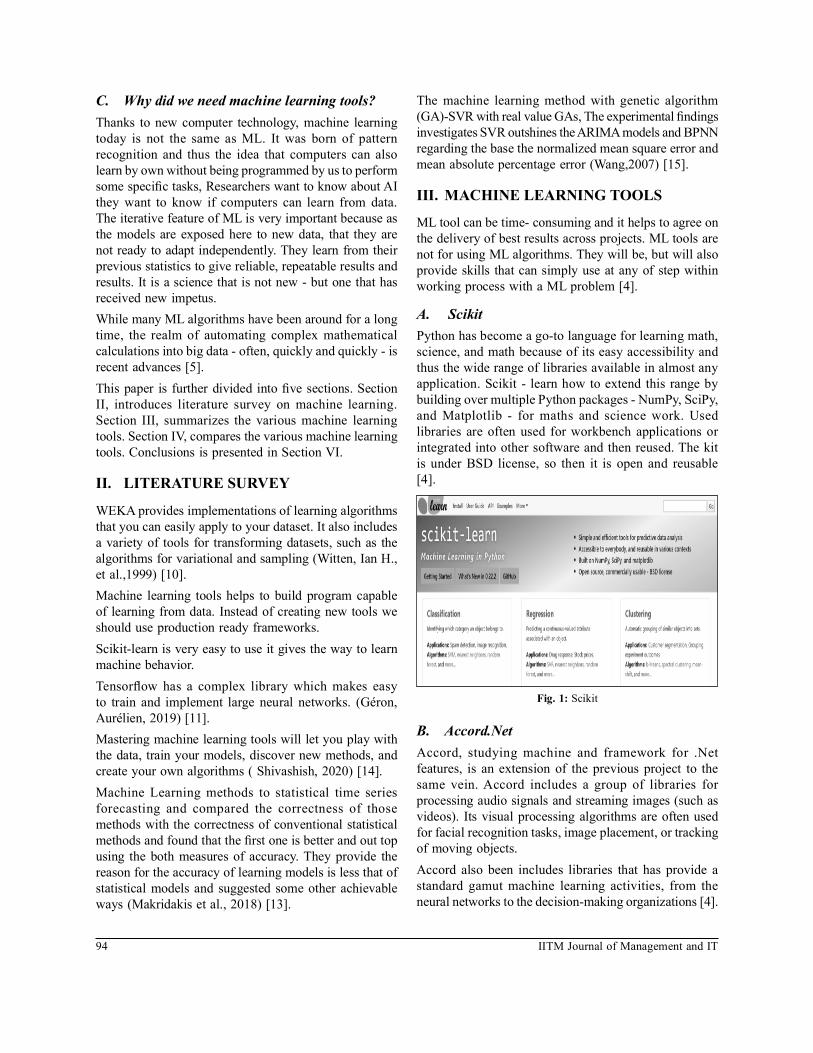
94 IITM Journal of Management and IT
C. Why did we need machine learning tools?Thanks to new computer technology, machine learning today is not the same as ML. It was born of pattern recognition and thus the idea that computers can also learn by own without being programmed by us to perform some speci c tasks, Researchers want to know about AI they want to know if computers can learn from data. The iterative feature of ML is very important because as the models are exposed here to new data, that they are not ready to adapt independently. They learn from their previous statistics to give reliable, repeatable results and results. It is a science that is not new - but one that has received new impetus.While many ML algorithms have been around for a long time, the realm of automating complex mathematical calculations into big data - often, quickly and quickly - is recent advances [5].This paper is further divided into ve sections. Section II, introduces literature survey on machine learning. Section III, summarizes the various machine learning tools. Section IV, compares the various machine learning tools. Conclusions is presented in Section VI.
II. LITERATURE SURVEY
WEKA provides implementations of learning algorithms that you can easily apply to your dataset. It also includes a variety of tools for transforming datasets, such as the algorithms for variational and sampling (Witten, Ian H., et al.,1999) [10].Machine learning tools helps to build program capable of learning from data. Instead of creating new tools we should use production ready frameworks.Scikit-learn is very easy to use it gives the way to learn machine behavior.Tensor ow has a complex library which makes easy to train and implement large neural networks. (Géron, Aurélien, 2019) [11].Mastering machine learning tools will let you play with the data, train your models, discover new methods, and create your own algorithms ( Shivashish, 2020) [14].Machine Learning methods to statistical time series forecasting and compared the correctness of those methods with the correctness of conventional statistical methods and found that the rst one is better and out top using the both measures of accuracy. They provide the reason for the accuracy of learning models is less that of statistical models and suggested some other achievable ways (Makridakis et al., 2018) [13].
The machine learning method with genetic algorithm (GA)-SVR with real value GAs, The experimental ndings investigates SVR outshines the ARIMA models and BPNN regarding the base the normalized mean square error and mean absolute percentage error (Wang,2007) [15].
III. MACHINE LEARNING TOOLS
ML tool can be time- consuming and it helps to agree on the delivery of best results across projects. ML tools are not for using ML algorithms. They will be, but will also provide skills that can simply use at any of step within working process with a ML problem [4].
A. ScikitPython has become a go-to language for learning math, science, and math because of its easy accessibility and thus the wide range of libraries available in almost any application. Scikit - learn how to extend this range by building over multiple Python packages - NumPy, SciPy, and Matplotlib - for maths and science work. Used libraries are often used for workbench applications or integrated into other software and then reused. The kit is under BSD license, so then it is open and reusable [4].
Fig. 1: Scikit
B. Accord.NetAccord, studying machine and framework for .Net features, is an extension of the previous project to the same vein. Accord includes a group of libraries for processing audio signals and streaming images (such as videos). Its visual processing algorithms are often used for facial recognition tasks, image placement, or tracking of moving objects.Accord also been includes libraries that has provide a standard gamut machine learning activities, from the neural networks to the decision-making organizations [4].
95Volume 11, Issue 1 • January-June 2020
Fig. 2: Accord.Net
C. H2OH2O algorithms are designed for business processes-trick or track prediction, for example, rather than, say, image analysis. H2O can interact during stand-alone fashion through HDFS stores, over YARN, on MapReduce, or directly in the case of Amazon EC2. Hadoop mavens can use Java to communicate with H2O, but the framework also provides Python, R, and Scala bundles, allowing you to interact with all the libraries available on those platforms as well [4].
Fig. 3: H2O
D. WekaIt is may be a set of Java machine learning algorithms designed specifically for data processing. This GNU GPLv3 licensed collection features a package program to enhance its functionality, by including both the formal and informal packages. Setup even comes with a manual to explain both of the software so the techniques are used.While the layup is not speci cally focused on Hadoop users, the most recent versions are often used with Hadoop due to a bunch of wrappers. Note that the layout no longer supports Spark, only MapReduce [4].
Fig. 4: Weka
E. TensorFlowIt was developed by Google itself, it is a popular and basic tool who start exploring machine learning tool or we can say that machine learning lovers must known about it.It gives features such as:• Building of neural networks.• Lets you build and train your data models.• It gives model converter named as Tensor ow.js by
which its easy to convert your model that already exists.
It can be use in two methods once is by script tags or another is through install NPM [4]
Fig. 5: TensorFlow
F. PyTorchIt is developed by Facebook and based on torch which is Lua based framework.
Fig. 6: PyTorch

96 IITM Journal of Management and IT
It provides neural network and optimizing algorithm features. It helps in building dynamic graphs and gives more interactive framework which makes you feel more communicative with tool [6].
G. KnimeIt is a free open source software and first started development on Jan 2004 by software engineer team.It has interactive drag and drop feature of analytics simple and robust in nature, it uses the pipeline feature to combine the data.It provides the features such as:-• Data mining• Integration• Analytics• Machine/ deep learning• Pipelining[6]
Fig. 7: Knime
H. MLlibIt is an Apache Spark machine learning library. Its motive is to build effective ML techniques that are not hot and precise. It can run on hadoop, mesos etc. It contains standard learning algorithms and resources, including segmentation, reorganization, integration, collaborative ltering, dimension reduction, and low-priority features and advanced pipeline APIs.[6]
Fig. 8: MLlib
I. ShogunIt was released in 1999, developers are Soeren Sonnenburg and Gunnar Raetsch. It is a free open source tool. It provides wide range of algorithms and data structure for learning of machine.This tool is developed in C++ language and it provides support for different languages such as LUA, Python, Ruby, Octave, R, Java etc. It focuses on the following:• Regression problem• vector machine for classi cation• large scale data setIt is easy and simple to use. It gives great features for user and its libraries can be used in educational and research purpose [6].
Fig. 9: Shogun
IV. COMPARISON OF MACHINE LEARNING TOOL
This section compares nine machine learning tools. The details are presented in Table 1.
Table 1: Comparison of Machine Learning Tools
S. no. Tools Language Platform Open
source
1 Scikit Python, Cython, C, C++
Linux, Windows, Mac OS
Yes
2 Accord.net C sharp(C#) Cross-plat-form
Yes
3 H2O JavaLinux,
Windows, Mac OS
Yes
4 Weka JavaLinux,
Windows, Mac OS
Yes
5 Tensor-Flow
Python, CUDA, C++
Linux, Windows, Mac OS
Yes
97Volume 11, Issue 1 • January-June 2020
6 PyTorch Python, CUDA, C++
Linux, Windows, Mac OS
Yes
7 Knime JavaLinux,
Windows, Mac OS
Yes
8 MLlib Python, Java, RLinux,
Windows, Mac OS
Yes
9 Shogun C++Linux, Win-dows, Mac OS, Unix
Yes
V. CONCLUSION
This work presented the basic concepts of machine learning. This paper compared the nine machine learning tools widely used now a day. All tools explored in this study are open source. TensorFlow is extensively used by researchers for Deep learning algorithms. A python library knows as Scikit learn is very popular among the students for making students projects. Almost all machine learning algorithms are available in the Scikit learn package. These machine learning tools can save time and help in synergy by delivering good results across projects.
REFERENCES[1] IH Witten, E Frank, LE Trigg, MA Hall, G Holmes “Practical
machine learning tools and techniques ”[2] IH Witten, E Frank, MA Hall, CJ Pall “Data Mining: Practical
machine learning tools and techniques”- 2016 [3] Artur Kiulian- “How To Do Business with Artificial
Intelligence.”-2017
[4] Yegulalp, Serdar. 2020. “11 Open Source Tools To Make The Most Of Machine Learning”.
[5] “Christian Hissibini – .NET Mobile Development”. 2020.[6] Brownlee, Jason. 2020. “Machine Learning Tools”. [7] L.-J. Li and L. Fei-Fei. What, where and who? classifying events
by scene and object recognition. In Proc. ICCV, 2007.[8] J. Sanchez, F. Perronnin, T. Mensink, and J. Verbeek. Image
classi cation with the sher vector: Theory ´ and practice. Int’l Journal of Computer Vision, 2013.
[9] B. Yao, X. Jiang, A. Khosla, A. L. Lin, L. Guibas, and L. Fei-Fei. Human action recognition by learning bases of action attributes and parts. In Proc. ICCV, 2011.
[10] Witten, Ian H., et al. “Weka: Practical machine learning tools and techniques with Java implementations.” (1999).
[11] Géron, Aurélien. Hands-On Machine Learning with Scikit-Learn, Keras, and TensorFlow: Concepts, Tools, and Techniques to Build Intelligent Systems. O’Reilly Media, 2019.
[12] P. Agrawal, R. Girshick, and J. Malik. Analyzing the performance of multilayer neural networks for object recognition. In Proc. ECCV. 2014.
[13] Spyros Makridakis , Evangelos Spil io t is , Vassi lios Assimakopoulos, ” Statistical and Machine Learning forecasting methods: Concerns and ways forward”, PLoS ONE 13,2018
[14] Shivashish, ”Top 15 Most Used Machine Learning Tools By Experts!!”, 2020
[15] Kuan-Yu Chen, Cheng-Hua Wang, “Support vector regression with genetic algorithms in forecasting tourism demand”, Tourism Management 28, pp 215–226, 2007
[16] S.B. Kotsiantis, “Supervised Machine Learning: A Review of Classi cation Techniques”, Informatica. pp 249-268, 2007.
[17] Yogesh Singh, Pradeep Kumar Bhatia & Omprakash Sangwan “A review of studies in machine learning technique”. International Journal of Computer Science and Security, vol.1, pp 70 – 84, 2007.
[18] Petersp, ”The Need for Machine Learning is Everywhere” March 10, 2015.
[19] Pedro Domingos, “A Few useful Things to Know about Machine Learning”.2012.

98 IITM Journal of Management and IT
Abstract — As the importance of distributed computers is rapidly growing, they are becoming the target of more and more crime. Intrusion may be de ned as the set of attempts to compromise computer network security. Besides the several security services, Intrusion Detection System/Techniques are taken into point that strengthen the system security and is more powerful in preventing internal and external attacks. This technique is considered to be very ef cient in preventing wireless communication in Fifth Generation. In this paper we will discuss what Mobile Cloud Computing is and various Intrusion Detection Techniques for mobile computing along with challenges faced by each technique. Keywords— Intrusion, Mobile Cloud Computing, Intrusion Detection System/Techniques.
I. INTRODUCTION
The latest fast growth of advanced mobile technologies led to a great advantage in the development of mobile cloud computing (MMC). Mobile devices performance has enhanced by incorporating three technologies in which the rst one to be involved is cloud computing, second is mobile internet and third is mobile computing in which choosing MCC has become main advantage.Taking into consideration, Fifth Generation (5G) background in the coming time, MCC will achieve greater class performances in unloading computation by relocating data storage and processing data to the cloud so that the abilities of the mobile devices can be enhanced [4-7] by the cause of improved bandwidth. Though, lot of provocations will be faced by advanced wireless networks [8, 9], that has been investigated from different aspect by earlier research [10]. Out of which one of the provocations is that controlling risk from intrusions is not easy because of managing tool limitations, mutual interferences between signal cells, high ef ciency wireless communications, intentional attacks and improper user authentications. The intrusions are concealed by attackers with the help of enhanced networking speed.
The paper shows safety concerns in MCC and combines latest attainments all together in intrusion detection abilities so that the approaches can be found which can successfully deploy the rise in heterogeneous 5G. As Intrusion Detection System (IDS) is a vital authority that has been related with various techniques. As each technique has different property therefore each observation process has both prevalence and restrictions. The major benefactions of this paper are bifold:• It allocates 5G users of future and developers with
an analytical efficient model to attain safe data communication.
• It analysis and integrates all critical safety concerns in MCC from a technical aspect.
II. M O B I L E C L OU D C OM PU T I N G TERMINOLOGY IN FIFTH GENERATION
A. MOBILE CLOUD COMPUTINGTo extend cloud to the edge of the networks, one of the cloud service models, MOBILE CLOUD COMPUTING is fast emerging. It consists of various mobile devices that are useful for many users. A prediction was made by Gartner that by 2013, PCs will be overtaken by mobile phones as the most common web access devices, worldwide [1]. Mobile Cloud Computing mainly tells how the resources of cloud can be best utilized by smart phones to reduce its consumption of energy. And a particular task can be executed either on mobile device or can be sent to cloud. Overhead tradeoffs between communication and computation, decides where to execute the task. One of the most important features is that the data processing and data storage are migrated from mobile devices to cloud. With this feature, to support applications running in cloud MCC model is designed that offers high level centralized functions. If we talk about security in MCC model, the security problems can be addressed by threat assessment from three technologies- Mobile Internet, Cloud Computing and Mobile Computing [2]. This model
Intrusion Detection Techniques for Mobile Cloud Computing in Heterogeneous 5g
#Ishu Chawla, #Oshin Vinayak, #Suman Singh#Department of Information Technology, Institute of Information Technology & Management,
Janakpuri, New [email protected], [email protected], [email protected]

99Volume 11, Issue 1 • January-June 2020
also helps in reducing obstacles that are related to security (reliability and privacy), performance and environment.
1. MOBILE COMPUTINGTo enable devices that are portable, to access the services available on the web, a platform known as Mobile Computing is developed that is supported by wireless networks. It is a technology in which without being connected to a xed physical link, we can transmit data, video and voice via any wireless device. It involves the following:a. Mobile Hardware: To receive and access the
service of mobility, Mobile devices or components comes in this category such as, tablet PCs, portable laptops, smartphones, etc. These devices are capable of sending and receiving signals at the same time.
b. Mobile Communication: To ensure that seamless and reliable communication goes on, mobile communication is an infrastructure that is put in place for the same. For example, services, portal, protocols and bandwidth necessary to support the services. It ensures that the other systems that offers the same service, does not collide.
c. Mobile Software: It is the actual program that runs on the mobile hardware. It is the operating system of appliance. It deals with the demands and characteristics of mobile applications. It is the most essential component used to operate mobile devices.
It is useful in reducing application’s development time. When communication takes place, it also faces threats. For example, one of the threats is when using virtual private network, the wireless communication can be easily invaded because of interconnection of various networks. Authentication and encryption methods are used for security in mobile computing for virtual private network access.
2. MOBILE INTERNETThe method of accessing browser based Internet services from mobile devices, such as smartphones, through wireless networks is referred to as mobile internet. It is a technology derived from development of wireless networks. Some recent technologies that are active, includes: Third Generation (3G), Mobile Commerce (M-commerce), WiFi and long term evolution. The future asset for mobile internet is 5G. The central idea of mobile internet is to connect two communicators that support Web services, via wireless network. Web services may be de ned as any software that makes itself available on internet and uses a standardized messaging system known as XML. It can also be de ned as consolidation of web
applications by using Simple Object Access Protocol, Extensible Markup Language, Web Services Description Language and Universal Description, Discovery and Integration. The security criteria and requirements may vary in mobile internet. Therefore, they often address service layer objects such as application, platform and infrastructure layer. It doesn’t matter which layer is choose, wireless network itself always faces threats from intrusion.
3. BEHIND CLOUD COMPUTINGCloud computing have some technologies that are similar to the deployments or service types[10,11].Basically, there are three technologies that are adopting the cloud computing with the Mass Distributed Storage(MDS) virtualization and the technology that are under the Parallel Programming Model(PPM)[12-15].Cloud computing used service deployment technology that are provided by virtualization. The main advantages of the virtualization was that distributing the resources among multiple levels of service[16,17] with the help of object virtualization that are network, storage, data, physical machine and servers[18].If the levels of service are explained only then the virtual machine are capable of delivering the services of the system to the end users. Virtual machine also capable for describing the information in a proper way and represent the resources in a set of entities that are logic-related for the end-users [19-21]. Virtual machine provide some application that are isolated in nature to the end-users with the functionality of the virtualized system and that application are running on the operating system. By using the Virtual machine the cost of resources are reduced for the end-users, saved the usage of energy and provide the easiest path for the maintenances of system[22-24].The main function of Virtual machine are independent in nature and provided the isolated platform to the users system component and protect the information of users from the attackers[25,26].Attackers provided the controls of the Virtual machine in the context of the networking by attacking the provisioning and con guration module that are used for the formation of lowest layer that are reside on the hypervisor in cloud[27].The nature of the Virtual machine are dynamic so that it provide the level of dif culty to control the security of the system. Due to the nature of Virtual machine, the vulnerability of the system are also increased [28].By reducing the overhead of virtualization and reliability of system, Lin et al [29] proposed a technique that are used and supported the features of the hardware so that the performance of the Virtual machine easily improved that are known as hybrid virtualization. MDS technology are used for storing the data in different storage servers for protecting the loss

100 IITM Journal of Management and IT
of data from any kinds of disaster. MDS is a technique that are used for increasing the infrastructure ef ciency and data reliability by using the different and distributed application and storage servers. For setup the connection of the distributed multiple services, the interconnection among the heterogeneous network are used in MCC[30].Some storage devices are available as infrastructure that are the major security concern for the users in MCC.MDS are used as a wireless technique among multiple location that are responsible for the infrastructure’s changes. But this technique provided many problems such as disconnecting the servers, supplied incorrect signals and network management chaos. For reducing these problems, MDS provide technique to the end-user such as cloud base services [30].PPM is a technique that are commonly known as cloud based solution and solved the problem of synchronous tasks by accepting the parallel data processing. This technique are used for drilling the tasks into multiple number of small tasks so that the tasks can easily solved in minimal time. For solving the problem of large sized information, parallel programming model was the best approach [31]. In the above description of the techniques are considered as a fundamental unit of cloud that are designed for the solution and the security concern. Now there are various section have the knowledge about the heterogeneous network that are used for providing the platforms of networking to the cloud computing.B. HETEROGENEOUS FIFTH GENERATION
NETWORKSA heterogeneous network is considered as a wireless network that are used for the connection of portal devices with different operating systems and describe the explanation of the integrated network to the end-users. Heterogeneous network provide some protocols without any problem of manufactures. Heterogeneous network are also called mixture-style network that are used in the recently wireless area which support the advanced mobile broadcast services[49].In mobile broadcast services, new style of spectrums are used for increasing the compatibility and provided the fashionable improvement to the network performance. These spectrums required long time for providing the goal of the current methods [32]. Now focus on the previous information of the heterogeneous data in network, some features can be predicted for the future data of heterogeneous 5G of network in the context of mobile. The rst one was introduced the explanation of the heterogeneous 5G that are used for improving the performance of the future devices. Mobile cloud have heterogeneous network that provided solution for improving the performance of network management and saved the energy usage trade-off[33].For improving the network management broadly, a technique are used
such as leveraging distributed. These technique have the capacity to increase the 5G dramatically. Heterogeneous network are also used for the end-users so that they can easily switch network between the latest one 5G, 4G and the WIFI that are concern the security and the interoperability[34].There are many problem for adopting the MCC that is interferences and standardization among the networks and provide the intrusion properties with the attackers. There are some current intrusion detection technique that are used for the context of advanced wireless network.
III. INTRUSION DETECTION SYSTEMS
Intrusion may be defined as the set of attempts to compromise computer network security. Besides the several security services, Intrusion Detection System/Techniques are taken into point that strengthen the system security and is more powerful in preventing internal and external attacks. Intrusion can also be de ned as an attack which can occur in any situation. Some tasks handled by IDS area. It prevents and mitigates the damage caused by
intrusion.b. It identi es the activity that can cause a more serious
attack.c. It identi es the attack perpetrator.d. It discovers new attack patterns.Some requirements that the IDS follow to ful ll its tasks include completeness, accuracy, performance, timeliness and fault tolerance.IDS is classi ed into 5 categories:a. Detection based on Anomaly (ABD)b. Detection based on Signatures (SBD)c. Hybrid Intrusion Detectiond. Stateful Protocol Analysis Detection (SPAD)e. Detection based on Speci cations (SPBD)
A. DETECTION METHODOLOGIESThis part includes the description of techniques, concepts, limitations and deployments of various IDSs including ABD, SBD, hybrid intrusion detection, SPAD and SPBD approaches.1. SIGNATURE BASED DETECTION AND
APPROACH This technique is also known as Misuse Detection.
It depends on the known patterns of unauthorized behavior [35]. It comprises of storing the signature pro les that identi es patterns that are associated with network intrusions in signature database and generates some rules that are based on signature

101Volume 11, Issue 1 • January-June 2020
pro les. The data packets that are transmitted on the network with their corresponding classi cation rules are classi ed on the basis of these generated rules. The intrusion patterns or strings on the database that are pre-installed, SDB depends on that. If SDB system is not updated, the signatures will not be detected that results in decrease of its performance. Since the intrusions are dynamic, the IDS using SBD may not identify new threats when connected to internet. This problem can be solved by deploying an automated signature creator that is attached to this system [36, 37]. By collecting and analyzing the constituents of consistent behaviors, these signature creators can be generated [38, 39]. But this solution has also a limitation that the latest algorithms cannot completely detect all malicious instances. Due to the excess load of packets on network, the performance is deducted when the processing capability cannot match the wireless transmission ability [40]. This can be solved if the data storage and processing can be moved to cloud and by examining the parallel signature matching on cloud based servers [41].
2. HYBRID INTRUSION DETECTION Different types of intrusion depend on the security
that are requested by the users [42,43,44,45].This type of intrusion detection are the combination of the two techniques that are called packet header anomaly detection(PHAD) and second technique called network traf c anomaly detection(NETAD)[46].The limitations of these two technique are prevented by using the two components of detection such as misuse and anomaly. These two major components are designed by using the random forest algorithm [47]. These two techniques are designed on the bases of IDS which are used for the open sources assignment[48].The main aim of hybrid intrusion technique to increase the accuracy of the detection and decreasing the complexity of the network system[49].The hybrid intrusion detection technique are also used for enhancing the performance of the wireless network and designed the hierarchical structure of network[50].The main drawback of the hybrid intrusion detection was that in these it is dif cult to combine the different types of detection techniques. In these multiple techniques are come to perform the tasks at the same time that’s why the workload of the packets are increase.
3. A N OM ALY-B AS ED D ET EC T IO N A ND APPROACH
This system is an intrusion detection system which helps in detecting both network as well as computer
intrusions and misapply by monitoring system activity and categorizing it normal or anomalous. The categorization is based on rules instead of signatures or patterns, and trying to identify any kind misapply that comes from normal system operation. The ABD system represents an approach of recognizing obvious separation or unpredictability in the events and transmissions [51, 52-54]. The collation if there is any separation in the usual and unfamiliar deportment and this unfamiliar deportment is observed to be dynamic or possible assault, which rely on the amount distinctness. There are three major techniques sustaining collations which contain mathematical-based [55], fact-based, and machine knowledge-based techniques [56,57].
Mathematical-based (also referred as statistical-based) technique: This technique route each and every traf cs and creates a description which analyzes if there might any kind of inappropriate traf c by a mathematical examination [58]. The problems for implementing mathematical-based technique are bifold. First, placing an actual stability between good or bad deportment is dif cult. Second, if the system is being assaulted this technique may get failed.
Fact-based technique: It is a kind of computer program that make use of knowledge base to resolve complicated problems. This technique is relevant to those systems that have distinct knowledge structures or connected to set of rules [58], like symbolic representation.
Machine learning-based technique: Machine learning is a branch of computer science that provides computers the potential to know without being precisely programmed. In machine knowledge-based technique, [57,58] latest deportment models which are based on the considerations of events, events, and activities are built.
4. SPECIFICATION-BASED DETECTION AND APPROACH
When compared with Anomaly-based detection, SPBD has almost identical mode for perceiving divergence but wants users to set up a behavior consideration level in a particular-requirement formation [60]. The stimulation for practicing SPBD system is to achieve excessive level of abilities in recognizing recent attacks and improving perfection. The SPDB approach is observed as a suitable result to inspecting the variable-extent patterns [61]. Although, identical to other ABD systems, the SPBD system too needs a large number of tasks for determining normal behavioral speci cations.
102 IITM Journal of Management and IT
5. STATEFUL PROTOCOL ANALYSIS AND APPROACH
The idea of stateful protocol analysis is basic to put stateful properties together to regular protocol analysis. The SPAD access of incursion investigation that differentiate inconsistent conclusions from regular courses in a period purchasing a preset global pro le [62]. The pro le supply ultimate users with an account of protected and reliable activity de nitions. While performing the SPAD both the Datagram Protocol (UDP) as well as Transmission Control Protocol (TCP) will be assessed. [63]. This respective technique has the major absolute property which is supplying evaluation with stateful properties. In spite that the SPAD proposes powerful protocol analyses, there are two restrictions in practice. Furthermore, the dif culties of detecting assaults based on a particular request or retaliation are not fully xed by that technique. Inscribing these dif culties, additional stateful properties required to be sum up with t the protocol analysis pro le, which coincidentally claims large tasks and massive packets.
B. USER AUTHENTICATION For the security, the high level of password are generated for the authentication’s user. If the password of the user does not match then the user cannot get their information due to the security purpose. The main aim of the authentication was to ensure that the identities of the user was matched with the help of mechanisms of the authentication and randomly checked that the user request are forward to the parties with the appropriate password [64]. The mechanisms for testing the identities of the user is called biometric. The biometric mechanisms of the authentication checked the identities such as password (eye detection, nger prints etc.), behavior of the given characteristics [65-67]. This mechanism are used for the protection of the access user and supported by the password veri cation technique. This technique forward the data and the user information to the access user that are authentication for the data and create the privacy of data during the communication of the wireless network.
IV. CONCLUSION AND FUTURE WORK
This technologies of the networking are designed for the bene ts of the user with the help of MCC and 5G heterogeneous network. IDS technique are used for the protection of the wireless networking communication with the help of protection the transmission of user data. This review paper discuss about the techniques of wireless
network that are used for the communication and gave the outcomes based on the some achievements such as MCC, IDS and the 5G heterogeneous network. For securing the high level communication of the wireless 5G, introduced the framework that are based on the cloud intrusion detection techniques.Based on these review paper, there are some questions that are introduced for the future work.(1) How to solve the problem of security with the help
of Cloud based IDS?(2) If we generate some model such as energy
aware model, how to ful ll the usage of the 5G heterogeneous network for the mobile cloud computing?
(3) How we can explain the transmission of secure data between the cloud based IDS and the users?
REFERENCES 1. Huang, D. (2011). Mobile cloud computing. IEEE COMSOC
Multimedia Communications Technical Committee (MMTC) E-Letter.
2. Intrusion detection techniques for mobile cloud computing in heterogeneous 5G Keke Gai1, Meikang Qiu1 *, Lixin Tao1 and Yongxin Zhu2.
3. Kumar K, Lu Y. Cloud computing for mobile users: can of oading computation save energy? Computer 2010.
4. Shiraz M, Gani A, Khokhar RH, Buyya R. A review on distributed application processing frameworks in smart mobile devices for mobile cloud computing.
5. Miettinen AP, Nurminen JK. Energy ef ciency of mobile clients in cloud computing, Proceedings of the 2nd USENIX Workshop on Hot Topics in Cloud Computing, Boston, MA, 2010.
6. Simoens P, Turck FD, Dhoedt B, Demeester P. Remote display solutions for mobile cloud computing. IEEE Internet Computing 2011.
7. Qiu M, Su H, Chen M, Ming Z, Yang LT. Balance of security strength and energy for a PMU monitoring system in smart grid. IEEE Communications Magazine 2012.
8. Qiu M, Gao W, Chen M, Niu J, Zhang L. Energy ef cient security algorithm for power grid wide area monitoring system. IEEE Transactions on Smart Grid 2011.
9. Qiu M, Zhang L, Ming Z, Chen Z, Qin X, Yang LT. Security-aware optimization for ubiquitous computing systems with SEAT graph approach. Journal of Computer and System Sciences 2013.
10. Hu F, Qiu M, Li J, Grant T, Taylor D, McCaleb S, et al. A review on cloud computing: design challenges in architecture and security. Journal of Computing and Information Technology 2011.
11. Gai K, Li S. Towards cloud computing: a literature review on cloud computing and its development trends, 2012 Fourth International Conference on Multimedia Information Networking and Security, Nanjing, China, 2012; 142–146. IEEE.
12. Marozzo F, Talia D, Trun o P. P2P-MapReduce: parallel data processing in dynamic cloud environments. Journal of Computer and System Sciences 2012.
103Volume 11, Issue 1 • January-June 2020
13. Masdari M, Zebardast B, Lot Y. Towards virtualization in cloud computing. International Journal of Advanced Research in Computer Science 2013.
14. Wang Y, Sun W, Zhou S, Pei X, Li X. Key technologies of distributed storage for cloud computing. Journal of Software 2012.
15. Zhang S, Yan H, Chen X. Research on key technologies of cloud computing. In Physics Procedia. Elsevier: Beijing, China, 2012.
16. Messaoud E HB, Diouri O. Web service security: overview, analysis and challenges. International Journal of Computer Science Issues 2014.
17. Ma Z, Sheng Z, Gu L. DVM: a big virtual machine for cloud computing. IEEE Transactions on Computers 2013.
18. Zhang S, Yan H, Chen X. Research on key technologies of cloud computing. In Physics Procedia. Elsevier: Beijing, China, 2012.
19. Ma Z, Sheng Z, Gu L. DVM: a big virtual machine for cloud computing. IEEE Transactions on Computers 2013.
20. Luo Y. Network I/O virtualization for cloud computing. IT Professional Magazine 2010.
21. Chaudhary D, Chhillar RS. Reverse host allocation approach for virtual machine cloud computing environment. International Journal of Computer Applications 2013.
22. Langer SG, French T. Virtual machine performance benchmarking. Journal of Digital Imaging 2011.
23. Bright PP, Bijolin EE. Energy efficient virtual machine monitoring architecture for green cloud computing. International Journal of Computer Applications 2013.
24. Lovsz G, Niedermeier F, Meer HD. Performance tradeoffs of energy-aware virtual machine consolidation. Cluster Computing 2013.
25. Zhang F, Chen H. Security-preserving live migration of virtual machine in the cloud. Journal of Network and Systems Management 2013.
26. Wang Z, Liu M, Zhang S, Qiu M. Sensor virtualization for underwater event detection. Journal of Systems Architecture 2014.
27. Modi C, Patel D, Borisaniya B, Patel H. A survey of instrusion detection techniques in cloud. Journal of Network and Computer Applications 2013.
28. Liao H, Lin CR, Lin Y, Tung K. Intrusion detection system: a comprehensive review. Journal of Network and Computer Applications 2013.
29. Lin Q, Qi Z, Wu J, Dong Y, Guan H. Optimizing virtual machines using hybrid virtualization. Journal of Systems and Software 2012.
30. Gani A, Nayeem GM, Shiraz M, Sookhak M, Whaiduzzaman M, Khan S. A review on interworking and mobility techniques for seamless connectivity in mobile cloud computing. Journal of Network and Computer Applications 2014.
31. Dobre C, Xhafa F. Parallel programming paradigms and frameworks in big data era. International Journal of Parallel Programming 2014.
32. Lei W, Hai W, Yu Y, Fei Z. Heterogeneous network in LTE-advanced system, Proceedings of 2010 IEEE International Conference on Communication Systems, Singapore, 2010.
33. Tian Y, Lin C, Li K. Managing performance and power consumption tradeoff for multiple heterogeneous servers in cloud computing. Cluster Computing 2014.
34. Barbu OE, Fratu O. An enabler of interoperability in heterogeneous wireless networks, 2011 2nd International
Conference on Wireless Communication, Vehicular Technology, Information Theory and Aerospace & Electronic Systems Technology, Chennai, 2011.
35. Anjum, F., Subhadrabandhu, D., & Sarkar, S. (2003, October). Signature based intrusion detection for wireless ad-hoc networks: A comparative study of various routing protocols. In Vehicular Technology Conference, 2003. VTC 2003-Fall. 2003 IEEE 58th(Vol. 3, pp. 2152-2156). IEEE.
36. Ocampo F, Castillo T, Gomez M. Automated signature creator for a signature based intrusion detection system with network attack detection capabilities. International Journal of Cyber-Security and Digital Forensics 2013.
37. Anbar M, Manickam S, Hosam A, Chai K, Baklizi M, Almomani A. Behaviour based worm detection and signature automation. Journal of Computer Science 2011.
38. Cherniak A, Zadorozhny VI. Signature-based detection of notable transitions in numeric data streams. IEEE Transactions on Knowledge and Data Engineering 2013.
39. Meng W, Li W, Kwok L. EFM: enhancing the performance of signature-based network intrusion detection systems using enhanced lter mechanism. Computers & Security 2014.
40. Meng W, Li W, Kwok L. EFM: enhancing the performance of signature-based network intrusion detection systems using enhanced lter mechanism. Computers & Security 2014.
41. Omar S, Ngadi A, Jebur HH. Machine learning techniques for anomaly detection: an overview. International Journal of Computer Applications 2013.
42. Stakhanova N, Basu S, Wong J. On the symbiosis of speci cation-based and anomaly-based detection Computer & Security 2010.
43. Gogoi P, Bhattacharyya DK, Borah B, Kalita K. MLHIDS a multi-level hybrid intrusion detection method The Computer Journal 2014.
44. Nadeem A, Howarth M. Protection of MANETs from a range of attacks using an intrusion detection and prevention system. Telecommunication Systems 2013.
45. Aydın, M. A., Zaim, A. H., & Ceylan, K. G. (2009). A hybrid intrusion detection system design for computer network security. Computers & Electrical Engineering, 35(3), 517-526.
46. Peddabachigari, S., Abraham, A., Grosan, C., & Thomas, J. (2007). Modeling intrusion detection system using hybrid intelligent systems. Journal of network and computer applications, 30(1), 114-132.
47. Zhang, J., & Zulkernine, M. (2006, April). A hybrid network intrusion detection technique using random forests. In Availability, Reliability and Security, 2006. ARES 2006. The First International Conference on (pp. 8-pp). IEEE.
48. Hai, T. H., Khan, F., & Huh, E. N. (2007, August). Hybrid intrusion detection system for wireless sensor networks. In International Conference on Computational Science and Its Applications (pp. 383-396). Springer, Berlin, Heidelberg.
49. Nadeem A, Howarth M. Protection of MANETs from a range of attacks using an intrusion detection and prevention system. Telecommunication Systems 2013.
50. Li J, Ding Y, Xiong Z, Liu S. An improved biometricbased user authentication scheme for C/S system.International Journal of Distributed Sensor Networks 2014.
51. Meng W, Li W, Kwok L. EFM: enhancing the performance of signature-based network intrusion detection systems using enhanced lter mechanism. Computers & Security 2014.

104 IITM Journal of Management and IT
52. Nagarajan N. An anomaly-based network intrusion detection system using fuzzy logic. International Journal of Computer Science and Information Security 2010.
53. Nagarajan N. An anomaly-based network intrusion detection system using fuzzy logic. International Journal of Computer Science and Information Security 2010.
54. Sha W, Zhu Y, Huang T, Qiu M, Zhu Y, Zhang Q. A multi-order markov chain based scheme for anomaly detection, 2013 IEEE 37th Annual Computer Software and Applications Conference Workshops (COMPSACW), IEEE, Japan, 2013.
55. Chora M, Saganowski L, Renk R, Houbowicz W. Statistical and signal based network traf c recognition for anomaly detection. Expert Systems 2012.
56. George A. Anomaly detection based on machine learning: dimensionality reduction using PCA and classi cation
57. using SVM. International Journal of Computer Applications 2012.
58. Wagh SK, Pachghare VK, Kolhe SR. Survey on intrusion detection system using machine learning techniques.International Journal of Computer Applications 2013.
59. Kheyri D, Karami M. A comprehensive survey on anomaly-based intrusion detection in MANET. Computer and Information Science 2012.
60. Stakhanova N, Basu S, Wong J. On the symbiosis of speci cation-based and anomaly-based detection. Computer & Security 2010
61. Stakhanova N, Basu S, Wong J. On the symbiosis of speci cation-based and anomaly-based detection.Computer & Security 2010.
62. Whitman ME, Mattord HJ. Principles of Information Security, 4th edn. Information Security Professionals: Boston, MA, 2009
63. Frederick KK. Network intrusion detection signatures, part ve, Symantec, November 2010 http://www.symantec.com/connect/articles/ network-intrusion-detection-signatures-part- ve [Accessed on December 2014].
64. Teh PS, Teoh A BJ, Yue S. A survey of keystroke dynamics biometrics. The Scienti c World Journal 2013.
65. Bhattacharyya D, Ranjan R, Alisherov FA, Choi M. Biometric authentication: a review. International Journal of U- and E-Service, Science andTechnology 2009.
66. Babaeizadeh M, Bakhtiari M, Maarof MA. Keystroke dynamic authentication in mobile cloud computing.International Journal of Computer Applicatios 2014.
67. Frank M, Biedert R, Ma E, Martinovic I, Song D. Touchalytics: on the applicability of touchscreen input as a behavioral biometric for continuous authentication. IEEE Transactions on Information Forensics and Security 2014.

105Volume 11, Issue 1 • January-June 2020
Abstract—In the forthcoming years, technology will control the learning practice in many ways. Internet of Things (IoT) continues to approve its important location in the perspective of Information and Communication Technologies and the development of society. Now a day’s one of the advance word in the information technology is Internet of Things (IoT). The main objective of IoT is to transform real world objects to the arti cial intelligent virtual objects. IoT will provide everything in the real world object to provide shared infrastructure to control the things around the state of the things. In recent times this study represents IoT concepts by researcher’s scholars, expert system, corporate white papers and online databases. Moreover this research paper will present de nitions, issues of internet things, basic requirements and characteristics of IoT. The main goal of research paper is to provide a complete overview of advance technologies associated with their usage of ICT in higher education. However new research will provide goal comprehension and assist accumulation effectively.Keywords— Internet of Things, Information Communi-cation Technology, Wireless Sensor Network, Arti cial Intelligence, Learning.
I. INTRODUCTION
This document is a The Internet of Things (IoT) is a distinctive concept shifted to the information technology. IoT include two words internet and things. The internet observe standard internet protocol suite (TCP/IP). In the system millions of administration networks, public, private and business networks are related by various networking technologies and broad array electronic data inputs. Today the data is communicated over the countries and it provides local and global data throughout the network. Network consists of various lists of exchange data, linked web application, news and various things on internet. While another word is “Thing” means that is distinguishable from real world objects. It de nes as any object or person that is distinguished from real world entities. The entities are representing as things in the IoT (Internet of Things). Every unit has its attributes which
represent the description of entity. Internet of Things currently not distinctively de ned but as a substitute various researchers, technocrats, practitioners, developers and corporate people that Internet of Things is accepted or acceptable by the world based users. Another de nition that de nes internet means that the data is created by the people and the next edition is about data that is created by the objects.
II. RELATED WORK
The IoT is referred to as linking the smart devices and structuring which includes the sensors, software, and electronic software, actuators which trigger these objects to collect and switch data. notion of network of smart devices was discussed as early as 1982 with a tailored coke machine at Carnegie Mellon University becoming the rst internet related applier. The term Internet of things was invented by Peter T. Lewis in 1985 speech given at U.S FCC (Federal Communication Commission).
III. CHARACTERISTICS OF IOT
Intelligence uses various algorithms and computing technologies that provide to make a product very skillful and smart. Connectivity that aids the people is connected through Wi-Fi and enables to admit the network compatibility. Accessibility means to offer ability to construct and consume data. Sensing on the other hand is to understand and sense the ability for the physical world and people around us. Energy that is used in power ef ciency, harvesting and power intelligence must be designed with safety using various tools which is the aid for physical entities.In 2013, the Global Standard initiative on IoT, de nes it as the “Infrastructure of the information society”. The IoT allows the objects to be sensed and controlled distantly across existing network communications.In 2016, the scope of the internet of things has emerged due to a union of multiple technologies, concerning real time analytics, machine learning and commodity sensor etc.
Usage of Internet of Things in EducationRomika Yadav#1, Palak Khurana#2
#Institute of Information Technology and ManagementNew Delhi, India
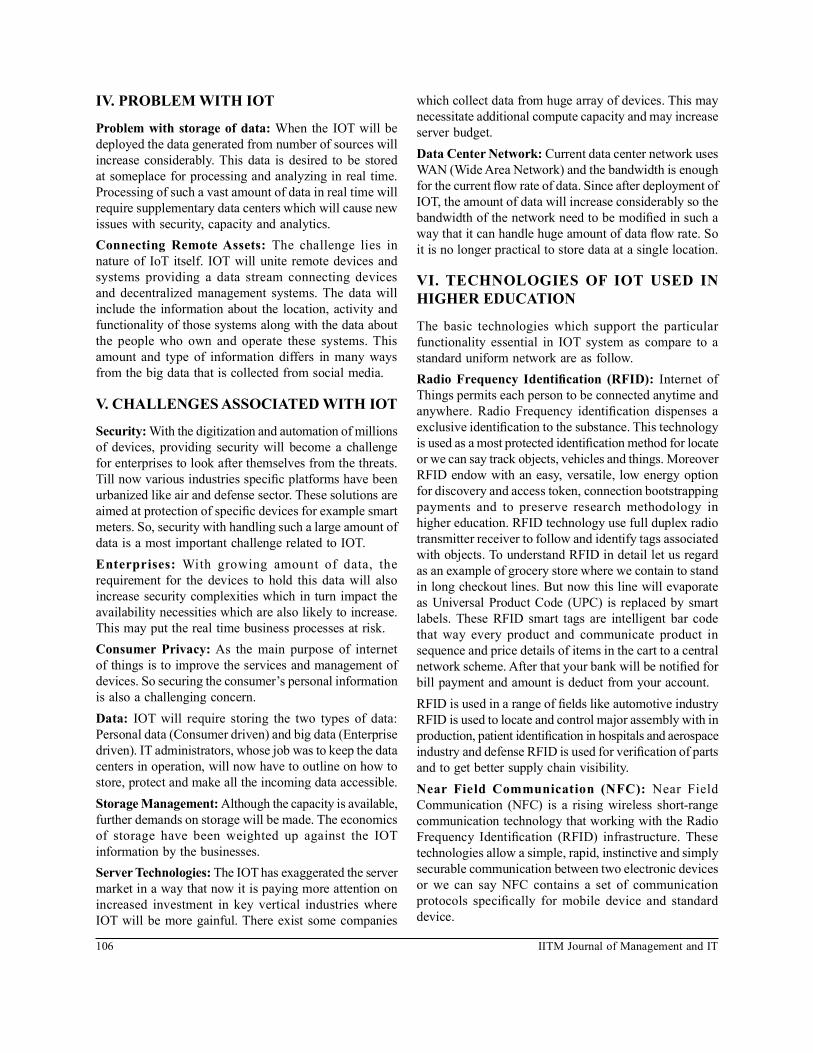
106 IITM Journal of Management and IT
IV. PROBLEM WITH IOT
Problem with storage of data: When the IOT will be deployed the data generated from number of sources will increase considerably. This data is desired to be stored at someplace for processing and analyzing in real time. Processing of such a vast amount of data in real time will require supplementary data centers which will cause new issues with security, capacity and analytics.Connecting Remote Assets: The challenge lies in nature of IoT itself. IOT will unite remote devices and systems providing a data stream connecting devices and decentralized management systems. The data will include the information about the location, activity and functionality of those systems along with the data about the people who own and operate these systems. This amount and type of information differs in many ways from the big data that is collected from social media.
V. CHALLENGES ASSOCIATED WITH IOT
Security: With the digitization and automation of millions of devices, providing security will become a challenge for enterprises to look after themselves from the threats. Till now various industries speci c platforms have been urbanized like air and defense sector. These solutions are aimed at protection of speci c devices for example smart meters. So, security with handling such a large amount of data is a most important challenge related to IOT.Enterprises: With growing amount of data, the requirement for the devices to hold this data will also increase security complexities which in turn impact the availability necessities which are also likely to increase. This may put the real time business processes at risk.Consumer Privacy: As the main purpose of internet of things is to improve the services and management of devices. So securing the consumer’s personal information is also a challenging concern.Data: IOT will require storing the two types of data: Personal data (Consumer driven) and big data (Enterprise driven). IT administrators, whose job was to keep the data centers in operation, will now have to outline on how to store, protect and make all the incoming data accessible. Storage Management: Although the capacity is available, further demands on storage will be made. The economics of storage have been weighted up against the IOT information by the businesses.Server Technologies: The IOT has exaggerated the server market in a way that now it is paying more attention on increased investment in key vertical industries where IOT will be more gainful. There exist some companies
which collect data from huge array of devices. This may necessitate additional compute capacity and may increase server budget.Data Center Network: Current data center network uses WAN (Wide Area Network) and the bandwidth is enough for the current ow rate of data. Since after deployment of IOT, the amount of data will increase considerably so the bandwidth of the network need to be modi ed in such a way that it can handle huge amount of data ow rate. So it is no longer practical to store data at a single location.
VI. TECHNOLOGIES OF IOT USED IN HIGHER EDUCATION
The basic technologies which support the particular functionality essential in IOT system as compare to a standard uniform network are as follow.Radio Frequency Identi cation (RFID): Internet of Things permits each person to be connected anytime and anywhere. Radio Frequency identi cation dispenses a exclusive identi cation to the substance. This technology is used as a most protected identi cation method for locate or we can say track objects, vehicles and things. Moreover RFID endow with an easy, versatile, low energy option for discovery and access token, connection bootstrapping payments and to preserve research methodology in higher education. RFID technology use full duplex radio transmitter receiver to follow and identify tags associated with objects. To understand RFID in detail let us regard as an example of grocery store where we contain to stand in long checkout lines. But now this line will evaporate as Universal Product Code (UPC) is replaced by smart labels. These RFID smart tags are intelligent bar code that way every product and communicate product in sequence and price details of items in the cart to a central network scheme. After that your bank will be noti ed for bill payment and amount is deduct from your account. RFID is used in a range of elds like automotive industry RFID is used to locate and control major assembly with in production, patient identi cation in hospitals and aerospace industry and defense RFID is used for veri cation of parts and to get better supply chain visibility. Near Field Communication (NFC): Near Field Communication (NFC) is a rising wireless short-range communication technology that working with the Radio Frequency Identi cation (RFID) infrastructure. These technologies allow a simple, rapid, instinctive and simply securable communication between two electronic devices or we can say NFC contains a set of communication protocols speci cally for mobile device and standard device.
107Volume 11, Issue 1 • January-June 2020
Wireless Sensor Network (WSN): One of the well-known technologies of IoT is wireless a wireless sensor network consisting of distributed autonomous devices with sensors which monitor physical or environmental conditions, such as temperature, pressure, vibration, sound, motion or pollutants, at dissimilar locations. WSN allow us to monitor unobservable things over large temporal scale. WSN based on IoT has customary notable attention in various areas like education, military, forest re, manufacturing, transportation, civil infrastructure, security, healthcare, agriculture monitor, habitat monitoring and flood detection etc. Sensors can be used to monitor patient’s body response to the medication, so that doctors can establish the effects of the medicines [6].Arti cial Intelligence: Arti cial Intelligence refers to electronic environment created by human beings which is susceptible and responsive to the behavior done by peoples.Arti cial Intelligence is explain by following charac-teristics such as embedded, adaptive, anticipatory, and personalized. Arti cial Intelligence has its relevance in various areas like natural language processing, expert system, gaming, vision system, speech recognition, handwriting recognition, and intelligent robots etc which are helps to build up the education system.Wi Direct: Wi direct is a wi customary that allow distinct device to connect to the network without an access point. As in conventional wi access points are use which are accountable for routing between different nodes and also maintain communication between wireless and wired system. But the number of devices is increasing day by day with that operating cost is also increasing. Wi direct allow connection devoid of any access point and moreover assist communication between devices from different
manufacturer. Wi direct sustain all the functionalities like le transfer, communication among different devices and internet browsing which mostly supportive in to get digitalized data for the students and researchers who are pursuing their higher education.
VII. CONCLUSION
Internet of Things gradually brings a set of various technologies that brings change in our daily lives, which help to build our life more comfortable and simpler. Because the various technologies are used based on the application. The main area of Internet of Things application includes industrial, transportation, medical, education, manufacturing, mining, commerce and education etc. We concluded that in this research paper the key observations are meaning and de nitions of Internet of Things, their technologies connected with IoT, various confronts related to the IoT and provide uniqueness of the internet on things.
REFERENCES [1] Analyst Anish Gaddam interviewed by Sue Bushell in
Computerworld on 24 July 2000.[2] Dave Evans, “The Internet of Things How the Next Evolution of
the Internet Is Changing Everything”, CISCO IBSG white paper, p.p-04-11, 2016.
[3] Internet of Things Global Standard Initiative” 26 June 2015[4] “Internet of Things: Science Fiction or Business Fact?” 23
October 2016[5] Jayavardhana Gubbi, Rajkumar Buyya, Slaven Marusic,
Marimuthu Palaniswami,” Internet of Things (IoT): A vision, architectural elements, and future directions”, Future Generation Computer Systems, p.p- 1645–1660, 2013.
[6] Somayya Madakam, R. Ramaswamy, Siddharth Tripathi, “Internet of Things (IoT): A Literature Review”, Journal of Computer and Communications, pp-164-173, 2015.
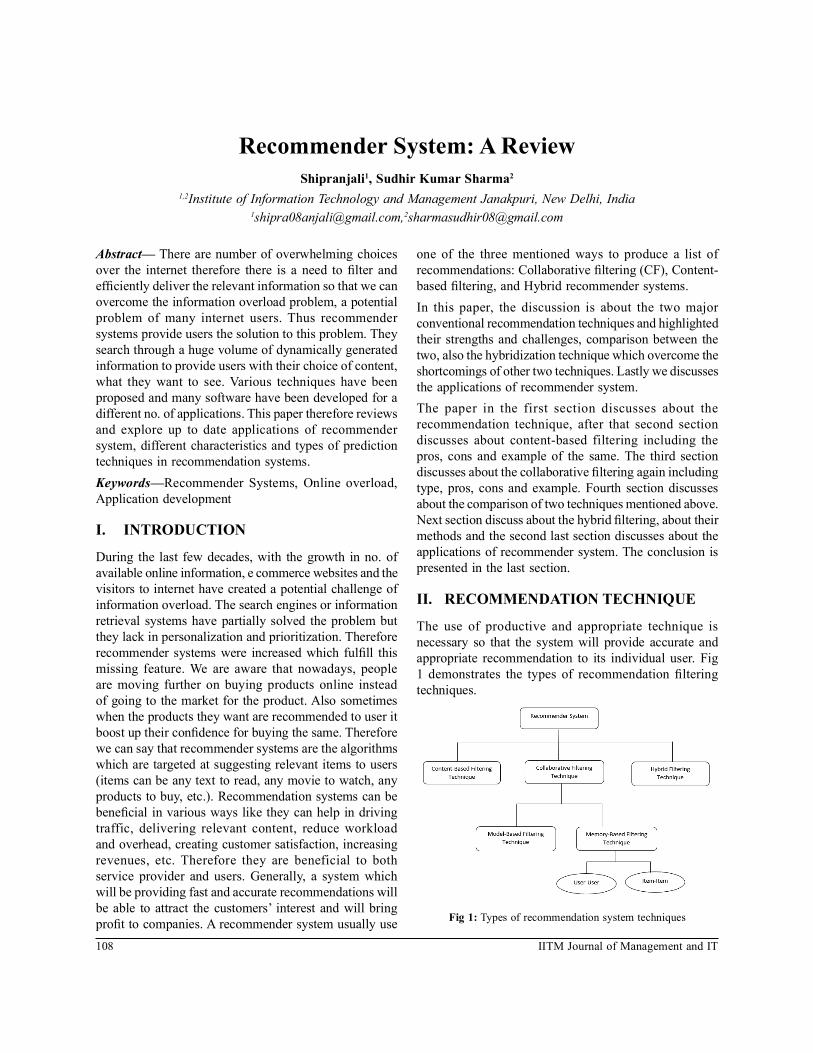
108 IITM Journal of Management and IT
Abstract— There are number of overwhelming choices over the internet therefore there is a need to lter and ef ciently deliver the relevant information so that we can overcome the information overload problem, a potential problem of many internet users. Thus recommender systems provide users the solution to this problem. They search through a huge volume of dynamically generated information to provide users with their choice of content, what they want to see. Various techniques have been proposed and many software have been developed for a different no. of applications. This paper therefore reviews and explore up to date applications of recommender system, different characteristics and types of prediction techniques in recommendation systems.Keywords—Recommender Systems, Online overload, Application development
I. INTRODUCTION
During the last few decades, with the growth in no. of available online information, e commerce websites and the visitors to internet have created a potential challenge of information overload. The search engines or information retrieval systems have partially solved the problem but they lack in personalization and prioritization. Therefore recommender systems were increased which ful ll this missing feature. We are aware that nowadays, people are moving further on buying products online instead of going to the market for the product. Also sometimes when the products they want are recommended to user it boost up their con dence for buying the same. Therefore we can say that recommender systems are the algorithms which are targeted at suggesting relevant items to users (items can be any text to read, any movie to watch, any products to buy, etc.). Recommendation systems can be bene cial in various ways like they can help in driving traffic, delivering relevant content, reduce workload and overhead, creating customer satisfaction, increasing revenues, etc. Therefore they are beneficial to both service provider and users. Generally, a system which will be providing fast and accurate recommendations will be able to attract the customers’ interest and will bring pro t to companies. A recommender system usually use
one of the three mentioned ways to produce a list of recommendations: Collaborative ltering (CF), Content-based ltering, and Hybrid recommender systems.In this paper, the discussion is about the two major conventional recommendation techniques and highlighted their strengths and challenges, comparison between the two, also the hybridization technique which overcome the shortcomings of other two techniques. Lastly we discusses the applications of recommender system.The paper in the first section discusses about the recommendation technique, after that second section discusses about content-based filtering including the pros, cons and example of the same. The third section discusses about the collaborative ltering again including type, pros, cons and example. Fourth section discusses about the comparison of two techniques mentioned above. Next section discuss about the hybrid ltering, about their methods and the second last section discusses about the applications of recommender system. The conclusion is presented in the last section.
II. RECOMMENDATION TECHNIQUE
The use of productive and appropriate technique is necessary so that the system will provide accurate and appropriate recommendation to its individual user. Fig 1 demonstrates the types of recommendation ltering techniques.
Fig 1: Types of recommendation system techniques
Recommender System: A ReviewShipranjali1, Sudhir Kumar Sharma2
1,2Institute of Information Technology and Management Janakpuri, New Delhi, [email protected],[email protected]

109Volume 11, Issue 1 • January-June 2020
III. CONTENT-BASED FILTERING
This technique is based on the information or description provided for the particular product. Based on the context or description of the item the system will nd the similarity between items. Also for nding similar products which user may like the user’s previous history is taken into account. For example, there is a user one who liked a Marvel movie then we can recommend him superheroes movies or also the movies which are having the similar actors as in Marvel movie. In this technique two type of data is used, rst being the interest of user, whatever the user like, second being the user information, their personal information like age and sometimes their history too. Text document plays mostly a major role of information source in this type of systems. A standard approach for term parsing selects single words from documents. The vector space model and latent semantic indexing are two methods that use these terms to represent documents as vectors in a multi-dimensional space [4].This type of filtering technique uses properties or characteristics of an item to provide recommendations. Characteristic information includes:• Characteristics of Items (Keywords and Attributes)• Characteristics of Users (Pro le Information)Fig 2 shows how content based ltering works. It is showing that a similar movie to the movie watched earlier by the user can be recommended to him/her.
Fig. 2: Working of content based ltering
A. Pros and Cons of Content-Based Filtering The following are the pros of content-based ltering:• User independence:In this technique there is no dependency on other users for providing a recommendation to a user. As we only have to analyze the user pro le and items for recommending any item.
• Transparency:In this technique the user can know on what basis or features an item is recommended to them. Instead of collaborative filtering where you are getting recommendations because you have the similar taste as of any other unknown user.• No Cold start problem:Here in this method a new item can be easily recommended to a user instead of waiting for the raring of some other users.The following are the cons of content-based ltering:• Limited content analysis:If there is no enough information present to discriminate the items precisely, then the recommendation will also be not precise in the end.• New user:Let say if there is a new user in the system and there is not enough information available to build its pro le then the recommendation could not be accurate.• Serendipity Problem:This technique do not have inherent method for nding something unexpected. It only suggests items whose rating are high when matched against user pro le, hence user will be recommended items similar to those which they have already rated.
B. Example of Content-Based FilteringFollowing is taken an example to understand how this technique works in recommending a movie to a Net ix user named Joy as per Fig 3 (a). Let’s assume that Joy gave good rating to movies like “Avengers” and “Captain America” which are marked as “Fiction” genre and gave a bad rating to the movie “Titanic” which is marked as “Romantic” genre.
Fig. 3: (a) Example of content based ltering
Now we had created a user vector for Joy based on his given three ratings as per Fig 3 (b):

110 IITM Journal of Management and IT
Fig. 3: (b) Example of content based ltering
Taking a rating scale of -10 to 10, since Joy like Fiction movies, we give value of 9 to “Fiction”, Joy hasn’t seen any Animation movies, we give 0 to “Animation” and since Joy has disliked movies with Romantic genre, we give ‘-6 ‘ to “Romantic”.Therefore user Vector for Joy will be (9, 0, -6) in order of (Fiction, Animation, Romantic) as per Fig 3 (c).
Fig. 3: (c) Example of content based ltering
The item vector for movie “Titanic” is (0, 0, 1) and the movie “Justice League” is (1,0,0) in order of (Fiction, Animation, Romantic).Now we need to take dot product of two 2-D vectors: Item vector and User Vector as per Fig 3 (d).
Fig. 3: (d) Example of content based ltering
Accordingly, the dot product of “Titanic” is -6 and that of “Justice League” is 9.Hence “Justice League” will be recommended to Joy, which also match our instinct that Joy likes Fiction movies and dislikes Romantic movies.Similarly, we can calculate the dot products of all the item vectors of all the movies present and recommend
top 10 movies to Joy.So this is how content-based ltering technique works.News Dude, a personal news system which works by utilizing speech to read news stories to users. For describing news stories so that short-term recommendations can be generated it uses TF-IDF (Term Frequency- Inverse Document Frequency) model which is further compared with Cosine Similarity Measure and lastly supplied to a learning algorithm.
IV. COLLABORATIVE FILTERING
Collaborative Filtering technique is based on the past interactions between user and items in order to produce new recommendation, and these interactions are kept in “user-item interactions matrix”. For Example a user “A” rated movie m1, m2, m3 with good rating and another user “B” rated movie m1, m3, m4 with good rating. Therefore now we can recommend movie m2 to user “B” and m4 to user “A” because they have similar taste in movies.The main idea behind collaborative ltering is these previous user-item interactions are enough to trace similar users or similar items and further make predictions depending on these estimated closeness results. The collaborative technique is further divided into 2 sub categories:First memory based and second model based approaches. In memory based technique it is based on nearest neighbor search, the recorded interactions, that is search for the users which are closest among a user of interest and then recommend the user item which is most popular among their neighbor. In model based technique assume an underlying “productive” model which explains the user-item interactions and try to discover it in order to make new predictions.The Fig 4 explains the working of collaborative ltering. It is showing that a user is having similar taste (pizza, pasta) like another user therefore a third item liked by second user (cold drink) can be recommended to rst user.
Fig. 4: Working of Collaborative Filtering

111Volume 11, Issue 1 • January-June 2020
A. Types of collaborative Filtering• Memory based:For computing similarity between users or items it uses user rating data. This is used for making recommendations. It is an earlier mechanism and was used in many commercial systems. It is effective and easy to implement. Neighborhood based CF and item/user-based top N recommendations are some typical examples of this mechanism. The Representative techniques are Neighbor-based CF (item-based/user-based CF algorithms with Pearson/vector cosine correlation) and Item-based/user-based top-N recommendations [2].
User-user:This method is said to be “user-centered” as it represent users based on their interactions with items and evaluate distances between users. This method tries to identify users with similar interaction pro les so that most popular item could be suggested among these neighbors.Let’s assume we want to make a recommendation for a given user. Firstly, each user can be represented by their vector of interactions with the different items as shown in Fig 5. Then we can nd some type of similarity among those users for which we are going to make recommendation and every other user. That similarity will be measured such that if there are two users having similar interaction on similar item then they will be considered as being close. Once the similarities to every user are found, then we can keep the k-nearest neighbors to our user and then further most popular items can be suggested among them.
Fig. 5: Illustration of the user-user method.
Item-Item:This method is said to be “item-centered” as it represent items depending upon the interactions user had with them and calculate the distances between those items. In this method we try to nd items similar to those with which the user has positively interacted with and if many user has interacted with both the items in a similar way then these two items will be considered similar.
Let’s assume that we want to make a recommendation for a given user. So, rstly, we will take the item this user liked the most and represent it by its vector of interaction with every users as shown in Fig 6. Now we can nd the resemblance between the “best item” and the remaining items. When we found all the resemblances, we will keep the k-nearest neighbors to the selected item that are new to our user of interest and recommend these items.
Fig. 6: Illustration of the item-item method.
• Model based: Methods based on this type assume some latent interaction model. Here the model is trained such that from its own representation of users and items it rebuild user-item interactions values. Further based on this model new suggestions can be done. The latent representation of users and items extracted by this model contain a mathematical meaning which can be tough to interpret for a human being.One of the algorithms used for model based approach is matrix factorization.Let us understand with the help of an example how it works.Let’s consider we are having a matrix of user-movie rating. Now for modeling the interactions between users and movies, we can assume that:1. There will exist some features describing movies
pretty well.2. These existing features can also be utilized for
describing user preferences like more values for features user likes and less values otherwise.
Though we do not want to give explicitly these features to our model. Instead we want to let the system nd these useful features for making its own representations of both users and items by itself.As they are learned and not given, extracted features taken individually have a mathematical meaning but no intuitive interpretation (and, so, are dif cult, if not impossible, to understand as human) [1]. As here Fig 7 is illustrating the matrix factorization method where the user-item interactions matrix is
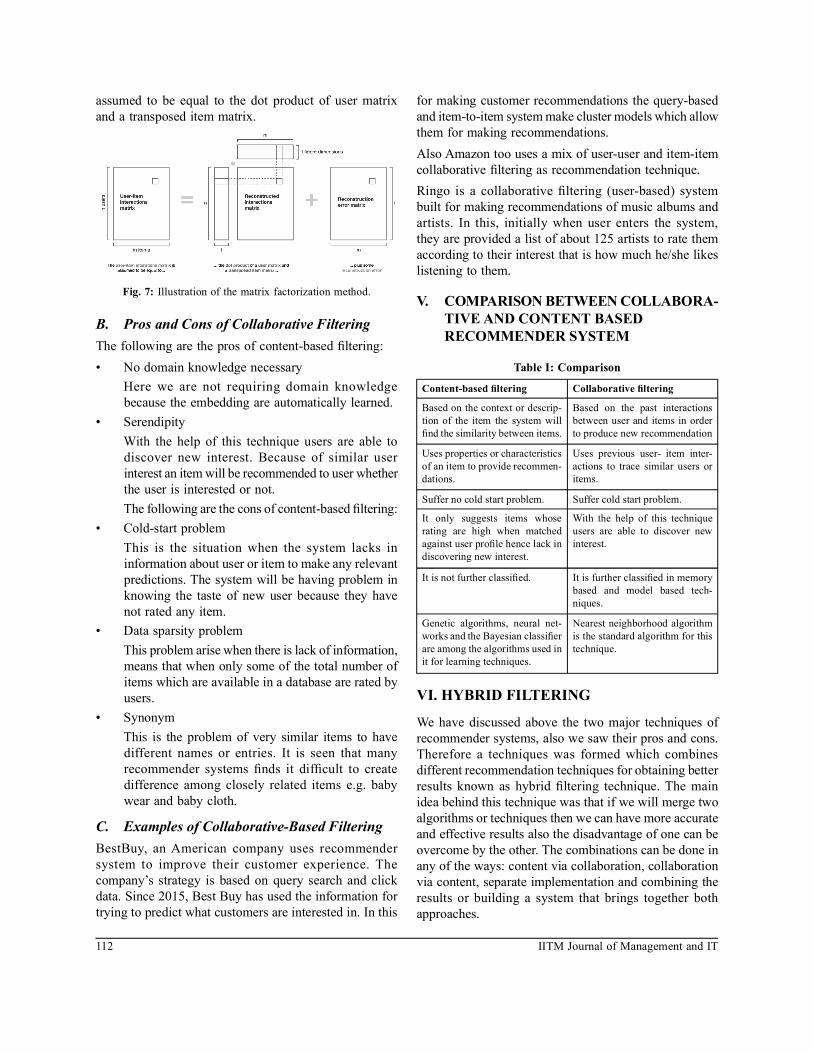
112 IITM Journal of Management and IT
assumed to be equal to the dot product of user matrix and a transposed item matrix.
Fig. 7: Illustration of the matrix factorization method.
B. Pros and Cons of Collaborative Filtering The following are the pros of content-based ltering:• No domain knowledge necessary Here we are not requiring domain knowledge
because the embedding are automatically learned.• Serendipity With the help of this technique users are able to
discover new interest. Because of similar user interest an item will be recommended to user whether the user is interested or not.
The following are the cons of content-based ltering:• Cold-start problem This is the situation when the system lacks in
information about user or item to make any relevant predictions. The system will be having problem in knowing the taste of new user because they have not rated any item.
• Data sparsity problem This problem arise when there is lack of information,
means that when only some of the total number of items which are available in a database are rated by users.
• Synonym This is the problem of very similar items to have
different names or entries. It is seen that many recommender systems nds it dif cult to create difference among closely related items e.g. baby wear and baby cloth.
C. Examples of Collaborative-Based FilteringBestBuy, an American company uses recommender system to improve their customer experience. The company’s strategy is based on query search and click data. Since 2015, Best Buy has used the information for trying to predict what customers are interested in. In this
for making customer recommendations the query-based and item-to-item system make cluster models which allow them for making recommendations. Also Amazon too uses a mix of user-user and item-item collaborative ltering as recommendation technique.Ringo is a collaborative ltering (user-based) system built for making recommendations of music albums and artists. In this, initially when user enters the system, they are provided a list of about 125 artists to rate them according to their interest that is how much he/she likes listening to them.
V. COMPARISON BETWEEN COLLABORA- TIVE AND CONTENT BASED RECOMMENDER SYSTEM
Table I: Comparison
Content-based ltering Collaborative ltering
Based on the context or descrip-tion of the item the system will nd the similarity between items.
Based on the past interactions between user and items in order to produce new recommendation
Uses properties or characteristics of an item to provide recommen-dations.
Uses previous user- item inter-actions to trace similar users or items.
Suffer no cold start problem. Suffer cold start problem.
It only suggests items whose rating are high when matched against user pro le hence lack in discovering new interest.
With the help of this technique users are able to discover new interest.
It is not further classi ed. It is further classi ed in memory based and model based tech-niques.
Genetic algorithms, neural net-works and the Bayesian classi er are among the algorithms used in it for learning techniques.
Nearest neighborhood algorithm is the standard algorithm for this technique.
VI. HYBRID FILTERING
We have discussed above the two major techniques of recommender systems, also we saw their pros and cons. Therefore a techniques was formed which combines different recommendation techniques for obtaining better results known as hybrid ltering technique. The main idea behind this technique was that if we will merge two algorithms or techniques then we can have more accurate and effective results also the disadvantage of one can be overcome by the other. The combinations can be done in any of the ways: content via collaboration, collaboration via content, separate implementation and combining the results or building a system that brings together both approaches.

113Volume 11, Issue 1 • January-June 2020
Table II: Hybridization Methods
Hybridization Method Description
Weighted In this method the votes (or scores) are combined together taken from several recommendation techniques so that a sin-gle recommendation can be produced [7].
Switching In this method depending upon the cur-rent situation the system switches be-tween techniques [7].
Mixed In this method recommendations taken from several different recommenders are presented at the same time [7].
Feature combination In this method features taken from differ-ent recommendation data sources are put together in a single algorithm [7].
Cascade In this method recommendations given by other system is re ned by one system [7].
Feature augmentation In this method the outcome of one tech-nique works as input feature to another [7].
Meta-level In this method model learned by one sys-tem works as input to another [7].
VII. APPLICATIONS OF RECOMMENDER SYSTEM
The applications of recommender systems include recommending movies, websites, books, documents, television programs, tourism scenic spots, music, conferences and learning materials, and involve the areas of e-commerce, e-library, e-business services, e-government and e-learning [9].The most common recommender systems applications include:• E-commerce: recommendations for customers while
buying online products like gadgets, books, clothes, etc.
• Entertainment: recommendations for movies and music.
• Content: e-learning, recommendation for web pages, e-mail lters, personalized newspapers, etc.
• Services: matchmaking services, recommendation of experts for consultation, - recommendations of travel services, recommendation of houses to rent.
VIII. CONCLUSION
Recommendation systems are everywhere. They help us in gaining new opportunities for getting personalized information on the internet. It is expected from a good recommendation system that time to time it will be able to give positive and appropriate recommendations and also give alternative recommendations so that the fatigue of the users can be broken built by seeing the same recommendation list again and again. In this paper the discussion was about the two major conventional recommendation techniques and highlighted their strengths and challenges, also the hybridization technique which overcome the shortcomings of other two techniques. Lastly we shortly discussed the applications of recommender system.
REFERENCES [1] Website- https://towardsdatascience.com/introduction-to-
recommender-systems-6c66cf15ada[2] P. N. Vijaya Kumar A Survey on Recommender Systems (RSS)
and Its Applications (2014)[3] Website- https://towardsdatascience.com/brief-on-recommender-
systems-b86a1068a4dd[4] Website- http://recommender-systems.org/hybrid-recommender-
systems/[5] Website- https://towardsdatascience.com/introduction-to-
recommender-systems-6c66cf15ada[6] Website-https://www.sciencedirect.com/science/article/pii/
S1110866515000341#b0005[7] Robin Burke Hybrid Recommender Systems: Survey and
Experiments[8] Dietmar jannach, Markus zanker Recommender Systems An
Introduction[9] Jie Lu Recommender system application developments: A survey
(2015)[10] Website- https://www.iteratorshq.com/blog/an-introduction-
recommender-systems-9-easy-examples/