ISS WORKING PAPER TEMPLATE - Indices of Social Development
35
Working Paper No. 2011-02 Irene van Staveren, ISS September 2011 To Measure is to Know? A Comparative Analysis of Gender Indices
Transcript of ISS WORKING PAPER TEMPLATE - Indices of Social Development

Working Paper No. 2011-02
Irene van Staveren, ISS
September 2011
To Measure is to Know?
A Comparative Analysis of Gender Indices

2
ISSN 2213-6614
The Institute of Social Studies is Europe’s longest-established centre of higher education and research in development studies. On 1 July 2009, it became a University Institute of the Erasmus University Rotterdam (EUR). Post-graduate teaching programmes range from six-week diploma courses to the PhD programme. Research at ISS is fundamental in the sense of laying a scientific
basis for the formulation of appropriate development policies. The academic work of ISS is disseminated in the form of books, journal articles, teaching texts, monographs and working papers. The Working Paper series provides a forum for work in progress which seeks to elicit
comments and generate discussion. The series includes academic research by staff, PhD participants and visiting fellows, and award-winning research papers by graduate students.
Working Papers are available in electronic format at www.iss.nl
Please address comments and/or queries for information to:
Institute of Social Studies
Irene van Staveren P.O. Box 29776
2502 LT The Hague The Netherlands
or
E-mail: [email protected]
3
Table of Contents
Abstract 5
1 INTRODUCTION 5
2 THE FIVE GENDER INDICES 6
3 WHAT DO THEY MEASURE? 8
4 WHY DO THEY MEASURE WHAT THEY MEASURE? 13
5 MEASUREMENT RESULTS 17
6 MEASUREMENT METHODOLOGY 22
7 EXAMPLES OF USING GENDER INDICES FOR POLICY ANALYSIS 26
8 KNOWING HOW TO MEASURE 29
9 CONCLUSIONS: WHAT DO WE KNOW? 32
REFERENCES 34
4
Abstract
The paper presents a comparative analysis of five cross country composite gender
indices. Although there is a relatively high correlation between the indices, the overlap
of underlying indicators is low. Country rankings, both at the top and at the bottom
have parallels but are quite distinct. The differences are explained in two ways:
methodologically and theoretically. The methodological differences concern in
particular weights, capping, and aggregation. The Capability Approach explains the
theoretical differences, by distinguishing between four stages, which include distinct
types of indicators. The substantial differences that exist between the gender indices
require a cautious selection between these for research and policy analysis. This is
shown in a few examples with policy variables. Finally, the paper presents a set of
three decision trees which enables an informed choice between the indices. The paper
ends with a conclusion.
Keywords
gender, inequality measurement, index, policy research

5
To Measure is to Know? A Comparative Analysis of Gender Indices
1 Introduction
This paper will analyse the relevance of taking gender composite indices up in cross-
country analysis. This is important because gender still remains invisible in most cross
country research, particularly in research in the area of macroeconomics. At most,
gender is recognized as a relevant variable at the micro level, for example in poverty
studies or microcredit evaluations. But trade analysis, growth decompositions, impact
studies of economic reform, and poverty reduction strategies often remain gender
blind, and therefore incomplete.
Over the past two decades several country-level composite measures of
gender inequality and women’s position have been developed. Well known examples
are the Gender Development Index (GDI) and the Gender Empowerment Measure
(GEM), both developed and published annually in the Human Development Reports
up to 2009. Only very recently, other indices have emerged. The Global Gender Gap
Index developed by the World Economic Forum in 2006, and four others all in the
year 2010, including the follow-up index for the above mentioned GDI and GEM. So,
today there are at least five cross-country gender indices available to researchers and
policy makers. All of them are freely accessible through the internet, and some of
them can be downloaded in a data file, while a few sources also provide the underlying
indicators. Such indices have a large potential for academic research, policy analysis,
and monitoring and evaluation of policies. The dramatically increased availability of
gender indices requires researchers and policy analysts to make a choice between these
in their analyses. The objective of this paper is, first, to compare the five best known,
easily accessible, and high-coverage cross-country gender indices. And second, to
explain the differences by their methodological and theoretical characteristics. Hereby,
the comparative analysis enables an informed choice for researchers and policy
analysts when they want to use a composite measure of gender inequality in their
analyses.
The paper is organized as follows. The first section presents the five indices
and enquires into their statistical relationships. The second section provides a detailed
break-down and comparison of each index on the basis of their underlying indicators.
6
Section three provides a theoretical framework for the comparative analysis, through
the human development approach. Section four presents summary statistics and a
comparison of the country rankings at the top and the bottom of each index. The fifth
section engages in a methodological discussion of the gender indices, discussing their
statistical strengths and weaknesses. Section six gives a few examples of how the
gender indices relate to particular policy variables. The paper ends with a set of three
decision trees as a guide to select an appropriate gender index, and a conclusion.
2 The Five Gender Indices
The gender indices that I have selected are all recent composite indices of gender
inequality. The criteria for selecting these five are wide accessibility, reputable sources,
and high coverage, of at least 100 countries. Moreover, they are all up to date, with
GII replacing the old GDI and GEM, and four indices being published for the first
time in 2010 and one since 2006. I use data for the year 2010, though many underlying
indicators have values for one or two years earlier due to lack of more recent data.
The gender indices used in the analysis are the following:
1. GEI:
Gender Equality Index, from the Indices of Social Development database of the
Institute of Social Studies of Erasmus University Rotterdam. The GEI was first
published in 2010. The values lie between 0 and 1, with seven digits after the comma,
and the higher the number, the more equal gender relations are. They are available for
184 countries.
2. GII:
Gender Inequality Index, from the UNDP Human Development Reports. The
GII was first published in 2010 and has replaced the two earlier gender indices, the
GDI and GEM. The values lie between 0 and 1, with three digits after the comma,
and the higher the number, the more unequal gender relations are. They are available
for 138 countries.
3. SIGI:
7
Social Institutions and Gender Index, SIGI, was developed in 2010 on the basis
of the Gender and Institutions Database by the OECD. The values lie between 0 and
1, with seven digits after the comma, and the higher the number, the more unequal
gender relations are. They are available for 101 countries – only developing countries.
4. GGGI:
Global Gender Gap Index, developed by the World Economic Forum and
avaiable since 2006. The GGGI has values between 0 and 1, with four digits after the
comma, and the higher the number, the more equal gender relations are. They are
available for 134 countries.
5. WEOI:
Womens’ Economic Opportunities Index, developed by the Economic
Intelligence Unit. The WEOI was first published in 2010. The values lie between 0
and 100, with two digits after the comma, and the higher the number, the more equal
gender relations are. They are available for 184 countries. In order to make them
comparable with the other four indices, they are divided by 100, to give a number
between 0 and 1 with four digits after the comma.
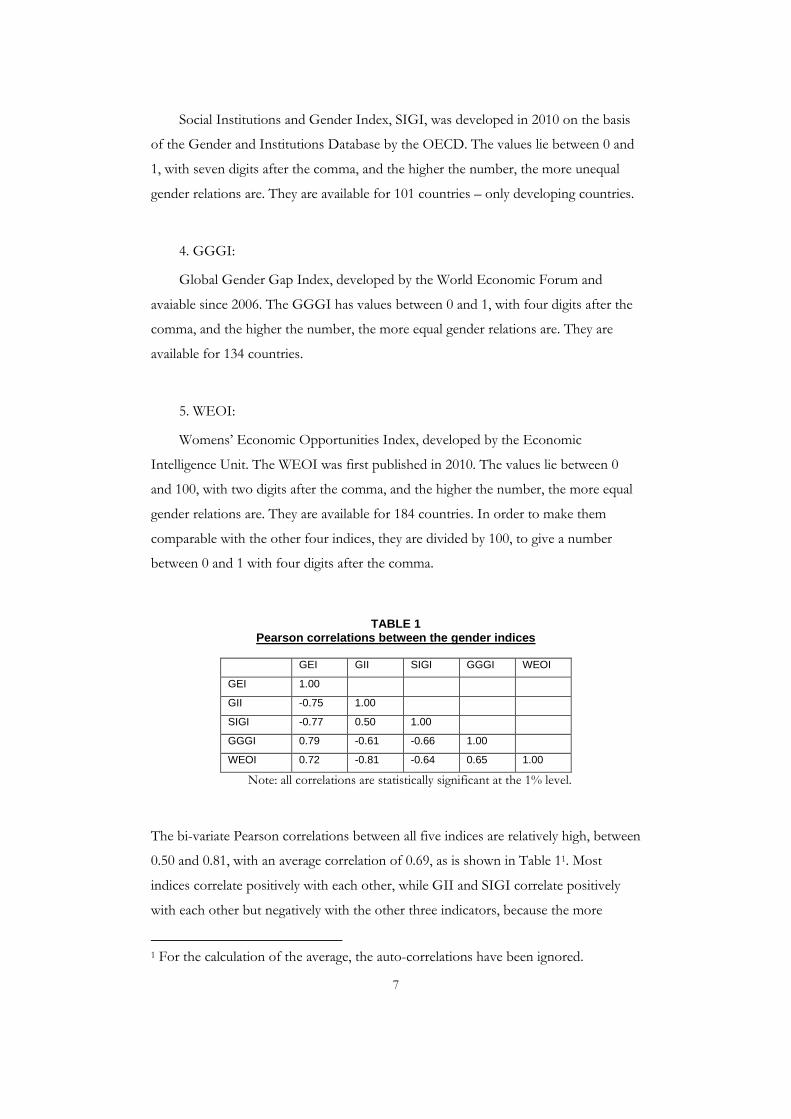
TABLE 1 Pearson correlations between the gender indices
GEI GII SIGI GGGI WEOI
GEI 1.00
GII -0.75 1.00
SIGI -0.77 0.50 1.00
GGGI 0.79 -0.61 -0.66 1.00
WEOI 0.72 -0.81 -0.64 0.65 1.00
Note: all correlations are statistically significant at the 1% level.
The bi-variate Pearson correlations between all five indices are relatively high, between
0.50 and 0.81, with an average correlation of 0.69, as is shown in Table 11. Most
indices correlate positively with each other, while GII and SIGI correlate positively
with each other but negatively with the other three indicators, because the more
1 For the calculation of the average, the auto-correlations have been ignored.
8
unequal gender relations are according to these two indices, the higher the value of the
index is. In order to compare the indices more substantially, every gender index will be
presented in more detail below.
3 What Do They Measure?
1. GEI
The index includes input measures, mainly resources and rights, as well as outcome
measures, mainly functionings or wellbeing indicators, as well as attitudinal measures,
referring to social norms, as gendered institutions. The GEI includes 21 indicators,
from six different sources, international sources as well as regional sources,
quantitative and qualitative measures. Two indicators are themselves composites,
namely women’s economic rights and women’s social rights.

9
TABLE 2
Overview of indicators in GEI
Percentage agreeing that a
married man has a right to beat
his wife and children
Percentage of women who
agree that women have the
chance to earn the same salary
as men in their country
Ratio of females among
legislators, senior officials and
managers
Percentage of respondents who
tend to agree or strongly agree
that 'women have always been
subject to traditional laws and
customs, and should remain so'.
Percentage of women who
agree that women have the
same chance as men to get a
good education in their country
Ratio of females in professional
jobs
Percentage of respondents who
tend to agree or strongly agree
that 'women should have the
same chance of being elected to
political office as men'.
Proportion of employers and
managers who agree or strongly
agree that when jobs are
scarce, men have more right to
a job than women
Ratio between female and male
primary school enrolment
Rating on level of women's
economic rights*
Proportion of those of voting
age who agree or strongly
agree that on the whole, men
make better political leaders
than women do
Ratio between female and male
secondary school enrolment
Rating on level of women's
social rights**
Proportion of parents who agree
or strongly agree that a
university education is more
important for a boy than a girl
Ratio between female and male
tertiary educational enrolment
Ratio of average female to male
wages, across all available
labour categories
Proportion of employers and
managers who agree or strongly
agree that on the whole, men
make better business
executives than women do
Ratio between adult female and
male literacy rates
Percentage of women who
agree that women have the
same chance as men to get a
good job in their country
Percentage of labour force that
is female
Ratio between adult female and
adult male mortality rates
* Women’s 10 economic rights: equal pay for equal work, free choice of employment without husband’s consent,
right to gainful employment without husband’s consent, equality in hiring and promotion practices, job security incl.
maternity leave, non-discrimination by employers, right to be free from sexual harassment in the workplace, right to
work at night, right to work in dangerous occupations, right to work in the military and police.
** Women’s 12 social rights: right to equal inheritance, right to enter marriage equal with men, right to travel
abroad, right to obtain a passport, right to confer citizenship to children or husband, right to initiate a divorce, right to
property in marriage, right to social and cultural participation in communities, right to education, freedom to choose
residence, freedom from female genital mutilation, freedom from forced sterilization.
10
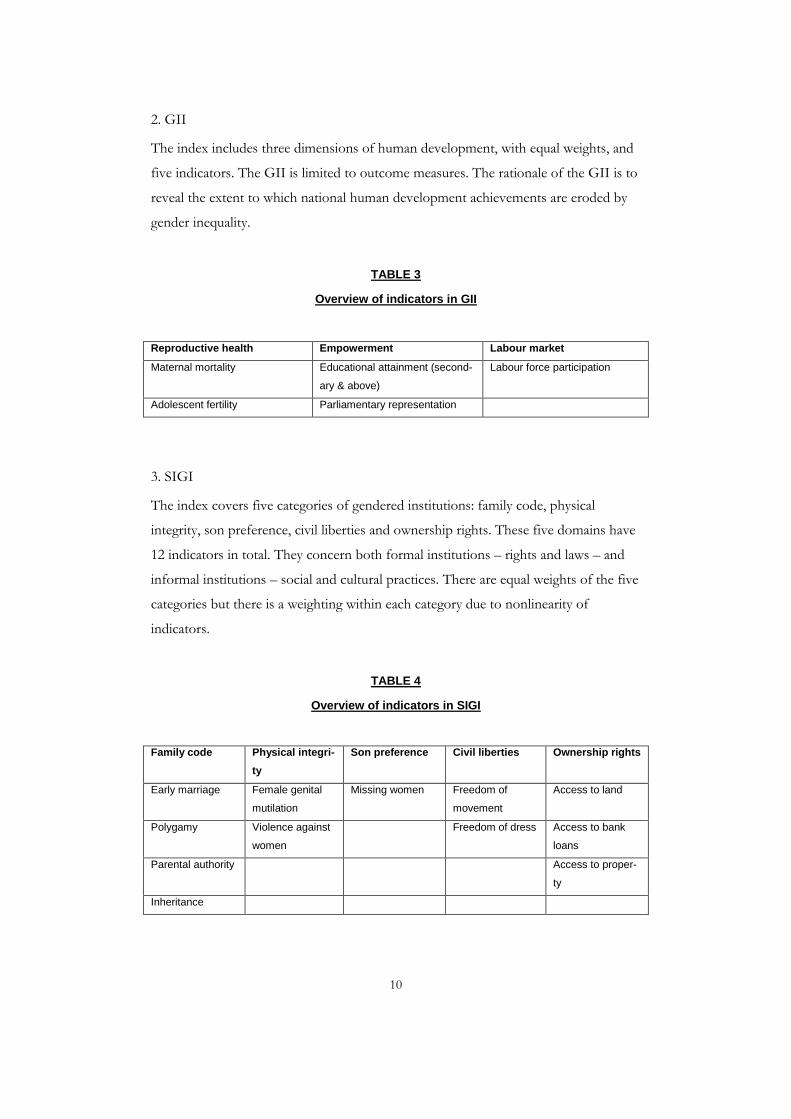
2. GII
The index includes three dimensions of human development, with equal weights, and
five indicators. The GII is limited to outcome measures. The rationale of the GII is to
reveal the extent to which national human development achievements are eroded by
gender inequality.
TABLE 3
Overview of indicators in GII
Reproductive health Empowerment Labour market
Maternal mortality Educational attainment (second-
ary & above)
Labour force participation
Adolescent fertility Parliamentary representation
3. SIGI
The index covers five categories of gendered institutions: family code, physical
integrity, son preference, civil liberties and ownership rights. These five domains have
12 indicators in total. They concern both formal institutions – rights and laws – and
informal institutions – social and cultural practices. There are equal weights of the five
categories but there is a weighting within each category due to nonlinearity of
indicators.
TABLE 4
Overview of indicators in SIGI
Family code Physical integri-
ty
Son preference Civil liberties Ownership rights
Early marriage Female genital
mutilation
Missing women Freedom of
movement
Access to land
Polygamy Violence against
women
Freedom of dress Access to bank
loans
Parental authority Access to proper-
ty
Inheritance
11
4. GGGI
The index measures gaps in human development variables between men and women,
measured as female/male ratios. They cover resources, capabilities and functionings.
The index value may be interpreted as the percentage that reveals how much of the
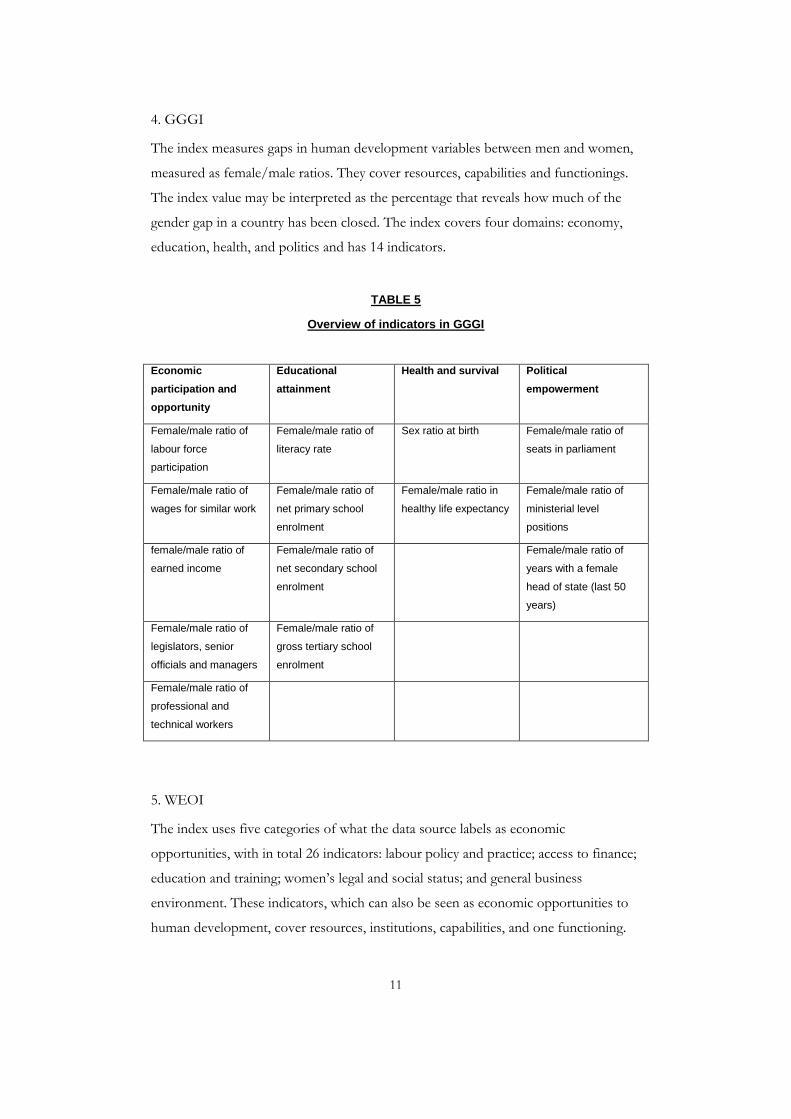
gender gap in a country has been closed. The index covers four domains: economy,
education, health, and politics and has 14 indicators.
TABLE 5
Overview of indicators in GGGI
Economic
participation and
opportunity
Educational
attainment
Health and survival Political
empowerment
Female/male ratio of
labour force
participation
Female/male ratio of
literacy rate
Sex ratio at birth Female/male ratio of
seats in parliament
Female/male ratio of
wages for similar work
Female/male ratio of
net primary school
enrolment
Female/male ratio in
healthy life expectancy
Female/male ratio of
ministerial level
positions
female/male ratio of
earned income
Female/male ratio of
net secondary school
enrolment
Female/male ratio of
years with a female
head of state (last 50
years)
Female/male ratio of
legislators, senior
officials and managers
Female/male ratio of
gross tertiary school
enrolment
Female/male ratio of
professional and
technical workers
5. WEOI
The index uses five categories of what the data source labels as economic
opportunities, with in total 26 indicators: labour policy and practice; access to finance;
education and training; women’s legal and social status; and general business
environment. These indicators, which can also be seen as economic opportunities to
human development, cover resources, institutions, capabilities, and one functioning.

12
TABLE 6
Overview of indicators in the WEOI
Labour policy &
practice
Access to fi-
nance
Education &
training
Women’s legal &
social status
General busi-
ness environ-
ment
Equal pay for
equal work
Ability to build a
credit history
Women’s school
life expectancy,
primary & sec-
ondary
Addressing vio-
lence against
women
Regulatory quality
Non-discrimination
in employment
Women’s access
to finance pro-
grams
Women’s school
life expectancy,
tertiary
Freedom of
movement for
women
Business start-up
difficulty
Maternity and
paternity leave
and provision
Delivering finan-
cial services
Women’s adult
literary rate
Property owner-
ship rights gender
equality
Infrastructure risk
Legal restrictions
on job types for
women
Private sector
credit as % of
GDP
SME support Adolescence
fertility rate
Mobile phone
subscriptions
Difference be-
tween statutory
retirement age
between men and
women
CEDAW ratifica-
tion
Equal pay for
equal work en-
forcement
Non-discrimination
in employment
enforcement
De facto discrimi-
nation of women
in workplace
Childcare services
Based on the above listed indictors underlying the five gender indices, the extent of
overlap has been calculated, as presented in Table 7. Surprisingly, this is much less
than the average bi-variate correlation of 69% would suggest: the average overlap in
underlying indicators is only 20%2. Hence, the high correlation between the indices is
to a large extent not stemming from covering the same indicators. The institutional
2 For the calculation of the average overlap, the 100% overlap between the same indices has been ignored.

13
index, SIGI, has the least overlap (an average of 6%), and only with one other index
(WEOI: 25%). The index that has most indicators in common with the other indices
is the GII, (with an average overlap of 35%) whereas the highest overlap between two
individual indices is 60%, namely of GGGI indicators in the GII index.
TABLE 7
Overlap of indicators between gender indices (%)
GEI GII SIGI GGGI WEOI
GEI 100 40 0 57 12
GII 14 100 0 29 12
SIGI 0 0 100 0 12
GGGI 38 60 0 100 12
WEOI 19 40 25 29 100
Average overlap 18 35 6 29 12
4 Why Do They Measure What They Measure?
Before we go to the comparison of the frequency distributions of each index, I would
like to go deeper into the contradiction between the high Pearson Correlations, on the
one hand, and the much lower overlaps in underlying indicators between the indices.
Although they all measure gender inequality, the difference may be attributed to the
fact that they differ in the emphasis they place on which end of the process of
gendering wellbeing in societies. That is, some emphasize inputs, such as resources,
whereas others emphasize outcomes, such as achievements and other wellbeing
dimensions. This implies that they measure gender inequality in at different stages:
ranging from the input side, through constraints on choices, to outcomes. This
suggests a way to categorize the indices systematically, namely by comparing them
according to which stages of wellbeing each emphasizes.
In order to be able to distinguish the indices in this way, I will follow the general
distinction developed in the Capability Approach and the Human Development
literature, namely of resources, capabilities, institutions, and functionings. This
framework regards human development as a process in which access to resources is
only one stage towards wellbeing. The other key stages are capabilities, as
opportunities, and functionings, as wellbeing achievements. While all these stages are

14
influenced – positively or negatively – by institutions, both formal ones and informal
ones. According to Robeyns (2005), social indicators are an adequate measure of
aggregate wellbeing in the Capability Approach. Thereby, one should clearly
distinguish between measuring wellbeing outcomes only, what Sen (1997) has called
culmination outcomes, and also processes that lead to the outcomes, what Sen labelled
as comprehensive outcomes. Most gender indices, in fact three out of five, can be
understood as comprehensive outcomes, which include various aspects of the choice
process that people have. In case of the gender indices these are measured as
differences in the choice process between men and women or constraints to women’s
choice process.
The indices are substantive enough to help broaden the measurement of human
development. Because they include variables related to employment, empowerment,
physical safety and subjective wellbeing, which are four out of the five variables which
Sabina Alkire (2007) has identified as missing dimensions in the measurement of
human development. For measuring gender inequalities, the literature tends to agree
that all four human development dimensions are important and that measurement of
women’s capabilities and gender inequality should be broad and encompass a wide
diversity of elements that relate to male-female differences, in all dimensions, such as
education, income, social norms, and health achievements (Agarwal, Humphries and
Robeyns, 2004). There is, however, disagreement on whether there is a fixed list of
dimensions to be included, and hence, of indicators to be measured, and whether
there should be an order and/or threshold values for capabilities. Whereas Nussbaum
(2003) argues in favour of this, Sen (2004) wants to leave it open to public debate in
individual societies.
From this comprehensive approach to understanding gender differences in wellbeing,
I have identified which gender indicators measure which stage in the Capability
Approach:
- Resources: real access to inputs like land, income and credit. This also
includes wage variables for example, such as gender wage inequality, as well as access
to particular services such as child care, road infrastructure and business support.
- Institutions: formal institutions such as laws and rights, and informal
institutions such as social norms and cultural practices. Gendered institutions are
asymmetric between men and women and often form unequal constraints for women

15
for their capabilities and functionings. Examples are women’s lack of land rights and
stereotype perceptions of working mothers as less deserving of jobs or as inadequate
parents.
- Capabilities: directly enabling peoples’ doings and beings, such as education
and health.
- Functionings: actual doings and beings that one has reason to value, such as
being literate and having a long life expectancy.
The result of the identification of indicators into the four stages of the Capability
Approach is shown in Table 8 below.
TABLE 8
The Capability Approach in the gender indices (%)
GEI GII SIGI GGGI WEOI
Resources 5 0 0 14 19
Institutions 57 0 100 7 69
Capabilities 33 60 0 64 8
Functionings 5 40 0 14 4
Total 100 100 100 100* 100
The comprehensive framework of four stages of the Capability Approach helps to
recognize that the indices differ clearly in which stage of the gendering process in
societies they measure. SIGI exclusively measures institutions. But also WEOI has
almost 70% of institutions, because of its emphasis on legal constraints and normative
market distortions. GII and GGGI emphasize capabilities, 60% and 64% respectively
of the indicators concern capabilities. Resources and functionings do not dominate in
any index, although in GII functionings play an important role with 40% of the
indicators being functionings. Taking capabilities and functionings together, as gender
outcome variables, GII measures 100% outcomes, SIGI 0%, WEOI only 12%, GEI
38% and GGGI 78%. Resources play a limited role in every index, with a maximum
of almost 20% in the WEOI. This implies that, in terms of the sequencing in the
capability approach, no index is exclusively suitable for measuring women’s actual
access to resources, such as income, land, or credit. The most balanced gender index,
incorporating a relatively balanced mix of input indicators, institutional constraints
16
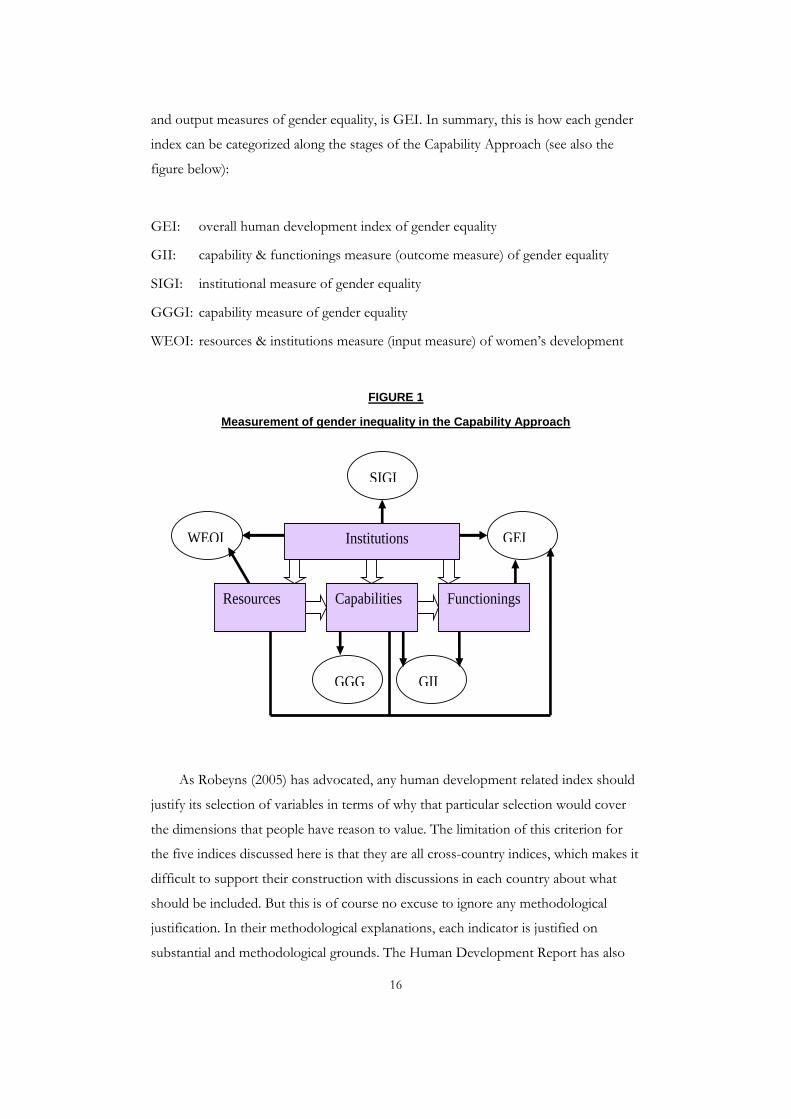
and output measures of gender equality, is GEI. In summary, this is how each gender
index can be categorized along the stages of the Capability Approach (see also the
figure below):
GEI: overall human development index of gender equality
GII: capability & functionings measure (outcome measure) of gender equality
SIGI: institutional measure of gender equality
GGGI: capability measure of gender equality
WEOI: resources & institutions measure (input measure) of women’s development
FIGURE 1
Measurement of gender inequality in the Capability Approach
Resources
Institutions
Capabilities Functionings
WEOI
SIGI
GII GGG
I
GEI
As Robeyns (2005) has advocated, any human development related index should
justify its selection of variables in terms of why that particular selection would cover
the dimensions that people have reason to value. The limitation of this criterion for
the five indices discussed here is that they are all cross-country indices, which makes it
difficult to support their construction with discussions in each country about what
should be included. But this is of course no excuse to ignore any methodological
justification. In their methodological explanations, each indicator is justified on
substantial and methodological grounds. The Human Development Report has also

17
made a conscious choice with its new GII to only include capabilities and
functionings, and not resources and institutions. This is because the index, like the
poverty and human development indices in the same report, is meant to measure the
outcomes and impacts of the human development process. To the contrary, SIGI
focuses on the institutional constraints that women experience on their wellbeing
because there does not exist any measure that has done this before, and it
complements other indices of gender inequality which all include other stages of
human development3. The other three indices have opted for broad measurement,
including inputs and outcomes, and have therefore included a wide variety of
indicators trying to capture as many forms of gender inequality as possible.
5 Measurement Results
Below in Table 9, I show a summary of descriptive statistics for the five indices. It
makes clear that even though all indices have been standardized, there are great
differences in their distribution, in particular in their mean, median, variance, and
range. The spread varies considerably, with some having a range more than twice than
that of another index. Only one index comes close to a normal distribution, namely
the GGGI. The table implies that the construction of each index differs quite a lot.
3 The rationale for SIGI states it thus: “In many countries of the world, social norms lock women in traditional roles, for example activities as housewives, responsible for taking care of the children and preparing food. SIGI variables try to capture the social institutions that manifest such stereotypes, for example by measuring the percentage of girls; who get married at very young ages, and indication of forced or arranged marriages.” URL: http://genderindex.org/content/rationale-social-institutions-and-gender-index

18
TABLE 9
Descriptive statistics
GEI GII SIGI GGGI WEOI
N Valid 182 138 101 134 113
N Missing 5 49 86 53 74
Mean 0,727 0,546 0,127 0,678 0,549
Std. Error of Mean 0,005 0,015 0,012 0,005 0,016
Median 0,733 0,590 0,110 0,683 0,516
Mode 0,563 0,310 0,002 0,608 0,145
Std. Deviation 0,066 0,178 0,123 0,061 0,168
Variance 0,004 0,032 0,015 0,004 0,028
Skewness -0,175 -0,389 1,556 -0,183 0,104
Kurtosis -0,738 -1,120 4,152 0,992 -0,797
Range 0,298 0,679 0,675 0,389 0,737
Minimum 0,563 0,174 0,002 0,460 0,145
Maximum 0,861 0,853 0,678 0,850 0,882
Following the descriptive comparative analysis, I will now compare the five indices on
their country rankings. Table 9 below shows for each index the top ten and the
bottom ten countries. For the top ten countries, overlap is limited. This is partly due
to the fact that for SIGI, only developing countries are included. The biggest overlap
is for Sweden and Finland, which appear in four out of the five indices in the top ten.
Norway and New Zealand appear at the top in three indices, whereas Canada, the
Netherlands, Belgium, Denmark, Germany, Switzerland and the Philippines all appear
twice in the top ten.
Despite the fact the some indices have less country data than others, there is
still considerable overlap in the bottom rankings. Five countries appear in three out of
the five rankings: Afghanistan, Cameroon, Sudan, Mali and Côte d’ Ivoire. Two
countries appear four times: Chad and Pakistan. And one country appears in the
bottom ranks of every index: Yemen. Contrary to the top rankings, for the bottom
rankings SIGI has quite a lot of overlap with the other indices: six countries in the
SIGI bottom ranking also appear at the bottom of the other indices, although not all
six in each index. This implies that very unequal gendered institutions parallel high
inequalities in resources, capabilities and functionings for women. But countries with
more equal gendered institutions do not necessarily enjoy more equality in resources,
19
capabilities and functionings. Using data on beliefs, attitudes and social norms from
the World Values Survey, Inglehart and Norris (2003) recognize that economic growth
does not automatically bring about changes in values towards women and gender
equality. These gendered institutions do get less unequal over time, but require direct
policies to improve form women, they argue, along side equal opportunity policies in
the labour market. The authors claim that improvements in gendered institutions, or
culture as they refer to it, form a distinct driving force for reducing gender inequalities.
Van Staveren (forthcoming) has demonstrated this in an analysis using data on
gendered institutions, with economic variables for resources and capabilities as control
factors. From this study it was concluded that for women’s empowerment, access to
education (a resource) and being in employment (a capability) are necessary conditions
but not sufficient: unequal gendered institutions can reduce or even annihilate the
positive impact of resources and capabilities for women’s empowerment. Also
employing data from the World Values Surveys, Seguino (2007) has found that gender
equality tends to improve for countries when women’s access to economic resources
(income) and capabilities (employment) are stimulated. She has demonstrated for a
sample of developed and developing countries that an improvement in those
dimensions of human development helps to reduce gendered institutions. These
studies, however, do not, or only to some extent, go into the possibility of nonlinear
relationships between these human development dimensions. The results from the
above comparative analysis of gender indices points out that further research into the
type of relationships between gender inequalities in human development dimensions is
necessary.
The comparison of the country rankings leads to two conclusions. First, it
shows that the five indices obtain quite different ranking results, so that they should
not be considered entirely as interchangeable. They emphasize different dimensions of
human development, which is likely to explain, at least to some extent, the different
ranking outcomes. Second, there appears to be more similarity in rankings at the
bottom than at the top and, and this is particularly clear for SIGI. Apparently, low
human development rankings imply low values for every human development
dimension, whereas high human development can show quite varied scores for
particular human development dimensions. Together, these two findings from the
descriptive statistical comparison of the five indices suggest that there is a non-linear
relationship between the four dimensions of human development that make up the
indices. Access to resources, capabilities, institutions and functionings are clearly

20
distinct dimensions of human development, which do not automatically move
together when countries develop, as has been argued in the literature on measurement
in the Capability Approach (Alkire, 2007; Alkire and Santos, 2009)). Here, we see that
this also counts for the gender differences in these four dimensions. But further
analysis into the methodologies of the construction of each index is necessary in order
to find out whether part of the differences found in the distribution and rankings
between the indices should be attributed to differences in measurement.

21
TABLE 10
Country rankings per gender index (2010)
COUNTRY GEI COUNTRY GII COUNTRY SIGI COUNTRY GGGI COUNTRY WEOI
Top ten Top ten Top ten Top ten Top ten
Canada 0,860 Netherlands 0,174 Paraguay 0,002 Iceland 0,849 Sweden 0,882
Sweden 0,843 Denmark 0,209 Croatia 0,003 Norway 0,840 Belgium 0,864
New Zealand 0,842 Sweden 0,212 Kazakhstan 0,003 Finland 0,826 Norway 0,852
Latvia 0,842 Switzerland 0,228 Argentina 0,003 Sweden 0,802 Finland 0,851
Neth. Antilles 0,839 Norway 0,234 Costa Rica 0,007 New Zealand 0,780 Germany 0,839
Estonia 0,835 Belgium 0,236 Russian Fed. 0,007 Ireland 0,777 Iceland 0,828
United States 0,834 Germany 0,240 Philippines 0,007 Denmark 0,771 Netherlands 0,825
Belarus 0,831 Finland 0,248 El Salvador 0,008 Lesotho 0,767 New Zealand 0,812
Slovenia 0,830 Italy 0,251 Ecuador 0,009 Philippines 0,765 Canada 0,805
Finland 0,828 Singapore 0,255 Ukraine 0,009 Switzerland 0,756 Australia 0,804
Bottom ten Bottom ten Bottom ten Bottom ten Bottom ten
Pakistan 0,563 Yemen 0,853 Sudan 0,677 Yemen 0,460 Sudan 0,144
Afghanistan 0,578 Congo Dem. R. 0,814 Afghanistan 0,582 Chad 0,533 Yemen 0,192
Cameroon 0,588 Niger 0,807 Sierra Leone 0,342 Pakistan 0,546 Chad 0,251
Yemen 0,600 Mali 0,799 Mali 0,339 Mali 0,568 Côte d'Ivoire 0,288
Nigeria 0,601 Afghanistan 0,797 Yemen 0,327 Côte d'Ivoire 0,569 Togo 0,292
Chad 0,607 Papua N. Guinea 0,784 Chad 0,322 Saudi Arabia 0,571 Pakistan 0,298
Congo Dem. R. 0,608 Centr. African R. 0,768 India 0,318 Benin 0,571 Ethiopia 0,312
Iraq 0,610 Liberia 0,766 Iran 0,304 Morocco 0,576 Syria 0,317
Solomon Islands 0,612 Côte d'Ivoire 0,765 Pakistan 0,283 Turkey 0,587 Cameroon 0,321
Sudan 0,613 Cameroon 0,763 Iraq 0,275 Egypt 0,589 Bangladesh 0,325
22
6 Measurement Methodology
So far, the paper has reviewed the indices in terms of their descriptive statistics and
type of underlying indices. The limited overlap in underlying dimensions combined
with the rather great differences in country rankings now necessitate a more detailed
methodological analysis of the differences in each index construction. Because,
although the fact that each index emphasizes a different stage of human development,
measurement issues of the indices may also help to explain the different rankings and
different ways in which each index features in quantitative analyses, such as factor
analysis or regression analysis. The main methodological differences considering
measurement of the indices are weights of indices, capping, and aggregation.
Obviously, such issues are not new, and also critical discussions on the
methodology behind indices are not new. One of the most discussed indices in the
area of human development is the Human Development Index (HDI), which was first
published in 1990, by the Human Development Office of the UNDP. Over time, the
critique has lead to small adaptations in the construction of the HDI as well as in
alternative measures published by the same office in its annual Human Development
reports, such as the Human Poverty Index. A major issue of discussion has been the
extent to which an index of human development reflects inequalities. Obviously,
gender indices are constructed precisely as indices of inequality, by comparing male-
female values for indicators and including specific indicators for dimensions that
signal gender inequality, like, for example, the sex ratio in a population, the extent of
early marriage of girls, and people’s views about women’s roles. This leads us to the
discussion of weights between indicators and the extent to which an index is inequality
averse. Weights imply value judgments, namely about the relative importance of
indicators in an index and the extent to which they measure quite similar things or not
– issues of breadth and depth.
A first measurement problem that we find among the gender indices is that
one index, GGGI, includes income, as the gender differences in earned income.
However, earned income is in most country statistics an estimated value based on data
on labour force participation and wage differences. Hence, it would be better to
replace the income variable with a female labour force participation variable (see also
Klasen and Schüler, 2011). GGGI, however, includes both, which implies a tautology.
The number of indicators also influences their relative importance, in comparison

23
with other indices. Here, we see a second difference arising among the gender indices:
two indices include a relatively small number of variables, as compared to the other
three. This implies that each variable in those two indices – SIGI and GII – count
more as compared to individual indicators in the other three indices. Thirdly, indices
may differ in the way they deal with gender differences that favour women, for
example in the case of life expectancy for most countries and for a few countries
where women have higher school enrolment rates in secondary and/or tertiary
education. One index allows for full compensation, whereas the other indices using a
one-tailed scale or a cap, whereby they treat any advantage of women over men the
same as an equal score for both sexes.
On the issues of weights, they can be applied at two levels: between categories of
indicators (sub-indicators) and between individual indicators. If averages are calculated
using a simple average (arithmetic mean), indicators with a higher standard deviation
would receive more weight. And if sub-indices are squared higher inequality is
penalized more in the total index, which leads to the incorporation of inequality
aversion in an index. Below, I will summarize for each index how these
methodological issues have been dealt with.
GEI:
The index uses as the only one among the five gender indices the matching
percentiles method, whereby values are matched across cases based on country
rankings using a bootstrapping method. The ranks of successive indicators included in
the index are used to assign equivalent values to countries based on their position on
each additional measure. Variables are iteratively added to produce the index and this
process is repeated 1,000 times in Monte Carlo simulations. The aggregation is
nonparametric and hence does not choose between linear or nonlinear functions. This
method overcomes the problem of sampling bias inherent in the use of variables for
which there are many missing values. The matching percentiles method implies that
the relatively large number of indicators helps to reduce measurement error4. Standard
errors are reported for each country score on the index. For this method, a large
4 Combining indicators does not eliminate measurement error, but if one assumes that errors are uncorrelated between data sources and that the size if the error is constant across items, then the combination of multiple sources will progressively reduce error as the number of indicators increases.

24
number of indicators is not simply a saturation of the index, but actually an
improvement as compared to a small number of indicators. The indicators receive no
weights but are standardized and normalized to ensure equal impact. The female/male
ratios are capped to equality, not allowing compensation of female disadvantage in
one variable with female advantage in another variable.
GII:
The index allows for compensation of female disadvantage with male
disadvantage. It is thereby a genuine index of gender inequality, but by its neutrality to
the direction of disadvantage, it is not an index of women’s disadvantage. This implies
that countries that have female disadvantage in some indicators and male disadvantage
in other indicators end up as having very low gender inequality, even though women’s
position may be structurally worse than men’s in key human development dimensions.
The averaging of ratios uses the geometric mean, which is a multiplicative rather than
an additive process. This prevents disbalances in case deviations from equality may be
stronger for one sex than for the other. In other words, female and male disadvantage
in the same sub-index lead to a symmetric average, and not one in which one
disadvantage counts stronger than another one. The weakness of a geometric mean is
when a particular score would be 0, that is, a female-male ratio in which women are
completely absent, for example in parliamentary seats in some countries, the result of
the multiplication would be zero too.
SIGI:
The five categories (family code, civil liberties, son preference, physical integrity,
and ownership rights) have equal weights, but the SIGI value consists of a nonlinear
arithmetic mean of these five categories, obtained by using the squared values of each
sub-index. This incorporates inequality-aversion in the index: the higher the inequality
for a sub-index, the stronger the index weighs in the total index. At the level of
individual indicators, each sub-index’s indicators are analyzed with polychoric
principal component analysis in order to find their commonality, except for the son
preference category which measures one variable only. This leads to a first principal
component, which is a weighted sum of the standardized corresponding variables.
The weights are equal for the indicators in the Civil Liberties and Physical Integrity
sub-indices and almost equal for the indicators making up Ownership Rights. But in

25
the Family Code sub-index one of the four indicators, early marriage, receives a weight
that is 25-28% less than the weights for the other three indicators in the sub-index.
SIGI gives a value of zero to full equality and all other values imply disadvantages for
women, hence, SIGI does not include values that advantage women over men.
GGGI:
There are no weights between the four categories of indices (economic,
education, health and politics). All indicators are normalized in order to ensure equal
representation in each sub-index. These weights are calculated through the standard
deviation per 1 percentage point change of each indicator, which are translated into
weights. This means that the weighting of GGGI is quite opposite the weighting in
SIGI: whereas in SIGI, indicators receive weights according to their relative
importance in a principal component analysis, and sub-indices are squared in order to
express inequality aversion, in GGGI every indicator receives equal weight by
eliminating differences in the spread of each variable, and hence, in the way higher or
lower scores affect the value of the four sub-indices. GGGI does not allow for
compensation of gender inequalities favouring women: data are transformed using a
one-sided scale that measures how close women are to parity with men. Finally, as
indicated above, the GGGI includes income data, for which are, however, no reliable
data, and are therefore imputed from male and female labour force participation data.
The GGGI includes both so there is some double measurement of the same
dimension, namely paid employment.
WEOI:
This is the only index that does not measure gender gaps but constraints to
women’s economic opportunities as well as the general business environment for men
and women. The five index categories have equal weights and each sub-index consist
of an unweighted average of underlying indicators. As in GEI, Principal Component
Analysis was used for the selection of indicators. The weights of indicators in each
sub-index determined by the First Principal Component are reported in the report
underlying the WEOI, to justify the absence of weights within the sub-indices and
between these. The list of weights, however, shows that there are substantial
differences between the weights in the First Component. Unweighted scores would
lead to 20% for each sub-index, whereas the First Component has ‘labour policy and

26
practice’ included for 26% and ‘access to finance’ included for only 12%. Also within
sub-indices there are stark differences. For example in ‘labour policy’ the lowest
weight is 2% (differential retirement age) and the highest weight is 34%, for ‘ILO
convention 111’.
The measurement differences between the gender indices help to clarify further
why the indices show quite different country rankings. First, GII allows for
compensation of female disadvantage with male disadvantage. This makes it a genuine
gender indicator but not one that measures female disadvantage, and hence it is not
suitable as an indictor for women’s empowerment or advancement in women’s
relative position with men. GEI, SIGI and GGGI do not allow compensation and are
therefore measures of female disadvantage. SIGI is the only index which in addition
includes inequality aversion, through its quadratic specification. Quite the opposite,
GEI and GGGI equalize each indicator in the sub-indices by re-scaling them to
obtain the same standard deviation, so that each will have exactly the same weight.
WEOI does not use weights, though some of the scores in the principal component
analysis’ first component differ substantially. This implies that SIGI most explicitly
expresses gender inequality as female disadvantage: it does not allow compensation
and expresses inequality aversion. Next come GEI and GGGI, which use respectively
capping and a one-sided scale to prevent compensation. Then follows GII, which
does allow for compensation, and finally WEOI which does not reflect gender
differences but women’s opportunity independent of men’s opportunity. This last
mentioned index, however, may be very suitable for analyses of changes in women’s
opportunities over time and comparisons of countries and regions of women’s
opportunities as such.
7 Examples of Using Gender Indices for Policy Analysis
This section goes one step further than the country rankings that were shown for each
index. Here, I will show a few examples of how the gender indices are related to some
key policy variables. I will do so by calculating bi-variate regression results, with a
constant, for pairs of gender indices on the one hand and policy variables on the other
hand. This section is only illustrative of possible relationships with policy variables, it

27
cannot provide an in-depth policy analysis because that would go beyond the purpose
of this paper. A more rigorous policy analysis will be taken up in another paper. The
results of the bi-variate regressions presented in this section may be understood in two
ways. There may be a causal relationship from gender equality to a particular policy
outcome, such as the share of children working, HIV affection of women, or
government spending on education and health. This may be because more inclusion
of women in the economy or better rights for women, may support the effectiveness
of social policies in other areas of life. While there may also be causal relationships
from particular policy variables, for example those on social spending or good
governance, to gender equality: some policies may stimulate gender equality whereas
others may constrain more equality between men and women.
The results that are shown in the table below all concern data for 2010, or the
most recent available year. For a more detailed analysis of relationships between
gender variables and policy variables, a cross-section analysis is less suitable. Time
series data, or panel data combining cross-section with time-series data would be more
suitable. Also, it is to be expected that there is a time lag between a change in a gender
variable and a change in a policy variable, which also necessitates the use of data for
more than one year. Such analysis is not possible, however, because three out of the
five gender indices used in the comparative analysis in this paper have data available
only for the year 2010. Therefore, the bi-variate regression results are reported only as
examples of possible policy relationships, as indicative for the relevance of using the
gender indices in policy research. Taking these caveats into account, Table 11 shows
some interesting results for three quite distinct policy areas: infant mortality, HIV
prevalence among women, and public spending on education.

28
TABLE 11
Bi-variate regression results for policy variables (2010)
GEI (positive-ly measured)
GII (negatively measured)
SIGI (nega-tively meas-ured)
GGGI (posi-tively meas-ured)
WEOI (posi-tively meas-ured)
Infant mortality rate -0.629*** (-10.680)
0.714*** (11.908)
0.597*** (7.361)
-0.425*** (-5.392)
-0.639*** (-8.718)
HIV prevalence female -0.235*** (-2.849)
0.335*** (3.880)
0.198 (1.832)
0.058 (0.625)
-0.143 (-1.430)
Educ. Public spending % GDP 0.093 (1.003)
-0.126 (-1.245)
-0.205 (-1.703)
0.240** (2.382)
0.297*** (2.761)
Notes: Cross-section regressions with constant; reported are standardized coefficients (beta); t-
statistics in brackets. Levels of significance: *** p<0.01; ** p<0.05.
The first policy variable, the infant mortality rate, shows consistently negative
relationships with gender equality, and for all five gender indices the results are
statistically significant. The parameter sizes are all in the same range, between 0.43 and
0.71, and quite strong. The literature finds a robust positive relationship between
gender equality and a reduction in infant mortality, even going back a century in the
United States (Miller, 2008; Kirk and Pillet, 1998; Klasen, 1999; World Bank, 2011).
This result found in the literature is also now demonstrated in a cross-country analysis
with a wide variety of composite indices of gender equality. Whether one measures
gender inequality in inputs, social norms and rights, or outcomes, they all point out
that more gender equality goes together with less mortality among children under one
year old per 1,000 live births. It is likely that the causality runs from gender equality to
a reduction in infant mortality, because of mothers’ important influence over child
survival in the first year. With more resources, rights, social appreciation, capabilities
and wellbeing achievements, women have more choices over their own lives and more
opportunities to provide good care for their children.
The second and third policy variables analyzed here, show a much more
varied result. For HIV prevalence among females four out of the five gender indices
show the expected sign. GGGI not, and the parameter is very small as compared with
the other gender indices. Moreover, three gender indices have no statistically
significant results. Only SIGI has a parameter value that comes close to the statistically
significant vales for GEI and GII. We expected the causality to run from gender
equality to a lower HIV prevalence, because when women’s status in a society is
stronger relative to men, they are more likely to be able to refuse unsafe sex. This
29
helps to reduce HIV infection among women as far as this is determined by sexual
behaviour. The bi-variate regression results indicate that only GEI and GII function
as signals for HIV prevalence among women. The reason may be that they both
include a substantial share of non-economic variables, as compared to GGGI and
WEOI. Also, women’s health is covered in GEI and GII, which is less the case in the
other three gender indices. A review article on the relationship between gender power,
gender inequality and HIV infection among women, suggests that various gender
relations play a role, and not merely women’s economic status (Wingood and
DiClemente, 2000).
Finally, the third policy variable analyzed is the share of public spending on
education in GDP. Here, we expect the causality to run from educational spending to
gender equality: the higher such social investments, the more likely it is that women
receive education. This, of course, assumes that educational budgets are not spent in a
very gender unequal way favouring boys substantially more than girls. But with the
international policy goals of the Millennium Development Goals, emphasizing closing
the educational gender gap, such severe unbalances are not likely. The World Bank has
estimated that educational spending needs to increase by 3% annually in order to
contribute to closing the gender gap in education. Moreover, we can expect that more
public educational spending would not only improve girls’ education, but also
women’s economic position, in particular in terms of their human capital. This is
precisely why we see positive and statistically significant relationships with GGGI and
WEOI. The first measures capabilities, in particular women’s educational performance
relative to men’s. While the second measures women’s absolute economic position, in
which human capital plays a crucial role. So, it seems that the relationship indicates
that, in the current era of the MDGs (2000 – 2015), more public expenditure on
education as a share of GDP contributes to more gender equality in women’s human
capital in particular, and to an improvement in women’s economic position more
generally.
8 Knowing How to Measure
This section provides a set of three decision trees for selecting an appropriate gender
index. The set contains three distinct types of decisions. The first decision is about
general measurement features, such as years, countries, and compensation of female

30
disadvantage with male disadvantage. The second decision is about statistical
methodology, involving weights, standardization and aggregation5. The third decision
concerns the theoretical foundation of the Capability Approach which helps to
distinguish the indices substantially, along different stages of the human development
process.
Decision A: what, how, which
1. Do you want to measure gender differences?
No, I want to measure women’s position: WEOI
Yes:
2. Do you want to measure women’s disadvantage vis-à-vis men?
No, I want to include gender differences in both ways: GII
Yes:
3. Do you want to include developed countries in your data set?
No, only developing countries is fine: SIGI
Yes:
4. Do you want to use only the most recent years (from 2006 onwards)?
No, I want to include data from 1990 onwards (in five-year periods):
GEI
Yes: GGGI
Decision B: methodological differences
1. Do you want to measure exclusively the economic dimension?
Yes: WEOI
No:
2. Do you want to include inequality aversion and weights between indicators?
Yes: SIGI
No:
5 Except for the first question which asks about dimensions.

31
3. Do you want standardization and normalization in an index using matching
percentiles, a bootstrapping process of ranking with standard errors reported?
Yes: GEI
No:
4. Do you want standardization and normalization so that the index measures
the percentage a country’s gender gap is closed?
Yes: GGGI
No: GII
Decision C: theoretical differences: stages of the capability approach
1. Do you want to measure all four stages of the capability approach (resources,
institutions, capabilities and functionings)?
Yes: GEI
No:
2. Do you want to predominantly measure inputs (resources and institutions)?
Yes: WEOI
No:
3. Do you want to exclusively measure institutions?
Yes: SIGI
No:
4. Do you want to predominantly measure capabilities?
Yes: GGGI
No:
5. Do you want to predominantly measure outcomes (capabilities and function-
ings)?
Yes: GII

32
9 Conclusions: What Do We Know?
The five gender indices are quite strongly correlated but have only a small share
of indicators in common. The differences have been analyzed theoretically and
methodologically.
The methodological analysis has demonstrated that, even though all indices
have values between 0 and 1, their descriptive statistics vary considerably. Further
methodological analysis has shown that the construction of each index differs
substantially. WEOI does not measure gender gaps but women’s opportunity. SIGI
includes inequality aversion, penalizing countries with higher inequality in a sub-index.
GEI employs the most sophisticated procedure to obtain values for a large number of
countries. GEI and GGGI use, like SIGI, caps to prevent compensation of female
disadvantage in some indicators with male disadvantage in other indicators. Finally,
GII takes a gender neutral stand toward inequality, allowing for the compensation of
female disadvantage with male disadvantage.
The theoretical analysis was based on the human development and capability
approach. It has categorized each index into one or more stages of the human
development process, namely, resources, institutions, capabilities and functionings.
This analysis has pointed out that each index emphasizes a different stage of human
development. WEOI focuses on the input side, measuring resources and institutions,
SIGI measures institutions only, GGGI largely focuses on capabilities, GII measures
the output side, namely capabilities and functionings, while GEI reflects the whole
human development process, including all four stages in a relatively balanced way.
The theoretical and methodological differences between the five gender
indices help to explain why the country rankings are quite different. And the examples
with policy variables have suggested that these differences also lead to very different
relationships between the gender indices on the one hand and a variety of policy
variables n the other hand. They also indicate that policy research and policy
monitoring and evaluation using gender indices should be conscious about which
index to use for which purposes. They are clearly not interchangeable, and the
selection of a particular gender index should be justified carefully to make its use in
scholarly research and policy analysis meaningful. As a guidance, the paper has
provided a set of decision trees to enable an informed choice among the five best

33
know and widely accessible cross-country composite gender indices. What lies ahead
is a discussion among researchers and policy analysts based on policy research using
the indices – the proof of the puddings is in the eating …
34
References
Agarwal, Bina, Jane Humphries, and Ingrid Robeyns (2004) Capabilities, Freedom and
Equality – Amartya Sen’s Work from a Gender Perspective. New Delhi: Oxford
University Press.
Alkire, Sabine (2007) ‘The Missing Dimensions of Poverty Data: Introduction to the
Special Issue’, Oxford Development Studies 35 (4), pp. 347-359.
Alkire, Sabina, and Maria Emma Santos (2009) ‘Poverty and Inequality Measurement’,
in Séverine Deneulin and Lila Shahani (eds.) An Introduction to the Human
Development and Capability Approach – Freedom and Agency. London:
Earthscan. E-book version: www.irdc.ca (ISBN 978-1-55250-470-3).
Branisa, Boris, Stephan Klasen, Maria Ziegler, Dennis Drechsel, and Johannes Jütting
(2010) The Social Institutions and Gender Index (SIGI).
http://www.oecd.org/dataoecd/49/39/42296064.pdf
Economist Intelligence Unit (2010) Women’s Economic Opportunity – A New Pilot
Index and Global Ranking. Findings and Methodology.
http://graphics.eiu.com/upload/WEO_report_June_2010.pdf
Foa, Roberto, and Jeffery Tanner (2009) Methodology of the Indices of Social
Development.
http://www.indsocdev.org/resources/Methodology%20of%20the%20Social%20
Development%20Indices_%20jan11.pdf
Hausmann, Ricardo, Laura Ryson, and Saada Zahidi (2010) The Global Gender Gap
Report 2010. Geneva: World Economic Forum.
Inglehart, Ronald, and Pippa Norris (2003) Rising Tide – Gender equality and Cultural
Change around the World. Cambridge: Cambridge University Press.
Kirk, Dudley and Bernard Pillet (1998) ‘Fertility Levels, Trends, and Differentials in
Sub-Saharan Africa in the 1980s and1990s’, Studies in Family Planning, Vol. 29, No.
1.
Klasen, Stephan (1999). Does Gender Inequality Reduce Growth and Development?
Evidence from Cross-cutting Regressions. Background Paper for Engendering
Development – Through Gender Equality in Rights, Resources, and Voice. World Bank.

35
Klasen, Stephan, and Dana Schüler (2011) ‘Reforming the gender-Related
Development Index and the Gender Empowerment Measure: Implementing
Some Specific Proposals’, Feminist Economics 17 (1), pp. 1-30.
Miller, G. (2008) ‘Women's Suffrage, Political Responsiveness, and Child Survival in
American History’, Quarterly Journal of Economics, 123(3), pp.1287-1327.
Nussbaum, Martha (2003) ‘Capabilities as Fundamental Entitlements: Sen and Social
Justice’, Feminist Economics 9 (2/3), pp. 33-59.
Robeyns, Ingrid (2005) ‘Selecting Capabilities for Quality of Life Measurement’, Social
Indicators Research 74 (1), pp. 191-215.
Seguino, Stephanie (2007) ‘Plus Ça Change? Evidence on Global Trends in Gender
Norms and Stereotypes’, Feminist Economics 13 (2), pp. 1-28.
Sen, Amartya (1997) ‘Maximization and the Act of Choice’, Econometrica 65 (4), pp.
745-779.
Sen, Amarta (2004) ‘Capabilities, Lists, and Public reason: Continuing the
Conversation’, Feminist Economics 10 (3), pp. 77-80.
Van Staveren, Irene (2011), ‘FDI Volatility and Development’, in: Peter A.G.
van Bergeijk, Arjan de Haan and Rolph van der Hoeven (eds), The
Financial Crisis and Developing Countries, Cheltenham: Edward Elgar, 2011,
pp. 101-116.
Van Staveren (forthcoming) ‘An Exploratory Cross-Country Analysis of
Gendered Institutions’, Journal of International Development.
Wingood , Gina M. and Ralph J. DiClemente (2000) ‘Application of the Theory of
Gender and Power to Examine HIV-Related Exposures, Risk Factors, and
Effective Interventions for Women’, Health Educ Behav 27, pp: 539-565.
World Bank (2001) Engendering Development through Gender Equality in Rights, Resources and
Voice. Washington D.C.: World Bank.
World Bank (2011) World Development Report 2012: Gender Equality and Development.
Washington D.C: World Bank.