Isomer Separation of Positively Labeled -glycans by CE-ESI … · Isomer Separation of Positively...
36
Isomer Separation of Positively Labeled N-glycans by CE-ESI-MS G.S.M. Kammeijer Center for Proteomics and Metabolomics CE IN THE BIOTECHNOLOGY & PHARMACEUTICAL INDUSTRIES 19 TH SYMPOSIUM ON THE PRACTICAL APPLICATIONS FOR THE ANALYSIS OF PROTEINS, NUCLEOTIDES AND SMALL MOLECULES (CE PHARM 2017) LATE BREAKING SESSION – 18 TH OF SEPTEMBER 2017
Transcript of Isomer Separation of Positively Labeled -glycans by CE-ESI … · Isomer Separation of Positively...

Isomer Separation of Positively Labeled N-glycans by CE-ESI-MS
G.S.M. Kammeijer
Center for Proteomics and MetabolomicsCE IN THE BIOTECHNOLOGY & PHARMACEUTICAL INDUSTRIES
19TH SYMPOSIUM ON THE PRACTICAL APPLICATIONS FOR THE ANALYSIS OF PROTEINS, NUCLEOTIDES AND SMALL MOLECULES (CE PHARM 2017)
LATE BREAKING SESSION – 18TH OF SEPTEMBER 2017

GLYCOSYLATION
Highly prevalent co- and post-translational protein modification (PTM)
Thought to be the most complex PTM
More than 50% of human proteins are glycosylated
Large influence on protein function
Associated with physiological conditions and the effect of biopharmaceuticals
IgG1 [P01857]
2 10/1/2017G.S.M. Kammeijer - [email protected]

GLYCOPROTEOMICS
Fucose146.0579 Da
N-Acetyl-D-galactosamine
203.0794 Da
Glucose162.0528 Da
Mannose162.0528 Da
N-Acetyl-D-glucosamine
203.0794 Da
N-Acetylneuraminicacid
291.0954 Da
Galactose162.0528 Da
The most abundant monosaccharides in humans are:
3 10/1/2017G.S.M. Kammeijer - [email protected]

• Analysis of complex samples
• Not site-specific• Not protein-specific
• Site-specific• Protein specific
• Fast increase of complexity of the data
ANALYSIS APPROACHES
4
INTACT GLYCOPROTEINS GLYCOPEPTIDES RELEASED GLYCANS
• Different isoforms• Protein specific
• Not site-specific• Requires isolated proteins
4 10/1/2017G.S.M. Kammeijer - [email protected]

GLYCAN CHARACTERIZATION
OUTLINE
5
IMPROVING SENSITIVITY
10/1/2017G.S.M. Kammeijer - [email protected]
IMPROVING SEPARATION?

IN-HOUSE METHODS
GLYCAN ANALYSIS
CE-ESI-MS
Sample PNGase F release
PNGase F releaseSample CE-ESI-MS
Di-methylamidation
Labeling
6 10/1/2017G.S.M. Kammeijer - [email protected]

TPNG PROFILE WITH CE-ESI-MSBARE-FUSED SILICA CAPILLARY
Injection: 5 psi 60sec40 nL
0.0
2.0
4.0
6.0
x105Intens.
30 31 32 33 34 35 36 37 38 39 Time [min]
10/1/20177 Kammeijer, G.S.M. et al. Manuscript in preparation
0.0
2.0
4.0
6.0
x105Intens.
0 5 10 15 20 25 30 35 40 45 Time [min]
BFS capillary – 90 cm, 30µm id, BGE composition: 10 % AA, capillary coolant: 20°C, voltage: 20 kV, injection sample: 5 psi, 60 sec (40 nL)

TPNG PROFILE WITH CE-ESI-MSBARE-FUSED SILICA CAPILLARY
Injection: 5 psi 60sec40 nL
0.0
2.0
4.0
6.0
x105Intens.
30 31 32 33 34 35 36 37 38 39 Time [min]
10/1/20178 Kammeijer, G.S.M. et al. Manuscript in preparation
VS VS
BFS capillary – 90 cm, 30µm id, BGE composition: 10 % AA, capillary coolant: 20°C, voltage: 20 kV, injection sample: 5 psi, 60 sec (40 nL)

TPNG PROFILE WITH CE-ESI-MSBFS VS DYNAMIC COATED NEUTRAL CAPILLARY
Bare-Fused Silica CapillaryInjection: 5 psi 60sec (40 nL)
0.0
0.2
0.4
0.6
0.8
x106
Intens.
30 31 32 33 34 35 36 37 38 39 Time [min]
0.0
0.5
1.0
1.5
2.0
2.5
x107
Intens.
37 38 39 40 41 42 43 44 45 46 Time [min]
Dynamic Coated Neutral CapillaryInjection: 5 psi 60sec (40 nL)
10/1/20179 Kammeijer, G.S.M. et al. Manuscript in preparation
Dynamic neutral coated BFS capillary 90 cm, 30µm id, , BGE: 10 % AA, capillary coolant: 20°C, voltage: 20 kV, injection sample: 5 psi, 60 sec (40 nL)
BFS capillary 90 cm, 30µm id, , BGE: 10 % AA, capillary coolant: 20°C, voltage: 20 kV, injection sample: 5 psi, 60 sec (40 nL)

IN SOURCE DECAY
10/1/201710 G.S.M. Kammeijer - [email protected]
0
1
2
3
4
x105
Intens.
39.0 39.5 40.0 40.5 41.0 41.5 Time [min]
Advantage of using CE for glycan characterizationIn-source decay can be easily detected and corrected

IN-SOURCE DECAY
10/1/201711 Kammeijer, G.S.M. et al. Manuscript in preparation
Advantage of using CE for glycan characterizationIn-source decay can be easily detected and corrected
Derivatization method 1 Derivatization method 2
Courtesy of Sander Wagt

DATA AUTOMATIONLACYTOOLS
Jansen, B.C. et al. J. Proteome Res., 2016, 15 (7), pp 2198-2210
10/1/201712 Kammeijer, G.S.M. et al. Manuscript in preparation

DATA AUTOMATIONALIGNMENT
10/1/201713 Kammeijer, G.S.M. et al. Manuscript in preparation

DATA AUTOMATIONALIGNMENT
Alignment of reference file(Run#1)
Alignment of analysis(Run #2)
Alignment of analysis(Run #3)
10/1/201714 Kammeijer, G.S.M. et al. Manuscript in preparation

DATA AUTOMATION DATA INTEGRATION
Aligned mzXML file will be used for further data integration
Reference file –
Provide composition listPEP
Expected migration time PEP
Migration windowPEP
Min. charge state PEP
# Peak RT Mass Window Time Window Min Charge Max Calibrant
protonLoss1gip1H5N2 3104 50
protonLoss1gip1H3N4F1 3207 45
protonLoss1gip1H4N4 3233 55
protonLoss1gip1H4N4F1 3274 60
protonLoss1gip1H4N5F1 3282 50
protonLoss1gip1H5N4F1 3338 50
protonLoss1gip1H5N4E1 3395 55 2
protonLoss1gip1H5N4F1E1 3426 55 2
protonLoss1gip1H5N4E2 3475 55 2
protonLoss1gip1H5N4Am1E1 3482 70 2
protonLoss1gip1H5N4F1E2 3498 55 2
protonLoss1gip1H5N5F1E2 3504 55 2
protonLoss1gip1H6N5Am1E2 3617 60 2
protonLoss1gip1H7N6Am3E1 3724 70 2
10/1/201715 Kammeijer, G.S.M. et al. Manuscript in preparation

GLYCAN CHARACTERIZATION
OUTLINE
16
IMPROVING SENSITIVITY
10/1/2017G.S.M. Kammeijer - [email protected]
IMPROVING SEPARATION?

INCREASING SENSITIVITY OF GLYCAN ANALYSIS WITH CE-ESI-MS
Significant increase in sensitivity with nano-LC-MS in combination with acetonitrile enriched nitrogen (DEN)- gas
`
Improvement factor of approximately one order of magnitudeApplication Note # LCMS-93 amaZon speed ETD: Exploring glycopeptides in protein mixtures using Fragment Triggered ETD and CaptiveSpray nanoBooster-2014
Nitrogen gas coming in
Acetonitrile in bottle
Nitrogen gas passes the
headspace of the acetonitrile bottle
Dopant enriched nitrogen gas is
introduced in the ESI source
The solvent vapor acts as a dopant for enrichment. The
charge state of multiple charged ions are modified
optimizing the signal intensity.
17
10/1/201717 Kammeijer, G.S.M. et al. Anal. Chem., 2016, 88 (11), pp 5849-5856

INCREASING SENSITIVITY OF GLYCAN ANALYSIS WITH CE-ESI-MS
Applicable on CE-ESI-MS?
10/1/201718 Kammeijer, G.S.M. et al. Anal. Chem., 2016, 88 (11), pp 5849-5856

279.157
327.006
391.282
430.241
536.162
922.000
311.973
430.242622.030
0.0
0.2
0.4
0.6
0.8
x104
Intens.
0.0
0.2
0.4
0.6
0.8
x104
200 400 600 800 1000 1200 1400 1600 1800 m/z
INCREASING SENSITIVITY OF GLYCAN ANALYSIS WITH CE-ESI-MS
19
Background MS signal
A – CE-ESI-MS
C – CE-ESI-MS with DEN-gas D
B
An overall lower background observed
especially in the higher mass region
10/1/201719 Kammeijer, G.S.M. et al. Manuscript in preparation
0
1
2
3
4
5x10⁵
Intens.
0 10 20 30 40 50 60 Time [min]
0
1
2
3
4
5x10⁵
Intens.
0 10 20 30 40 50 60 Time [min]

INCREASING SENSITIVITY OF GLYCAN ANALYSIS WITH CE-ESI-MS
20
Improvement (total plasma N-glycome)
10/1/201720 Kammeijer, G.S.M. et al. Manuscript in preparation

INCREASING SENSITIVITY OF GLYCAN ANALYSIS WITH CE-ESI-MS
21
Improvement (total plasma N-glycome)
10/1/201721 Kammeijer, G.S.M. et al. Manuscript in preparation

INCREASING SENSITIVITY OF GLYCAN ANALYSIS WITH CE-ESI-MS
22
Improvement (total plasma N-glycome)
3x
10/1/201722 Kammeijer, G.S.M. et al. Manuscript in preparation

GLYCOMICS LOD DETERMINATION
23
PNGase F release
Derivatization
Labeling - Addition of label with cationic charge
CE-ESI-MS analysis
α2,3 N-Acetylneuraminic acid α2,6 N-Acetylneuraminic acidVS
Sample
Purification and enrichment - Cotton HILIC
10/1/201723 Haan, de N., et al., Anal. Chem., 2015, 87 (16), pp 8284–8291, DOI: 10.1021/acs.analchem.5b02426cc

LOD – EXPERIMENTAL SET-UP 2 GLYCAN STANDARDS
Dilution series
Dilution factor
MALDI-TOF-MS Volume 1 µL
CE-ESI-MS Injection volume 44 nL
Concentration Amount used Concentration (addition of LE, 9:1)
Injected amount
1 1000 fmol/µL 1000 fmol 900 fmol/µL 39.6 fmol
10 100 fmol/µL 100 fmol 90 fmol/µL 3.96 fmol
20 50 fmol/µL 50 fmol 45 fmol/µL 1.98 fmol
100 10 fmol/µL 10 fmol 9 fmol/µL 0.396 fmol
200 5 fmol/µL 5 fmol 4.5 fmol/µL 0.198 fmol
1000 1 fmol/µL 1 fmol 0.9 fmol/µL 0.040 fmol
2000 0.5 fmol/µL 0.5 fmol 0.45 fmol/µL 0.020 fmol
10000 0.1 fmol/µL 0.1 fmol 0.09 fmol/µL 0.004 fmol
24 10/1/201724 Kammeijer, G.S.M. et al. Manuscript in preparation

LOD – EXPERIMENTAL SET-UP 2 GLYCAN STANDARDS
00%
10%
20%
30%
40%
50%
60%
70%
Re
lati
ve p
eak
are
a
1x –
MA
LDI-
TOF-
MS
10
x –
MA
LDI-
TOF-
MS
20
x –
MA
LDI-
TOF-
MS
20
x –
CE-
ESI-
MS
10
x –
CE-
ESI-
MS
1x –
CE-
ESI-
MS
10
00
x –
CE-
ESI-
MS
20
0x –
CE-
ESI-
MS
10
0x –
CE-
ESI-
MS
20
00
x –
CE-
ESI-
MS
1x –
MA
LDI-
TOF-
MS
10
x –
MA
LDI-
TOF-
MS
20
x –
MA
LDI-
TOF-
MS
20
x –
CE-
ESI-
MS
10
x –
CE-
ESI-
MS
1x –
CE-
ESI-
MS
10
00
x –
CE-
ESI-
MS
20
0x –
CE-
ESI-
MS
10
0x –
CE-
ESI-
MS
20
00
x –
CE-
ESI-
MS
25 10/1/201725 Kammeijer, G.S.M. et al. Manuscript in preparation

Dilution series
Dilution factor
MALDI-TOF-MS Volume 2 µL
CE-ESI-MS Injection volume 44 nL
Concentration Amount used Concentration Injected amount
0 6.39 pmol/µL 12.8 pmol 3.83 pmol/µL 169 fmol
2 3.20 pmol/µL 6.39 pmol 1.92 pmol/µL 84.3 fmol
5 1.28 pmol/µL 2.56 pmol 0.77 pmol/µL 33.7 fmol
10 0.64 pmol/µL 1.28 pmol 0.38 pmol/µL 16.9 fmol
20 0.32 pmol/µL 0.64 pmol 0.19 pmol/µL 8.4 fmol
50 0.13 pmol/µL 0.26 pmol 0.07 pmol/µL 3.2 fmol
100 0.06 pmol/µL 0.13 pmol 0.04 pmol/µL 1.6 fmol
LOD – EXPERIMENTAL SET-UP 2 GLYCAN STANDARDS
Dilution series
Dilution factor
MALDI-TOF-MS Volume 2 µL
CE-ESI-MS Injection volume 44 nL
Concentration Amount used Concentration (addition of LE; 9:1)
Injected amount
1 1000 fmol/µL 2000 fmol 900 fmol/µL 39.6 fmol
10 100 fmol/µL 200 fmol 90 fmol/µL 3.96 fmol
20 50 fmol/µL 100 fmol 45 fmol/µL 1.98 fmol
100 10 fmol/µL 20 fmol 9 fmol/µL 0.396 fmol
200 5 fmol/µL 10 fmol 4.5 fmol/µL 0.198 fmol
1000 1 fmol/µL 2 fmol 0.9 fmol/µL 0.040 fmol
2000 0.5 fmol/µL 1 fmol 0.45 fmol/µL 0.020 fmol
10000 0.1 fmol/µL 0.2 fmol 0.09 fmol/µL 0.004 fmol
CE-ESI-MS with DEN-gas shows a ~100x higher sensitivity compared to MALDI-TOF-MS
26 10/1/201726 Kammeijer, G.S.M. et al. Manuscript in preparation

GLYCAN CHARACTERIZATION
OUTLINE
27
IMPROVING SENSITIVITY
10/1/2017G.S.M. Kammeijer - [email protected]
IMPROVING SEPARATION?

OPTIMIZATIONDYNAMIC NEUTRALLY COATED CAPILLARY
• 10 % AA • 20 % AA • 20 % AA 10 % MeOH
BGE COMPOSITION
• 15˚C• 20˚C• 25˚C
TEMPERATURE COOLANT
VOLTAGE
• 20 kV• 25 kV• 30 kV
28
Flow
• 0 psi• 0.3 psi• 0.5 psi

TPNG PROFILE WITH CE-ESI-MS– NEUTRALS
25 30 35 40 45 50 Time [min]0.0
0.5
1.0
1.5
2.0
x107
Intens.Dynamic Coated Neutral Capillary
Injection: 5 psi 60sec (40 nL)
0
1
2
3x10⁶
Intens.
45 50 55 60 65 70 Time [min]
Static Coated Neutral CapillaryInjection: 1 psi 60sec (9 nL)
29 10/1/201729 Kammeijer, G.S.M. et al. Manuscript in preparation
Static neutrally coated BFS capillary, 90 cm 30µm id, BGE: 10 % AA, capillary coolant: 25°C, voltage: 20 kV, injection sample: 1 psi, 60 sec (9 nL)
Dynamic neutrally coated BFS capillary, 90 cm 30µm id, BGE: 10 % AA, capillary coolant: 25°C, voltage: 20 kV, injection sample: 5 psi, 60 sec (40 nL)

0.0
0.5
1.0
1.5
2.0
x107
Intens.
25 30 35 40 45 50 Time [min]
0
1
2
3x10⁶
Intens.
45 50 55 60 65 70 Time [min]
TPNG PROFILE WITH CE-ESI-MS– NEUTRALS
Dynamic Coated Neutral CapillaryInjection: 5 psi 60sec (40 nL)
Static Coated Neutral CapillaryInjection: 1 psi 60sec (9 nL)
30 10/1/201730 Kammeijer, G.S.M. et al. Manuscript in preparation

ZERO-FLOW PRINCIPLE
10 min
20 min
30 min
50 min
31 10/1/201731 Kammeijer, G.S.M. et al. Manuscript in preparation
0
1
2
3x10⁶
Intens.
0
2
4
6
8
012345
0
2
4
6
01
2
34
5
0 20 40 60 80 100 Time [min]
x106
x106
x106
x106

Time [min]
0
2
4
60.0 61.0 62.0 Time [min]
1
2
3
65.0 66.0 67.0 Time [min]
2
4
71.0 72.0 73.0
1
2
3
80.0 81.0 82.0 Time [min]
1
53.0 54.0 55.0 Time [min]
HIG
H M
AN
NO
SE
0 min
10 min
20 min
30 min
50 min
Time [min]
Time [min]
Time [min]
Time [min]
0.20
0.40
55.0 56.0 57.0
0.00
0.50
1.00
63.5 64.5
0.00
0.25
0.50
0.75
67.5 68.5 69.5 Time [min]
0.00
0.50
1.00
74.0 75.0 76.0
0.00
0.25
0.50
0.75
82.5 83.5 84.5
Inte
nsx
105
Inte
nsx
105
Inte
nsx
105
Inte
nsx
105
Inte
nsx
105
GA
LAC
TOSY
LATI
ON
Time [min]
Time [min]
Time [min]
Time [min]
Time [min]
0.25
0.50
0.75
54.5 55.5 56.5
0.00
1.00
2.00
62.0 63.0 64.0
0.00
0.50
1.00
1.50
67.0 68.0 69.0
0.00
0.50
1.00
1.50
73.5 74.5 75.5
0.00
0.50
1.00
82.0 83.0 84.0
0 min
10 min
20 min
30 min
50 min
Inte
nsx
105
Inte
nsx
105
Inte
nsx
105
Inte
nsx
105
Inte
nsx
105
0 min
10 min
20 min
30 min
50 min
Inte
nsx
104
Inte
nsx
104
Inte
nsx
104
Inte
nsx
104
Inte
nsx
104
VSVS
VS
VS
EFFECT OF “ZERO-FLOW” ON THE SEPARATION OF ISOMERIC N-GLYCANS

EFFECT OF “ZERO-FLOW” ON THE SEPARATION OF ISOMERIC N-GLYCANS
SIA
LYLA
TIO
N
Time [min]
Time [min]
Time [min]
Time [min]
Time [min]
0.0
0.5
1.0
1.5
2.0
62.0 63.0
0.0
2.0
4.0
71.5 72.5
0.0
1.0
2.0
3.0
77.5 78.5
0.0
2.0
4.0
84.5 85.5 86.5
0.0
1.0
2.0
3.0
94.5 95.5 96.5
0 min
10 min
20 min
30 min
50 min
Inte
nsx
106
Inte
nsx
106
Inte
nsx
106
Inte
nsx
106
Inte
nsx
106
Time [min]
Time [min]
Time [min]
Time [min]
Time [min]
0 min
10 min
20 min
30 min
50 min
Inte
nsx
106
Inte
nsx
106
Inte
nsx
106
Inte
nsx
106
Inte
nsx
104
0.00
0.20
0.40
61.5 62.5 63.5
0.00
0.50
1.00
71.0 72.0 73.0
0.00
0.25
0.50
0.75
77.0 78.0 79.0
0.00
0.25
0.50
0.75
84.5 85.5 86.5
0.00
0.20
0.40
94.5 95.5 96.5
VS
BIS
ECTI
ON
/GA
LAC
TOSY
LATI
ON
Time [min]
Time [min]
Time [min]
Time [min]
Time [min]
1
2
3
54.5 55.5 56.5
0
1
2
3
4
5
6
67.5 68.5 69.5
0
1
2
3
4
5
6
67.5 68.5 69.5
0
2
4
6
73.5 74.5 75.5
1
2
3
4
82.5 83.5 84.5
0 min
10 min
20 min
30 min
50 min
Inte
nsx
104
Inte
nsx
104
Inte
nsx
104
Inte
nsx
104
Inte
nsx
104
VS
VS
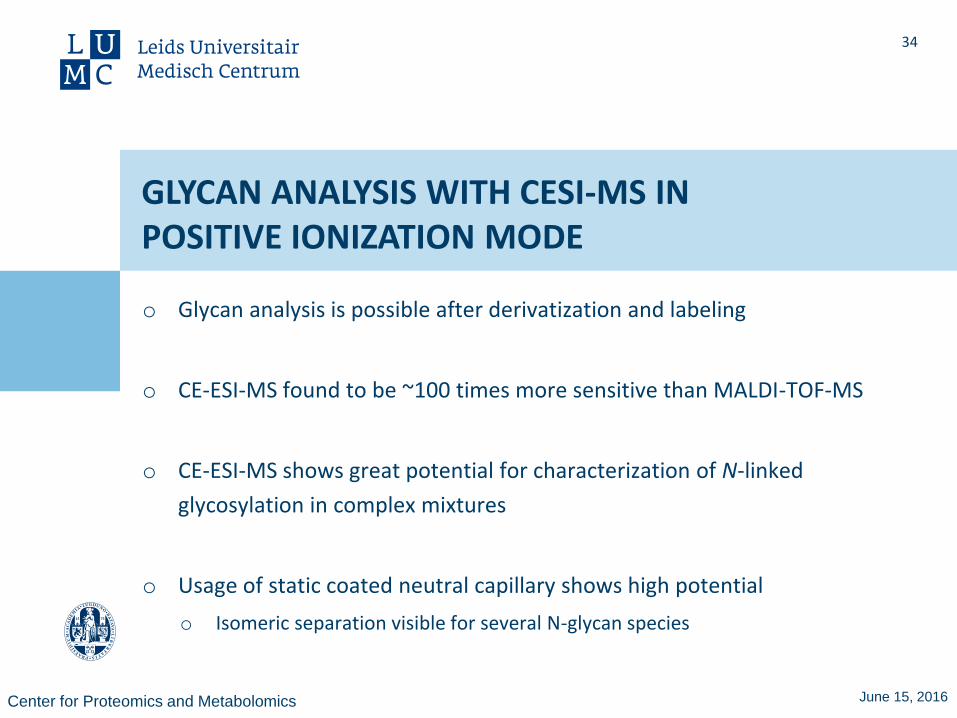
o Glycan analysis is possible after derivatization and labeling
o CE-ESI-MS found to be ~100 times more sensitive than MALDI-TOF-MS
o CE-ESI-MS shows great potential for characterization of N-linked
glycosylation in complex mixtures
o Usage of static coated neutral capillary shows high potential
o Isomeric separation visible for several N-glycan species
GLYCAN ANALYSIS WITH CESI-MS IN POSITIVE IONIZATION MODE
34
Center for Proteomics and Metabolomics June 15, 2016

Characterization of various analytes
o Investigation usage for biopharmaceutical characterization
o Investigate the usage for limited sample amounts
o Further explore the potential of isomeric separation using zero-flow
o Comparison between positive and negative ionization mode
o Investigate different labels
o Identification of the different isomers
PERSPECTIVES
35
ACKNOWLEDGEMENTS
Manfred Wuhrer
Noortje de Haan
Sander Wagt
Pablo Mohaupt
Jan Nouta
Karli Reiding
Gerda Vreeker
Bas Jansen
Ludger Ltd.
Rad Kozak
Daniel Spencer
Richard Gardner
Darryl Fernandes
Center for Proteomics and Metabolomics Department of Chemistry & Chemical Biology
Alexander Ivanov