Isolation, Purification and Characterization of Photosynthetic Membrane Proteins … · ·...
192
Isolation, Purification and Characterization of Photosynthetic Membrane Proteins from Galdieria sulphuraria and Chlamydomonas reinhardtii by Balakumar Thangaraj A Dissertation Presented in Partial Fulfillment of the Requirements for the Degree Doctor of Philosophy Approved November 2010 by the Graduate Supervisory Committee: Petra Fromme, Chair Everett Shock Julian Chen ARIZONA STATE UNIVERSITY December 2010
Transcript of Isolation, Purification and Characterization of Photosynthetic Membrane Proteins … · ·...
Isolation, Purification and Characterization of Photosynthetic Membrane Proteins
from Galdieria sulphuraria and Chlamydomonas reinhardtii
by
Balakumar Thangaraj
A Dissertation Presented in Partial Fulfillment of the Requirements for the Degree
Doctor of Philosophy
Approved November 2010 by the Graduate Supervisory Committee:
Petra Fromme, Chair
Everett Shock Julian Chen
ARIZONA STATE UNIVERSITY
December 2010

i
ABSTRACT
In oxygenic photosynthesis, Photosystem I (PSI) and Photosystem II (PSII) are
two transmembrane protein complexes that catalyze the main step of energy
conversion; the light induced charge separation that drives an electron transfer
reaction across the thylakoid membrane. Current knowledge of the structure of
PSI and PSII is based on three structures: PSI and PSII from the thermophilic
cyanobacterium Thermosynechococcus elonagatus and the PSI/light harvesting
complex I (PSI-LHCI) of the plant, Pisum sativum. To improve the knowledge of
these important membrane protein complexes from a wider spectrum of
photosynthetic organisms, photosynthetic apparatus of the thermo-acidophilic red
alga, Galdieria sulphuraria and the green alga, Chlamydomonas reinhardtii were
studied.
Galdieria sulphuraria grows in extreme habitats such as hot sulfur springs
with pH values from 0 to 4 and temperatures up to 56°C. In this study, both
membrane protein complexes, PSI and PSII were isolated from this organism and
characterized. Ultra-fast fluorescence spectroscopy and electron microscopy
studies of PSI-LHCI supercomplexes illustrate how this organism has adapted to
low light environmental conditions by tightly coupling PSI and LHC, which have
not been observed in any organism so far. This result highlights the importance of
structure-function relationships in different ecosystems. Galdieria sulphuraria
PSII was used as a model protein to show the amenability of integral membrane
proteins to top-down mass spectrometry. G.sulphuraria PSII has been
characterized with unprecedented detail with identification of post translational

ii
modification of all the PSII subunits. This study is a technology advancement
paving the way for the usage of top-down mass spectrometry for characterization
of other large integral membrane proteins.
The green alga, Chlamydomonas reinhardtii is widely used as a model for
eukaryotic photosynthesis and results from this organism can be extrapolated to
other eukaryotes, especially agricultural crops. Structural and functional studies
on the PSI-LHCI complex of C.reinhardtii grown under high salt conditions were
studied using ultra-fast fluorescence spectroscopy, circular dichroism and
MALDI-TOF. Results revealed that pigment-pigment interactions in light
harvesting complexes are disrupted and the acceptor side (ferredoxin docking
side) is damaged under high salt conditions.

iii
To my beloved parents, Saroja and Thanagaraj To my lovable and supportive wife Kaviya
iv
ACKNOWLEDGEMENTS
This work would not have been possible without the assistance of a number of
people at Arizona State University and elsewhere. I would like to express my
gratitude to all those who assisted and supported me during my doctoral studies.
First and foremost, I would like to thank my advisor, Dr. Petra Fromme for the
opportunity to conduct my doctorial study under her, for the encouragement,
guidance, understanding, patience and support she has given, and for freely
sharing her knowledge and wisdom with me. Her mentorship was paramount in
providing me a well rounded experience consistent with my long-term career
goals. She encouraged me to not only grow as an experimentalist but also as an
independent thinker. She has been a great mentor and above all, a great human
being.
To my committee members, Drs. Everett Shock and Julian Chen, for their advice,
knowledge, expertise and approval of this document.
To Dr. Raimund Fromme, for knowledge sharing and it’s great fun to work with.
To Dr. Ingo Grotjohann, for always so accessible and provide guidance.
To Drs. Rajagopal Subramanyam, Devendra Chauhan and Christopher Vanselow
for their advice, colloboration and friendship.
To the entire Fromme group, for the camaraderie, support, help and the
environment.
To Dr. Craig Jolley, Dr. Iosifina Sarrou and Mike Vaughn, for their scientific
knowledge, help and support.

v
To Dr. Julian Whitelegge, for his support, mentiorship, advice and
encouragement.
To National Institutes of Health, for financial support (NIH 01 GM71619-01) of
this work.
vi
TABLE OF CONTENTS
Page
LIST OF TABLES………………………………………………………………..xi
LIST OF FIGURES……………………………………………………………...xii
LIST OF ABBREVIATIONS……………………………………………………xv
CHAPTER
INTRODUCTION………………………………………………………….. .1
Photosynthesis……………………………………………………………..1
Light (oxygenic photosynthesis) and dark (Calvin cycle reactions)………1
Origin of photosynthesis………………………………………………......3
Reaction center types……………………………………………………...4
Oxygenic photosynthesis………………………………………………….4
Photosystem II…………………………………………………………….8
Electron transport chain………………………………………….12
Light harvesting antenna – phycobilisomes……………………...14
Photosystem I…………………………………………………………….16
Electron transport chain………………………………………….19
Eukaryotic PSI…………………………………………………………...20
The red alga, Galdieria sulphuraria .........................................................24
2 ISOLATION AND PURIFICATION OF PHOTOSYSTEM I AND
PHOTOSYSTEM II FROM GALDIERIA SULPHURARIA ………….28
Introduction………………………………………………………………28
Photosystem I…………………………………………………….28
vii
CHAPTER Page
Photosystem II…………………………………………………...30
Materials and methods…………………………………………………...32
Galdieria cell culture……………………………………………32
Isolation and purification of PSI and PSII……………………….33
Visible spectrum…………………………………………………35
Galdieria PSI SDS-PAGE……………………………………….36
Synchotron radiation CD spectrum of PSI………………………37
Galdieria PSII SDS-PAGE……………………………………....38
Galdieria PSII oxygen evolving activity………………………...38
Results and discussion…………………………………………………...39
Cell growth and isolation of PSI and PSII……………………….39
Visible spectrum…………………………………………………43
Galdieria PSI SDS-PAGE……………………………………….43
Galdieria PSI synchrotron radiation CD spectrum……………...45
Galdieria PSII SDS-PAGE………………………………………46
Galdieria PSII oxygen evolving activity………………………...47
Conclusion……………………………………………………………….49
3 EFFICIENT LIGHT HARVESTING IN A DARK, HOT, ACIDIC
ENVIRONMENT: STRUCTURE AND FUNCTION OF PSI-LHCI
FROM GALDIERIA SULPHURARIA…………………………………….50
Introduction………………………………………………………………50

viii
CHAPTER Page
Materials and methods…………………………………………………...51
Cell culture, PSI-LHCI isolation and characterization…………..51
Low temperature fluorescence emission spectra………………...52
Differential extinction co-efficient of Galdieria P700…………...52
Dual bean spectrophotometer……………………………………53
Mass spectrometry and data analysis…………………………….53
Electron microscopy and single particle analysis………………..54
Ultrafast fluorescence spectroscopy……………………………..55
Time-correlated single photon counting…………………………56
Results……………………………………………………………………56
Electron microscopy……………………………………………..60
Fluorescence decay kinetics……………………………………..62
Discussion………………………………………………………………..68
4 DATA-DIRECTED TOP-DOWN MASS SPECTROMETRY OF A LARGE
INTEGRAL MEMBRANE PROTEIN COMPLEX: PHOTOSYSTEM II
FROM GALDIERIA SULPHURARIA……………………………………..77
Introduction……………………………………………………………....77
Materials and methods…………………………………………………...79
Cell culture and PSII isolation…………………………………...79
Reverse phase column chromatography…………………………81
High resolution FT-MS mass spectrometry……………………..82
Galdieria genomic annotation…………………………………...84

ix
CHAPTER Page
Experimental design……………………………………………..85
Results……………………………………………………………………85
Chromatographic separation of PSII subunits…………………...85
Large integral membrane subunits………………………………89
Peripheral subunits………………………………………………90
Smaller integral membrane subunits…………………………….97
Discussion………………………………………………………………104
Number of subunits/transmembrane helices……………………104
Post-translational modifications………………………………...105
Peripheral subunits……………………………………………..106
Smaller integral membrane subunits…………………………...111
Conclusion……………………………………………………………...117
5 STRUCTURAL AND FUNCTIONAL CHANGES OF PSI-LHCI
SUPERCOMPLEXES OF CHLAMYDOMONAS REINHARDTII CELLS
GROWN UNDER HIGH SALT CONDITIONS…………………………..119
Introduction……………………………………………………………...119
Salt stress……………………………………………………….120
Materials and methods………………………………………………….122
Chalmydomonas cell culture……………………………………122
Thylakoid isolation………………………………………….…..123
Solubilisation and purification of PSI-LHCI complex…………123
Oxygen uptake and SOD activity measuremtns………………..125
x
CHAPTER Page
SDS denaturing gel electrophoresis & in-gel trypsin digestion...125
MALDI-TOF mass spectrometry and database searches………126
Immunoblot analysis……………………………………………127
Circular dichroism measurements………………………………127
Ultrafast fluorescence spectroscopy……………………………127
Results…………………………………………………………………….129
Sucrose gradient analysis……………………………………….129
Oxygen uptake analysis and anti-oxidant enzyme analysis…….130
Visible CD data analysis………………………………………..132
Salt stress effect on protein content of PSI-LHCI ……………..133
Flouroscence decay kinetics…………………………………....135
Discussion………………………………………………………………...139
6. CONCLUSIONS……………………………………………………………143
REFERENCES…………………………………………………………………149
APPENDIX
A STOCK GROWTH MEDIA SOLUTIONS FOR GALDIERIA
SULPHURARIA………………………………………………………..166
B MS/MS FRAGMENTATION OF LIGHT HARVESTING
COMPLEXES OF (LHCr) OF GALDIERIA
SULPHURARIA……………………………………………….168
C CO-AUTHORS PERMISSION FOR USE THE PUBLISHED ARTICLE
AS CHAPTER 5………………………………………………..173

xi
LIST OF TABLES
Table Page
2-1 Secondary structure analysis of PSI……………………………………..46
2-2 Oxygen evolution activity (µmol O2/mg Chla hr) of photosystem II…..48
3-1 Lhcr peptides of Galdieria identified by LC-MS analysis……………....60
4-1 Average masses of PSII subunits from low resolution LC-MS+………..88
4-2 Monoisotopic massed of PSII subunits from high resolution
Fourier-transform mass spectrometry (FT-MS)………………....92
5-1 Composition of Chlamydomonas growth medium …………………….123
5-2 Trapping lifetimes obtained from ultrafast fluorescence
spectroscopy measurements……………………………………136
xii
LIST OF FIGURES
Figure Page
1-1 Diagram of a chloroplast…………………………………………………..2
1-2 Oxygenic photosynthetic apparatus in thylakoid membrane……………...6
1-3 The “Z-scheme” of oxygenic photosynthesis………………………….….7
1-4 Structure of PSII with assignment of protein subunits and cofactors
with transmembrane helices indicated from the stromal side……..9
1-5 Crystal structure of cyanobacterial PSII dimer
(side view along the membrane plane)………………………..…10
1-6 The electron transfer chain (ETC) of cyanobacterial photosystem II…....13
1-7 Phycobilisome model showing the arrangement of
different phycobiliproteins……………………………………….14
1-8 The absorption spectrum of photosynthetic pigments…………………...15
1-9 Crystal structure of trimeric PSI from thermophilic cyanobacterium
Thermosynechococcus elongatus at 2.5 Å resolution……………17
1-10 Cyanobacterial PSI monomer view from the stromal side (top view)…...18
1-11 Side view of a PSI monomer…………………………………………….19
1-12 The electron transfer chain of PSI……………………………………….20
1-13 Comparison of cyanobacterial and plant PSI-LHCI structures………….23
1-14 Galdieria sulphuraria habitats…………………………………………...25
2-1 Galdieria cell culture in 11 L flasks……………………………………..32
2-2 Bead beater and beads…………………………………………………...34
2-3 Absorption spectra of Galdieria cell culture…………………………….39
xiii
Figure Page
2-4 Anion exchange chromatography of PSI-LHCI and PSII………………..41
2-5 Size exclusion chromatography of PSI-LHCI with absorption
at 280 nm…………………………………………………………42
2-6 Size exclusion chromatography of PSII with absorption at 280 nm……..42
2-7 Absorption spectra of Galdieria PSI-LHCI and PSII
at room temperature……………………………………………...43
2-8 10% SDS-tricine gel of Galdieria PSI-LHCI……………………………44
2-9 Synchotron CD spectrum of Galdieria PSI-LHCI and
Thermosynechococcus elongatus PSI……………………….…...45
2-10 SDS-PAGE of Galdieria PSII…………………………………………...47
3-1 Low temperature fluorescence emission spectra………………………...57
3-2 P-700 extinction co-efficient…………………………………………….58
3-3 Oxidized minus reduced spectra of P700………………………………..59
3-4 Galdieria sulphuraria PSI-LHCI single particle images...........................62
3-5 Representative fluorescence decay-associated spectra (FDAS) for
PSI-LHCI from Galdieria and green alga, Chlamydomonas
reinhardtii at room temperature……………………………….....63
3-6 Representative FDAS of Galdieria PSI-LHCI at 77 K………………….65
3-7 Fluorescence decay-associated spectra obtained by time-correlated
single photon counting (TCSPSC) for Galdieria PSI-LHCI…….68
3-8 Comparison of Galdieria and Chlamydomonas PSI-LHCI projection
maps and global fitting of high resolution plant PSI structure…..71
xiv
Figure Page
4-1 Flow chart summarizing the key steps in non-denaturing PSII
membrane protein purification from Galdieria sulphuraria.........80
4-2 Reverse phase total ion chromatogram elution profile of PSII
from the red algae, Galdieria sulphuraria………………………86
4-3 Top-down mass spectrometry of oxygen evolving complex subunits…...93
4-4 Top-down mass spectrometry of subunit Psb28 (PsbW)………………...95
4-5 Top-down mass spectrometry of Psb27 (PsbZ-like)…………………….96
4-6 Top-down mass spectrometry of small integral membrane subunits…….98
5-1 Separation of PSI-LHCI supercomplexes from solublized thylakoid
membranes by sucrose density centrifugation………………….130
5-2 Oxygen uptake and SOD activity of PSI-LHCI supercomplexes………131
5-3 Visible CD spectra of isolated PSI-LHCI supercomplexes from
control and salt-stresses C.reinhardtii cells…………………….132
5-4 Comparison of SDS-PAGE polypeptide profiles of thyakoids from
C.reinhardtii cells grown under control and
salt-stress conditions……………………………………………133
5-5 SDS-PAGE polypeptide profiles and immunoblotting of PSI-LHCI
supercomplexes from C.reinhardtii cells grown under control
and salt-stress conditions……………………………………….134
5-6 FDAS spectra of Chlamydomonas obtained from ultrafast
fluorescence spectroscopy measurements……………………...138

xv
LIST OF ABBREVIATIONS
Å Angstrom
Abs Absorbance
ADP Adenosine diphosphate
Arabidopsis Arabidopsis thaliana
ATP Adenosine triphosphate
AU Absorbance units
β-DDM n-dodecyl-β-D-maltoside
BLAST Basic Local Alignment and Search Tool
Car Carotenoid
CAD Collision activated dissociation
CD Circular dichroism
Chlamydomonas Chlamydomonas reinhardtii
Cyt b6f Cytochrome b6f
Cyt c6 Cytochrome c6
Da Dalton
DOLOP Database of bacterial lipoproteins
ECD Electron capture dissociation
EM Electron microscopy
ETC Electron transfer chain
ETD Electron transfer dissociation
ExPASy Expert protein analysis system
FA Iron sulfur cluster A
xvi
Fb Iron sulfur cluster B
FX Iron sulfur cluster X
FDAS Fluorescence decay associated spectra
FNR Ferredoxin: NADP+ reductase
FPLC Fast performance liquid chromatography
FT-ICR Fourier transform ion cyclotron resonance
FT-MS Fourier transform mass spectrometry
Galdieria Galdieria sulphuraria
HCD High energy colliosional dissociation
HEPES 4-(2-hydroxyethyl)-1-piperazineethanesulfonic acid
HPLC High performance liquid chromatography
hν Light
IMT Intact mass tags
IsiA Iron stress induced A protein
kDa Kilodalton
LC-MS+ Liquid chromatography/mass spectrometry with fraction
Collector
LC-MS/MS Liquid chromatography with tandem mass spectrometry
LHCI Light harvesting complex I
LHCII Light harvesting complex II
LHCr Light harvesting complex of red algae
LMM Low molecular mass
LTQ Linear trap quadropole

xvii
MALDI-TOF Matriz assisted laster desorption ionization-time of flight
MES 2-(N-morphiline) ethanesulfonic acid
MS Mass spectroscopy
NADP Nicotinamide adenine dinucleotide phosphate
OD Optical density
ORF Open reading frame
PAGE Polyacrylamide gel electrophoresis
PC Plastocyanin
Pea Pisum sativum
PDB Protein data bank
PSI Photosystem I
PSII Photosystem II
RC Reaction center
ROS Reactive oxygen species
SDS Sodium dodecyl sulfate
SOD Superoxide dismutase
Spinach Spinach oleracia
SRCD Synchotron radiation circular dichroism
TCSPC Time-correlated single photon counting
T.elongatus Thermosynechococcus elongatus
TMH Transmembrane helices
TMPD N,N,N,N-tetramethyl-p-phenylenediaminedihydrochloride
1
CHAPTER 1 INTRODUCTION
PHOTOSYNTHESIS
Photosynthesis is one of the most important energy converting biological process
on the Earth (1). By this process, cyanobacteria, algae and plants harvest light
energy from the sun and convert it to chemical energy and this sustains nearly all
living matter. The light energy is captured by pigments (chlorophylls and
carotenoids) and is used to convert water and carbon dioxide into energy-rich
organic compounds (simple and complex sugars) with oxygen as a by-product (1).
Hence it is of utmost importance to investigate the basic photosynthetic processes
as they occur in nature.
The overall reaction of photosynthesis can be written as,
6H2O + 6CO2 C6H12O6 + 6O2
Light (oxygenic photosynthesis) and dark (Calvin cycle) reactions
Harvesting and conversion of light energy to chemical energy takes place in
thylakoid membranes of bacteria, algae or plant cells, through an interaction of
several membrane intrinsic and soluble proteins (1). In algae and higher plants,
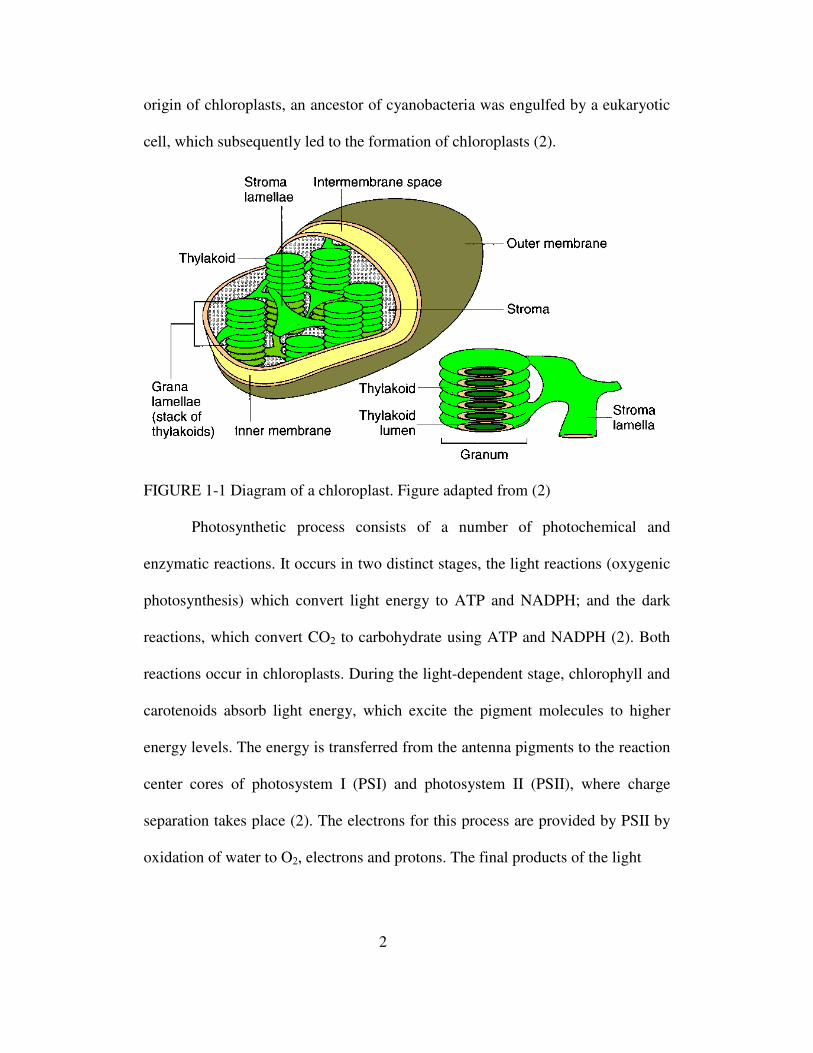
the thylakoid membranes are located in the chloroplast (2) (Fig. 1-1). The
thylakoid membranes can be divided into stacks of membranes called granal
regions and non-stacked membranes called stroma lamellae. The fluid
compartment that surrounds the thylakoids is known as the stroma, and the space
inside the thylakoids is known as the lumen (2). Cyanobacteria are photosynthetic
prokaryotes; hence the thylakoid membranes are located directly in the
cytoplasmic space. According to the endosymbiosis hypothesis explaining the
2
origin of chloroplasts, an ancestor of cyanobacteria was engulfed by a eukaryotic
cell, which subsequently led to the formation of chloroplasts (2).
FIGURE 1-1 Diagram of a chloroplast. Figure adapted from (2)
Photosynthetic process consists of a number of photochemical and
enzymatic reactions. It occurs in two distinct stages, the light reactions (oxygenic
photosynthesis) which convert light energy to ATP and NADPH; and the dark
reactions, which convert CO2 to carbohydrate using ATP and NADPH (2). Both
reactions occur in chloroplasts. During the light-dependent stage, chlorophyll and
carotenoids absorb light energy, which excite the pigment molecules to higher
energy levels. The energy is transferred from the antenna pigments to the reaction
center cores of photosystem I (PSI) and photosystem II (PSII), where charge
separation takes place (2). The electrons for this process are provided by PSII by
oxidation of water to O2, electrons and protons. The final products of the light
3
reactions are the high energy molecules NADPH and ATP and O2 is released as a
by-product.
NADPH and ATP produced during the light reaction, drive the second
stage of reaction, called dark reaction or Calvin cycle, and these reactions does
not require light. During this dark reaction, carbon dioxide reduction to
carbohydrates is fuelled by ATP and NADPH.
6CO2 + 12NADPH + 18ATP C6H12O6 + 12NADP + 18ADP + 6H2O +
18Pi
Origin of photosynthesis
It is generally agreed that anoxygenic photosynthesis evolved prior to oxygenic
photosynthesis, approximately 3.8 billion years ago (3). Anoxygenic
photosynthetic bacteria descendants still can be found today and these include the
purple bacteria, the green sulfur bacteria, the green nonsulfur bacteria and the
heliobacteria. The early anoxygenic photosynthetic organisms might have utilized
easy to oxidize electron sources, such as H2 and H2S (3, 4). However, these
electron sources are limited, such as H2S was available only in environments near
volcanoes. So, photosynthetic organisms had to look for an unlimited, ubiquitous
and stable source of electrons: water. This led to evolution of oxygenic
photosynthesis. The development of oxygenic photosynthesis by current
cyanobacterial ancestors nearly 2.5 billion years ago was one of the significant
events in evolutionary history that would alter the early Earth’s reducing
atmosphere to an oxygenic atmosphere. The first traces of cyanobacterial
ancestors are found in the form of 2.5 billion year old stromatolites, and the

4
oxygen was present in the atmosphere in significant quantities around 2.2 billion
years ago (5-7). Early traces of photosynthetic activity can be detected by the fact
that photosynthetic carbon fixation is slightly more efficient for lighter isotope.
This means that 13C (which accounts for ~ 1% of carbon on Earth) is incorporated
in organic material at a lower rate than the more abundant 12C, and this depletion
of 13C can be taken as an indicator of biological activity (2).
Reaction center types
The photosynthetic reaction centers of photosynthetic organisms may be
classified according to the nature of the final electron acceptors (2): Type I
reaction centers, use iron-sulfur clusters, whereas type II reaction centers utilize
quinone as a final electron acceptor. Purple bacteria and green non sulfur (green
filamentous) bacteria contain type II reaction center. Green sulfur bacteria and
heliobacteria contain a type I reaction center. Cyanobacteria harbor both a type I
reaction center (photoystem I) and a type II reaction center (photosystem II). Only
cyanobacteria, containing both types of RC’s, are capable of photosynthetic
oxygen evolution and all other photosynthetic prokaryotes only conduct
anoxgenic photosynthesis. As mentioned before, red algae, green algae and higher
plants have chloroplasts, which evolved by engulfment of precursor cyanobacteria
(endosymbiosis) into a non-photosynthetic eukaryotic host. So they are capable of
performing oxygenic photosynthesis.
Oxygenic photosynthesis
Oxygenic photosynthesis is catalyzed by four large membrane protein complexes:
photosystem II (PSII), the cytochrome b6f complex (Cyt b6f), photosystem I (PSI)

5
and the ATP synthase (1). Except for an X-ray structure of a complete ATP
synthase which is still lacking, X-ray structures from PSII, PSI and Cyt b6f
complex have been published in recent years (Fig. 1-2).
In oxygenic photosynthesis, PSII uses light energy to extract electrons
from water releasing O2 and protons (8). Plastoquinone (PQ) is the final electron
acceptor in PSII. Upon double reduction it takes up two H+ at the stromal side and
leaves PSII as plastoquinol, migrates in the lipid bilayer, and transfer the electrons
to another membrane bound protein complex, the cytochrome b6f complex,
resulting in the release of two protons into the lumen. In the Cyt b6f complex, the
two-electron oxidation of a reduced quinone (PQH2) does not follow the same
path once they arrive (8). The first electron moves through the high-potential
transfer chain, the Rieske Iron-sulfur protein and Cytochrome f, which are located
on the lumenal side and they mediate this transfer. The second electron move via
the “Q” cycle to to reduce a quinone that is bound at the stromal Qi site.
Following a second reduction event at the Qi site, the two protons are taken up
from the stroma at this site and the reduced quinone is released into the lipid layer
to join the reduced quinone pool. The electron from the Cytochrome f in the Cyt
b6f complex is passed on to PSI by the small soluble electron carrier, plastocyanin
or cytochrome c6 (Cyt c6). Plants use only plastocyanin as the lumenal electron
carrier, while cyanobacteria can also use cytochrome c6 as an electron carrier (9).
Cytochrome c6 represents the more ancient electron carrier and there is evidence
that the Cu2+ containing plastocyanin has replaced Cyt c6
as a response to iron limitation in the ocean. The organism Galdieria sulphuraria

6
FIGURE 1-2 Oxygenic photosynthesis apparatus in thylakoid membrane. The proteins shown and the pdb files used are photosystem II from Thermosynechococcus elongatus (2AXT)(10), the dimer of cytochrome b6f from Mastigocladus laminosus (IVF5)(11), the soluble protein plastocyanin from Synechococcus sp. Pcc7942 (1BXV)(12), cytochrome c6 from Arthrospira
maxima (1F1F)(13), the trimeric complex of photosystem I from Thermosynechococcus elongatus (1JB0)(14), the soluble protein ferredoxin from Anabaena Pcc7119 (1CZP) (15)and the ferredoxin:NADP+ reductase from Anabaena Pcc7119 (1QUE)(16, 17). The final protein, the ATP synthase, is not directly part of the electron transfer chain, but produces ATP from ADP and phosphate using the electrochemical proton gradient generated during electron transfer. Whereas all the other models have been derived from cyanobacterial sources, we used the model of the bovine mitochondrial F1-ATPase (1H8E) (18) as placeholder for the membrane-extrinsic CF1 part of the protein. The membrane intrinsic F0 part is even less well characterized, which is indicated by the cartoons. Color coding of cofactors: All chlorophylls are depicted in green, pheophytins in yellow, carotenoids in orange, hemes in red, lipids in brown, FeS clusters, S in yellow, Fe in red. Figure adapted from (1).
the red algae, used in this study has only Cyt c6, as the sole electron carrier. It
does not contain a gene for plastocyanin (9).
PSI catalyzes the second step of the light reactions by capturing light
energy with a large antenna system of 96 Chl a and 22 carotene molecules,
funneling the exciton to two chlorophylls in the center of the complex, P700 (14).
The excitation energy is used to drive electrons against a potential gradient
through a series of redox carriers from the inner (lumenal) side of the thylakoid
7
membrane to ferredoxin/flavodoxin on the cytoplasmic (stromal) side. Ferredoxin
transfers electrons to FNR (ferredoxin: NADP+oxidoreductase), which in turn
reduces NADP+ to NADPH (nicotinamide adenine dinucleotide phosphate). The
electron transfer reactions are coupled to the transfer of protons from the stromal
to lumenal side of the membrane and electrochemical potential drives the
synthesis of ATP by ATP synthase.
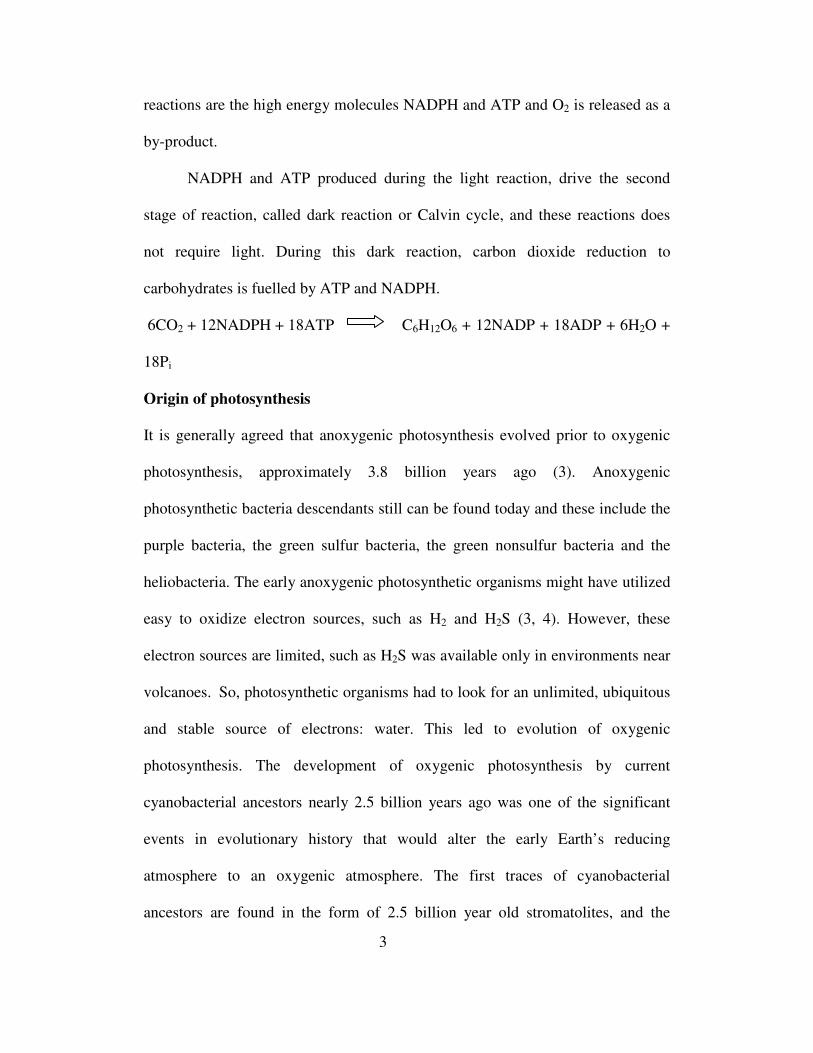
FIGURE 1-3 The “Z-scheme” of oxygenic photosynthesis. Electrons transfer is driven by light excitation of P680 and P700 of PSI and PSII, respectively; other transfer steps involve a decrease in energy and are spontaneous. The electron transfer chain in PSII consist of the oxygen evolving complex (OEC), a tyrosine reside (Z), the primary donor P680, a pheophytin (Ph), and two quinones (QA and QB). The mobile plastoquinone (Qp) upon double reduction carries the electron to cytochrome b6f (cyt b6f Fe-SR), from where it is delivered to plastocyanin (PC) or Cytochrome c6 (Cyt c). In PSI, the charge separation is driven by P700 excitation and the electron is transferred to Chlorophyll A0, plastoquinone A1 and three iron-sulfur clusters (Fx, FA and FB) are shown. The electron is passed to ferredoxin (Fd) from FB upon subsequent docking of 2 Fd molecules, then to ferredoxin-NADP+ reductase (FNR) and finally to NADP+. Figure adapted from (2).
8
A summary of the sequence of these events in oxygenic photosynthesis is referred
to as the “Z” scheme, because of its characteristics sideways “Z”-shape (Fig. 1-3).
Vertical increase in redox potential is associated with the light-driven steps,
whereas the other electron transfer steps involve a decrease in redox potential and
occur spontaneously.
PHOTOSYSTEM II
Photosystem II component of the chloroplast/cyanobacterial photosynthetic
apparatus is a large transmembrane protein/cofactor complex that utilizes light
energy to oxidize water to molecular oxygen and to reduce membrane diffusible
plastoquinone to plastoquinol. The latest crystal structure of PSII from
Thermosynechoccoccus elonagatus reveals that each PSII monomer consists of 20
protein subunits, 35 chlorophyll a molecules, 12 beta-carotene molecules, 2
pheophytin molecules, 3 plastoquinone, 2 heme, 1 bi-carbonate, 25 lipids and a
Mn4CaCl cluster (Figs. 1-4 and 1-5).
The architectural core of PSII consists of a dimer of membrane-spanning
proteins D1 (PsbA) and D2 (PsbD) for PSII, each with five transmembrane α-
helices with a pseudo C2 symmentry axis in the center of each monomer (Fig. 1-
4). The core resembles the purple bacteria reaction center. The primary
electron/proton transfer cofactors are bound to these two proteins. Additionally,
D1 provides ligands to the catalytic site of water oxidation, consisting of four
manganeses, one calcium and one chloride ion. The D1 protein has to be replaced
every 30 minutes in plants in bright sunlight. This is caused by the cationic radical
9
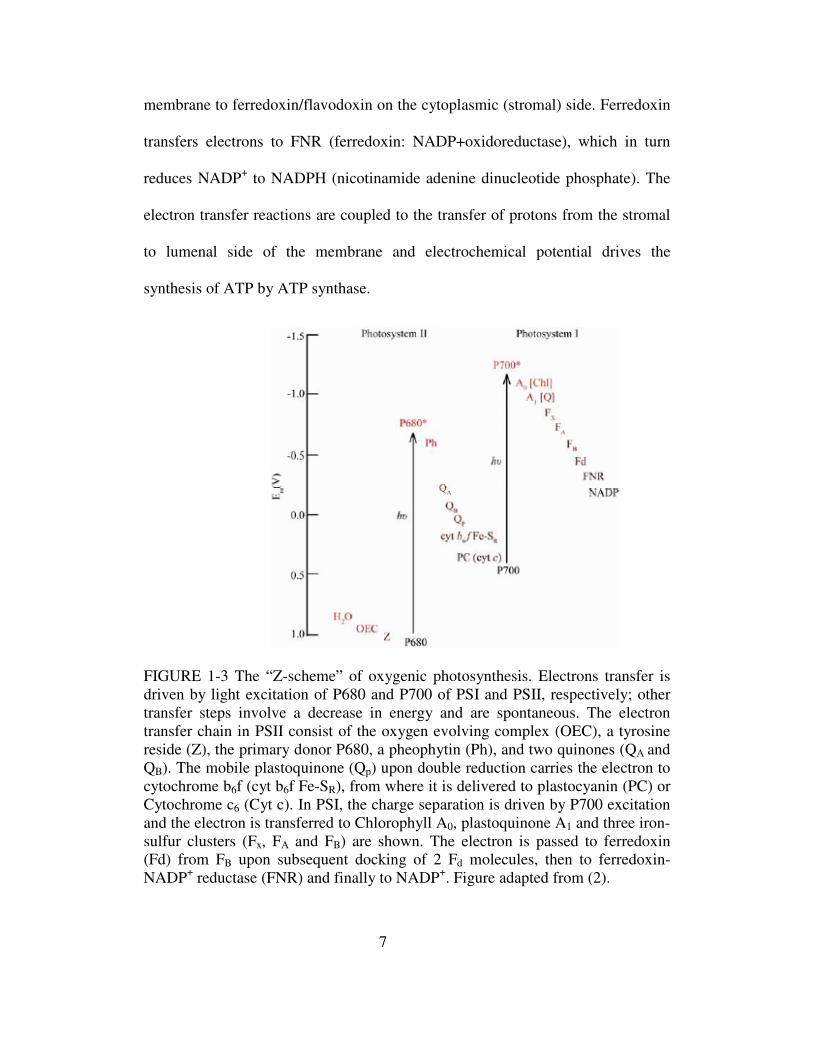
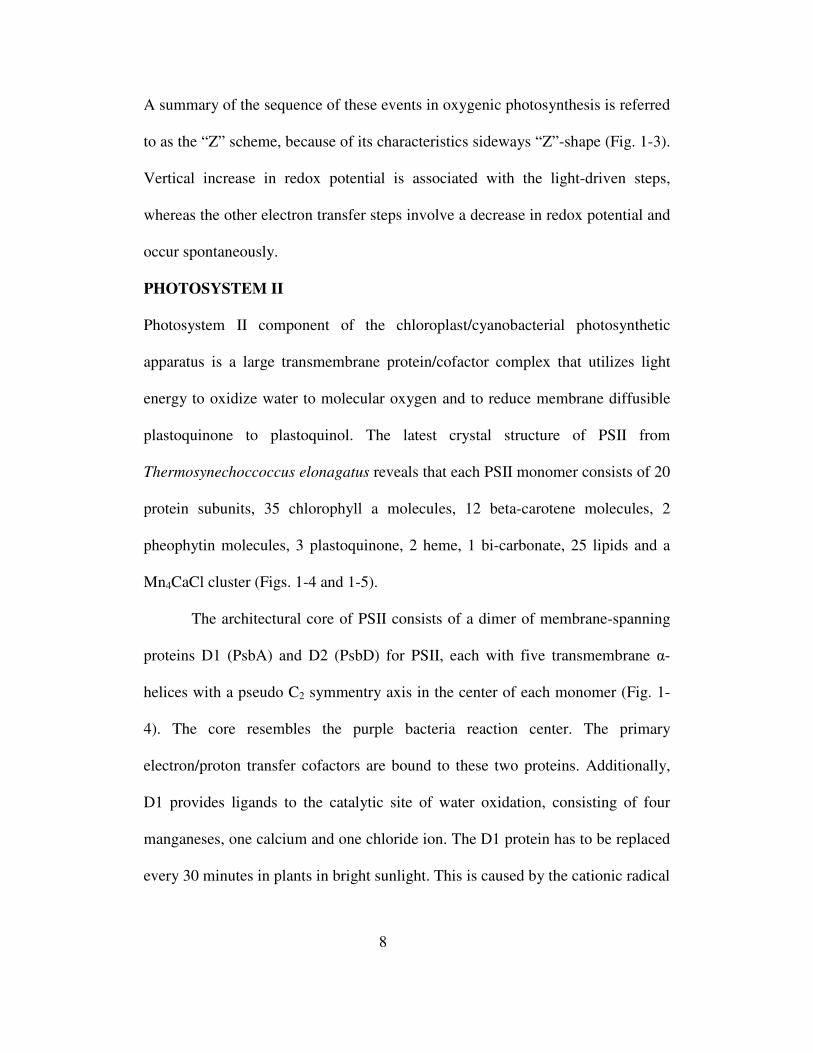
FIGURE 1-4. Structure of PSII with assignment of protein subunits and cofactors with transmembrane helices indicated from the stromal side. The monomer-monomer interface is indicated by a black dashed line and the noncystallographic C2 axis relating the two monomers as a black ellipse (center). Helical parts are shown as cylinders and the subunits D1/PsbA (yellow), D2/PsbD (orange), CP43/PsbC (magenta), CP47/PsbB (red), cyt b-559 (cyan, subunits a/PsbE and b/PsbF) and the remaining eleven small subunits (gray) are labeled in monomer I. In monomer II, the five TMHs of D1 and D2 are labeled a to e and the six TMHs in CP43 and CP47 are labeled a to f. Cofactors are shown in stick mode; monomer I shows Chla (green), Car (orange), heme (blue), Pheo (yellow), PQ (red), the Mn4Ca cluster (red and orange spheres; barely visible) and non-heme iron (blue sphere). Monomer II shows lipids and detergents (yellow). Figure adapted from (19). P680+•, which has the high redox potential of +1.1 V (2). Photodamage might
occur by direct oxidation of the protein by P680+• or by the formation of the
3P680 triplet and highly reactive singlet oxygen, which would lead to irreversible
damage to D1 protein (2). Three genes (PsbA1, PsbA2 and PsbA3) for D1 have
been found in cyanobacterial genomes, and are supposed to be expressed under
different growth conditions (2).
10
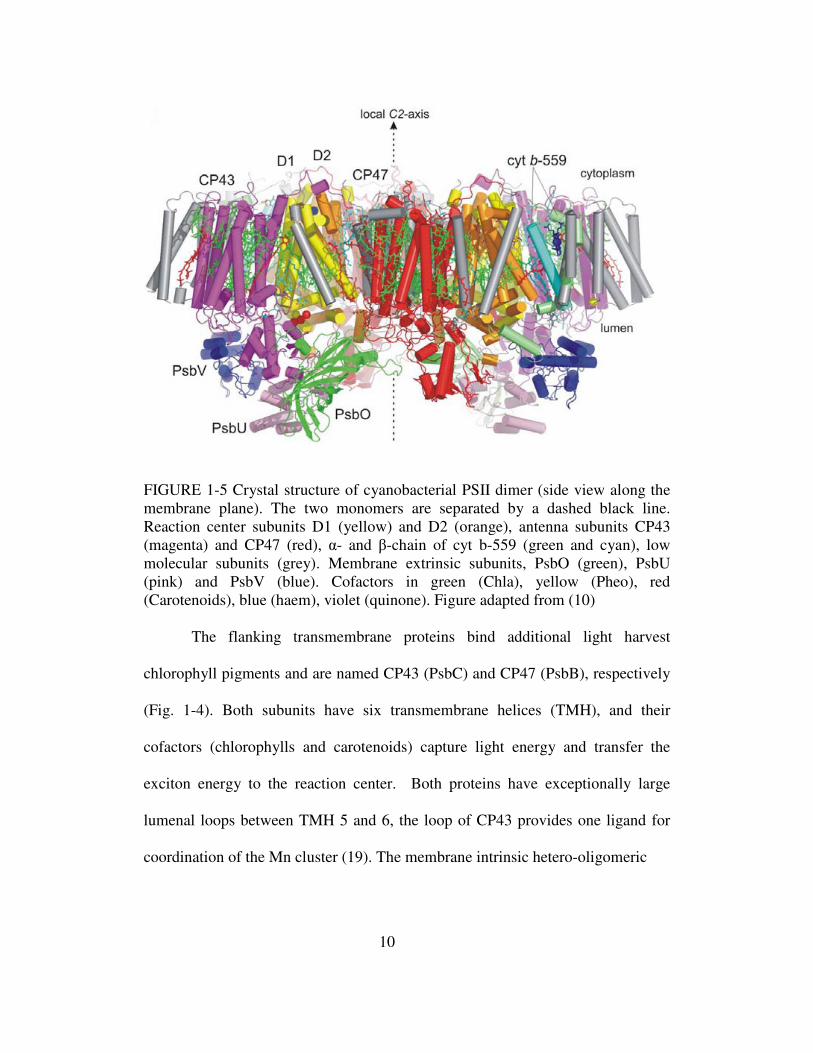
FIGURE 1-5 Crystal structure of cyanobacterial PSII dimer (side view along the membrane plane). The two monomers are separated by a dashed black line. Reaction center subunits D1 (yellow) and D2 (orange), antenna subunits CP43 (magenta) and CP47 (red), α- and β-chain of cyt b-559 (green and cyan), low molecular subunits (grey). Membrane extrinsic subunits, PsbO (green), PsbU (pink) and PsbV (blue). Cofactors in green (Chla), yellow (Pheo), red (Carotenoids), blue (haem), violet (quinone). Figure adapted from (10)
The flanking transmembrane proteins bind additional light harvest
chlorophyll pigments and are named CP43 (PsbC) and CP47 (PsbB), respectively
(Fig. 1-4). Both subunits have six transmembrane helices (TMH), and their
cofactors (chlorophylls and carotenoids) capture light energy and transfer the
exciton energy to the reaction center. Both proteins have exceptionally large
lumenal loops between TMH 5 and 6, the loop of CP43 provides one ligand for
coordination of the Mn cluster (19). The membrane intrinsic hetero-oligomeric

11
cytochrome b559 has two subunits, α (PsbE) and β (PsbF). Each subunit has one
single TMH each providing its single histidine as ligand to the heme group of the
cytochrome.
Apart from these subunits, PSII consist of several small subunits called
low molecular mass (LMM) subunits (PsbH, PsbI, PsbJ, PsbK, PsbL, PsbM,
PsbN, PsbT, PsbX, PsbY and PsbZ) (Fig. 1-4). Most of the LMM subunits consist
of one single transmembrane spanning α-helix and are located peripheral to the
central core. The sequences for these small subunits are only moderately
conserved among photosynthetic organisms (20). Deletion mutations of these
LMM subunits from both prokaryotic and eukaryotic model systems are
compared in order to understand the function of these subunits. From these
comparisons, it seems that the majority are involved in stabilization, assembly or
dimerization of the PSII complex. These small subunits may facilitate fast
dynamic conformational changes that the PSII complex needs to perform an
optimal photosynthetic activity and they facilitate during D1 repair (20).
Of the 20 subunits present in cyanobacterial PSII, three subunits (PsbO,
PsbU, and PsbV) are located outside the membrane, on the lumenal side of PSII
(Fig. 1-5). The extrinsic subunits stabilize the lumenal hump of PSII. PsbO
subunit is present in PSII of all photosynthetic organisms. In the PSII X-ray
structures, PsbO was identified as a β-barrel structure and is involved in the
stabilization of the Mn-cluster (1). Other extrinsic subunits of cyanobacteria are
PsbU and PsbV. The subunit PsbU is located at the periphery of the lumenal
hump and may further stabilize the complex. PsbV (Cyt c550) is located at the side

12
of the lumenal hump and it contains a heme whose function is not known at this
time. However, because of the strong sequence homology between PsbV and
cytochrome c6, a lumenal electron donor to photosystem I in cyanobacteria and
some algae, it is possible that Cyt c550 may be the original ancestor electron donor
to the nonoxygenic ancestor of PSII that has been trapped and made an extrinsic
subunit of PSII for the stabilization of the oxygen evolving complex (21).
In higher plants and green algae, PsbU and PsbV subunits are replaced by
PsbP and PsbQ (1). However, in red algae, the extrinsic subunits composition is
heterogenous. They contain a combination of subunits present in both
cyanobacteria and higher plants and extrinsic subunit compositions differ between
individual species of red algae. For example, Cyanidium caldarium has extrinsic
subunits PsbO, PsbU and PsbV. Along with these subunits, there is special
subunit, PsbQ′ which is known to be present only in this organism (22). Similarly,
Cyanidioschzyom merolae has extrinsic subunits, PsbO, PsbU, PsbP and PsbQ
(22). It will be of great interest to know the extrinsic subunits in other red algae
and it is a current hot topic of research.
Electron transfer chain
The electron transfer chain of PSII consists of four chlorophyll a (Chla), two
pheophytins, two PQs, one redox active tyrosine TyrZ and the Mn cluster (Fig. 1-
6). During photosynthesis, the harvested light is transferred to the center of the
PSII where it excites the P680 (termed as P680 for the maximum absorbance
change at 680 nm) to P680*, inducing P680* to transfer the electron to
pheophytin, leaving P680 as a radical, P680•+ (1). This radical is one of the most

13
FIGURE 1-6 The electron transfer chain (ETC) of cyanobacterial photosystem II (PSII). Chlorophylls are shown in dark green, pheophytins in yellow, and plastoquinones in white. The redox-active TyrZ is drawn in red, while the symmetrically related, non-redox-active TyrD is drawn in blue. Within the Oxygen-evolving complex (OEC), Calcium is drawn in cyan, while the 4 Mn atoms are shown in magenta. It is not clear at this time whether only P1 and P2 or also P3 and P4 participate in formation of the P680•+ state. However, spectroscopic evidence suggests that the various oxidation states of the primary donor may be predominantly localized on different chlorophyll molecules. Although P680* may be distributed over all 4 chlorophylls, the triplet state 3P680 may be located on P3(23), and P680, and the cationic radical P680・+ is suggested by evidence to be localized to P1. Drawn using Chimera, using coordinates from the deposited structure 2AXT(10).
oxidizing species found in nature. A nearby tyrosine residue, the redox-active
TyrZ, rereduces, P680•+ and is itself re-reduced by an electron from the OEC,
which has been extracted by the OEC from water (1). From the D1 bound
pheophytin, the electron is passed to PQA, and then to PQB which subsequently
leaves PSII as PQH2 (plastoquinol) after two electron transfer events and the

14
uptake of two protons from the stromal side of the membrane. The resulting
plastoquinol molecule is then released into a membrane-diffusing plastoquinol
pool that feeds electrons into a separate membrane protein the cytochrome b6f
complex. An oxidized plastoquinone from the PQ pool enters the PQB binding site
to begin a new 2 electron ‘acceptor side” cycle. Although there is little doubt in
the electron transfer chain and the co-factors involved in it, the structural
information on the Mn cluster is not sufficient enough to determine the exact
position of Mn ions and the water splitting mechanism, which is under active
investigation.
Light harvesting antenna - phycobilisomes
Along with the internal chlorophyll antenna system for light harvesting,
cyanobacterial PSII uses a membrane extrinsic anternna, the phycobilisomes for
light harvesting (Fig. 1-7).
FIGURE 1-7 Phycobilisome model showing the arrangement of different phycobiliproteins: The core is made of allophycyanin from which several rods are originating made of disks of phycocyanin and phycoerythrin proteins. Note that most cyanobacteria and the red algae, Galdieria sulphuraria used in this study do not contain phycoerythrin. Figure adapted from (2)

15
The phycobilisomes are extra-membraneous antenna complexes located on the
stromal side of PSII. They are hemispheric or hemivoid shape and are present in
cyanobacteria and red algae (2). This complex contains two or three types of
pigment-proteins known as biliproteins, and these proteins are linked together by
linker proteins. Phycoerythrin, phycocyanin and allophycocyanin are the different
types of biliproteins and they differ in protein identity, chromophore type and
attachment and also in their relative location in the phycobilisome complex. The
phycobilisome absorbs light across the ~ 590 – 650 nm range of the solar
FIGURE 1-8 The absorption spectrum of photosynthetic pigments. Adapted from
(24)

16
spectrum a region neither chlorophyll nor carotenoids are capable of absorbing
light (Fig. 1-8). An organism with phycobilisome has greater accessibility to
usable light within the visible spectrum and hence greater adaptability and light
capturing capacity (2).
PHOTOSYSTEM I
Photosystem I catalyzes the electron transfer from plastocyanin/Cyt c6 on the
lumenal side of the thylakoid membrane to ferredoxin/flavodoxin on the stromal
side by a chain of electron carriers (1). It is the largest and most complex
membrane protein for which a structure has been determined. The 2.5 Å structure
of cyanobacteria PSI-trimer reveals that each PSI monomer consists of 12 protein
subunits, to which 127 cofactors are non-covalently bound: one functional unit of
PSI contains 96 chlorophyll-a molecules, 22 carotenoids, 3 Fe4-S4 clusters and 2
phylloquinones (Fig. 1-9).
The membrane-intrinsic part of PSI has two large dominant
subunits, PsaA and PsaB (Fig. 1-10). These subunits coordinate the organic
cofactors of the ETC and the majority of PSI’s light harvesting pigments. PsaA
and PsaB are characterized by a very similar eleven-transmembrane helix
topology and their sequences are ~ 44% identical. It is generally assumed that PSI
evolved from a homodimeric reaction center as seen in green sulfur bacteria or
heliobacteria (2). The remains of the original homodimeric organization can be
seen in the similarity of PsaA and PsaB, especially in the components of the ETC
(Fig. 1-12).

17
FIGURE 1-9 Crystal structure of trimeric PSI from thermophilic cyanobacterium Thermosynechococcus elongatus at 2.5 Å resolution Color code of extrinsic subunits, PsaC- Magenta; PsaD-Light blue; PsaE – turquoise. (view from the stromal side). Figure adapted from (14) Some of the subunits of PSI, peripheral to the core subunits PsaA/B play an
important structural role. The subunit, PsaL helps in the formation the
trimerization of PSI monomers (Fig. 1-10). This region of PSI is significantly
changed in eukaryotic PSI, which does not form trimers (Fig. 1-13). PsaF is
thought to interact with peripheral light-harvesting proteins in both cyanobacteria
and plants. Other smaller membrane-intrinsic subunits, PsaI (magenta), PsaJ
(green), PsaK (grey), PsaM (orange) and PsaX (pink) coordinate pigments and
stabilize the antenna complexes of PSI.

18
FIGURE 1-10 Cyanobacterial PSI monomer view from the stromal side (top view). Alpha helices are shown as cylinders. Solvent exposed loops have been omitted as well as the extrinsic subunits. Protein is color-coded by subunit; TM helices of PsaA and PsaB are labeled with letters a through j. Organic cofactors of the ETC are sulfur clusters of the ETC are depicted in dark blue (6 chlorophylls and 2 phylooquinone), orange sphere (Fe) and yellow sphere (S). Anternna chlorophyll – yellow, only chlorine head group is shown, phytl chain omitted for clarity; Carotenoids – black; Lipids – light blue. The trimerization axis is marked with a black triangle. Figure adapted from (25).
The three subunits of cyanobacterial PSI - PsaC, PsaD and PsaE are
located outside of the membrane plane, and are referred as the stromal hump (Fig.
1-11). PsaC coordinates the two terminal iron-sulfur clusters FA and FB and its
interactions with the membrane-intrinsic portions of PSI are stabilized by PsaD
and PsaE.
19
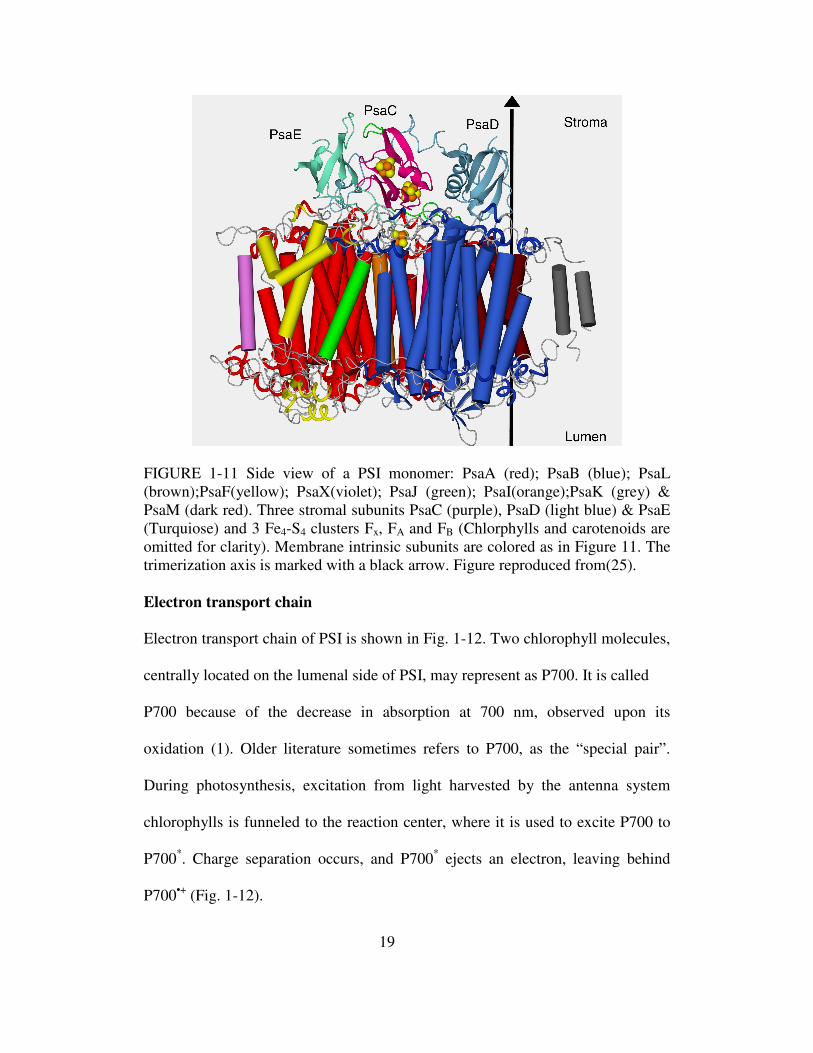
FIGURE 1-11 Side view of a PSI monomer: PsaA (red); PsaB (blue); PsaL (brown);PsaF(yellow); PsaX(violet); PsaJ (green); PsaI(orange);PsaK (grey) & PsaM (dark red). Three stromal subunits PsaC (purple), PsaD (light blue) & PsaE (Turquiose) and 3 Fe4-S4 clusters Fx, FA and FB (Chlorphylls and carotenoids are omitted for clarity). Membrane intrinsic subunits are colored as in Figure 11. The trimerization axis is marked with a black arrow. Figure reproduced from(25). Electron transport chain
Electron transport chain of PSI is shown in Fig. 1-12. Two chlorophyll molecules,
centrally located on the lumenal side of PSI, may represent as P700. It is called
P700 because of the decrease in absorption at 700 nm, observed upon its
oxidation (1). Older literature sometimes refers to P700, as the “special pair”.
During photosynthesis, excitation from light harvested by the antenna system
chlorophylls is funneled to the reaction center, where it is used to excite P700 to
P700*. Charge separation occurs, and P700* ejects an electron, leaving behind
P700•+ (Fig. 1-12).

20
FIGURE 1-12 The electron transfer chain of PSI. Charge separation begins when an exciton is trapped at P700 to P700*. From P700* electron often travel through one of the branches of the electron transfer chain, eventually reaching the terminal iron-sulfur clusters, forming FAFB. Finally, P 700+• is re-reduced by plastocyanin/cytochrome c6 and FB
- is re-oxidized by ferredoxin. Phytol chain from chlorphyll and phylloquinone are omitted for clarity.Figure adapted from (14)
The electron is then transferred up one of the ETC branches to FX, then to FA and
FB and subsequently, from FB out of PSI and on to Ferredoxin. P700+• is re-
reduced by accepting an electron from a lumenal electron carrier.
EUKARYOTIC PSI
The structure and architecture of the core of photosystem I are highly conserved
between cyanobacteria, algae and higher plants. Eukaryotic PSI exists as a
functional monomer instead of as a trimer, as seen in cyanobacteria (26) (Fig. 1-
13). A commonly prevailing idea is that the ancestor of both plants and
cyanobacteria possessed a monomeric reaction center – with cyanobacteria
subsequently forming the trimerized photosystem for greater light harvesting
21
efficiency, whereas in algae and higher plants evolving the attached LHCI
complexes (1). The plant PSI structure shows four LHCI proteins (Lhca1 through
Lhca4) bound to the PSI core. The external antenna system in plants is
asymmentric and heterogenous, and is strongly modified under changing
environmental conditions (e.g. light intensity, light wavelength, environmental
stress). One of the short-term adaptive processes that helps the eukaryotic
photosynthetic machinery respond effectively to changing environmental
conditions is known as state transitions where LHCII moves between PSI and
PSII (2).
The recent structure of the plant PSI-LHCI supercomplex at 3.4 Å
resolution was a significant breakthrough in understanding plant photosynthesis
and also an achievement for structural biology (26, 27) (Fig. 1-13). Crystallized
PSI-LHCI complex (~ 600 kDa) contains 13 protein subunits that traverse the
thylakoid membrane (PsaA, PsaB, PsaF, PsaG, PsaI, PsaJ, PsaK, PsaL and Lhca
1-4) comprising 45 transmembrane helices, 3 stroma exposed subunits (PsaC,
PsaD and PsaE) and 1 lumenal subunit (PsaN). In the structure, 168 chlorophylls,
three Fe4S4 clusters, two phylloquinones and five caroteonids were modeled (27).
Plant PSI-LHCI has a core complex similar to cyanobacteria, but more than a
billion years of separate evolution has shaped some key modifications.
Comparisons between the plant PSI-LHCI structure and cyanobacterial
PSI structure reveals some key differences (28) (Fig. 1-13). Plant PSI lacks PsaM,
which is located at the monomer-monomer interface and PsaX, (present mainly in
thermophilic cyanobacteria), but possesses additional subunits: four LHCI

22
proteins; PsaG, acts as a template for assembly of light harvesting proteins; and
PsaH to prevent trimer formation and interact with light harvesting complex II
(LHCII). Additional subunits, PsaO and PsaP were identified in plants, but they
are not present in the current structure. Other crucial difference exists in the
subunit PsaF. Both in plants and cyanobacteria, PsaF has a fold that is unique
among transmembrane proteins. In addition to its single transmembrane helix,
there is a V-shaped structure formed by a helix that begins at the stromal side,
extends halfway through the membrane, then forms a kink and emerges again on
the stromal side. Given its location on the complex, this V-shaped domain is
probably involved in the interactions between PSI and its external light harvesting
complex I. PsaF posseses a membrane extrinsic region of the lumenal side of PSI.
In cyanobacteria, the N-terminal loop of the PsaF is relatively short, while in
plants this loop is extended by 21 residues (28). In plants, the extended PsaF
contains several positively charged amino acid residues, which matches well with
an acidic patch on plastocyanin, leading to the formation of a more stable PSI-
plastocyanin complex in plants.
The functional significance of the PSI monomer in plants is that the PsaL
interface, which is involved in trimer-maintaining interactions in cyanobacteria,
provides a vital interface for interactions between plant PSI and an additional light
harvesting antenna complex, the LHC II in processes of state transition (28).
Recruiting of LHCII (flexible antenna systems) in higher organisms is vital for
regulating photosynthetic machinery. Plants are exposed to high light intensities
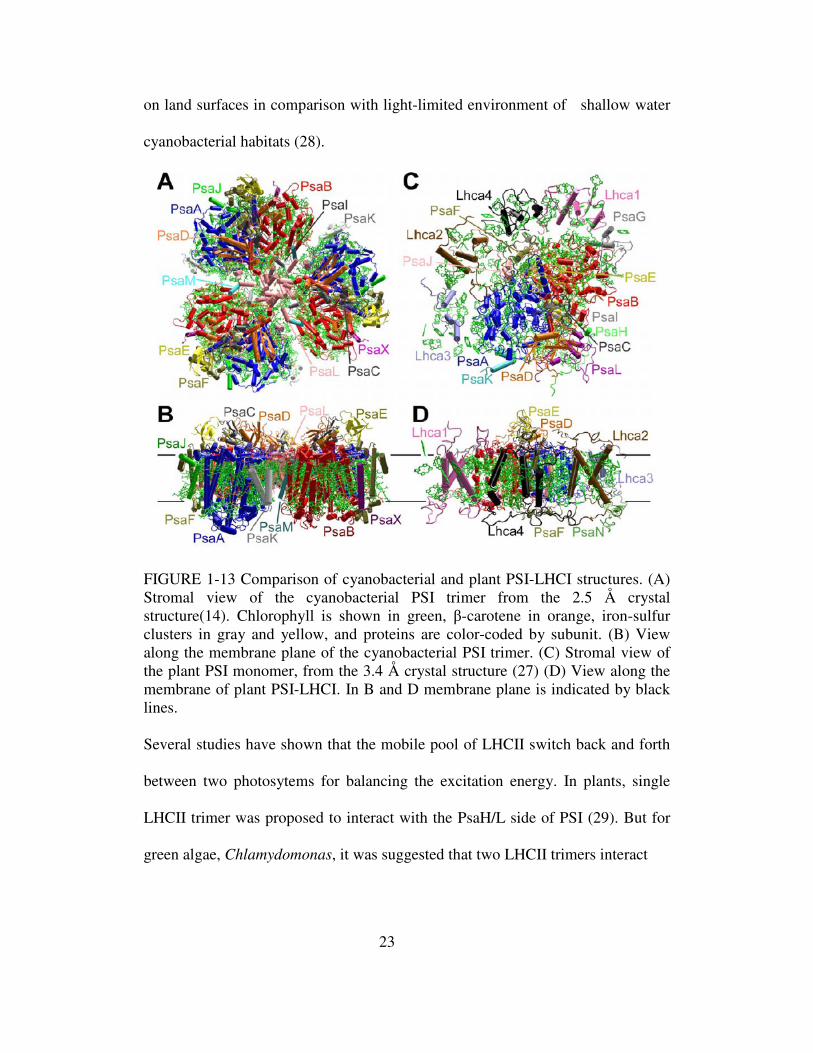
23
on land surfaces in comparison with light-limited environment of shallow water
cyanobacterial habitats (28).
FIGURE 1-13 Comparison of cyanobacterial and plant PSI-LHCI structures. (A) Stromal view of the cyanobacterial PSI trimer from the 2.5 Å crystal structure(14). Chlorophyll is shown in green, β-carotene in orange, iron-sulfur clusters in gray and yellow, and proteins are color-coded by subunit. (B) View along the membrane plane of the cyanobacterial PSI trimer. (C) Stromal view of the plant PSI monomer, from the 3.4 Å crystal structure (27) (D) View along the membrane of plant PSI-LHCI. In B and D membrane plane is indicated by black lines. Several studies have shown that the mobile pool of LHCII switch back and forth
between two photosytems for balancing the excitation energy. In plants, single
LHCII trimer was proposed to interact with the PsaH/L side of PSI (29). But for
green algae, Chlamydomonas, it was suggested that two LHCII trimers interact

24
with PSI-LHCI through three phosphorylated protein linkers (30). So, it is
essential for plant/green algae PSI to adopt a monomeric structure to allow LHCII
to form a proper membrane-mediated interaction with PSI.
THE RED ALGAE, GALDIERIA SULPHURARIA
Red algae are unicellular eukaryotes that are capable of oxygenic photosynthesis.
Galdieria sulphuraria is a thermo-acidophilic red microalga that inhabits extreme
environments (31). It belongs to an ancient group of algae, called the Cyanidiales
(31). Cyanidiales are the principle photosynthetic organisms in hot acid
environments. Prokaryotic cyanobacteria are frequently found in hot
environments such as hot springs. However, cyanobacteria never occur at pH <
4.0. These acidic environments are dominated by eukaryotic red micro-algae, the
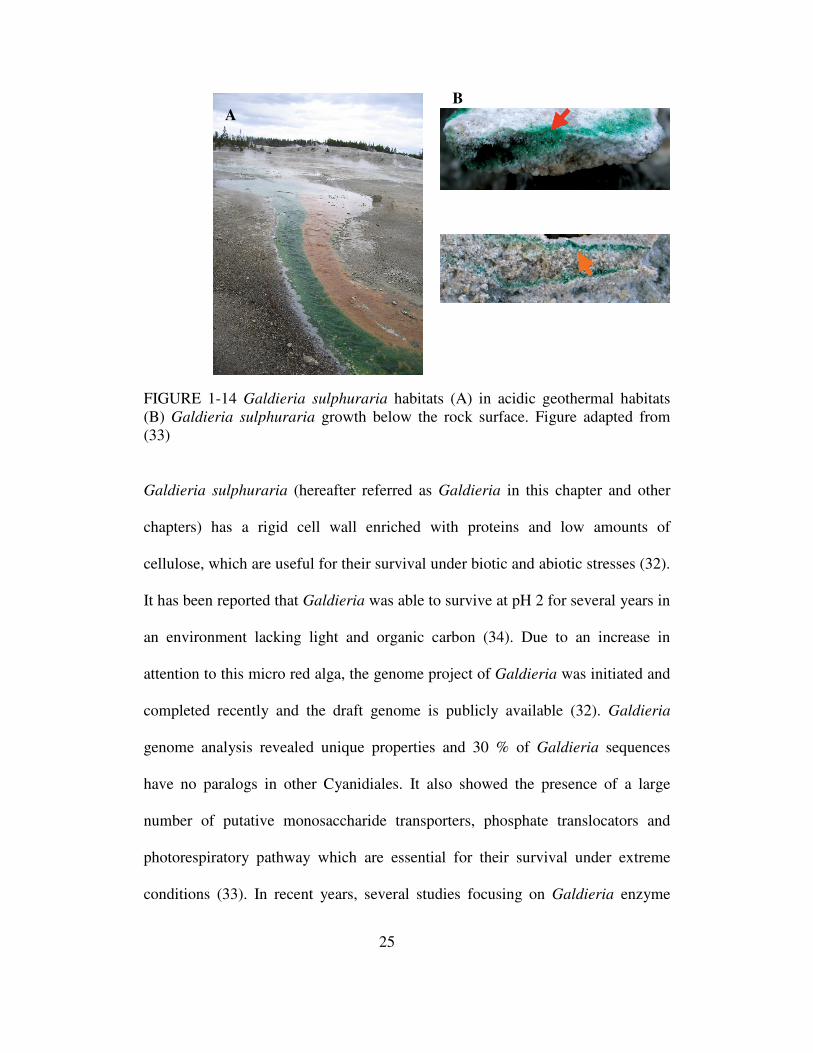
Cyanidiales and these organisms can also grow 3 cm below the rock surface (31)
(Fig. 1-14) . Based on the current taxonomy, Cyanidiales comprises of three
genera (Cyanidium, Cyanidioschyzon and Galdieria) and six species have been
characterized so far: Galdieria sulphuraria, Galdieria partita, Galdieria daedala,
Galdieria maxima, Cyanidium caldarium and Cyanidioschyzon merolae (31).
Among the Cyanidiales, Galdieria sulphuraria is unique, as this alga grows
autotrophically, as well as mixo-./-heterotrophically on a broad range of organic
substrates (50 different carbon sources), propagate by endospores and is tolerant
to high concentration of toxic metal ions (cadmium, mercury, aluminium and
nickel) (32).
25
FIGURE 1-14 Galdieria sulphuraria habitats (A) in acidic geothermal habitats (B) Galdieria sulphuraria growth below the rock surface. Figure adapted from (33)
Galdieria sulphuraria (hereafter referred as Galdieria in this chapter and other
chapters) has a rigid cell wall enriched with proteins and low amounts of
cellulose, which are useful for their survival under biotic and abiotic stresses (32).
It has been reported that Galdieria was able to survive at pH 2 for several years in
an environment lacking light and organic carbon (34). Due to an increase in
attention to this micro red alga, the genome project of Galdieria was initiated and
completed recently and the draft genome is publicly available (32). Galdieria
genome analysis revealed unique properties and 30 % of Galdieria sequences
have no paralogs in other Cyanidiales. It also showed the presence of a large
number of putative monosaccharide transporters, phosphate translocators and
photorespiratory pathway which are essential for their survival under extreme
conditions (33). In recent years, several studies focusing on Galdieria enzyme
A B

26
regulation and its metabolic transporters have been published (34, 35). These
studies used Galdieria as a model organism for rhodophyta and investigated the
position of Galdieria in the scheme of eukaryotic evolution. Because of its
metabolic flexibility and the extreme conditions in which this organism performs
oxygenic photosynthesis, Galdieria would be a highly interesting or a model
candidate for biochemical, structural, functional and evolutionary studies on
photosynthetic proteins. Also, the conditions which Galdieria carries out
photosynthesis are at the high end of the range of this process, making Galdieria
sulphuraria a valuable model for biochemical and biophysical studies on the
photosynthetic apparatus (32).
To start to explore the potential of Galdieria and for gaining deeper
understanding of its photosynthetic machinery, I have initiated the culture of
Galdieria in our lab and isolated the photosynthetic membrane proteins (PSI and
PSII). Most of the work presented in this dissertation in various chapters, focuses
Galdieria sulphuraria and its photosystems, except for chapter 5, which focuses
on PSI-LHCI complex of green algae, Chlamydomonas reinhardtii.
In Chapter 2, growth, isolation and purification of PSI-LHCI and PSII
from the red alga, Galdieria sulphuraria is presented. In chapter 3, the efficient
light harvesting of Galdieria in their dark and acidic habitat, is discussed more
extensively. In Chapter 4, PSII isolated from Galdieria, is characterized by top-
down mass spectrometry. Post-translational modifications for individual PSII
subunits are identified and are discussed. Chapter 5 deals with the isolation of

27
PSI-LHCI complexes from green algae, Chlamydomonas reinhardtii, and their
response to high salt stress conditions.

28
CHAPTER 2 ISOLATION, PURIFICATION AND CHARACTERIZATION
OF PHOTOSYSTEM I AND PHOTOSYSTEM II FROM GALDIERIA
SULPHURARIA
INTRODUCTION
In an evolutionary perspective, the photosynthetic red algae (Rhodophyta) are one
of the most primitive eukaryotic algae, phylogenetically related to prokaryotic
cyanobacteria (31). In red algae, the photosynthetic apparatus appears to be in a
transitional state between cyanobacteria and higher plants (36). Red algal
chloroplasts has an ultrastructure similar to cyanobacteria, however, there is no
differentiation into stacked and unstacked regions as noted in green algae and
higher plants. In terms of photosynthetic membrane proteins they are transitional:
both cyanobacteria and red algae, contain phycobilisomes, as a peripheral light
harvesting antenna for photosystem II (PSII); red algal photosystem I (PSI) has an
intrinsic light harvesting antenna as noted in green algae and higher plant PSI
(refer to chapter 1 for more details).
In Cyanidium caldarium and Cyanidioschyzon merolae, the relative
species of Galdieria, both photosystems (PSI and PSII) have been isolated and
characterized (36-38). In case of Galdieria, there are no experimental studies on
both photosystems.
Photosystem I
In prokaryotes and eukaryotes, the PSI core is similar and has been conserved
over millions of years of evolution (1). However, the system differ significantly in
the oligomeric organization, subunit composition and peripheral antenna systems.
29
Cyanobacterial PSI is a trimer and each monomer consists of 12 highly conserved
subunits (1): PsaA, PsaB, PsaC, PsaD, PsaE, PsaF, PsaI, PsaJ, PsaK, PsaL, PsaM
and PsaX. In green algae and higher plants, PSI is a monomer and contains
peripheral light-harvesting chlorophyll a/b complexes (LHCI), and these light
harvesting complexes are not found in cyanobacteria. PSI is monomeric in green
algae and higher plants and it consist of 13 subunits (1): PsaA, PsaB, PsaC, PsaD,
PsaE, PsaF, PsaG, PsaH, PsaI, PsaJ, PsaK, PsaL, PsaN, PsaO and PsaP. However,
the number of light harvesting proteins between green algae and higher plants
differs: Higher plants (Pisum sativum) has four light harvesting proteins (Lhca 1-
4), whereas in green algae (Chlamydomonas reinhardtii) nine distinctive lhc
proteins are proposed to form the PSI-LHCI supercomplex (28).
Our current knowledge of PSI from Galdieria, depends on a genetic
analysis study in which they analyzed the genes encoding PSI proteins in
Galdieria and compared them to the cyanobacterial and eukayotic PSI complexes
(9). A total of 13 subunits (PsaA, PsaB, PsaC, PsaD, PsaE, PsaF, PsaI, PsaJ,
PsaK, PsaL, PsaM, PsaN and PsaO) have been identified in the Galdieria
sulphuraria genome. This includes the cyanobacterial specific, PsaM subunit as
well as the green algae and higher plant specific subunits, PsaN and PsaO. Along
with subunit identification, this study concluded that Galdieria PSI may represent
a common ancestor of PSI from cyanobacteria, green algae and plants (9). From
an another study, five light harvesting proteins (lhcr1-lhcr5) genes have been
reported to be present in Galdieria genome, of which (lhcr4) has been confirmed
by N-terminal sequencing (39). To confirm the identification of the Galdieria

30
PSI-LHCI subunits and for biochemical and biophysical characterization of this
evolutionary ancestoral PSI-LHCI complex, we purified the PSI-LHCI complex
from Galdieria sulphuraria. Results of our study might provide some insight
about the evolutionary position of this organism in the development of
photosynthetic eukaryotes.
Photosystem II
Photosysem II (PS II) is one of the important enzymes on earth, as this enzyme
has changed our earth atmosphere 2.5 billion years ago from an anoxygenic state
to oxygenic state (1) (refer to chapter 1 for more details).
The extrinsic subunit PsbO (33 kDa) is a common subunit conserved
among cyanobacteria, red algae, green algae and higher plants(1). Apart from
PsbO subunit, plants and green algae contains the PsbP (23 kDa) and PsbQ (17
kDa) extrinsic subunits. In cyanobacteria and red algae, PsbP and PsbQ are
replaced by PsbV cyt c550 (16 kDa) and PsbU (12 kDa) (22). In addition to these,
red algae contains a fourth extrinsic subunit PsbQ' (20 kDa), with their sequence
highly homologous with the PsbQ protein present in green algae and higher
plants. Cross-reconstitution studies demonstrated that the PsbQ' protein from
Cyanidium caldarium is functional in place of PsbQ in green algae and higher
plants, with complete restoration of oxygen evolution (40). In another
reconstitution study, the extrinsic subunits of red algae Cyanidium caldarium
partially restored oxygen evolution in both cyanobacteria and higher plants (41).
Altogether, these studies imply that extrinsic subunits of PSII in red algae might

31
occupy an intermediate position during the evolutionary process of PSII from
cyanobacteria to higher plants (22).
Different genera in Cyanidiales have different extrinsic PSII subunits.
Cyanidium caldarium has PsbO, PsbU, PsbV and PsbQ′ as their extrinsic
subunits, while Cyaniodioschyzon merolae has four different extrinsic subunits -
PsbO, PsbU, PsbP and PsbQ (22). However there is no knowledge about the
extrinsic subunits of PSII in Galdieria. Considering the unique position of
Galdieria among other Cyanidiales, a detailed study on PSII membrane subunits
in general and extrinsic subunits in particular might provide some answers about
the evolution of extrinsic subunits in PSII and would provide a more complete
picture of the PSII extrinsic subunits of all the genera under Cyanidiales.
In the past ten years, there are several articles published on isolation of
PSI and PSII from several photosynthetic organisms (36-38, 42-45). In some of
those articles, procedures are outlined for isolation of partially pure PSI and PSII
membrane proteins, but they involve complex and time consuming sucrose
density gradient centrifugation method, a method not suitable for large scale
purification, an essential prerequisite for protein crystallization studies. Also,
more than one detergent was employed for isolation of these photosynthetic
membrane complexes, which is not favorable for crystallization and structural
studies. In this work, we developed a simple, fast and large scale purification
method, an essential criteria for obtaining large amounts of PSI and PSII for
biochemical, biophysical and crystallization experiments. The method we have
developed, address these issues, by using only one detergent β-DDM (n-dodecyl-

32
β-D-maltoside) and feature a fast performance liquid chromatography for PSI and
PSII purification. Using this method both PSI and PSII are separated by the anion
exchange chromatography step with further purification of PSI and PSII by
separate runs using size exclusion chromatography.
MATERIALS AND METHODS Galdieria cell culture
Galdieria sulphuraria cells were grown at 420 C in 11 L capacity flasks
containing 1X (see appendix A) medium at pH 2, with a constant supply of air, air
and 2% CO2 and illumination at 25 µmol photon m-2 s-1 (Li-cor, model LI-189)
(Fig. 2-1).
FIGURE 2-1 Galdieria cell culture in 11 L flasks.
Cells were monitored frequently by taking absorption spectra of cells (400-800
nm) and optical density of the cells was measured at 730 nm. Light intensity was
increased accordingly with an increase in cell density. The cell cultures were
started either from a cell stock frozen at -800C or by using fresh cells from the

33
previous cell culture. Cells were harvested at regular intervals after they had
reached an optical density of between 1.0 and 1.2 in 12 to 14 days. Cells were
harvested by centrifugation in a Sorvall SLA-1500 rotor (Dupont, Wilmington,
DE) at 2500 rpm (950 x g) for 2 min at 250 C.
Isolation and purification of PSI and PSII
Harvested cells were homogenized in MMCM buffer (20 mM MES pH 6.0, 10
mM CaCl2, 10 mM MgCl2 & 500 mM mannitol) and protease inhibitors (1 mM
PMSF and 1 mM Benzamidine) were added before breaking of cells. For
thylakoid preparation, cells were disrupted by using glass beads (0.5 mm dia) in
beadbeater cell homogenizer (BioSpec products, Inc., OK, USA) (Fig. 2-2). The
beater was spun for for 30 sec for 14 times with a break time of 1 min in between.
Cell suspension along with glass beads were washed with MCM buffer (20 mM
MES pH 6.0, 10 mM CaCl2, 10 mM MgCl2), followed by centrifugation in a
Sorvall SLA-1500 rotor (Dupont, Wilmington, DE) at 14,000 rpm (29806 x g)
for 10 min at 40C to remove unbroken cells and glass beads. Thylakoid
membranes were homogenized with MMGCM buffer (MMCM + 20 % glycerol)
(glycerol was added for the stabilization of PSII) and solubilized in the same
buffer using 1.25 % n-dodecyl–β-D–maltoside (β- DDM) in dark for 20
minutes at room temperature. The solubilized membrane protein detergent
complexes was separated from membrane portions by ultracentrifugation in a
70Ti rotor (Beckman Coulter Inc., Fullerton, CA) at 50,800 rpm (265145 x g) for
90 minutes at 40C.

34
FIGURE 2-2 Bead beater and beads.
All column and chromatography column run was performed under green
light at 40C: Buffer A (20 mM MES pH 6.0, 10 mM CaCl2, 10 mM MgCl2, 20 %
glycerol and 0.02% β-DDM; Buffer B (buffer A + 125 mM MgSO4). The
supernatant obtained from ultracentrifugation was loaded on anion exchange
column (XK26/20, GE health care, NJ, USA) packed with Q-sepharose high
performance (GE health care, NJ, USA), pre equilibrated with 96% buffer A and
4 % buffer B. The column was run at a flow rate of 6 ml/min. After the sample
has been loaded in the column, it was washed with 4 % buffer B to remove
phycobiliproteins in an isocratic mode for 8 min (0.5 column volume), followed
by an increase in salt concentration from 4 to 14 % B in 30 seconds to elude PSI.
A washing step with 14% B was performed for 35 minutes (2.3 column volumes),
PSI was completely eluded of the column and PSI fractions were collected. After
completely washing PSI of the column with 14 % B, the salt concentration was
increased with a second step gradient from 14 % to 27 % B in 30 seconds
followed by an isocratic step at 27% for 30 minutes (2 column volumes) to elude
PSII. Fractions of both PSI and PSII were individually pooled and concentrated
35
using Amicon ultra-15 ultra concentrator (Millipore Corporation, MA) in a
centrifuge (Allegra 25R, Beckman Coulter Inc., Fullerton, CA) in a TS-5.1-500
swinging bucket rotor at 4000 rpm (3401 x g) at 40C. The concentrated samples of
PSI and PSII were further purified separately by size exclusion chromatography
column (XK16/70, GE health care, NJ, USA) filled with Superose 6 material
(Amersham Biosciences, USA). PSI was purified using AKTA FPLC system (GE
healthcare, NJ, USA), whereas PSII was purified using Waters 600E-system
controller (Waters Corporation, Milford, MA) with a flow rate of 1 ml/min. In the
size exclusion column, Buffer C1 (20 mM MES pH 6.0, 10 mM CaCl2, 10 mM
MgCl2, 20 % glycerol and 0.02% β-DDM and 17.5 mM MgSO4) & Buffer C2
(20 mM MES pH 6.0, 10 mM CaCl2, 10 mM MgCl2, 20 % glycerol and 0.02% β-
DDM and 33.75 mM MgSO4) were used for removing impurities of PSI and
PSII, respectively. PSI and PSII fractions were concentrated in Amicon ultra-15,
as mentioned before. Purified proteins were either used directly for experiments
or they are stored in the same buffer in liquid nitrogen for future experiments.
Visible spectrum
Visible spectra of galdieria cells and purified photosystems (PSI and PSII) were
determined at room termperature in a DU 640 spectrophotometer (Beckman
Coulter Inc., Fullerton, CA). Visible spectra were recorded with 0.5 nm step size,
600 nm/min scan speed. The Chla concentration of both photosystem preparations
were determined at room temperature after extraction of chlorophylls in 80%
(v/v) acetone using ɛ(664 – 700) = 76.8 mM-1cm-1 and measuring absorptions at 664
and 700 nm as described in (46).
36
Galdieria PSI SDS-PAGE
A SDS 10% tricine gel was ran in a Bio-Rad cell (Mini Protean Tetra) to
determine protein composition and purity of the Galdieria PSI-LHCI preparation,
according to the procedure outlined in (47). Briefly, the anode running buffer
consists of 100 mM tris base (pH 8.9) and the cathode running buffer consists of
100 mM tris base, 100 mM tricine and 1.0% SDS with no pH adjustment. The gel
contains two parts each with a different density. One was 4% acrylamide
(stacking gel) which is where the samples were loaded while the second was 10%
acrylamide (separating gel). The separating gel is polymerized first and then the
stacking gel is polymerized on top of the separating gel. Purified Galdieria PSI-
LHCI samples were mixed with 3µL of 4x SDS sample buffer (26.7% SDS, 4 mL
H2O, 133 mM Tris pH 8.0, β-mercaptoethanol, 26.7% glycerol, and 133µM
Bromophenol Blue) and denatured on an incubator at 56°C for 15 minutes. As a
reference, PSI crystals from the cyanobacteria Thermosynechococcus elongatus
were also loaded. For this 3µL of crystal suspension was added to 9µL of water.
9µL of this suspension was added to 9 µL of SDS sample buffer. Samples were
then loaded into the wells and run at 50 volts for 30 minutes to cross the stacking
gel. The voltage was increased to 150 volts in order to cross the more dense
stacking gel at for one hour and stained with Coomassie Blue. Galdieria PSI-
LHCI from three different preparations was loaded on to the gel. Precision plus
protein standards (Bio-Rad Laboratories, Inc., CA, USA) were used for
determining the apparent molecular masses.

37
Synchotron radiation CD spectrum of PSI
Circular dichroism (CD) spectroscopy is a valuable tool for secondary structure
analysis of proteins. In recent years, its has been possible to use synchrotrons as
light sources for CD, with the technique being known as Synchrotron Radiation
Circular Dichroism (SRCD) (48). In comparison with conventional CD, SRCD
have several advantages: the flux from a synchrotron light source remains higher
at lower wavelength (which are more sensitive to secondary structure
differences), higher signal to noise ratio (small amounts of material) and less
signal averaging (stronger signal) (49). Synchotron radiation CD spectra (SRCD)
spectra were collected on beamline CD1 at the ISA facility, University of Aarhus,
Denmark. Instrument parameters were set as follows: step size 1nm, averaging
time 2s, wavelength range 280 - 170 nm and temperature 20oC. Samples were
loaded into demountable Quartz SUPRACIL cells (Hellma UK LTD) with optical
pathlengths of 9µm for G. sulphuraria PS I (3mg/ml) and 100 µm for T.
elongatus PS I (0.83 mg/ml). Three replicate scans were averaged and subtracted
from 3 replicate scans of the buffer baseline and the final spectra were calibrated
using a spectrum of camphorsuphonic acid obtained after each beam fill (50).
Data processing was carried out using the CDTool software and the spectra were
analyzed using the DICHROWEB server (51, 52). The final values are the
averaged results from the different secondary structure prediction algorithms
CONTINLL (53) SELCON3 (54) and CDDSTR (55) using dataset SP175 (56).

38
Galdieria PSII SDS-PAGE
Sodium dodecylsulfate polyacrylamide gel electrophoresis (SDS-PAGE) was
done with a SDS-PAGE, Pharmacia Phast system (GE healthcare, NJ, USA) using
precast SDS-HD gels (GE healthcare, NJ, USA). Galdieria PSII samples were
mixed with sample buffer (20 mM Tris/HCl, pH 6.8, 2 mM EDTA, 5 % SDS, 0.2
% DTT) resulting in a Chla concentration of 20 to 60 µM. After incubating the
sample at 56oC for 15 min, 1 µL of the sample was applied per lane. Precision
plus protein standards (Bio-Rad Laboratories, Inc., CA, USA) were used for
determining the apparent molecular masses. After the gel is finished running, it
was rinsed with water and transferred to a setting solution (12.5 %
glutaraldehyde) and allow it to equilibrate in a rocker for 60 minutes. After 60
minutes, the gel was rinsed with water for 5 minutes and transferred to the silver
staining solution (1 % silver nitrate) and equilibrate for 60 minutes in a rocker. As
the solution is light sensitive, the container along with the gel and silver stain
solution is covered with aluminium foil. The gel was washed with water for 5
minutes and transferred to the developer solution (0.25 % formaldehyde, 6.25 %
sodium carbonate). After the appearance of bands and gel is developed
sufficiently, transfer the gel immediately to fixing solution (10 % glycerol, 10 %
acetic acid), so that the gel does not become overdeveloped.
Galdieria PSII oxygen evolving activity
The intactness of manganese cluster can be determined by measuring the oxygen
evolving activity of the isolated PSII from Galdieria. Oxygen evolution
measurements were conducted at room temperature using oxygen electrode

39
(Hansatech Instruments, UK). The electrode was calibrated using air-saturated
and nitrogen saturated water. For oxygen evolution, sample was illuminated with
36 red light emitting diodes. The buffer used contained 100 mM PIPES-NaoH, pH
7.0, 5 mM CaCl2 & 0.03 % β-DDM and sample concentration was diluted to a
chlorophyll concentration of 20 to 50 µM. Artificial electron acceptor (250 mM
benzoquinone in 100 % DMSO) and donor (10 mM potassium ferricyanide in
water) were added along with buffers, for continuous occurrence of water-
splitting reaction. The oxygen activity increased with each stage of PSII
purification and the oxygen activity of the crystals is higher than the published
result, indicating a higher intactness of the Mn cluster in crystals.
RESULTS AND DISCUSSION
Cell growth and isolation of PSI and PSII
Using the current cell growth set up, a cell density of 1.2 OD was obtained within
10 to 12 days and about 60 to 80 g of cells could be harvested from 10 L of
culture (Fig. 2-3).
0.6
0.65
0.7
0.75
0.8
0.85
350 400 450 500 550 600 650 700 750 800Wavelength (nm)
Ab
so
rba
nc
e (
a.u
)
Cell culture
FIGURE 2-3 Absorption spectra of Galdieria cell culture.

40
Similar high cell densities and harvest have been reported previously for
Galdieria cell cultures(57). In comparison with T.elongatus cultures (0.8 g/L), ten
times more cell yield can be obtained (8 g/L) from Galdieria.
The detailed procedure developed for solubilising and purifying PSI and
PSII is described in the materials and methods section. Briefly, thylakoid
membranes were solubilized with 1.25 % β-DDM and the solubilized protein-
detergent complexes were separated from thylakoid membranes by ultra-
centrifugation. Galdieria PSI and PSII were purified by a chromatographic
procedure using Q-sepharose (anion-exchange) in the first step and Superose 6
(size exclusion) in the second step to remove impurities (Figs. 2-4 to 2-6). With
the procedure we had developed, we are able to purify active photosystems within
10 hours starting from the cell breakage.
After extensive optimization, we had developed a step gradient, where PSI
eludes first and PSII eludes second in the same anion exchange column run. In
this procedure, phycobilisomes do not bind to the column and they elude without
contaminating PSI or PSII. Initially, we had thought that the PSI of Galdieria
might not have light harvesting complexes attached to it. But SDS-tricine gel of
purified Galdieria PSI confirmed the presence of LHCI proteins in Galdieria PSI
(Fig. 2-7) (see chapter 3, for ultra-fast fluorescence spectroscopy and mass
spectrometry results of Galdieria PSI-LHCI). Both PSI and PSII was purified
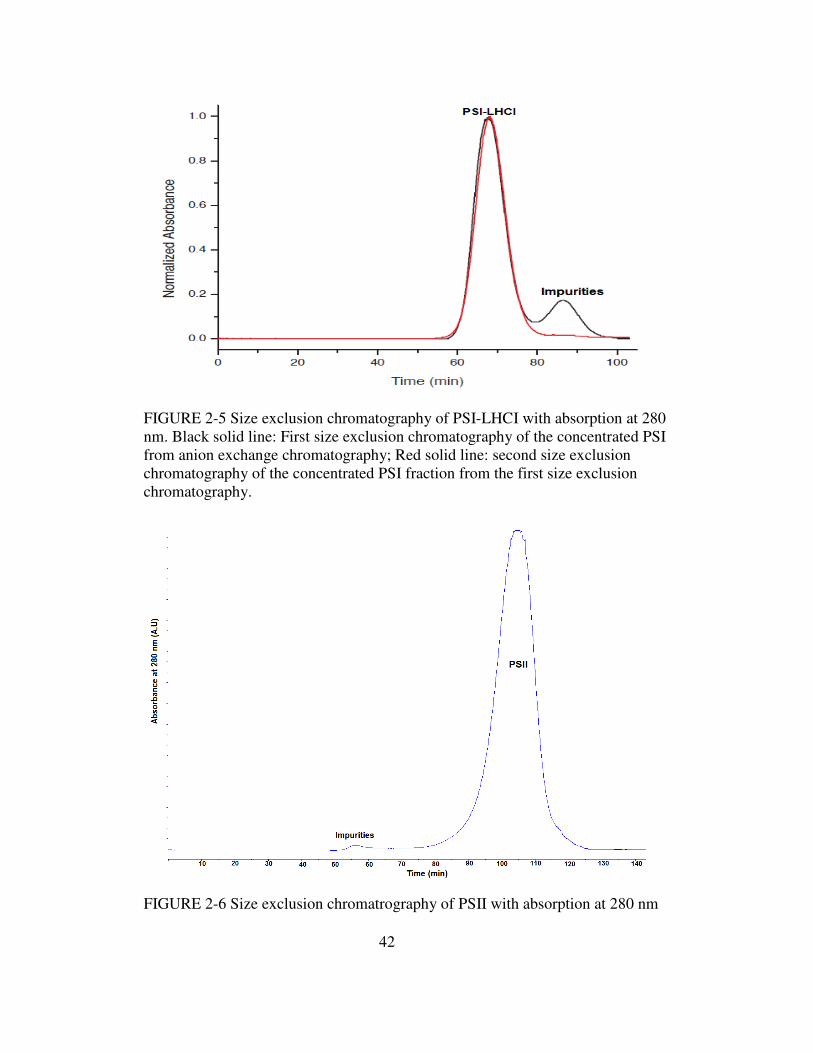
separately by s second column run in a size exclusion chromatography column.
Figure 2-5, shows the size exclusion chromatogram of PSI–LHCI supercomplex.
In the chromatogram there are two peaks: the first peak which eludes at ~ 60
41
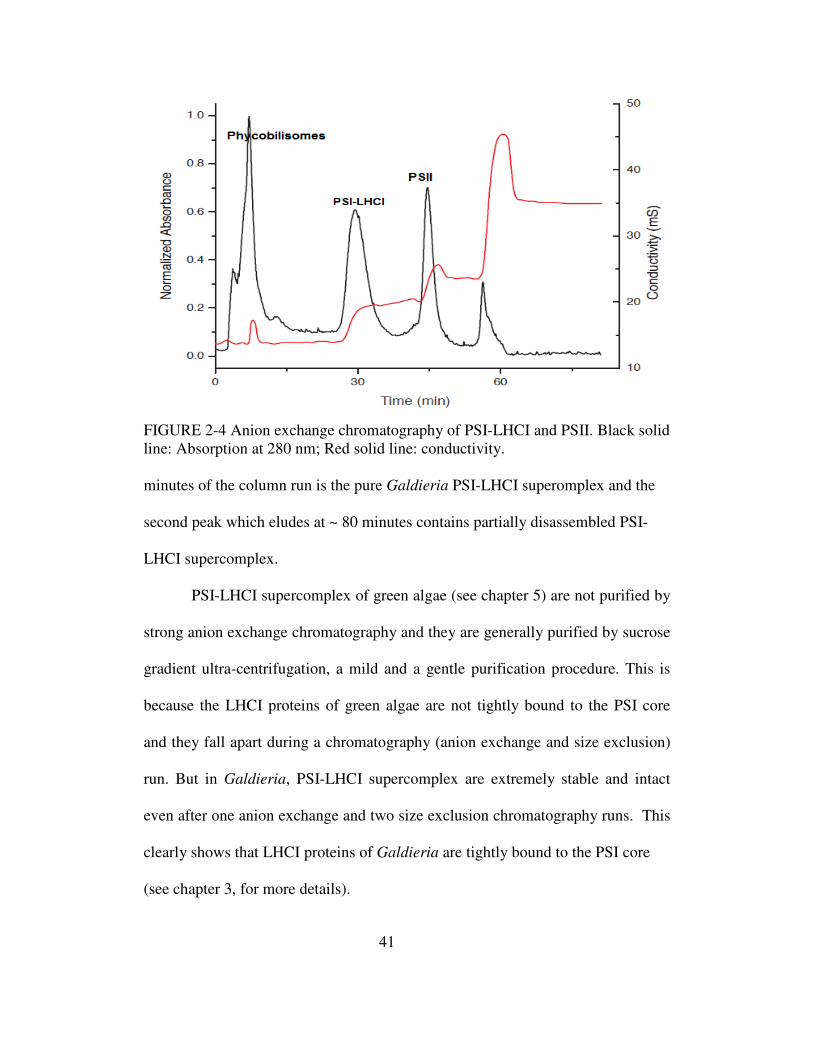
FIGURE 2-4 Anion exchange chromatography of PSI-LHCI and PSII. Black solid line: Absorption at 280 nm; Red solid line: conductivity. minutes of the column run is the pure Galdieria PSI-LHCI superomplex and the
second peak which eludes at ~ 80 minutes contains partially disassembled PSI-
LHCI supercomplex.
PSI-LHCI supercomplex of green algae (see chapter 5) are not purified by
strong anion exchange chromatography and they are generally purified by sucrose
gradient ultra-centrifugation, a mild and a gentle purification procedure. This is
because the LHCI proteins of green algae are not tightly bound to the PSI core
and they fall apart during a chromatography (anion exchange and size exclusion)
run. But in Galdieria, PSI-LHCI supercomplex are extremely stable and intact
even after one anion exchange and two size exclusion chromatography runs. This
clearly shows that LHCI proteins of Galdieria are tightly bound to the PSI core
(see chapter 3, for more details).
42
FIGURE 2-5 Size exclusion chromatography of PSI-LHCI with absorption at 280 nm. Black solid line: First size exclusion chromatography of the concentrated PSI from anion exchange chromatography; Red solid line: second size exclusion chromatography of the concentrated PSI fraction from the first size exclusion chromatography.
FIGURE 2-6 Size exclusion chromatrography of PSII with absorption at 280 nm
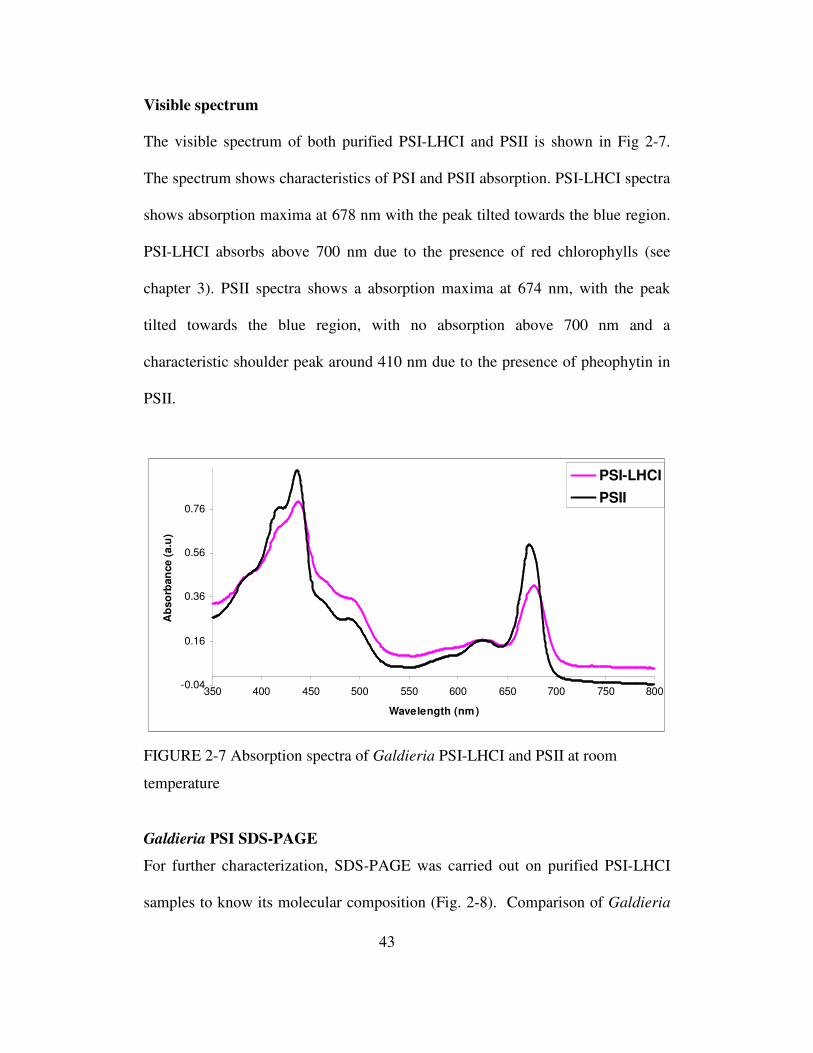
43
Visible spectrum
The visible spectrum of both purified PSI-LHCI and PSII is shown in Fig 2-7.
The spectrum shows characteristics of PSI and PSII absorption. PSI-LHCI spectra
shows absorption maxima at 678 nm with the peak tilted towards the blue region.
PSI-LHCI absorbs above 700 nm due to the presence of red chlorophylls (see
chapter 3). PSII spectra shows a absorption maxima at 674 nm, with the peak
tilted towards the blue region, with no absorption above 700 nm and a
characteristic shoulder peak around 410 nm due to the presence of pheophytin in
PSII.
-0.04
0.16
0.36
0.56
0.76
350 400 450 500 550 600 650 700 750 800
Wavelength (nm)
Ab
so
rban
ce (
a.u
)
PSI-LHCI
PSII
FIGURE 2-7 Absorption spectra of Galdieria PSI-LHCI and PSII at room
temperature
Galdieria PSI SDS-PAGE
For further characterization, SDS-PAGE was carried out on purified PSI-LHCI
samples to know its molecular composition (Fig. 2-8). Comparison of Galdieria
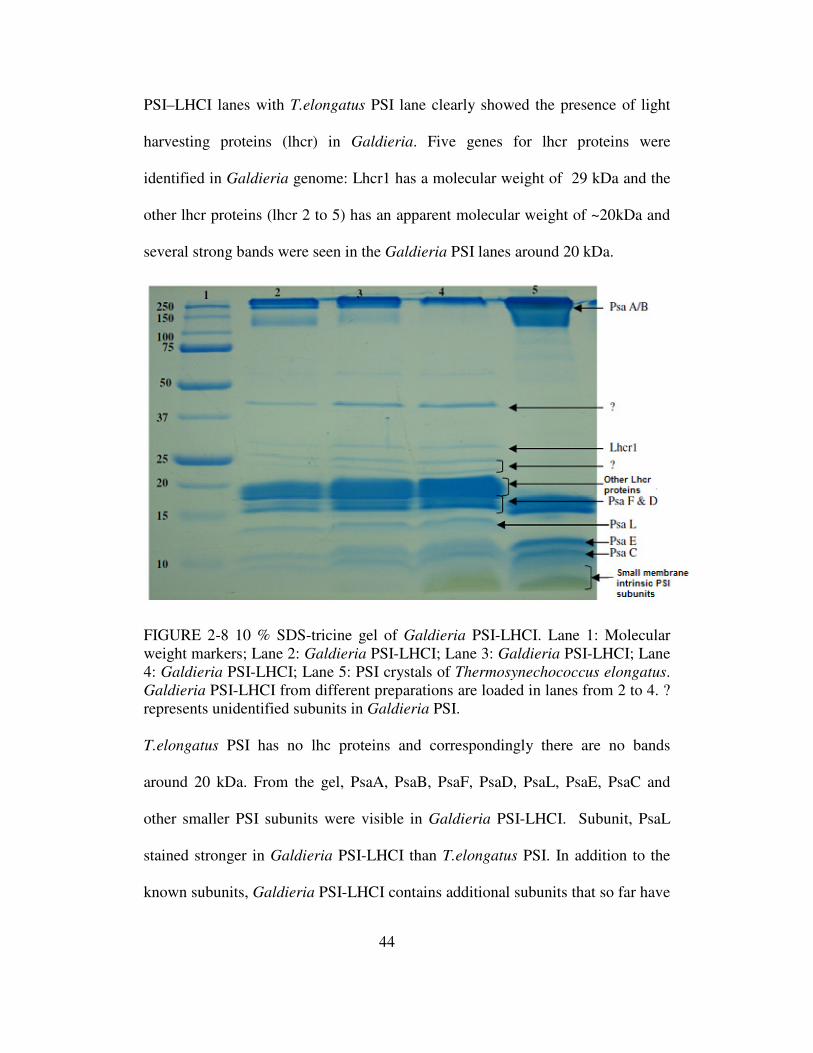
44
PSI–LHCI lanes with T.elongatus PSI lane clearly showed the presence of light
harvesting proteins (lhcr) in Galdieria. Five genes for lhcr proteins were
identified in Galdieria genome: Lhcr1 has a molecular weight of 29 kDa and the
other lhcr proteins (lhcr 2 to 5) has an apparent molecular weight of ~20kDa and
several strong bands were seen in the Galdieria PSI lanes around 20 kDa.
FIGURE 2-8 10 % SDS-tricine gel of Galdieria PSI-LHCI. Lane 1: Molecular weight markers; Lane 2: Galdieria PSI-LHCI; Lane 3: Galdieria PSI-LHCI; Lane 4: Galdieria PSI-LHCI; Lane 5: PSI crystals of Thermosynechococcus elongatus. Galdieria PSI-LHCI from different preparations are loaded in lanes from 2 to 4. ? represents unidentified subunits in Galdieria PSI. T.elongatus PSI has no lhc proteins and correspondingly there are no bands
around 20 kDa. From the gel, PsaA, PsaB, PsaF, PsaD, PsaL, PsaE, PsaC and
other smaller PSI subunits were visible in Galdieria PSI-LHCI. Subunit, PsaL
stained stronger in Galdieria PSI-LHCI than T.elongatus PSI. In addition to the
known subunits, Galdieria PSI-LHCI contains additional subunits that so far have

45
not been identified. These bands could represent small impurities or potential new
subunits of the PSI-LHCI complex from Galdieria (~30% of the genome is
unique).
Galdieria PSI synchrotron CD spectrum
To investigate the secondary structure of Galdieria PSI-LHCI complex, far-UV
Circular Dichroism (CD) was recorded (see materials and methods). For
comparison, T.elongatus PSI was used as the X-ray structure has been determined
for this membrane protein.
-10
-5
0
5
10
15
175 195 215 235 255
Wavelength (nm)
CD
(D
elt
a e
psil
on
)
FIGURE 2-9 Synchotron CD spectra of Galdieria PSI-LHCI and Thermosynechococcus elongatus PSI. Dashed line: PSI T. elongates; Thick solid line: PSI-LHCI G. sulphuraria
CD spectra from both PSI looks similar and has a major positive peak around 190
nm and negative peaks around 208 nm and 220 nm, indicating that majority of the
secondary structure is α-helical (Fig. 2-9). Secondary structure analysis using
different programs showed that 50 % of the structure is α-helical, followed by β-

46
sheets and random coil (Table 1). As Galdieria PSI contains LHCI proteins (LHC
proteins are not present in T.elongatus), we expected that Galdieria should have a
higher α-helical % than T.elongatus. In contrast to our hypothesis, secondary
structural analysis results showed that α-helical % is higher in T.elongatus PSI
than Galdieria PSI. Secondary structure predicted for both photosystems is within
the error range of each other. LHCI proteins are made of α-helical structure. This
result clearly shows that even SRCD was not able to resolve the secondary
structural differences between the two PSI membrane proteins.
TABLE 2-1 Secondary structural analysis of PSI
Sample
% α-helix
% β-sheet
% random
T.elongatus PSI
50 ± 3
10 ± 3
28 ± 2
G. sulphuraria PSI-LHCI
48 ± 3
13 ± 2
28 ± 2
Galdieria PSII SDS-PAGE
PSII fractions from size exclusion chromatography were concentrated and
molecular composition of the sample was identified using SDS-PAGE (see
materials and methods) (Fig. 2-10). In the SDS-PAGE analysis of Galdieria PSII,
CP47, CP43, PsbO, D1, D2, PsbU, PsbV , PsbE, PsbF, Psb27 and Psb28 subunits
were identified. Comparison of lanes (1 to 3) with lane (5) clearly showed that
Galdieria PSII subunit compositions might be different than T.elongatus PSII.
From the gel, it is hard to confirm or identify the PSII subunits of Galdieria, and
further work is needed to reveal the identity of different bands and PSII subunit
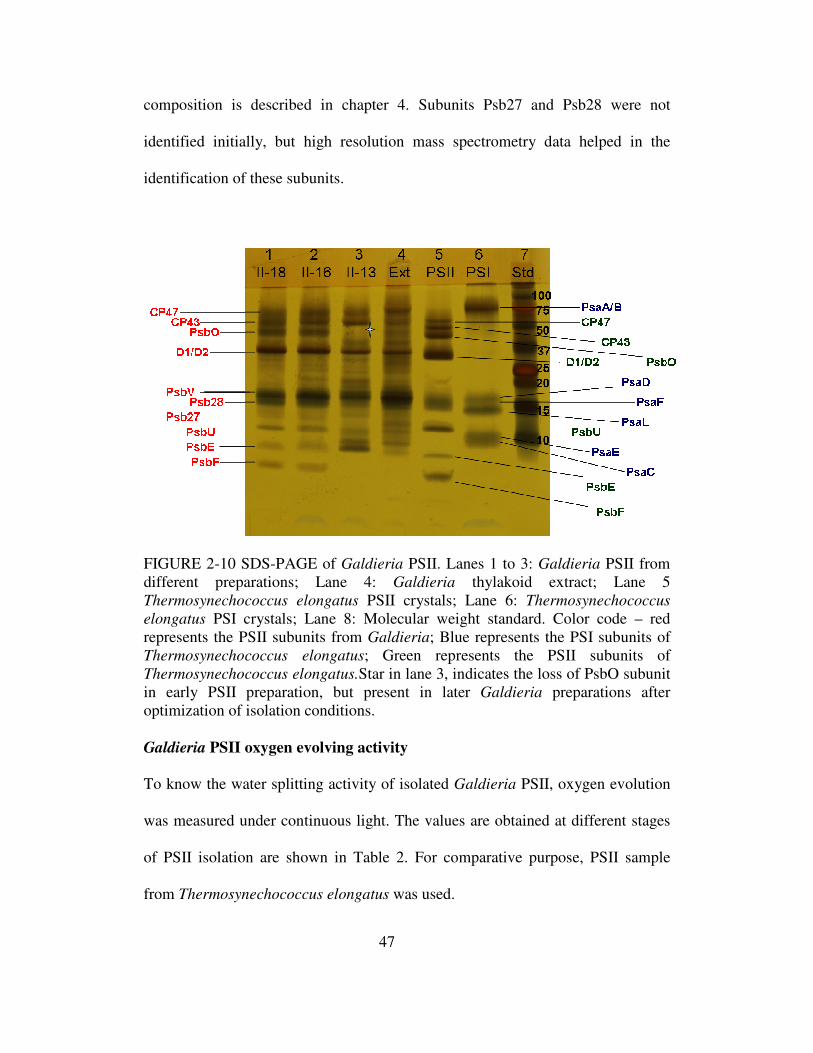
47
composition is described in chapter 4. Subunits Psb27 and Psb28 were not
identified initially, but high resolution mass spectrometry data helped in the
identification of these subunits.
FIGURE 2-10 SDS-PAGE of Galdieria PSII. Lanes 1 to 3: Galdieria PSII from different preparations; Lane 4: Galdieria thylakoid extract; Lane 5 Thermosynechococcus elongatus PSII crystals; Lane 6: Thermosynechococcus
elongatus PSI crystals; Lane 8: Molecular weight standard. Color code – red represents the PSII subunits from Galdieria; Blue represents the PSI subunits of Thermosynechococcus elongatus; Green represents the PSII subunits of Thermosynechococcus elongatus.Star in lane 3, indicates the loss of PsbO subunit in early PSII preparation, but present in later Galdieria preparations after optimization of isolation conditions. Galdieria PSII oxygen evolving activity
To know the water splitting activity of isolated Galdieria PSII, oxygen evolution
was measured under continuous light. The values are obtained at different stages
of PSII isolation are shown in Table 2. For comparative purpose, PSII sample
from Thermosynechococcus elongatus was used.

48
TABLE 2-2 Oxygen evolution activity (µmol O2/mg Chla hr) of
photosystem II
Organism
Sample Thermosynechococcus
elongatus
Galdieria sulphuraria
Thylakoid extract 185 - 250 115 - 182
Purified PSII
1280 - 1450
850 - 1220
Values are ranges obtained from at least three independent measurements for each sample type from different PSII preparations.
Both thylakoid extract and purified PSII from Galdieria has oxygen evolving
activity much less than the Thermosynechococcus elongatus PSII. But the oxygen
evolving activity for Galdieria is similar or slightly lower than the PSII oxygen
evolving activity from other organisms (43, 45, 58).
In Thermosynechococcus elongatus PSII preparation, crystallization was
used as a tool for purification and no size exclusion chromatography was
involved. In case of Galdieria preparation, we focused on rapid purification of
both PSI-LHCI and PSII membrane proteins involving size exclusion
chromatography, a possible reason for low oxygen evolving activity of Galdieria
PSII. This result shows that further optimization is required for isolation of PSII
from Galdieria. The oxygen evolving activity measurements are from the PSII
samples isolated from early PSII preparations. Figure 2-10 clearly showed that in
early preparations (lane 3 in Fig. 2-10), PsbO subunit was lost. But after
optimization of PSII isolation, PsbO was present in later preparations (lane 1 and
49
2), which would improve the oxygen evolving activity of isolated PSII from
Galdieria. Additionally, we are yet to identify the crystallization conditions of
Galdieria PSII. Once we had identified the crystallization condition, we can use
crystallization as a tool for purification (in place of size exclusion
chromatography), similar to PSII purification from Thermosynechococcus
elongatus. This might improve the oxygen evolving activity of Galdieria PSII.
CONCLUSION
The cultivation of Galdieria sulphuraria was optimized for maximum yield of
photosystem I and II. The method described here allows rapid purification of
photochemically active PSI-LHCI and PSII membrane protein complexes from
the thermo-acidophilic redalga, Galdieria sulphuraria in the same anion exchange
column run. The isolated Galdieria PSI-LHCI supercomplex was stable and intact
(after one anion exchange column run and two size exclusion column runs) in
comparison with other eukaryotic PSI-LHCI supercomplexes (see chapter 3). For
Galdieria PSII, further optimization of the isolation conditions are required. By
using only one detergent (β-DDM) throughout the whole purification procedure,
the formation of uniform micelles of known composition was ensured providing a
homogenous starting material for further experiments (see chapter 3 and 4).

50
CHAPTER 3 EFFICIENT LIGHT HARVESTING IN A DARK, HOT,
ACIDIC ENVIRONMENT: THE STRUCTURE AND FUNCTION OF PSI-
LHCI FROM GALDIERIA SULPHURARIA
INTRODUCTION
Photosynthetic eukaryotes have light-harvesting complexes (LHCI and
LHCII), which absorb light energy and transfer it to the reaction center of
photosystems (PSI and PSII). Light harvesting proteins are nuclear encoded and
in most cases they consist of membrane intrinsic proteins with three
transmembrane helices. Light harvesting proteins bind different types of
chlorophyll (Chl) and carotenoid, depending upon the organism. Despite our
extensive knowledge of PSI-LHC supercomplexes from other eukaroyotes,
relatively little is known about the PSI-LHC of rhodophytes (red algae). It has
been proposed that Galdieria and its relatives belong to a line of red algae that
diverged early from main lineage. So this chapter focuses on the structure and
composition of PSI-LHCI supercomplexes from Galdieria by electron
microscopy (EM) and liquid chromatography with tandem mass spectrometry
(LC-MS/MS) and also to interrogate their light-harvesting function by ultrafast
optical spectroscopy published in Thangaraj et al. (November 2010) in
Biophysical journal.
A more detailed introduction introduction on photosynthesis,
photosystems and Galdieria sulphuraria were described in chapter 1. Briefly, our
current knowledge of the photosystems of Galdieria sulphuraria is minimal, and
is mostly inferred from studies of other Cyanidiales. A recent study analyzed the

51
genes encoding PSI proteins in Galdieria and compared them to the
cyanobacterial and eukaryotic PSI complexes (9), concluding that Galdieria PSI
might be similar to a common ancestor of PSI from cyanobacteria, green algae
and plants. Five lhc (lhcr1-lhcr5) genes have been reported to be present in the
Galdieria genome, of which one (lhcr4) has been confirmed by N-terminal
sequencing (39). Results from this study have shown that Lhcr4 has a transit
peptide of 44 amino acids, with a molecular mass of 20574 Da for the mature
protein (185 amino acids).
MATERIALS AND METHODS
Cell culture, PSI-LHCI isolation and characterization
Galdieria sulphuraria cells were grown at 42°C in 11 L flasks containing a 10X
medium at pH 2.0, with a constant supply of air and 2% CO2 and illumination at
25 µmol photon m-2 s-1 (Li-cor, model LI-189) (57). A more detailed description
of the isolation and purification of PSI-LHCI from Galdieria sulphuraria is
mentioned in Chapter 2. Briefly, cells were harvested by centrifugation at 2500
rpm for 2 min at 25°C. Harvested cells were homogenized in MM buffer (20 mM
MES pH 6.0, 10 mM CaCl2, 10 mM MgCl2 & 500 mM mannitol) and 1 mM
PMSF was added before cells were broken. Following cell lysis using a bead
beater (Biospec products Inc., OK) and washing, the thylakoid membranes were
solubilized by 1.25 % n-dodecyl–β-D–maltoside (β-DDM) at room temperature.
Thylakoid membranes were centrifuged at 58,000 rpm for 90 minutes and the
detergent-solubilized PSI-LHCI was further purified from the thylakoid extract by
anion exchange chromatography with a step gradient, followed by size exclusion

52
chromatography as described in (18). PSI (crystals) of Thermosynechococcus
elongatus used in this study for comparative purposes were isolated and purified
as described in Fromme and Witt (59). Similarly, PSI-LHCI of Chlamydomonas
reinhardtii used in this study for comparative purposes is described in detail in
chapter 5.
Low temperature fluorescence emission spectra
PSI samples were adjusted to 10 µM Chl with Tris buffer (pH 7.5) containing 60
% glycerol and 0.02 % β-DDM and the emission spectra was measured at 77 K
with a FLUOROMAX-3 spectrofluorometer between 600 and 800 nm using
excitation at 468 nm.
Differential extinction co-efficient of Galdieria P700
We determined the differential extinction coefficient of P700 by flash-induced
absorption changes of P700 due to a redox reaction with N,N,N,N-tetramethyl-p-
phenylenediaminedihydrochloride (TMPD) using the method published
previously (60). PSI complexes were diluted to a final chlorophyll concentration
of 40 µM in a buffer containing 100 mM Tricine (pH 8), 10 mM CaCl2, 10 mM
MgCl2, 0.02% β-DDM and 800 µM TMPD. The reaction of PSI with TMPD+ was
performed in an anaerobic cuvette with a 1 cm path length. Before the
measurements, the buffer was degassed and the sample loaded, in an anaerobic
chamber. The flash induced absorbance difference spectra of P700 and TMPD
were recorded at room temperature using JTS-10 LED kinetic spectrometer (Bio-
Logic, Grenoble, France). The sample was excited by actinic light (650 nm),
intensity 3000µE/m2/s duration 10 ms. We used interference filters at 703 nm and
53
573 nm for P700 and TMPD+ accordingly. Since we measure at 703 nm, for the
calculation of the extinction coefficient at 700 nm the absorption was normalized
based on the dual beam spectrophotometer readings. As a control, the same
method was applied to T. elongatus PSI samples. Extinction coefficient values of
between 10.6 and 12 mM-1 cm-1 (60, 61) have been published for oxidized TMPD,
so an extinction coefficient range was given for Galdieria PSI-LHCI complex and
T. elongatus PSI. Chlorophyll (Chl a) concentrations were determined after
extraction with acetone/water (4:1, v/v), by using an extinction coefficient of
76.79 mM-1 cm-1 at the Qy maximum of 664 nm (46).
Dual-beam spectrophotometer
The Chl a/P700 ratio of T. elongatus PSI and Galdieria PSI-LHCI
supercomplexes was determined by measuring P700 oxidation. The proteins were
suspended in a buffer containing 20 mM MES, pH 6.4, 100mM MgSO4 and
0.02% β-DDM. The sample (4 ml) was equally divided between two glass
cuvettes (2 ml each). 10 µl ascorbate (0.5M) was added to one cuvette and 10 µl
potassium ferricyanide (0.1 M) was added to the other. The absorption difference
spectrum (reduction-oxidation) was measured between 650-850 nm using a Cary
dual beam spectrophotometer. The differential extinction co-efficients obtained
for Galdieria PSI-LHCI was employed for quantitation of the Chl a/P700 ratio
(62) .
Mass-spectrometry and data analysis
Galdieria PSI samples were precipitated with cold acetone (-20°C) to remove
lipids, detergents chlorophyll and other cofactors. The precipitated protein was
54
recovered by centrifugation (10,000×g) and the supernatant removed. The protein
pellet was dissolved in 90% formic acid for immediate injection into an HPLC
system prepared for reversed phase chromatography. column preparation, fraction
collection, mass spectrometry instrumentation set up for intact proteins and data
analysis for those was performed as described elsewhere (63, 64). Selected
fractions from LC-MS+ were trypsin digested, analyzed by nano LC-MS/MS and
the obtained mass spectrometry data were analyzed by Mascot software (Matrix
Sciences, London, UK) as described previously (64).
Electron microscopy and single particle analysis
Samples of purified PSI-LHCI complex were diluted with buffer (20 mM MES
pH 6.4, 100 mM Mg2SO4, 10 mM CaCl2 and 0.03% β-DDM) to a final
concentration of ~6 µM and negatively stained with 2% uranyl acetate on glow-
discharged carbon-coated copper grids. Electron microscopy was performed on a
Philips CM120 electron microscope equipped with a LaB6 tip, operated at 120
kV. In total, 925 electron micrographs were recorded with a Gatan 4K slow-scan
CCD camera at 130,600× magnification with a pixel size (after binning the
images) of 2.3 Å at the specimen level. GRACE software was used for semi-
automated specimen selection and data acquisition (65). The 38,859 single
particle projections (128 × 128 pixel frame) were subjected to multi-reference
alignment and reference-free alignment procedures, multivariate statistical
analysis and hierarchical ascendant classification, all routines within the
GRoningen Image Processing (GRIP) software package (66). The final two-
dimensional projection maps of the presented PSI views were calculated from the
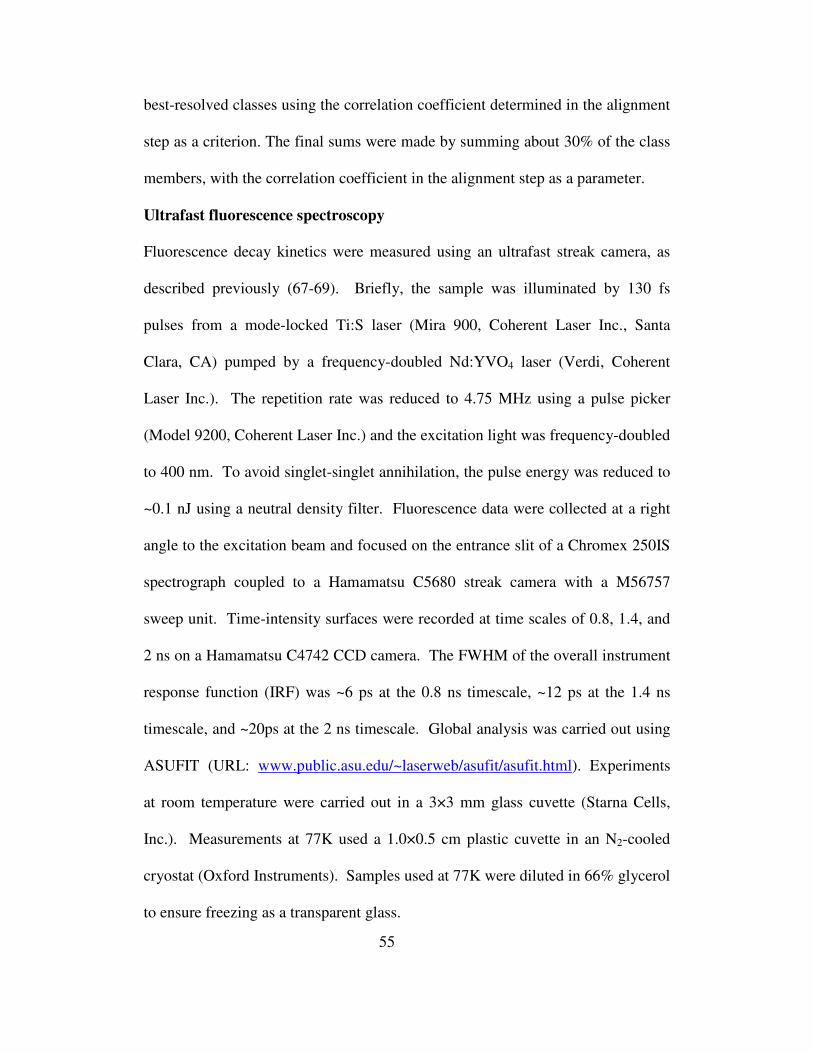
55
best-resolved classes using the correlation coefficient determined in the alignment
step as a criterion. The final sums were made by summing about 30% of the class
members, with the correlation coefficient in the alignment step as a parameter.
Ultrafast fluorescence spectroscopy
Fluorescence decay kinetics were measured using an ultrafast streak camera, as
described previously (67-69). Briefly, the sample was illuminated by 130 fs
pulses from a mode-locked Ti:S laser (Mira 900, Coherent Laser Inc., Santa
Clara, CA) pumped by a frequency-doubled Nd:YVO4 laser (Verdi, Coherent
Laser Inc.). The repetition rate was reduced to 4.75 MHz using a pulse picker
(Model 9200, Coherent Laser Inc.) and the excitation light was frequency-doubled
to 400 nm. To avoid singlet-singlet annihilation, the pulse energy was reduced to
~0.1 nJ using a neutral density filter. Fluorescence data were collected at a right
angle to the excitation beam and focused on the entrance slit of a Chromex 250IS
spectrograph coupled to a Hamamatsu C5680 streak camera with a M56757
sweep unit. Time-intensity surfaces were recorded at time scales of 0.8, 1.4, and
2 ns on a Hamamatsu C4742 CCD camera. The FWHM of the overall instrument
response function (IRF) was ~6 ps at the 0.8 ns timescale, ~12 ps at the 1.4 ns
timescale, and ~20ps at the 2 ns timescale. Global analysis was carried out using
ASUFIT (URL: www.public.asu.edu/~laserweb/asufit/asufit.html). Experiments
at room temperature were carried out in a 3×3 mm glass cuvette (Starna Cells,
Inc.). Measurements at 77K used a 1.0×0.5 cm plastic cuvette in an N2-cooled
cryostat (Oxford Instruments). Samples used at 77K were diluted in 66% glycerol
to ensure freezing as a transparent glass.
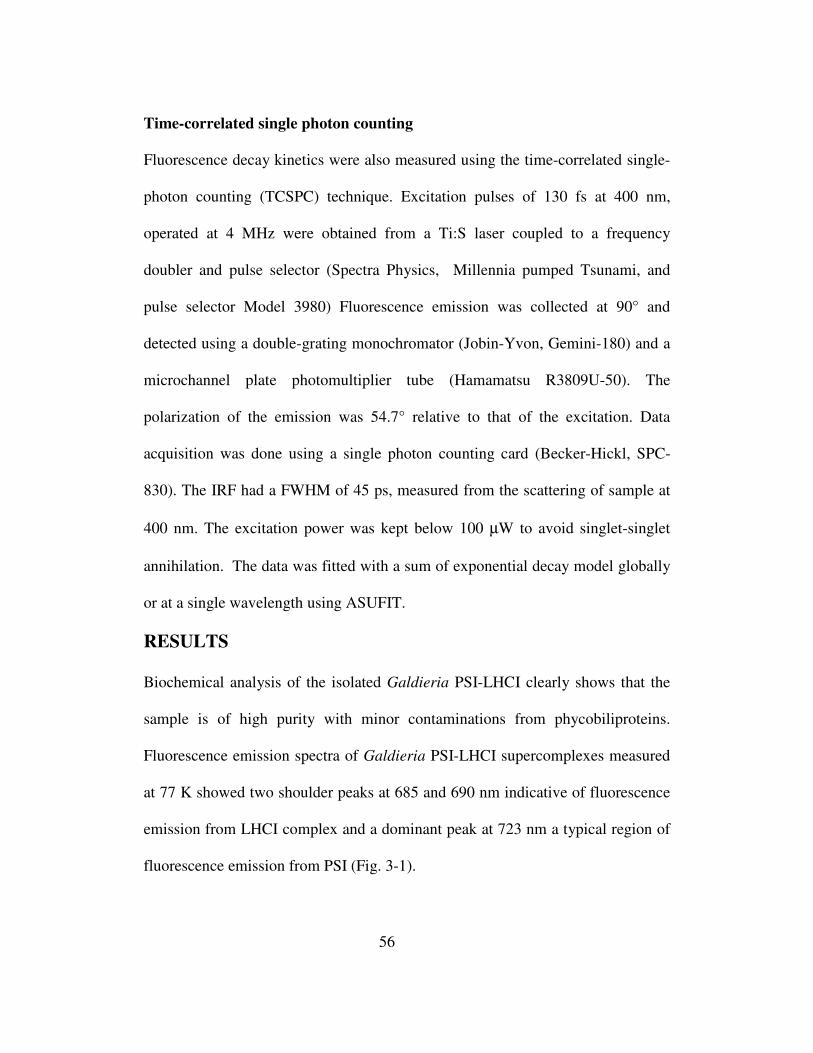
56
Time-correlated single photon counting
Fluorescence decay kinetics were also measured using the time-correlated single-
photon counting (TCSPC) technique. Excitation pulses of 130 fs at 400 nm,
operated at 4 MHz were obtained from a Ti:S laser coupled to a frequency
doubler and pulse selector (Spectra Physics, Millennia pumped Tsunami, and
pulse selector Model 3980) Fluorescence emission was collected at 90° and
detected using a double-grating monochromator (Jobin-Yvon, Gemini-180) and a
microchannel plate photomultiplier tube (Hamamatsu R3809U-50). The
polarization of the emission was 54.7° relative to that of the excitation. Data
acquisition was done using a single photon counting card (Becker-Hickl, SPC-
830). The IRF had a FWHM of 45 ps, measured from the scattering of sample at
400 nm. The excitation power was kept below 100 µW to avoid singlet-singlet
annihilation. The data was fitted with a sum of exponential decay model globally
or at a single wavelength using ASUFIT.
RESULTS
Biochemical analysis of the isolated Galdieria PSI-LHCI clearly shows that the
sample is of high purity with minor contaminations from phycobiliproteins.
Fluorescence emission spectra of Galdieria PSI-LHCI supercomplexes measured
at 77 K showed two shoulder peaks at 685 and 690 nm indicative of fluorescence
emission from LHCI complex and a dominant peak at 723 nm a typical region of
fluorescence emission from PSI (Fig. 3-1).
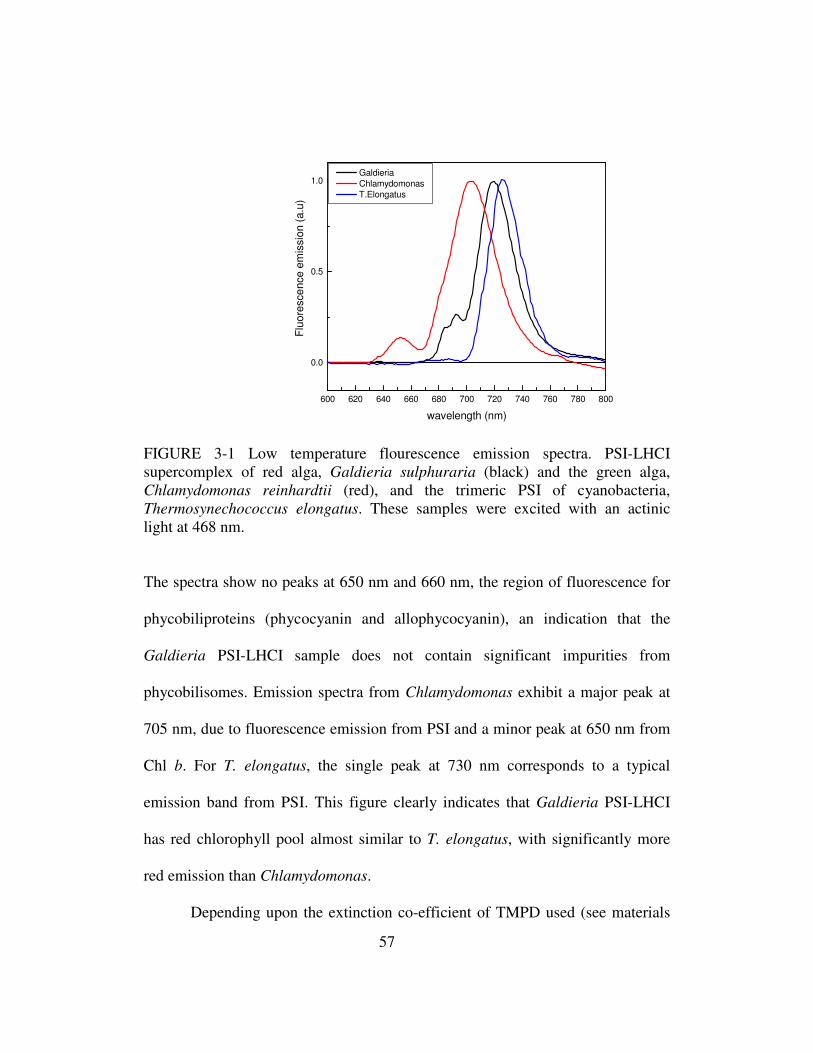
57
FIGURE 3-1 Low temperature flourescence emission spectra. PSI-LHCI supercomplex of red alga, Galdieria sulphuraria (black) and the green alga, Chlamydomonas reinhardtii (red), and the trimeric PSI of cyanobacteria, Thermosynechococcus elongatus. These samples were excited with an actinic light at 468 nm.
The spectra show no peaks at 650 nm and 660 nm, the region of fluorescence for
phycobiliproteins (phycocyanin and allophycocyanin), an indication that the
Galdieria PSI-LHCI sample does not contain significant impurities from
phycobilisomes. Emission spectra from Chlamydomonas exhibit a major peak at
705 nm, due to fluorescence emission from PSI and a minor peak at 650 nm from
Chl b. For T. elongatus, the single peak at 730 nm corresponds to a typical
emission band from PSI. This figure clearly indicates that Galdieria PSI-LHCI
has red chlorophyll pool almost similar to T. elongatus, with significantly more
red emission than Chlamydomonas.
Depending upon the extinction co-efficient of TMPD used (see materials
600 620 640 660 680 700 720 740 760 780 800
0.0
0.5
1.0
Galdieria
Chlamydomonas
T.Elongatus
Flu
ore
sce
nce
em
issio
n (
a.u
)
wavelength (nm)

58
and methods) a molar extinction coefficient of 115±5 mM-1 cm-1 was obtained for
Galdieria PSI-LHCI complexes at 700 nm (Fig. 3-2). For T. elongatus PSI, an
extinction coefficient of 65±5 mM-1 cm-1 was obtained.
FIGURE 3-2 P700 extinction co-efficient. The flash induced absorbance difference spectra of P700 and TMPD for Galdieria and T.elongatus. Each trace is an average of 3 different scans. The calculation of the extinction coefficient for P700 was based in the redox reaction of P700 with TMPD, using above mentioned formula.
The chemically oxidized-minus-reduced spectra of P700 for PSI-LHCI
complexes of Galdieria and PSI trimer for T. elongatus are shown in Fig. 3-3.
With the extinction coefficient value range obtained for Galdieria PSI-LHCI, the
Chl a/P700 ratio range of 237±7 was determined for Galdieria, and a range of
102±7 was obtained for PSI T .elongatus. The Chl a/P700 value obtained for PSI
T. elongatus agrees well with previous reports and the X-ray structure (70). The
ratio obtained for Galdieria, however, is higher than the ratios reported for other
red alga, Porphyridium purpureum (136±20) and Cyanidium caldarium (103±10)
(71). Similar Chl a/P700 ratio was deduced for PSI-LHCI of the green alga C.
)573(703(
700nmA
nmATMPDP
∆
∆⋅∆=∆ εε
- 2 0 0 0 2 0 0 4 0 0 6 0 0 8 0 0- 2 0 0 0 2 0 0 4 0 0 6 0 0 8 0 0
-5 0 0 0
0
T im e (m s )
T .E lo n g a tu s 7 0 3 n m T .E lo n g a tu s 5 7 3 n m
∆ A (5 7 3 n m )
∆ A (7 0 3 n m )
Ab
so
rba
nce
(a.u
.)
G a ld ie r ia a t 7 0 3 n m G a ld ie r ia a t 5 7 3 n m

59
reinhardtii (217±6).
FIGURE 3-3 Oxidized minus reduced spectra of P700. Samples of Galdieria PSI-LHCI and T.elongatus PSI were suspended in 20 mM MES (pH 6.4), 100 mM MgSO4 and 0.02 % β-DDM. Each trace is an average of three scans and the spectra were recorded at room temperature.
Low-resolution intact protein mass spectrometry analysis revealed the
presence of all the PSI subunits (except PsaM and PsaN) and all five of the light
harvesting complexes (LHCr1 – LHCr5) with different post translational
modifications (data not shown). Furthermore, mass spectrometry data analysis of
trypsin-digested fractions revealed the presence of at least 4 different Lhcr
peptides from four of the five different light harvesting complexes identified in
Galdieria sulphuraria (Table 3-1, Appendix B). The single LHCI peptide
missing from Table 1, LHCr4, has been identified by N-terminal sequencing (39).
Therefore we assume that all the five LHCr proteins are present.
650 700 750 800 850
0.00
Galdieria
T.Elongatus
∆ A
bsorb
ance (
a.u
.)
wavelength (nm)

60
TABLE 3-1 LHCr peptides of Galdieria identified by LC-MS analysis
Electron microscopy
Single particle analysis was performed on a set of ~39,000 top-view projections
of Galdieria sulphuraria PSI particles. The complex appears to have an oval
shape in the membrane plane projection with overall dimensions of 19.6×18.5 nm
(Fig. 3-4). The most prominent inner feature is an L-shaped ridge in the centre,
with the corner at the upper left side; the dotted block arc shape (Fig. 3-4A-C)
indicates the PsaE, PsaC and PsaD subunits of the stromal hump. Classification
shows, however, that the projection maps have a slight variation in size. The map
of frame A represents the largest, most abundant type of projection; the maps of
frames B-C show projections with slightly smaller widths, although they share
same overall shape and inner features. This is clear from the distance of the edge
(see white arrowhead) to the ridge, between maps of Fig. 3-4A and 3-4B the
difference is about 0.1 nm. Nevertheless, because all maps show the same
prominent L-shaped inner feature and overall oval circumference, the difference
Identity Swiss –
Prot
database
number
Accession
number
Peptide Positio
n
P-
score
LHCr1 Q9M441 CAB 75583 K.VPPVLAHDVYVK.T 198- 209
56
LHCr2 Q8RW55 CAC 87422
R.EPGYFGFDPLGLGK.N 159-172
62
LHCr3 Q9FEM1 CAC 87419 R.EPGYFGFDPLGLAK.D 166-179
84
LHCr5 Q9FEMO CAC 87421/CAC 10534
R.LDESMPGYAGFDPLGF
SDKFDVK.F 56-78 71

61
in width between maps in Fig. 3-4, A-D is likely not structure-related, but caused
by a gradual tilt of particles attached to the carbon support film of the EM
specimens. Indeed it is known that the roughness of the carbon support film may
cause some particle tilting and a clear example is the previously analyzed
cyanobacterial PSI (72). Because cyanobacterial PSI forms trimers, loss of three-
fold symmetry in the top view projection directly indicates tilting. In a non-
symmetric particle, such as the Galdieria sulphuraria PSI-LHCI complex, a
possible tilt is more difficult to identify. The particles presented in Fig. 3-4, E and
F have dimensions of about 17×14 nm and 16×12.4 nm, corresponding to smaller
particles with a lower LHCr content.
Electron microscopy images clearly show that Galdieria PSI-LHCI is a
monomer with a dense belt of LHC antenna proteins closely surrounding PSI.
This result is the experimental proof of the hypothesis raised by genetic analysis
that Galdieria PSI may contain plant-type monomeric PSI-LHCI (9). Galdieria
PSI-LHCI also differs significantly from the complexes in higher plants and green
algae; the LHCs in Galdieria are more functionally tightly coupled to the PSI core
than in higher plants and green algae. This functional tight coupling is shown by
the ultrafast spectroscopy and TCSPC result that follows.
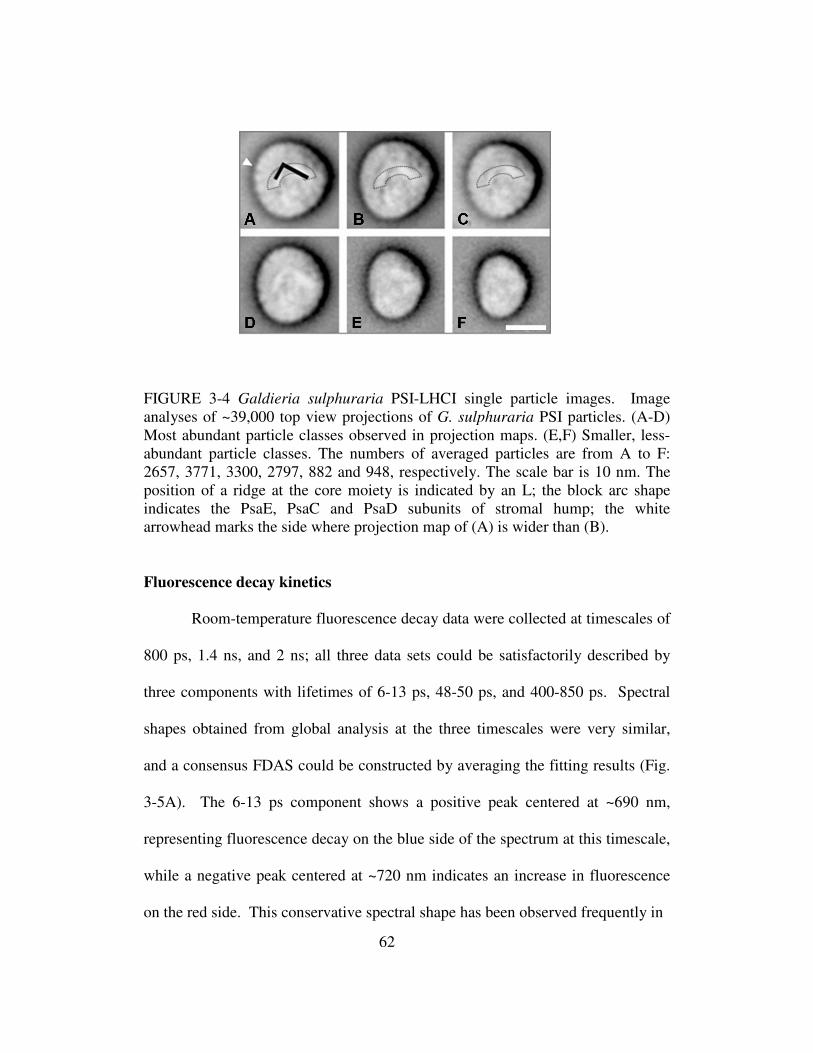
62
FIGURE 3-4 Galdieria sulphuraria PSI-LHCI single particle images. Image analyses of ~39,000 top view projections of G. sulphuraria PSI particles. (A-D) Most abundant particle classes observed in projection maps. (E,F) Smaller, less-abundant particle classes. The numbers of averaged particles are from A to F: 2657, 3771, 3300, 2797, 882 and 948, respectively. The scale bar is 10 nm. The position of a ridge at the core moiety is indicated by an L; the block arc shape indicates the PsaE, PsaC and PsaD subunits of stromal hump; the white arrowhead marks the side where projection map of (A) is wider than (B).
Fluorescence decay kinetics
Room-temperature fluorescence decay data were collected at timescales of
800 ps, 1.4 ns, and 2 ns; all three data sets could be satisfactorily described by
three components with lifetimes of 6-13 ps, 48-50 ps, and 400-850 ps. Spectral
shapes obtained from global analysis at the three timescales were very similar,
and a consensus FDAS could be constructed by averaging the fitting results (Fig.
3-5A). The 6-13 ps component shows a positive peak centered at ~690 nm,
representing fluorescence decay on the blue side of the spectrum at this timescale,
while a negative peak centered at ~720 nm indicates an increase in fluorescence
on the red side. This conservative spectral shape has been observed frequently in

63
FIGURE 3-5 Representative fluorescence decay-associated spectra (FDAS) for PSI-LHCI from Galdieria (A) and the green alga Chlamydomonas reinhardtii (B) at room temperature. These spectra are averages from data collected at 800 ps, 1.5-ns, and 2-ns timescales; individual FDAS are available in the online supporting information accompanying this article. In Galdieria (A), the conservative 6-ps phase arises from energy equilibration; the photochemical trapping takes place in the 49-ps decay phase. In Chlamydmonas (B), the photochemical trapping is faster (29 ps), but is accompanied by a slow 140-ps phase that is absent in Galdieria samples. spectroscopic studies of PSI and is characteristic of energy transfer from the blue
pool of chlorophyll to the red-shifted chlorophylls i.e. the excitation energy
transfer between pools of chlorophyll with different transition energies (21-24).
The longest timescale (2 ns) showed both a longer lifetime (13 ps, rather than 6)
and a less conservative spectral shape than the shorter timescales; the data
collected at shorter timescales is more accurate due to better temporal resolution.

64
The second component shows a peak at ~695 nm and a long red tail
extending out to at least 770 nm. The lifetimes obtained for this component are
timescale-independent and are in the 47-50 ps range – longer than those typically
seen for PSI cores, but shorter than the slow components associated with the
trapping of LHCI-originated excitons in eukaryotic PSI-LHCI.
Finally, a third component was required for an accurate fit, but represents
only about 2% of the overall decay amplitude. Despite the low amplitude of this
component, it consistently fit to lifetimes in the 400-850 ps range, rather than the
3-7 ns range typical for uncoupled chlorophyll components. It is possible that this
component arises from weakly coupled chlorophyll. It is highly unlikely,
however, that this is the same type of LHCI component observed in studies of
PSI-LHCI from other eukaryotes – its extremely low amplitude suggests that it
probably does not represent a population of chlorophyll that receives significant
initial excitation.
When the sample is cooled to 77K, the situation becomes significantly
more complex. The difficulty of energy transfer out of the red-shifted states at
low temperature leads to multi-exponential decay behavior that is more kinetically
and spectrally heterogeneous than that seen at room temperature. Five exponential
components were required to give an adequate fit to the streak camera data, but
the lifetimes obtained were not extremely consistent between timescales (Fig. 3-
6). This suggests that PSI from Galdieria contains several pools of red-shifted
chlorophyll with potentially complex kinetic relationships. Because of the fairly
broad range of timescales involved in fluorescence decay, there is no obvious

65
reason to consider the lifetimes obtained at one timescale to be universally more
reliable than the others – it is probable that the shortest components will be most
accurate at the shortest measurement timescale, while the longest components can
be measured most accurately at the longer timescales. Despite this difficulty,
comparison of the different FDAS allows us to reach consistent conclusions. The
fastest component measured ranges from 7.7 to 10.1 ps, and shows a clear energy
transfer character, similar to the ~6 ps component observed at room temperature.
Like its room-temperature counterpart, it has a roughly conservative shape with a
positive peak at ~695 nm and a much broader negative peak centered around 720
nm.
FIGURE 3-6 Representative FDAS for Galdieria PSI-LHCI at 77K. The first three phases represent energy equilibration between the bulk and red-shifted antenna states and within the red-shifted population; the two slowest states represent fluorescence from thermally trapped red-shifted chlorophyll sites
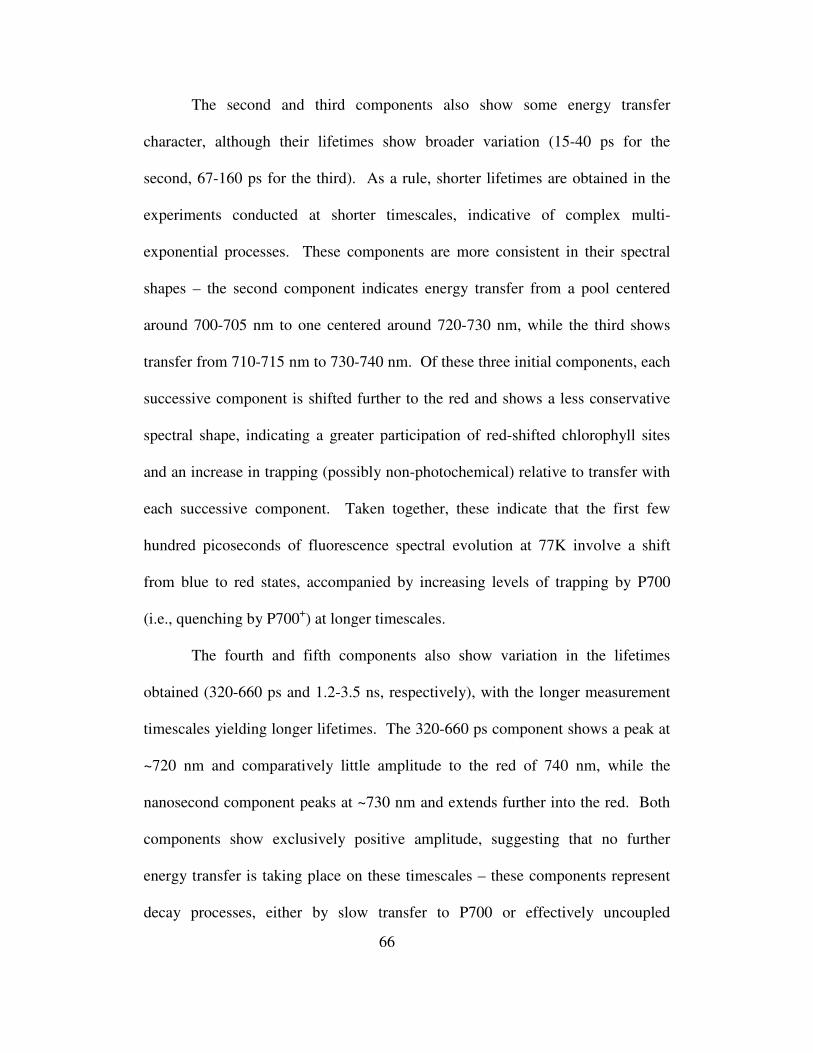
66
The second and third components also show some energy transfer
character, although their lifetimes show broader variation (15-40 ps for the
second, 67-160 ps for the third). As a rule, shorter lifetimes are obtained in the
experiments conducted at shorter timescales, indicative of complex multi-
exponential processes. These components are more consistent in their spectral
shapes – the second component indicates energy transfer from a pool centered
around 700-705 nm to one centered around 720-730 nm, while the third shows
transfer from 710-715 nm to 730-740 nm. Of these three initial components, each
successive component is shifted further to the red and shows a less conservative
spectral shape, indicating a greater participation of red-shifted chlorophyll sites
and an increase in trapping (possibly non-photochemical) relative to transfer with
each successive component. Taken together, these indicate that the first few
hundred picoseconds of fluorescence spectral evolution at 77K involve a shift
from blue to red states, accompanied by increasing levels of trapping by P700
(i.e., quenching by P700+) at longer timescales.
The fourth and fifth components also show variation in the lifetimes
obtained (320-660 ps and 1.2-3.5 ns, respectively), with the longer measurement
timescales yielding longer lifetimes. The 320-660 ps component shows a peak at
~720 nm and comparatively little amplitude to the red of 740 nm, while the
nanosecond component peaks at ~730 nm and extends further into the red. Both
components show exclusively positive amplitude, suggesting that no further
energy transfer is taking place on these timescales – these components represent
decay processes, either by slow transfer to P700 or effectively uncoupled
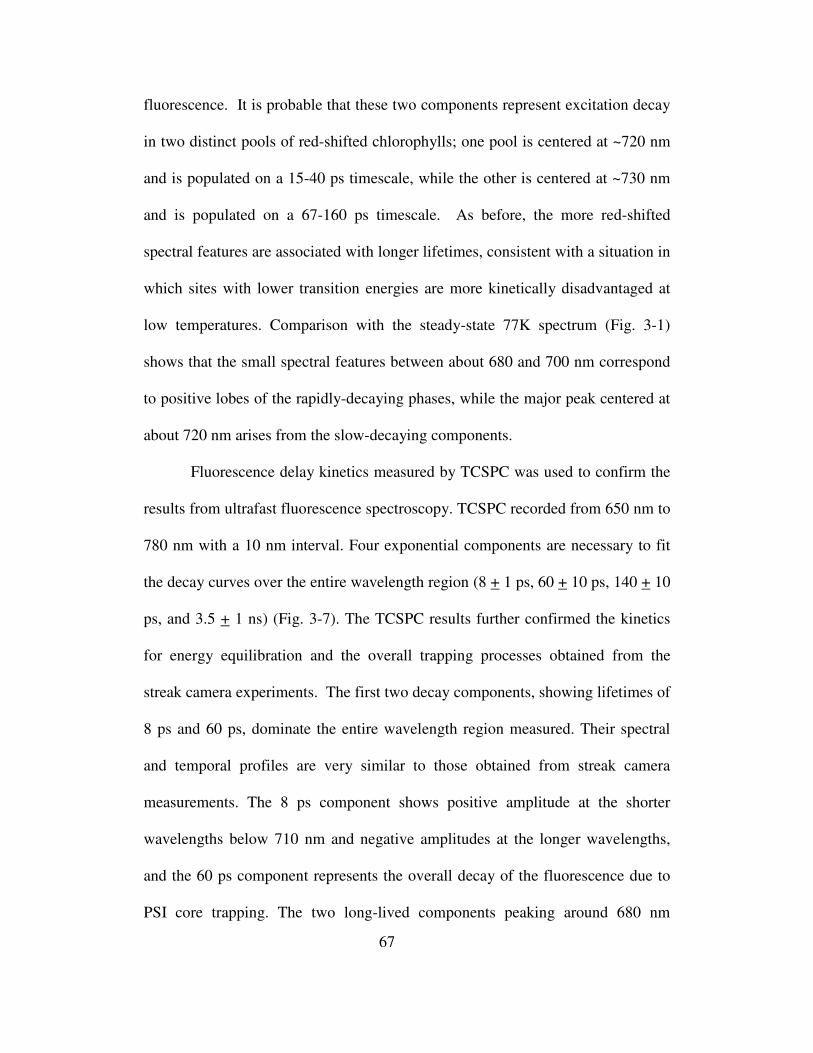
67
fluorescence. It is probable that these two components represent excitation decay
in two distinct pools of red-shifted chlorophylls; one pool is centered at ~720 nm
and is populated on a 15-40 ps timescale, while the other is centered at ~730 nm
and is populated on a 67-160 ps timescale. As before, the more red-shifted
spectral features are associated with longer lifetimes, consistent with a situation in
which sites with lower transition energies are more kinetically disadvantaged at
low temperatures. Comparison with the steady-state 77K spectrum (Fig. 3-1)
shows that the small spectral features between about 680 and 700 nm correspond
to positive lobes of the rapidly-decaying phases, while the major peak centered at
about 720 nm arises from the slow-decaying components.
Fluorescence delay kinetics measured by TCSPC was used to confirm the
results from ultrafast fluorescence spectroscopy. TCSPC recorded from 650 nm to
780 nm with a 10 nm interval. Four exponential components are necessary to fit
the decay curves over the entire wavelength region (8 + 1 ps, 60 + 10 ps, 140 + 10
ps, and 3.5 + 1 ns) (Fig. 3-7). The TCSPC results further confirmed the kinetics
for energy equilibration and the overall trapping processes obtained from the
streak camera experiments. The first two decay components, showing lifetimes of
8 ps and 60 ps, dominate the entire wavelength region measured. Their spectral
and temporal profiles are very similar to those obtained from streak camera
measurements. The 8 ps component shows positive amplitude at the shorter
wavelengths below 710 nm and negative amplitudes at the longer wavelengths,
and the 60 ps component represents the overall decay of the fluorescence due to
PSI core trapping. The two long-lived components peaking around 680 nm

68
contribute only a few percent of the total fluorescence signal and probably
originate from some loosely coupled (140 ps) and uncoupled (3.5 ns) antenna
complexes.
FIGURE 3-7 Fluorescence decay-associated spectra obtained by time-correlated single photon counting (TCSPC) for Galdieria PSI-LHCI. The two dominant components arise from downhill energy transfer (7.6 ps) and trapping by P700 (70 ps).
These two decay components likely originated from the same source as the 400-
850 ps component in the room-temperature streak camera results but are better
resolved in the TCSPC measurement because a higher signal-to-noise ratio can be
achieved.
DISCUSSION
The analysis by single particle electron microscopy shows that the PSI complex of
Galdieria sulphuraria is a monomeric, oval-shaped particle. Because several
types of PSI complexes have been studied by high-resolution X-ray diffraction or

69
by lower-resolution electron microscopy, comparison may provide us hints about
structural homologies and differences. PSI from a related red algal species,
Cyanidium caldarium, has been found (36) to be somewhat heterogeneous but the
largest particle had overall dimensions with a maximum size of 19×16 nm,
slightly smaller than our dominant projection (19.6×18.5 nm). In the study with
Cyanidium, cell cultures grown under high-light conditions (200 µmol photon m-2
s-1), yielded small and medium sized PSI complexes whereas algae grown at low-
light conditions (20 µmol photon m-2 s-1), resulted in medium and bigger PSI
complexes. In this study, Galdieria was grown only under low light conditions
(25 µmol photon m-2 s-1) and some PSI projection maps have dimensions that are
similar (Fig. 3-4, C and D) or even bigger (Fig. 3-4, A and B) than the largest
Cyanidium PSI structure. The projections shown in Fig. 3-4E and F, however,
have dimensions that differ from the medium-sized (found both at high and low
light conditions) and small-sized (found only at low light conditions) PSI particles
from Cyanidium. Our Galdieria cell cultures are strongly inhibited at high light
intensities and our work focused on low light adapted cells as this represents the
ecologically relevant growth conditions for this organism.
A 2D map of PSI from the green alga Chlamydomonas reinhardtii, shown
in Fig. 3-4B, permits a more detailed structural comparison (73). Chlamydomonas
PSI measures 21.3×18.2 nm and comprises a monomeric core flanked by about 9
light-harvesting complexes (74). Comparison shows that both maps have similar
features in the core (asterisks, Fig. 3-8, A and B), and a similar total surface area.
The overall shape, however, is significantly different, with the Galdieria PSI-

70
LHCI complex being rounder and showing no visible gap between the PSI core
and LHC belt. A comparison can also be made with the high-resolution X-ray
structure of plant PSI (75).
Figure 3-8C shows an approximate fit of the map (green overlay). The
plant structure fits in the right side of the 2D map of Galdieria. The fitting of the
X-ray structure into our 2D map was done using the positions of similar densities
in the Chlamydomonas and Galdieria 2D maps (indicated by dotted block arc
shape and three astericks in Fig. 3-8, A and B) as fixed points. Details of the
fitting are described in (34). The stromal ridge composed of PsaE, PsaC and PsaD
is clearly visible in Fig. 3- 4, A, B and C (dotted block arc shape) and was
matched with the X-ray structure position of these subunits. This indicates that
Galdieria PSI binds at least four closely attached light-harvesting complexes.
Although an exact estimation of the number is difficult, a possible estimation
would lead to 7-9 LHCI/PSI. We propose that the additional LHC’s form a second
layer around the PSI core similar to (36), but alternate arrangements are also
possible. It is clear, however, that most of the about 7-9 light-harvesting proteins,
must be at one side of the core complex, similar to C. caldarium (36).
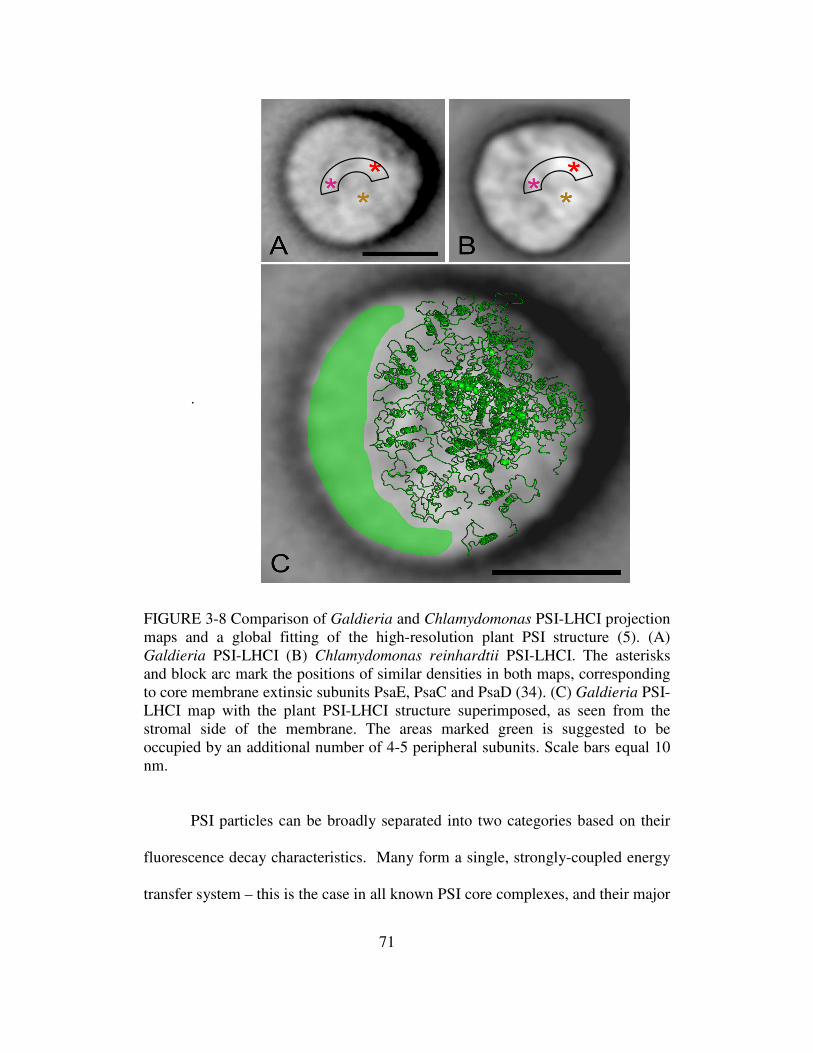
71
.
FIGURE 3-8 Comparison of Galdieria and Chlamydomonas PSI-LHCI projection maps and a global fitting of the high-resolution plant PSI structure (5). (A) Galdieria PSI-LHCI (B) Chlamydomonas reinhardtii PSI-LHCI. The asterisks and block arc mark the positions of similar densities in both maps, corresponding to core membrane extinsic subunits PsaE, PsaC and PsaD (34). (C) Galdieria PSI-LHCI map with the plant PSI-LHCI structure superimposed, as seen from the stromal side of the membrane. The areas marked green is suggested to be occupied by an additional number of 4-5 peripheral subunits. Scale bars equal 10 nm.
PSI particles can be broadly separated into two categories based on their
fluorescence decay characteristics. Many form a single, strongly-coupled energy
transfer system – this is the case in all known PSI core complexes, and their major

72
decay lifetimes range from about 18 ps in the green alga C. reinhardtii to more
than 40 ps in the cyanobacterium S. platensis (76). Trapping lifetimes in these
complexes are determined largely by chlorophyll sites whose transition energies
have been lowered due to excitonic coupling; complexes with few of these “red
chlorophylls” (such as C. reinhardtii and Synechocystis) show faster trapping,
while those with a larger number (like T. elongatus and S. platensis) show slower
trapping. Exciton transfer from these red-shifted pigments to P700 requires the
system to “borrow” thermal energy from the environment; trapping from these
red-shifted states shows strong temperature dependence and is often rate-limiting.
In addition, the iron stress-induced PSI-IsiA complexes formed by many
cyanobacteria form strongly-coupled light-harvesting systems with trapping
lifetimes that can be limited by exciton migration (rather than thermally-assisted
exciton escape from red sites), but are typically shorter than 50 ps (72, 77-79).
In green algae and plants, the PSI core is moderately coupled to extrinsic
light-harvesting complexes such as the PSI-LHCI complexes (67, 80, 81). In
addition to the fast trapping from excitons arising in the PSI core, the PSI-LHCI
complexes samples of green algae and plants exhibit major fluorescence decay
phases with lifetimes of 100 ps or more, which arise from excitations that begin in
the extrinsic LHCI proteins and whose transfer to P700 is limited by a pigment
gap at the PSI-LHCI interface.
Taken in isolation, the fluorescence decay data from Galdieria PSI are
somewhat enigmatic – its room-temperature decay kinetics are dominated by a
single trapping phase, similar to the tightly coupled cyanobacterial PSI-IsiA

73
complex and the PSI core complexes described above. This single trapping
phase, however, is remarkably slow, and would suggest a large pool of red
chlorophylls that substantially retards trapping at room temperature. At the same
time, Galdieria is a eukaryote and is known to contain LHCI genes but the
>100ps decay components typically associated with excitations beginning in
LHCI appear to be missing (39). Another interpretation is suggested by the EM
images; LHCI proteins are clearly visible in these images, but their association
with PSI appears to be tighter than in green algae and higher plants (73, 82). This
raises the possibility that exciton transfer in PSI-LHCI from Galdieria could be
similar to the PSI-IsiA antenna system in cyanobacteria, where the addition of
extrinsic antenna complexes dramatically increases the PSI absorption cross-
section without introducing the substantial 100-200ps trapping components
typically associated with excitons originating in LHCI (72, 77-79). The fairly
slow trapping lifetime of Galdieria PSI is probably attributable in part to red-
shifted chlorophyll sites (as in the case in T. elongatus and S. platensis). Our
fluorescence emission spectra (Fig. 3-1) clearly indicate that Galdieria has a large
red chlorophyll pool as found in T.elongatus. Another contribution to the slower
trapping could come from the increase in the size of the antenna system and hence
the lengthening of random exciton walks that terminate at P700 – a similar effect
is probably responsible for the 38-ps trapping time observed in PSI-IsiA
supercomplexes from T. elongatus (Chauhan et al., unpublished data).
These spectroscopic and structural features can be placed within an
ecological context by contrasting Galdieria with other photosynthetic eukaryotes.

74
Many of these species live at fairly low cell densities and must cope with variable
light conditions including photoinhibition. Higher plants and green algae, have
evolved sophisticated cellular machinery for state transitions that regulate the
association of LHCII with PSI and PSII based on ambient light conditions, as
sensed by the redox state of the plastoquinone pool (83-85).
In contrast, Galdieria thrives in hot, acidic crevices, forming a dense cell
layer in volcanic rocks and endolithic habitats (33). Besides being an extreme
environment in terms of temperature and acidity, this habitat is also very stable
and provides consistent low-light conditions. Laboratory cultures of Galdieria
are strongly inhibited by high-light conditions (>40 µmol photon m-2 s-1), while
growth is fairly robust under low-light conditions (15-35 µmol photon m-2 s-1) and
extremely high cell densities (1.7 to 5 g of dry weight from 1L of cell culture) can
be reached under photoautotrophic growth (Thangaraj et al., unpublished data).
Similar high cell densities of Galdieria sulphuraria have been reported previously
(57), while cell growth inhibition at high illumination has been observed for
Galdieria and other Cyanidiales (86). In endolithic habitats, less than 1% of the
surface photon flux is available for photosynthesis (33). These factors suggest that
Galdieria's photosynthetic systems may have been optimized over 1.3 billion
years for low-light conditions. Consistent with this static, low-light environment,
Galdieria lacks an LHCII gene, suggesting that it may have lost the ability to
adapt to changing light conditions via state transitions. Further evidence for an
antenna system adapted to static low-light conditions is provided by time-resolved
spectroscopy and augmented by electron micrographs, which show a more
75
continuous electron density between PSI and LHCI than is seen in the more
loosely-coupled complexes from green algae and higher plants. Thus, the PSI-
LHCI complex in Galdieria forms a functionally tightly-coupled complex, in
which trapping is faster and more efficient than in the PSI-LHCI complexes in
green algae and higher plants.
This is consistent with a scenario in which Galdieria PSI diverged from an
ancient photosynthetic eukaryote with loosely-attached antenna complexes which
colonized static, low-light endolithic habitats and adapted to these conditions over
billions of years. The selective pressure of growth under low-light conditions led
to tighter functional coupling between lhcr proteins and the PSI core in Galdieria
as increased photosynthetic efficiency was more critical for survival, possibly at
the expense of regulatory flexibility via state transitions or other mechanisms.
This study has demonstrated that the oligomeric state of PSI in Galdieria
is a monomer, with a belt of LHC proteins functionally tightly coupled to the PSI
core. This is the first eukaryotic PSI-LHCI system for which a tight functional
coupling has been reported. Our results indicate that, despite the broad
evolutionary conservation of proteins involved in oxygenic photosynthesis, rather
dramatic adaptations are possible under extreme conditions. Because of its
ecological niche in a static, low-light environment, Galdieria sulphuraria appears
to have reorganized the PSI-LHCI interface in a way that improves light-
harvesting efficiency. Future studies will need to address whether the close
coupling observed in this study is the result of a static, unregulatable arrangement
of auxillary antenna proteins, or whether Galdieria possesses other means

76
(besides traditional state transitions) of adapting its light-harvesting machinery to
variable light conditions. As more photosynthetic extremophiles are characterized
in detail, we will surely learn more about the adaptive diversity that exists
alongside the remarkable universality of oxygenic photosynthesis.

77
CHAPTER 4 CHARACTERIZATION OF SUBUNITS OF
PHOTOSYSTEM II, A LARGE INTEGRAL MEMBRANE PROTEIN
COMPLEX FROM GALDIERIA SULPHURARIA BY TOP-DOWN MASS
SPECTROMETRY
INTRODUCTION
Mass spectrometry (MS) is an indispensable tool in proteomics research, because
of its ability to analyze complex biological samples. Other techniques such as
two-dimensional gel electrophoresis and protein microarrays have failed to
provide an in-depth insight, as seen in mass spectrometry (87). Most of proteomic
studies to-date has used “bottom up” mass spectrometry experiments. In this
approach, the intact protein is cleaved into peptides using proteases (e.g., trypsin)
and the unambiguous identification of proteins is carried out by an agreement
between measured mass of four or five peptides with that of the calculated masses
of the proteins in the database. A newer and emerging “top-down” MS approach
involves gas-phase ionization of intact proteins and subsequent high-resolution
mass measurement of intact protein ions. Following this, the intact proteins are
further fragmented inside the mass spectrometer without prior digestion. This
approach scans the entire sequence of the protein under examination, and provides
a more complete characterization of protein isoforms and any post translational
modifications than the bottom-up proteomics. This chapter focuses on the analysis
of photosystem II (PSII) of Galdieria by top-down mass spectrometry. To the best
of our knowledge, this is the first study to provide an extensive analysis on the
identification of post translational modifications of photosystem II subunits in red

78
algae, in particular and in photosystem II, in general. The results of this study
have been published in Thangaraj et al. (October 2010) in Proteomics journal.
Top-down proteomics uses high-resolution Fourier-transform ion
cyclotron resonance mass spectrometry (FT-MS) for mass analysis of intact
proteins and dissociation derived product ions for complete primary structure and
post-translational modification (PTM) assignment. In recent years, top-down mass
spectrometry has gained acceptance among researchers for their improved
sequence coverage, sensitivity and accuracy in protein identification and
modification. For wider applicability, top-down mass spectrometry should address
the entire proteome including the membrane proteins that constitute 20 to 30% of
the ORF’s in fully sequenced genomes (87), with their important functions
ranging from intracellular communication to small molecule transport. Integral
membrane proteins have transmembrane regions that pose major challenges to
mass spectrometry as they tend to be deficient in amino acids that carry charge
and limited in solubility in aqueous solvents. Thus it can be argued that the most
effective way to characterize these domains is to include them as part of the intact
protein in a top-down experiment (88). To date, studies have shown that integral
membrane proteins can be analyzed by ESI-MS with mass accuracies comparable
to those achievable for soluble proteins, and top-down high resolution FT-MS has
been demonstrated for both polyhelix bundle and transmembrane porin motifs
(89-91).
In the past two decades, PSII complexes from cyanobacteria, green algae
and higher plants have been extensively studied by mass spectrometry (89, 92).

79
Recently, high-resolution FT-ICR was applied to a number of different integral
membrane proteins including polyhelix bundles and a porin (91). In this study we
have systematically applied FT-MS to study the composition of PSII from the
eukaryotic red alga Galdieria. A total of sixteen peripheral and small integral
subunits were analyzed by high resolution FT-MS using both CAD and ECD,
allowing assignment of precursor and product ions to mass accuracy typically less
than 5 ppm. While the Galdieria PSII integral core complex is very similar to that
of other eukaryotes, the peripheral OEC composition is more similar to
cyanobacteria. The detection of five peripheral subunits including Psb27 and
Psb28 in the red algal preparation may suggest heterogenous populations of PSII
complexes.
MATERIALS AND METHODS
Cell culture and PSII isolation
Galdieria sulphuraria were grown at 42° C in 11 L capacity flasks containing a
10X medium at pH 2.0, with a constant supply of air, CO2 and light irradiances of
25 µmol photon m-2 s-1 (Li-cor, model LI-189). For details on Galdieria cell
culture, cell breakage, PSII isolation, please refer to chapter 2 (Fig. 4-1).
The original specimen referred to as Galdieria sulphuraria strain 074 was
originally collected at Mount Lawu, Java, Indonesia and was a gift from
Dr.Christine Oesterhelt, Max-Planck-Institut für Molekulare Pflanzenphysiologie,
Am Mühlenberg 1, 14476 Golm, Germany, and was thought to be a single strain.
But a later study to test the capacity of Galdieria's growth under heterotrophic
conditions revealed that there were two strains in the sample (93). Under
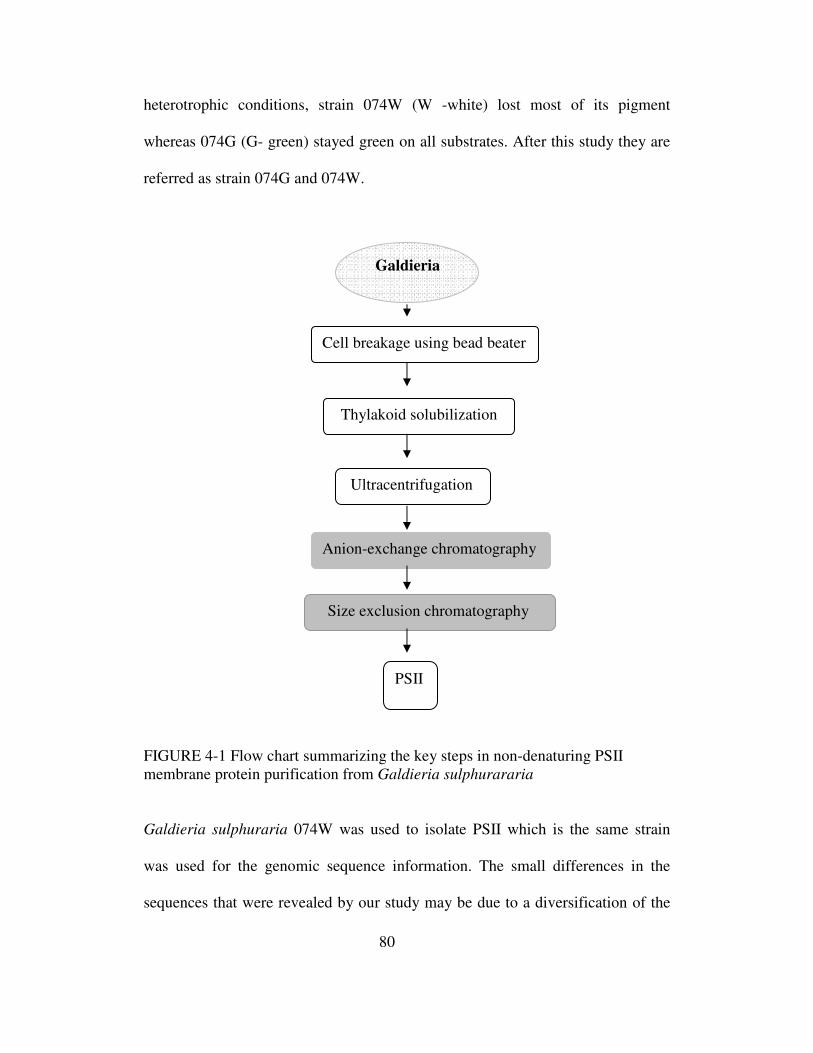
80
heterotrophic conditions, strain 074W (W -white) lost most of its pigment
whereas 074G (G- green) stayed green on all substrates. After this study they are
referred as strain 074G and 074W.
FIGURE 4-1 Flow chart summarizing the key steps in non-denaturing PSII membrane protein purification from Galdieria sulphurararia
Galdieria sulphuraria 074W was used to isolate PSII which is the same strain
was used for the genomic sequence information. The small differences in the
sequences that were revealed by our study may be due to a diversification of the
Galdieria
Cell breakage using bead beater
Thylakoid solubilization
Ultracentrifugation
Anion-exchange chromatography
Size exclusion chromatography
PSII

81
initial strain due to different growth conditions in the laboratories. The genome
was sequenced from the laboratory strain that had been grown under
photoheterotrophic conditions, whereas the PSII was isolated from the strain that
had been maintained under photoautotrophic growth conditions since it was
originally isolated.
Reverse phase column chromatography
Samples were precipitated using acetone. The suspension was split into two
centrifuge tubes (125 µL each) and 1 mL 80% acetone in water (-200C stock)
added to each tube, prior to vortex mixing (1 minute) and incubation at -200C for
1 hour. Precipitated protein was recovered by centrifugation (10,000 x g) and the
supernatant removed. Pellets were dried briefly to allow evaporation of residual
acetone (5 minutes, room temperature and pressure) and dissolved in 90% formic
acid (total 100 µL) for immediate injection into an HPLC system prepared for
reversed phase chromatography(63, 94). A column (5 µm, 300 Å PLRP/S, 2 x 150
mm; Varian) is previously equilibrated in 95% buffer A (0.1 % TFA in water),
5% B (0.05% TFA; 50% acetonitrile; 50% isopropanol) at 100 µL/minute at 400C
for 30 minutes prior to sample injection. The column is eluted with a step gradient
of increasing buffer B as previously described (63) and the eluent passed through
a UV detector (280 nm) prior to a liquid flow splitter delivering 50 µL/minute to a
low resolution mass spectrometer and 50 µL/minute to a fraction collector (1
minute/fraction). Fractions collected into microcentrifuge tubes were stored at –
800C prior to off-line high-resolution nanospray analysis. LC-MS+ experiments
were performed using a triple quadrupole instrument (AP III+, Applied
82
Biosystems) tuned and calibrated using a PEG mixture as previously described
(89). Mass spectra were recorded by scanning from m/z 600 – 2300 with orifice
voltage ramped with mass (60 – 120) using a 0.3 Da step size and a scan speed of
6 sec. Data were processed using BioMultiview 1.3.1 software (Applied
Biosystems).
High resolution FT-MS mass spectrometry
HPLC fractions collected during LC-MS+ were subjected to direct infusion
nanospray analysis. Samples were individually loaded into 2 µm i.d. externally-
coated nanospray emitters (Proxeon, Cambridge, MA) and desorbed using spray
voltage of between 1.7-1.9 kV (versus the inlet of the mass spectrometer) using
the nanospray source supplied by the manufacturer. These conditions produced a
flow rate of 20 – 50 nL/min. All samples were analyzed using a hybrid linear ion-
trap/FT-ICR mass spectrometer (7 T, LTQ FT Ultra, Thermo Scientific, Bremen,
Germany) operated with standard (up to m/z 2000) or extended mass range (up to
m/z 4000). Ion transmission into the linear trap and further to the FT-ICR cell was
automatically optimized for maximum ion signal. The ion count targets for the
full scan FT-ICR and MS2 FT-ICR experiments were 2 x 10⁶. The m/z resolving
power of the FT-ICR mass analyzer was set at 100,000 (defined by m/∆m50% at
m/z 400) unless otherwise stated. Individual charge states of the multiply
protonated protein molecular ions were selected for isolation and collisional
activation in the linear trap followed by the detection of resulting fragments in the
FT-ICR cell (CAD). For the CAD studies, the precursor ions were activated using
normalized collision energy settings in the range 10 - 15 at the default activation

83
q-value of 0.25. For ECD studies precursor ions were transmitted to the FT-ICR
cell and electrons introduced with normalized energy in the range 5 -10, 10 ms
duration and 50 ms delay. FTMS data was derived from an average of between 50
- 200 transient signals. The analysis of Psb27 was performed on a hybrid linear
ion-trap Fourier-transform orbitrap mass analyzer (LTQ XL Orbitrap ETD;
Thermo Scientific, Bremen, Germany) similarly to the LTQ-FT experiments.
Thermal dissociation (CAD) was performed after the ion-trap in the C-trap (high-
energy collisional dissociation; HCD). Electron transfer dissociation (ETD) was
performed using fluoranthene anions produced in the instruments chemical
ionization source according to manufacturer’s instructions. Orbitrap product ion
spectra were recalibrated using prominent y- and z- ions.
FTICR and FT-Orbitrap mass spectra were processed using ProSightPC
software (ProSightPC 2.0, Thermo Scientific, Bremen, Germany) to produce
monoisotopic mass lists (s/n = 1.1, fit 0%, remainder 0%, average table set to
averagine) that were then assigned to protein sequences with various post-
translational modifications. Protein identification was achieved by generating
sequence tags (sequence tag compiler and sequence tag searching tool) and
matching these tags to a Galdieria database. Product ion assignments for known
proteins were made using the software operated in single protein mode with a 10
ppm mass accuracy threshold and with the Deltamass feature deactivated.
ProSightPC reported mass accuracy of assigned monoisotopic mass values of
precursor and product ions and the probability that some other database entry
might match the same dataset (P score).

84
Galdieria PSII genomic annotation
For the identification and annotation of chloroplast-endcoded PSII subunits, a
collection of all open reading frames (ORFs) identified on the two supercontigs
stig_35 and stig_158 from the Galdieria sulphuraria Genome Project
(http://genomics.msu.edu/galdieria) was prepared after closure of all gaps (K.
Krause, A. Weber et al., publication in preparation). This ORF collection was
searched for sequences with homology to the amino acid sequences of PSII
subunits from Thermosynechococcus elongatus and Arabidopsis thaliana or other
higher plants. The nuclear-encoded PSII subunit genes were identified by
searching the translated Galdieria nucleotide databases for sequences orthologous
to the remaining subunits. The presence of predicted target peptides were
analysed using the TargetP 1.1 Server (http://www.cbs.dtu.dk/services/TargetP).
All nucleotide sequences were conceptually translated and nucleotide as well as
protein sequences were prepared for annotation in Genbank by using Sequin
Version 9.50 (provided by Genbank). The accession numbers are: psbA -
GU474525; psbB - GU474526; psbC - GU474527; psbD-GU474528; psbE -
GU474529; psbF - GU474530; psbH - GU474531; psbI - GU474532; psbJ -
GU474533; psbK - GU474534; psbL - GU474535; psbM - GU474520; psbN -
GU474536; psbO - GU474521; psbP - GU474522; psbQ - GU971652; psbQ’ –
GU721104; psbT - GU474537; psbU - GU474523; psbV - GU474538; psbW -
GU474539; psbX - GU474540; psbY - GU474541; psbZ - GU474542; psb27 -
GU474524. Nuclear encoded subunits - PsbM, PsbO, PsbP, PsbQ, PsbQ’, PsbU,
Psb27. Chloroplast encoded subunits – PsbA, PsbB, PsbC, PsbD, PsbE, PsbF,
85
PsbH, PsbI, PsbJ, PsbK, PsbL, PsbN, PsbT, PsbV, Psb28 (PsbW), PsbX, PsbY
and PsbZ.
Experimental design
Separate Galdieria PSII preparations have been analyzed by LC-MS+ four times
(four biological replicates). Each top-down mass spectrometry experiment
typically included CAD analyses of at least two different charge states and one
ECD (ETD) experiment. Results from the experiment that yielded the most
product ions are presented.
RESULTS
Chromatographic separation of PSII subunits
The primary reversed phase LC-MS+ separation yielded a retention map that was
annotated with protein identities where they are known and intact masses where
they remain unknown (Fig. 4-2). Mass accuracy on the low-resolution quadrupole
instrument was typically 100 ppm and the spectra were used to guide targeted top-
down high-resolution experiments to fully define primary structure and post-
translational modifications of PSII subunits. The physical basis of the separation
relies upon hydrophobicity and thus the first proteins to elute are the hydrophilic
peripheral PSII subunits PsbO, PsbU, PsbV, Psb28 (PsbW) and Psb27 (‘PsbZ-
like’). These were followed by a set of proteins in the 16 kD class, identified as
phycobiliproteins (ApcA, ApcB, ApcD, ApcF, CpcA, CpcB, CpcG) and a pair of
55 kD proteins identified as AtpA and AtpB of ATP synthase (data not shown).
Association of phycobiliproteins with PSII is predictable while ATP synthase is
probably a contaminant of the preparation. The remainder of the chromatogram
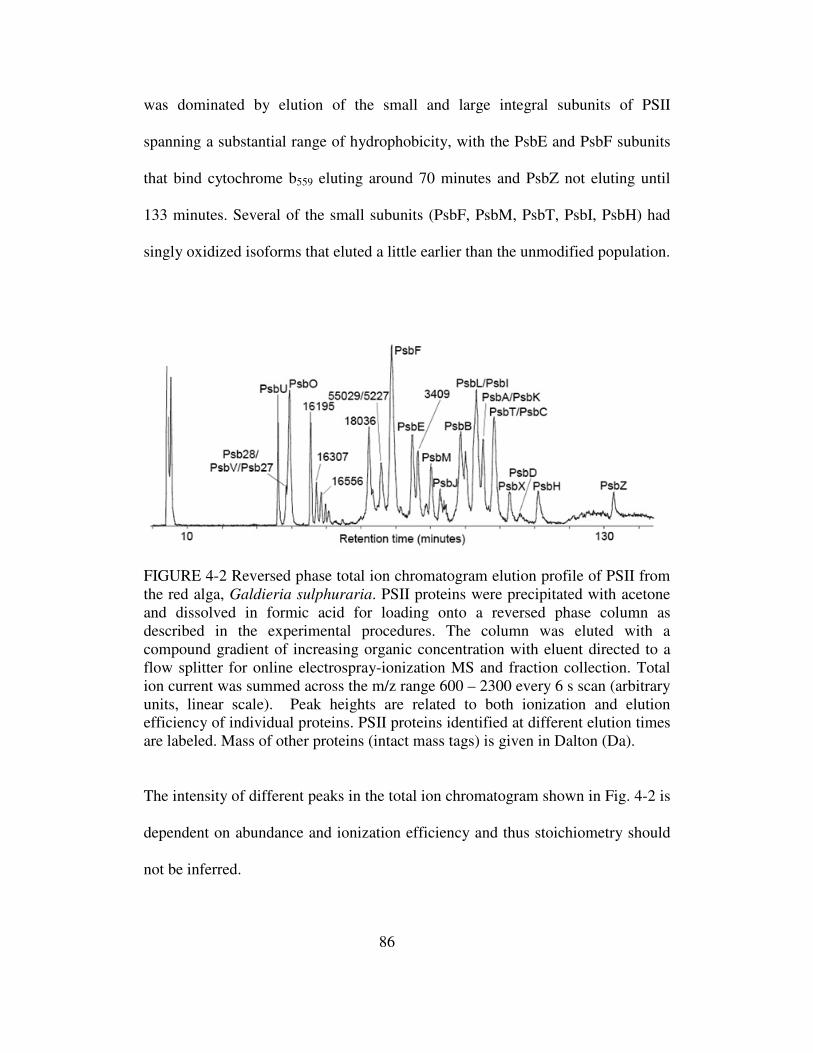
86
was dominated by elution of the small and large integral subunits of PSII
spanning a substantial range of hydrophobicity, with the PsbE and PsbF subunits
that bind cytochrome b559 eluting around 70 minutes and PsbZ not eluting until
133 minutes. Several of the small subunits (PsbF, PsbM, PsbT, PsbI, PsbH) had
singly oxidized isoforms that eluted a little earlier than the unmodified population.
FIGURE 4-2 Reversed phase total ion chromatogram elution profile of PSII from the red alga, Galdieria sulphuraria. PSII proteins were precipitated with acetone and dissolved in formic acid for loading onto a reversed phase column as described in the experimental procedures. The column was eluted with a compound gradient of increasing organic concentration with eluent directed to a flow splitter for online electrospray-ionization MS and fraction collection. Total ion current was summed across the m/z range 600 – 2300 every 6 s scan (arbitrary units, linear scale). Peak heights are related to both ionization and elution efficiency of individual proteins. PSII proteins identified at different elution times are labeled. Mass of other proteins (intact mass tags) is given in Dalton (Da).
The intensity of different peaks in the total ion chromatogram shown in Fig. 4-2 is
dependent on abundance and ionization efficiency and thus stoichiometry should
not be inferred.
87
Table 4-1 lists intact mass tags (IMTs) that were assigned to PSII subunits
based upon coincidence of measured average mass with calculated average mass
based upon primary structure and limited post-translational modification. These
assignments remain coincidental with little statistical confidence until a high-
resolution top-down analysis is completed (Table 4-2).

88
TABLE 4-1 Average masses of PSII subunits from low resolution LC-MS+
PSII protein subunit
Genbank Accession
#
# TMHa
Elution
Time (min.)
Calculated average
mass (Da)
Experimentally determined
average mass (Da)
Proposed post-translational
modification
Peripheral (extrinsic) subunits
PsbOb(33 KDa)
GU474521 0 39.4 28816.4 28821 1 – 21 removed, one disulfide bond
PsbUb GU474523 0 36.1 10585.9 10587 1- 81 removed PsbV (Cyt c 550)
GU474538 0 38.4 15704.2 15704 1-30 removed 168-177 removed
+ heme Psb27b (‘PsbZ-like’)
GU474539 0 38.4 nac 12820 na
Psb28 (PsbW)
GU474524 0 38.9 13246.0 13247 -Met1
Smaller integral membrane subunits PsbE GU474529 1 74.8 9392.5 9393 -Met1 PsbF GU474530 1 68.8 4971.8 5015 -Met1 + acetylation PsbH GU474531 1 111.1 7483.9 7485 - Met1 PsbI GU474532 1 93.2 4476.3 4505 Formyl-Met1 PsbJ GU474533 1 82.8 3917.6 3960 -Met1+acetylation PsbK GU474534 1 95.1 4255.2 4256 1-8 removed PsbL GU474535 1 93.2 4247.9 4290 -Met1 + acetylation
PsbMb GU474520 1 80.2 4599.3 4600 1-38 removed PsbT GU474537 1 97.8 4217.4 4245 Formyl-Met1 PsbX GU474540 1 102.7 4534.5 4563 Formyl-Met1 PsbZ GU474542 2 132.9 6826.4 6855 Formyl-Met1
Larger integral membrane subunits
PsbA (D1)
GU474525 5 95.5 38160.7 38184 -Met1+ acetylation, 345-360 removed
PsbB (CP 47)
GU474526 5 88.7 56558.8 56551 -Met1+acetylation
PsbC (CP 43)
GU474527 6 97.8 50588.3 50927 1-14 removed
PsbD (D2)
GU474528 6 106.0 39344.1 39346 Met1+acetylation
a. Transmembrane helices, b. Nuclear encoded subunits, c Not available Abbreviations: -Met1 – Methionine missing at position # 1; +Formyl-met1 – Formyl methionine at position # 1 in the N-terminus
Out of around 40 detected IMT’s, 20 PSII subunits were assigned with different
PTMs. The 3409 Da IMT eluting at 78 minutes is potentially a PSII subunit but
has so far remained unidentified.
89
Larger integral membrane subunits
The four large subunits (PsbA, PsbB, PsbC and PsbD), which account for twenty-
two of the total thirty four transmembrane alpha helices in PSII, eluted between
88 and 106 minutes along with other smaller subunits (Table 4-1). The large
subunits PsbA, PsbB, PsbC and PsbD measured 38184, 56551, 50927 and 39350
Da respectively, largely consistent with their gene sequences and known N- and
C- terminal post-translational modifications (Table 4-1). The experimentally
determined average mass of 38184 Da for PsbA was consistent with the removal
of initiating methionine at the N-terminus with acetylation of Thr 2, and removal
of 15 amino acids at the C-terminus (Table 4-1) in conservation with other
species. The difference of 23 Da with the calculated average mass (38160.7 Da)
could be due to DNA sequence differences between strains. In PsbD, the
difference between the calculated (39344.1 Da) and experimental (39346 Da)
average masses is within experimental measurement error (Table 4-1). For
subunit PsbB, the experimentally derived mass (56551 Da) is in good agreement
with the calculated mass (56558.8 Da) taking into account the loss of initial
methionine and N-terminal acetylation (Table 4-1). In PsbC, if 14 amino acids are
removed to form a processed PsbC with a free N-terminus in conservation with
higher plants, the calculated mass (50588.3) is lower than measured (50888 Da)
by 300 Da, indicating either divergent N-terminal processing or some other DNA
sequence discrepancy. Despite minor inconsistencies the intact mass tags of the
larger integral subunits can be assigned with confidence. Since the main focus

90
of this study was to identify and characterize the smaller integral (< 10 kDa) and
the peripheral subunits constituting PSII in Galdieria we did not perform further
experiments on the large subunits.
Peripheral subunits
Of the three (PsbO, PsbU, PsbV) OEC subunits identified in Galdieria, PsbO and
PsbU are encoded by the nucleus and carry an N- terminal signal peptide. PsbO
has a signal peptide consisting of its first 21 amino acids so the mature form has
242 amino acids. The experimentally determined monoisotopic mass of
28796.7520 Da could be reconciled (∆ = 2.6387 ppm) with the calculated
monoisotopic mass of 28796.67415 Da with inclusion of the formation of a
disulfide bond (-2.01565 Da) between Cys23 and Cys47 (Figs. 4-2 and 4-3A).
Assignment of product ions from a CAD experiment of the disulfide linked
mature protein yielded 11 y- and 9 b- ion matches within a 10 ppm tolerance and a
consequent P score of 1.41E-26 (Fig. 4-3A, Table 4-2). In the case of PsbU, the
first 81 amino acids of the signal peptide are cleaved at the N terminus, to a form
a mature protein of 93 amino acids, with a calculated monoisotopic mass of
10579.4347 Da (Table 4-2). Top-down CAD analysis of the N-terminal truncated
protein confirmed the primary structure of PsbU with a experimentally
determined monoisotopic mass of 10579.4648 Da, within 5 ppm of the calculated
monoisotopic mass (∆ = 2.8361 ppm), and a CAD experiment yielded 32 b- and
23 y- product ions for a P score of 5.26E-75 (Fig. 4-3B, Table 4-2). The third
extrinsic subunit PsbV was assigned to an intact mass tag of 15704 Da with
proposed modifications including removal of 30 amino acid residues from the N-

91
terminus, removal of 10 residues from the C-terminus and attachment of a
covalently bound heme group (615.16947 Da) (Fig. 4-2, Table 4-1). Analysis of
the high- resolution CAD dataset for PsbV gave a mass difference of -2.0602 Da
(-131.2860 ppm) with 11 b- and 15 y- ions matched. Further optimization of
match between measured and calculated mass was reached by changing Thr 80 to
Val (mature protein numbering) significantly increasing coverage with 19 b- and
24 y- product ions matched and a P score of 3.32E-45 (∆ = 5.1595 ppm) (Fig. 4-
3C, Table 4-2).
Besides the 3 subunits of the OEC, 2 other peripheral subunits were
identified, Psb27 and Psb28. In the primary LC-MS+ analysis, a hydrophilic
protein eluted at 39 minutes with an intact mass tag of 13247 Da and was
assigned as Psb28 with removal of Met1 (Fig. 4-2, Table 4-1). This protein is
similar to the PsbW identified in Synechocystis sp. and will be referred to as
Psb28 hereafter (see discussion). Psb28 was assigned to a monoisotopic mass
peak of 13237.7755 Da (Table 4-2) using top-down mass spectrometry,
confirming the identity and processing with 4 b- and 17 y- product ions and the
precursor matched below 5 ppm (∆ = 4.6250 ppm) for a P score of 9.55E-28
(Table 4-2). The identity of Psb28 was also confirmed by ECD (Fig. 4-4) with 57

92
TABLE 4-2 Monoisotopic masses of PSII subunits from high resolution
Fourier-transform mass spectrometry (FT-MS)
PSII
protein subunit
Calculated Monoisotopi
c mass (Da)
Experimental Monoisotopic
mass (Da)
Mass difference
Delta (ppm)
P-score Confirmed post-
translational modification
Peripheral (extrinsic) subunits PsbO 28798.6898 28796.7520 2.6387 1.41E-26 1 – 21 removed,
one disulfide bond
PsbU 10579.4347 10579.4648 2.8361 5.26E-75 1 – 81 removed PsbV
(Cyt. c550) 15692.8033 15692.7162 5.1594 3.32E-45 1 - 30 removed,
heme (+615.16947), Thr80 to Val
(- 1.972) 1-10 removed
from C-terminus as in C.
caldarium Psb27
(PsbZ-like) 12811.4000 12811.3742 0.2939 8.93E-42
1.9E-100a
unknown N-terminus
1375.65 Da on Ala19
Psb28 (PsbW)
13237.6972 13237.7755 4.6250 9.55E-28 1.0E-152a
-Met1
Smaller integral membrane subunits PsbE
(α-cyt. b559) 9386.7896 9386.8317 4.4238 2.81E-16 -Met1
PsbF (β-cyt. b559)
5010.6243 5010.6386 3.8488 6.95E-88 -Met1 + acetylation
PsbH 7479.1312 7479.1417 1.2749 1.53E-49 - Met1 PsbI 4501.4234 4501.4367 2.8954 6.85E-66 formylMet1 PsbJ 3957.1113 3957.1322 5.2626 3.25E-61 -Met1 +
acetylation PsbK 4252.5198 4252.5336 3.2322 2.64E-59 1 – 8 removed PsbL 4287.2771 4287.2888 2.6928 2.15E-45 -Met1 +
acetylation PsbM 4596.4123 4596.4282 3.4407 2.21E-68 1-38 removed PsbT 4242.3140 4242.3284 3.2844 2.23E-44 formylMet1 PsbX 4559.5632 4559.5807 3.7467 3.11E-45 formylMet1 PsbZ 6849.9577 6849.9597 0.0925 7.55E-42 formylMet1
a. From ECD/ETD experiments.

93
FIGURE 4-3 Top-down mass spectrometry of oxygen evolving complex subunits. Selected fractions were analyzed by static nanospray on a 7 Tesla LTQ-FT Ultra. Collisionally activated dissociation experiments on isolated precursor ions yielded complex tandem mass spectra that were matched to primary protein sequences using ProSightPC. The ion isolation used for each subunit is shown on the left while the b- and y- product ion assignments observed at 10 ppm tolerance are shown superimposed on the sequence to the right. A. For subunit PsbO, an N-terminal signal sequence of 21 amino acids has been removed from the precursor sequence and highlighted Cys residues have been oxidized (-1.00782509 Da each) to account for disulfide bond formation. In the mature protein, 20% of product ions were matched to 19 b- and 10 y- ions giving a P score of 1.41E-26. B. In PsbU, an 81 amino-acid signal peptide was removed from the precursor sequence. 25% of product ions were matched to 32 b- and 22 y- ions giving a P score of 5.26E-75. C. In PsbV, 30 residues were removed from the N-terminus and 10 from the C-terminus of the precursor sequence to nominally match the measured intact mass tag. Change of Thr80 to Val optimized match of observed high-resolution precursor and product ion masses with 19 b- and 23 y- ions for a P score of 3.32E-45.
94
c- and 39 z- product ions, and agreement of calculated and measured
monoisotopic masses for the precursor ion within 5 ppm (∆ = 4.6250 ppm) for a P
score of 1.02E-152 (Fig. 4-4, Table 4-2). An intact mass tag of 12820 Da was
assigned to Psb27 (psbz-like) using top-down mass spectrometry after attempts to
assign it with low-resolution data were unsuccessful. In Fig. 4-5, we show the
assignments for dissociation experiments performed on an LTQ-Orbitrap (HCD
and ETD). Both experiments yield b- and y-, and c- and z- ions that support
complete agreement with the C-terminal sequence over most of the polypeptide
chain. However, the measured data strongly suggests that the sequence reported
for Psb27 has some errors towards its N-terminus and we have therefore
represented this region as an unknown modification on the Ala residue shown in
Fig. 4-5 of mass 1375.65 Da to optimize b- and c- ion matches. Using this
strategy we matched the experimental monoisotopic mass of 12811.3742 Da to
that calculated at <1 ppm, and matched 12 b- and 23 y- ions in the CAD (HCD)
experiment and 36 c- and 44 z- ions in the ETD experiment. The measured P
scores for each experiment (respectively) confirm the accuracy of the
identification (Fig. 4-5). The nature of the N-terminus is under further study.

95
FIGURE 4-4 Top-down mass spectrometry of subunit Psb28 (PsbW). A protein of average mass 13247 Da detected by LC-MS+, was analyzed by top-down FT-MS with ECD. The 14-charge m/z 947 precursor ion was isolated as shown inset left. The product spectrum is shown from m/z 650 – 1500, expanded between in the range 800 – 1200 and expanded again in the range m/z 960 - 990. As shown in the full range spectrum, the ion current is dominated by charge reduction to 13+ and to a lesser extent 12+ species. Careful inspection of lower abundance ions nevertheless reveals a very rich product ion spectrum across the m/z 800 – 1200 range, and at higher detail between m/z 960 and 990. After removal of the initiating Met residue, 61% of the product ions were matched to 57 c- and 39 z- ions for a final P score of 1.02E-152. Selected c- and z- ions are labeled. In a separate CAD experiment on a m/z 1020 precursor ion 23% of product ions were matched giving a P score of 9.55E-28 (not shown).

96
FIGURE 4-5 Top-down MS of subunit of Psb27 (PsbZ-like). A 12820Da IMT was confidently identified as Psb27 using top-down MS on an orbitrap mass analyzer with HCD (CAD) and ETD (ECD). (A) A 15-charge precursor of m/z 855 (ion isolation inset top right) was isolated and fragmented using HCD generating the compelx product ion mass spectrum shown (m/z 500-1400). The data were matched to the Psb27 sequence with the first Ala residue carrying with modification mass of 1375.65 Da to represent the as yet uncharacterized N-terminus of the protein. Briefly, 26% of product ions were matched to 12 b- and 23 y- ions for a P-score of 8.83E-42. (B). A 16-charge precursor of m/z 802 (ion isolation inset top right) was isolated and fragmented using ETD generating the complex product ion mass spectrum shown (m/z 300-1600). The data were matched to the Psb27 sequence with the first Ala residue carrying a modification of 1375.65 Da to represent the as yet characterized N-terminus of the protein. In total, 28% of product ions were matched to 36 c- and 44 z-ions for a P-score of 1.9E-100.

97
Considerable effort was put into finding PsbQ, PsbQ’ and PsbP proteins,
genes for which can be identified in the Galdieria genome. Attempts to match
intact mass tags and top-down MS experiments in the 40 – 60 minute retention
range to these sequences were unsuccessful so one minute fractions across the
range 37 – 76 minutes were digested with trypsin and analyzed by nano-liquid
chromatography with tandem mass spectrometry. While these experiments
successfully identified many peptides from PsbO, PsbU, PsbV, Psb27, Psb28,
ApcA, ApcB, ApcD, ApcF, CpcA, CpcB, AtpA, AtpB as well as some of the
integral subunits there were no peptides detected for PsbQ, PsbQ’ or PsbP (data
not shown).
Smaller integral membrane subunits
In HPLC column run, subunits PsbE and PsbF of cyt b559 eluted at 74 and 68
minutes respectively. PsbE has 83 amino acids with a calculated average mass of
9392.5 Da in agreement with the protein eluting at 74 minutes (Fig. 4-2, Table 4-
1). This protein amounts to 9393 Da, has lost its initiating methionine, with no
other modifications. A top down CAD experiment confirmed the identity of PsbE
without met1 and with a monoisotopic mass of 9386.8317 Da. Also the CAD
dataset analysis provided 10b- and 8y- product ions as well as the precursor
matched within 5 ppm (∆m = 4.4238 ppm) giving a P-score of 2.81E-6 (Fig. 4-
6A, Table 4-2).
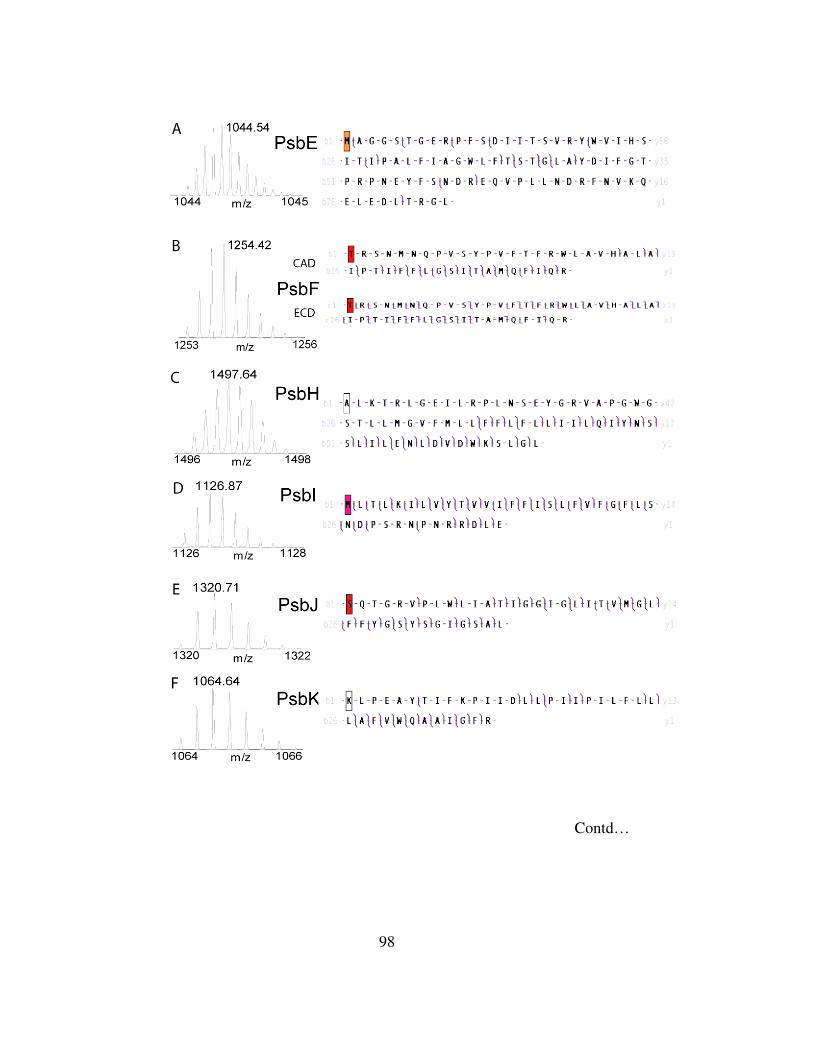
98
Contd…

99
FIGURE 4-6 Top-down mass spectrometry of small integral membrane subunits A. PsbE, B. PsbF, C. PsbH, D. PsbI, E. PsbJ, F. PsbK G. PsbL H. PsbM I. PsbT J. PsbX and K. PsbZ. The ion isolation used for CAD/ECD for each subunit is shown on the left, while the product ion assignments (b- and y- ions for CAD; c- and z- ions for ECD) observed at 10 ppm tolerance are shown on the sequence to the right. A shaded box around a Met residue in position 1 indicates retention of the formyl group as translated. A shaded box around a different residue implies removal of one or more amino-acid residues from the N-terminus and N-acetylation. An open box around the first amino acid implies removal of one or more amino-acids with no further modification. Percentage of matched product ions for small subunits: PsbE – 6%; PsbF – 36/51%; PsbH – 59%; PsbI – 29%; PsbJ – 23%; PsbK – 29%; PsbL – 38%; PsbM – 40%; PsbTc – 33%; PsbX – 35% and PsbZ – 44%. P scores are given in Table 2.
100
In LC-MS+ experiment, subunit PsbF corresponds to a average mass peak
of 5015 Da eluting at 68 minutes indicating a possibility of loss of met1 and
acetylation at the N-terminus (Fig. 4-2, Table 4-1). An absolute mass search for
the ECD data using Prosight PC 2.0 proposed different possible post translational
modifications (PTM): 1. Loss of met1 at the N-terminus 2. Possibility of
formylation or acetylation at met1 3. Loss of met1 and acetylation at N-terminus.
The first result yielded zero matching ‘c’ fragment ions, whereas, the second
result yielded zero matching ‘c’ fragment ion for formylation and one matching
‘c’ fragment ion for acetylation. However, the third result yielded 20c- and 25z-
product ions bringing down the mass difference between calculated (5010.6243
Da) and measured (5010.6386 Da) monoisotopic masses less than 5 ppm (∆ =
3.8488 ppm) and P-score of 6.95E-88 (Fig. 4-6B, Table 4-2). Also the presence of
overlapping c- and z- product ions confirms full sequence coverage and post
translational modification in the mature polypeptide. As in ECD analysis, similar
possible PTM’s were obtained as in CAD data using Prosight PC 2.0. In CAD
dataset, the confirmed PTM of acetylation of N-terminus after removal of met1 by
ECD analysis contained 18b- and 10y- product ions with a mass difference of
3.8488 ppm and a P-score of 1.14E-51(Fig. 4-6B, Table 4-2). Other possible post
translational modifications from CAD dataset yielded zero or one matching b-
fragment ion. This CAD result along with ECD provided strong evidence that the
identification and processing of PsbF is accurate in Galdieria.
In post-translationally modified form, PsbH is known to lose its met1 and
has a free N-terminus. The experimentally determined monoisotopic mass of
101
7479.1417 Da for the HPLC peak eluting at 111 minutes is within 5 ppm of the
calculated monoisotopic mass (7479.1312 Da) of mature PsbH (∆m = 1.2749
ppm) (Fig. 4-2; Table 4-2). Analysis of CAD dataset yielded 27b- and 4y- product
ions and a P-score of 1.53E-59 (Fig. 4-6C, Table 4-2). Additionally, CAD dataset
revealed that mature PsbH was fragmented more at the C-terminus than at the N-
terminus.
The experimentally determined average mass peak of 4505 Da of subunit
PsbI corresponds to the HPLC peak eluting at 94 minutes (Fig. 4-2, Table 4-1).
This mass differs from the calculated average mass by 28.7 Da consistent with the
addition of formyl group at the N-terminus in mature PsbI. Data analysis of top-
down CAD experiment using Prosight PC 2.0 software, with no formylation at the
N-terminus yielded 1b- and 25y- product ions. But after manual introduction of
formyl group at N-terminus, protein sequence coverage increased significantly
with 19b- and 26y- product ions, with an agreement between calculated and
measured monoisotopic mass dropping below 5 ppm and a P-score of 6.85E-66
(∆m = 2.8954 ppm) (Fig. 4-6D, Table 4-2).
The HPLC peak eluting at 84 minutes with an average measured mass of
3960 Da corresponds to a post translationally modified form of PsbJ unit, lacking
met1 and acetylated at the N-terminus (Fig. 4-2, Table 4-1). By using Prosight PC
2.0, analysis of the CAD dataset of the modified protein gave 23b- and 11 y-
product ions as well as the precursor matched within 10 ppm giving a P-score of
3.25E-61(∆m = 5.2626 ppm) (Fig. 4-6E, Table 4-2).

102
In PsbK, cleavage of the first 9 residues was reported in literature. The
experimentally determined average mass of 4256 Da for the HPLC peak eluting at
95 minutes differs from calculated mass by 0.8 Da, after removal of 8 amino-
acids at the N-terminus (Fig. 4-2, Table 4-1). To confirm this cleavage, a
precursor ion of 1064.64 Da was selected for CAD analysis and the product ion
spectrum recorded. Short sequence tags were generated using “Compile sequence
tag” feature in Prosight PC 2.0. Generated tags were used to search the entire
created Galdieria photosynthetic proteins database. A sequence tag of 8 amino-
acid residues matched with the untruncated PsbK nearby the C-terminus. Further
analysis of CAD dataset of untruncated PsbK gave 1b- and 10y- product ions with
a mass difference of -868.4960 Da between calculated and observed
monoisotopic masses. Also the detection of the y37 product ion in untruncated
PsbK protein along with the above mentioned data, confirmed a N-terminal
cleavage. So, by removing the first 8 amino-acid residues, the measured mass was
within 3.2322 ppm of that calculated monoisotopic mass. Furthermore, 18b- and
9y- product ions were matched giving a P-score of 2.64E-49 (Fig. 4-6F, Table 4-
2).
For PsbL, the assigned mass peak (4290 Da) in the mass spectrum is
attributed to a protein eluting at 93 minutes, lacking its initiating methionine and
acetylated at the N-terminus (Fig. 4-2, Table 4-1). An obsolute mass search using
Prosight PC 2.0 yielded 6y- product ions, until formylation were introduced in the
N-terminus yielding 17b- and 6y- product ions, agreement between the calculated

103
(4287.2771 Da) and measured monoisotopic mass (4287.2888 Da) within 5 ppm
with a P-score of 2.15E-45 (Fig. 4-6G, Table 4-2).
Subunit PsbM has an N-terminal signal peptide that is cleaved during its
maturation. The first thirty eight amino acids are processed to give a mature
protein consisting of 43 amino acids eluting at 80 minutes with a calculated
monoisotopic mass of 4596.4100 Da (Fig. 4-2, Table 4-2). Top down CAD
experiment confirmed the processed mature sequence of PsbM. The N terminal
cleaved precursor matched with the top-down CAD 10 b- and 23 y- product ions
within 5 ppm accuracy and an overall P-score of 2.21E-68 (∆ = 3.4407) (Fig. 4-
6H, Table 4-2).
The average measured mass of 4245 Da for the HPLC peak eluting at 97
minutes differs from the calculated mass by 27.6 Da indicating formylation of the
N-terminus in subunit PsbT (Fig. 4-2, Table 4-1). A top-down CAD experiment
confirmed the identity and processed form of PsbT. CAD product ion list could
only be matched to primary structure after manual modification of formylation at
N-terminus yielding 11b- and 16y- product ions. After this modification, the
experimental monoisotopic mass of 4242.3284 Da is in good agreement with
calculated monoisotopic mass of 4242.3284 Da (∆ = 3.2813 ppm), with a P-score
of 2.23E-44 (Fig. 4-6I, Table 4-2).
PsbX is known to be formylated at N-terminus in its mature form. The
mature form of PsbX in the peak eluting at 102 minutes has an experimentally
determined monoisotopic mass of 4559.5807 Da in agreement with the calculated
monoisotopic mass of 4559.5632 (Fig. 4-2, Table 4-2). A top-down CAD

104
experiment confirmed the identity of PsbX with 11b- and 13y- product ions as
well as the precursor matched within 5 ppm giving a P-score of 3.11E-45 (∆ =
3.7467 ppm) (Fig. 4-6J, Table 4-2).
As PsbX, PsbZ is also known to be formylated in N-terminus in its post-
translationally modified form. The experimentally determined average mass of
6855 for the HPLC peak eluting at 133 minutes differs from calculated mass by
28.6 Da, consistent with the mass associated with a formyl group at the N-
terminus (Fig. 4-2, Table 4-1). Initial analysis of the CAD dataset from top-down
experiment using Prosight PC 2.0, with no modifications yielded 11 matching y-
ions with a mass difference of 27.9955 Da, confirming the proposed modification
in low resolution mass spectrometer. After manual modification of starting PTM
as formylation, software analysis yielded 10b- and 11y- product ions, with the
agreement between calculated and experimentally determined monoisotopic
masses dropping below 1 ppm with a P-score of 7.55E-42 (Fig. 4-6K, Table 4-2).
DISCUSSION
Number of subunits/transmembrane helices
Top-down mass spectrometry has been used to characterize integral (63) and
peripheral (90) thylakoid membrane proteins for several years now. Top-down
high-resolution FT-MS was first applied to an integral thylakoid protein
demonstrating the potential benefits of using ECD (90). Recently, the 8 subunits
of the cytochrome b6f complex from Nostoc were analyzed by top-down FT-MS
for full characterization of post-translational modifications (63). Here we have
used top-down FT-MS to characterize the smaller integral and the peripheral

105
subunits of PSII from Galdieria. A significant challenge was the lack of a highly
annotated Galdieria proteome database and considerable effort was devoted to the
search for PSII homologues. Despite the informatics work, the interpretation of
the top-down data required manual adjustments of some sequences presumably
due to sequence differences between the strain sequenced and that used for PSII
preparations. Nevertheless we were able to define the identity of all the subunits
at very high confidence. In total Galdieria PSII appears to have 4 large subunits,
11 smaller integral subunits and 3 peripheral OEC subunits for a total of 18
subunits. This total gives 2 less subunits and 2 less transmembrane helices than
the cyanobacterial complex in agreement with the 34 transmembrane α-helices
identified in spinach (95) and in contrast to the 36 transmembrane helices
identified in PSII X-ray structure of T. elongatus (19), perhaps a little surprising
given the similarity between the Galdieria OEC and that of the cyanobacteria. It
remains possible that the small 3409 Da intact mass tag observed in the LC-MS+
experiment is a PSII subunit but we were unable to match top-down FT-MS data
to any sequence in our Galdieria database. PsbN and ycf12 of the cyanobacterial
complex were found in the Galdieria genome by homology but were not found in
the protein analysis despite their inclusion in the database used for interpretation
of the data. Final resolution of the issue will require a crystal structure of
sufficient quality to count the number of transmembrane helices.
Post-translational Modifications
Top-down mass spectrometry allowed characterization of PTMs with molecular
detail. Modification of small subunits shows a distinct pattern based on the
106
exposure of their N terminus to the stroma or lumen. Subunits PsbI, PsbK, PsbM,
PsbT, PsbX and PsbZ have their N-terminii exposed to the lumen with PsbI,
PsbT, PsbX and PsbZ retaining their initiating formyl-Met residue unmodified.
PsbK and PsbM had transit peptides removed (Table 4-2). The other subunits
PsbE, PsbF, PsbH, PsbJ and PsbL have their N-terminii exposed to the stroma and
in all cases have their initiating Met residue removed. In the case of PsbF, PsbJ
and PsbL their N-terminii are acetylated. The observed differences in
modification for different subunits may be due to the availability of different
processing enzymes in stroma and lumen (19) and accessibility of the N-termini
to these enzymes (19).
Peripheral subunits
Galdieria genome has genes for all the identified oxygen evolving complex
subunits involved in water-splitting reaction (PsbO, PsbU, PsbV, PsbP, PsbQ') in
cyanobacteria, red algae, green algae and higher plants. Consistent with the
nuclear and chloroplast genome analysis for other red alga, PsbO, PsbU and PsbQ'
are found in the nuclear genome, while PsbV is encoded in chloroplast genome
(22) It is quite surprising that Galdieria has only 3 oxygen evolving complex
subunits, as atleast four oxygen evolving complex subunits are present in other
members of cyanidiales (Cyanidioschyzon merolae – PsbO, PsbU, PsbP, PsbQ;
Cyanidium caldarium – PsbO, PsbU, PsbV, PsbQ'). In cyanobacteria, hydrophilic
oxygen evolving complex subunits (PsbO, PsbU and PsbV) are located in the
chloroplast lumen. These subunits in combination with the protruding hydrophilic
loops of D1, D2, CP43 and CP47 subunits bound the calcium and manganese ions
107
forming the water splitting complex. Galdieria has oxygen evolving complex
subunits similar to cyanobacteria.
PsbO is the only extrinsic protein conserved during evolution from
cyanobacteria to higher plants. As observed in cyanobacteria, red algae, green
algae and higher plants, PsbO is nuclear encoded in Galdieria with a signal
sequence of first 21 residues, which is also confirmed by SignalP (96). This is in
contrast to the signal sequence of 26 residues identified by mass spectrometry in
T.elongatus (cyanobacterium) and predicted signal sequence of 52, 76 and 84
residues for Chlamydomonas reinhardtii (green alga), Cyanidium caldarium (red
alga) and Spinacia oleracea (higher plant) respectively (19, 97). Sequence
alignment of Galdieria PsbO with these organisms reveals that N-terminal
sequence in Galdieria is longer than cyanobacteria, similar with red algae and
shorter than spinach (data not shown). Also, the identified disulfide bond between
the cysteine residues in Galdieria is conserved, so there is a high possibility this
disulfide bond is present in these organisms. Furthermore, Galdieria PsbO has a
slightly higher amino acid identity with green algae (49%) and higher plants
(47%) than with cyanobacteria (45%). This is in contrast to the sequence results
of Cyanidium caldarium, a sister species of Galdieria where the PsbO gene is
highly homologous to cyanobacteria.
PsbU has a mature protein of 93 amino acids, after the cleavage of first 81
residues of the transit peptide. C-terminal analysis of the transit peptide reveals
the presence of consensus sequence A-X-A from position 79 to 81, a recognition
site for thylakoid processing peptidase, an additional confirmation of our mass

108
spectrometry result (98). The signal peptide in Galdieria is longer in comparison
with T.elongatus (30 residues) and Cyanidium caldarium (61 residues). Sequence
comparison of Galdieria’s mature PsbU with C. caldarium and T. elongatus
showed amino acid identities of 58% and 45% respectively (data not shown). In
the mature PsbU protein, the second amino acid tyrosine from the C-terminus is
conserved across all organisms, a likely residue for modulating the requirement of
calcium and chloride ions for oxygen evolution(99). Apart from the transit peptide
processing, no post translational modification was identified for this subunit and
our results are in concurrence with the proteomic analysis of PSII in T.elongatus
(19).
PsbV is present in cyanobacteria and red algae. In Galdieria, mature PsbV
protein is obtained after the processing of short transit peptide (1-30 residues)
which is in agreement with other red algae (Cyanidium caldarium and
Cyanidioschyzon merolae) and cyanobacterium (T.elongatus) (19, 100). After the
removal of transit peptide, the mature PsbV sequence did not match with the CAD
data obtained from high resolution mass spectrometry. Previous proteomic studies
have shown that modifications in orthologs (same gene in related species) are
conserved and this can be used to predict the modification in related organisms.
Also, Galdieria genome is recently annotated; there are chances of sequence
errors which can be corrected by comparing orthologs. So a gene search for PsbV
in Cyanidium caldarium and Cyanidioschyzon merolae was initiated. In UniProt
database, PsbV has two sequence records for Cyanidium caldarium reported by
Glockener et al. (Q9TLW2-1) (101)and Enami et al. (Q76FBO-1)(100). For our

109
convenience, they are named as CCPsbV1 and CCPsbV2 respectively. For
Cyandioschyzon merolae (CMPsbV), only one PsbV sequence (Q85FS3) was
registered. Comparison of Galdieria’s PsbV sequence with other red algal ones
revealed a homology of 62%, 66% and 64% for CCPsbV1, CCPsbV2 and
CMPsbV respectively. Further sequence analysis of CCPsbV1 and CMPsbV
showed that Galdieria has ten extra residues at the C-terminus. Based on this we
have trimmed the C-terminus by removing 10 amino acids and also optimized the
data by changing one amino acid from Threonine to Valine which brought the
mass difference (∆) between the experimental and calculated monoisotopic mass
below 10 ppm. High sequence homology of PsbV among cyanidiales, indicate
that they might bind similarly with the intrinsic PSII proteins. Results from the
cross linked binding studies of PsbV from T. vulcanus and C. caldarium with
their PSII indicated that PsbV binding depends upon the structure of intrinsic
proteins interacting with PsbV. Furthermore, results have shown that during the
course of PSII evolution, PsbV binding sites has been changed between
cyanobacteria and red algae(100). This change in binding site might have lead to
the recruitment of PsbQ′ in red algae (Cyanidium caldarium) for the effective
binding of PsbV to the intrinsic proteins(40). Cross – reconstitution studies of
PsbU and PsbV from red algae indicated that these proteins might have a similar
function those of PsbP (23 Da) and PsbQ (17 Da) in higher plants (41). Also, red
algal oxygen evolving complex subunits (PsbO, PsbU, PsbV) did restore partial
oxygen evolution in both cyanobacterial and higher plant PSII. This result
110
indicates that red algal PSII might act as a link between the photosystem II
present in cyanobacteria and higher plants (41).
To our knowledge, no post-translational modification was reported or
known for PsbW/PsbW-like/Psb28 protein in cyanobacteria, algae and higher
plants(20). Designation of PsbW subunit in cyanobacteria, green algae and higher
plants are inconsistent and quite confusing. Sequence analysis of the identified
PsbW subunit in Galdieria genome is similar to the hydrophilic Synechocystis sp
PsbW subunit with an amino acid identity of 54%, which has been recently named
as Psb28; not with the hydrophobic PsbW protein of 6.l kDa identified in green
algae and higher plants. Also, Galdieria Psb28 is chloroplast encoded as in
cyanobacteria and other red algae, while in green algae and higher plants it is
nuclear encoded. Based on these observations, Psb28 in red algae and
cyanobacteria might have a different functions that of green algae and higher
plants. Position of PsbW is strongly debated as whether it is part of PSII complex
or a transiently associated subunit. Recent study in Synechocystis 6803 has shown
that Psb28 is a PSII assembly factor associated with CP47 in PSII assembly
intermediates and involved with the synthesis of chlorophyll binding proteins
(102). Considering the sequence identity between Synechocystis 6803 and
Galdieria for Psb28, we propose that Psb28 identified in Galdieria might perform
a similar role as in Synechocystis 6803.
Sequence analysis of the Galdieria Psb27 using DOLOP server reveals the
absence of lipobox sequence, found in cyanobacteria (103). This lipobox
sequence is characteristic of bacterial lipoproteins, usually lacking in eukaryotes.
111
In cyanobacteria, Psb27 transiently associates with PSII during its biogenesis,
facilitating the assembly of manganese, chloride and calcium ions and possibly
hindering the premature binding of OEC subunits to the PSII core (104). Similar
repair role has been confirmed for Psb27 in Arabidopsis. However, additional
experiments are needed to confirm whether red algal Psb27 is a part of mature
PSII or transiently associated subunit performing a repair role as found in
cyanobacteria and higher plants (105).
Small integral membrane subunits
In Galdieria, the larger subunit of cytochrome b559 has a molecular mass of
9396.8317 Da and its PTM is similar to the findings in cyanobacteria (T.elongatus
and Synechocystis 6803) and higher plants (Hordeum vulgare and Nicotiana
tabacum) (19, 106, 107). The observed molecular mass is almost similar as in
T.elongatus (9446 Da) and H. vulgare (9307 Da), but larger in N. tabacum
(9250.7 Da). The smaller subunit of cytb559 has 43 amino acids with a molecular
mass of 5010.6386 Da. Also the PsbF subunit is larger in comparison with
T.elongatus (4.9 kDa), N. tabacum (4.3 kDa) and H. vulgare (4.4 kDa) (19, 106,
107). The post translational modification for this subunit is the same as observed
in other organisms, a possibly indication for a similar role of these subunits in
Galdieria. Regarding PsbE and PsbF function, they are essential for PSII
assembly, possibly protecting PSII from photodamage as they might also be
involved in secondary electron transport (20).
Literature survey revealed that los of met1 with a free N-terminus was
reported for PsbH subunit in other organisms (19, 92, 106, 107). However,

112
phosphorylation at one or two sites at N-terminus has been identified in higher
plants and they are influenced by light/dark cycles (108). A sequence comparison
of PsbH between higher plant (Spinacia oleracea) and Galdieria have revealed
that phosphorylation site is not conserved in Galdieria, similar to that in
T.elongatus. Additionally no phosphorylation was detected at N-terminus of PsbH
by high resolution mass spectrometry. Functional role of PsbH might differ
between organisms. In C. reinhardtii, a PsbH deletion mutant contains no
functional PSII, indicating an absolute necessity of this subunit for PSII activity
(109). In contrast, a similar study in Synechocystis 6803, resulted in functional
PSII but with a slow growth rate corresponding to the impairment in electron flow
from QA to QB. In PSII X-ray structure in T.elongatus, PsbH is involved in
binding of chlorophyll, carotenoids and lipids. On the whole, PsbH is essential for
PSII activity both in eukaryotes and prokaryotes. Considering the amino acid
identities (77% for Synechocystis 6803, 71 % for T.elongatus) and absence of
conserved phosphorylation site, PsbH in Galdieria might play a similar role as
observed in cyanobacteria (19).
For PsbI, the confirmed PTM of formyl methionine at N-terminus agree
with the published data for cyanobacteria and higher plants (19, 92, 106).
Galdieria PsbI sequence indicates a single transmembrane helix, with an amino
acid identity of 68% for Chlamydomonas sp. and T. elongatus, 73% for
Synechocystis 6803 and 77% for higher plants (H.vulgare and N.tabacum). PsbI
mutants in Synechocystis 6803 and C. reinhardtii are sensitive to high light
conditions and their oxygen evolving activity is lower (70 to 80 % lower for
113
Synechocystis; 10 to 20% for Chlamydomonas) than the wild type (20). Also, a
PsbI mutant in T. elongatus, only synthesized PSII monomers indicating a role of
PsbI in formation or stabilization of PSII dimmers (20).
PsbJ in Galdieria contains 38 amino acid residues and they are located in
a gene cluster containing PsbE, PsbF and PsbL (19). As in Galdieria, loss of
met1, followed by acetylation is the posttranslational modification as identified in
cyanobacteria. Subunit PsbJ have been confirmed as a part of PSII core in
Synechocystis 6803 and T.elongatus, but it is not detected in PSII preparation of
T.vulcanus by N-terminal sequencing (19, 107, 110). This is probably due to the
acetylation blocking of PsbJ at the N-terminus.
Subunit PsbK is identified in cyanobacteria, green alga and higher plants.
But the N-terminal processing of PsbK is different between organisms (19, 106).
In mature PsbK, first 9 residues are processed for T.elongatus, whereas in
N.tabacum removal of first 24 residues was reported in literature. Both of these
studies have reported no other modifications of N-terminus (a free n-terminus)
and these results are in line with our study. Furthermore, the initial 6 amino acid
residues (KLPEAY) at the N-terminus observed in Galdieria are conserved
between Galdieria and cyanobacteria, green algae and higher plants. Functional
studies of PsbK in Synechocystis 6803 and Chlamydomonas indicated a role of
PsbK in plastoquinone binding and maintaining stability of PSII dimmers(20).
The role of PsbK in electron transfer/plastoquinone diffusion is confirmed by the
PSII X-ray structure of T. elongatus (19).

114
Chloroplast encoded PsbL is present both in cyanobacteria and higher
plants. In Galdieria, PsbL has 37 amino acids and the acetylation identified for
this subunit differs from the modifications reported in other organisms. In T.
elongatus and H. vulgare, PsbL had no modification. Similarly, in N. tabacum,
PsbL has no modification, but has lost its initial methionine (19, 92, 106).
Difference in PTM in these eukaryotic and prokaryotic systems, might be due to
the difference in their functional roles along with the differences in biogenesis
mechanisms of PSII complex.
Subunit PsbM is plastid encoded in cyanobacteria, green algae and higher
plants. In these organisms, the observed molecular mass for PsbM varies between
3803 and 4011 Da (T.elongatus - 4011 Da; Synechocystis 6803 – 3920Da; N.
tabacum – 3808 Da; P.sativum – 3809 Da; H. vulgare – 3837 Da) with a post-
translational modification of formyl methionine in their N-terminus (19, 92, 106).
In Chlamydomonas, N-terminal sequencing showed a blocked N-terminus, but the
PTM for this subunit has not been reported (111). Function of PsbM is not known
in green algae and higher plants. A ∆psbM mutant in Synechocystis 6803 showed
normal oxygen evolving activity, but the mutant cells grow faster under low light
conditions in comparison with wild type cells (20). In contrast to these findings,
the experimental mass obtained for Galdieria PsbM has a molecular mass of 4596
Da, higher than the masses observed for other organisms. Additionally, PsbM in
Galdieria is nuclear encoded, suggesting the transfer of this gene from plastid to
nucleus and the signal peptide was acquired for its transfer from cytosol into
plastids. Moreover, PsbM is not present in plastid and nuclear genome of C.

115
merolae and in plastid genome of C. caldarium (40, 101). To our knowledge, only
Guillardia theta, a cryptophyte and Phaeodactylum tricornutum, a stramenophile
algae are the only organisms that has nuclear encoded PsbM. Comparative
sequence analysis of PsbM in Galdieria, Guillardia and Phaeodactylum reveal
that signal peptide is not conserved, while the mature protein has an amino acid
identity of 63% between these organisms. Both crytophytes and stramenophiles
belong to chromista, and the plastids of these organisms are assumed to have
originated from a red alga through secondary endosymbiosis (112). At this
juncture, it is not clear whether PsbM has any evolutionary importance. But use of
PsbM gene as a phylogenetic marker during the evolution of eukaryotes from
primary, secondary and tertiary endosymbiosis would reveal some hidden truth
for this subunit. In a different perspective, Galdieria is a primitive photosynthetic
red alga, and it photosystems might be ancient than the current photosystems
present in cyanobacteria, red algae, green algae and higher plants (9). In this case,
different subunits of PSII in Galdieria’s genome might be reflect their ancient
state and it is possible that this gene is originally a native of nucleus, but has
acquired function in plastid during the reduction process of plastid genome
contents and eventually transferred to plastid in other organisms during the course
of evolution. By taking into account the absence of this subunit in other
cyanidiales and their nucleus origin, PsbM in Galdieria might play an important
role in Galdieria PSII. A mutagenesis study in Galdieria PSII would be helpful in
knowing the function of this subunit.
116
PsbTc protein contains 36 amino acids with a single transmembrane span
and a molecular mass of 4596.8282 Da. Observed formylation for PsbTc is in
good agreement with the findings in T.elongatus, P.sativum and N.tabacum
except for H.vulgare, acetylation is reported (19, 92, 106, 108). A disrupted gene
study for this subunit in T.elongatus showed that PSII dimeric population
dramatically reduced in mutant than in wild type indicating a role for PsbTc in
PSII dimerization (20). In recent structural model of dimeric PSII complex, PsbT
along with PsbL and PsbM are located at the PSII monomer interface (19).
Identification of these subunits in Galdieria PSII might not be helpful in knowing
its oligomeric state, as contradictory results have been reported based on the
absence or presence of these subunits and their influence on formation of PSII
dimers. Furthermore, a recent study has shown that intact architecture of PSII
invivo in cyanobacteria and red algae is a monomer (58). It will be high interest to
know the PSII oligomeric state in Galdieria as this organism performs
photosynthesis under extreme conditions.
In cyanobacteria and green algae, PsbX is chloroplast encoded, while in
higher plants it is encoded in nuclear genome (20). PsbX in Galdieria has 39
amino acids and sequence analyses for hydrophobicity indicate a single
transmembrane α-helix with a post translational modification of formylation
without any cleavage at N- or C-terminus. But mass spectrometric analysis of
T.elongatus, shows a cleavage of first 10 amino acids due to the presence of extra
lumen targeting presequence (113). This additional lumen targeting sequence is
present only in a few cyanobacteria and higher plants. Sequence comparison of
117
PsbX from Galdieria with T.elongatus and T.vulcanus did reveal the absence of
this signal sequence in Galdieria (data not shown). Results obtained in this study,
confirmed this as there was no cleavage for PsbX. Modification of PsbX is not
known in green algae and higher plants.
PsbZ is highly conserved across among photosynthetic organisms. Subunit
PsbZ is chloroplast encoded and has 62 amino acids, a typical number observed in
other organisms (19, 106, 108). Confirmed post translational modification of
formylation in PsbZ is in good agreement with the results in T.elongatus,
P.sativum and N.tobacum. Galdieria PsbZ has an amino acid identity of 51% and
40% with T.elongatus and Synechocystis 6803 respectively. In green algae and
higher plants, PsbZ stabilizes the PSII-LHCII supercomplexes (20). Galdieria
has phycobilisomes in place of LHCII supercomplexes, along with the sequence
identity it has with cyanobacteria, PsbZ might be involved in photoprotection, a
similar role noted in cyanobacteria.
CONCLUSION
Top-down high-resolution MS is clearly the technology of choice for absolute
characterization of protein identity and modification. The reversed phase LC-MS+
platform presents an attractive primary separation that avoids problems associated
with gels. Low resolution MS data from the primary LC-MS+ experiment is used
to drive user directed data-dependent top-down MS experiments. Interpretation of
top-down data relies upon accurate annotation of high-quality genomic data
though it is now very easy to see where actual primary structure diverges from
that predicted by translation of DNA sequence. The small integral and the

118
peripheral subunits of Galdieria PSII have been characterized with unprecedented
detail, emphasizing the amenability of membrane proteins to analysis by top-
down MS.

119
CHAPTER 5 STRUCTURAL AND FUNCTIONAL CHANGES OF PSI-
LHCI SUPERCOMPLEXES OF CHLAMYDOMONAS REINHARDTII
CELLS GROWN UNDER HIGH SALT CONDITIONS
INTRODUCTION
As mentioned in chapter 1, eukaryotic PSI uses its light harvesting complexes I
and II (LHCI and LHCII) to increase its functional efficiency. Recent X-ray
structural model of PSI-LHCI of Pisum sativum have shown that the protein-
protein contacts between PSI and LHCI proteins are weaker in comparison with
the contacts between the PSI core proteins inside the thylakoid membrane and
these LHCI proteins are more accessible and amenable to regulatory enzymes
(75). Several studies in different organisms (e.g. Tomato, Tobacco) have pointed
out that the LHCI proteins are post-translationally modified in accordance with
change in environmental conditions (114). From these studies, it is clear that the
light harvesting regulations are clearly far from being understood and it varies
between species. Also these functional studies are further compounded by the
difficulty in isolating these large fragile membrane protein complexes. Further
adding to the complexity, is that these membrane protein complexes are moving
targets vulnerable to poorly understood process of environmental regulation.
The green alga, Chlamydomonas reinhardtii is widely used as a model for
eukaryotic photosynthesis and we have used this organism to study the effects of
high salt conditions on PSI-LHCI. Based on our literature survey, there have been

120
no studies on the effects of salt stress on PSI-LHCI and this chapter focuses on
changes in protein profile of PSI-LHCI as well as the process of energy transfer
and trapping. The results of this investigation are published in Subramanyam et al.
(2010) in Planta journal (see, appendix C for co-authors permission). The present
form of isolation protocol is largely the work of Dr. Rajagopal Subramanyam.
The author along with Dr. Rajagopal Subramanyam have grown Chlamydomonas
cells under salt conditions, isolated PSI-LHCI supercomplexes, performed SDS
denaturing electrophoresis, in-gel trypsin digestion and immunoblot analysis
experiments. All the MALDI-TOF and oxygen uptake experiments were
performed by the author.
Salt stress
Salinity-stress effects on plant growth often involve impairment of
photosynthesis. High amounts of sodium in the soil impair cell metabolism and
photosynthesis by increasing osmotic pressure (115). The molecular mechanisms
responsible for the salt-induced inactivation of the photosynthetic machinery have
been studied extensively, with particular focus on photosystem II (PSII), in vitro
and in vivo (116-118). When PSII membrane fragments are exposed to high
concentrations of NaCl, the extrinsic proteins of the oxygen-evolving machinery
of PSII dissociate from the membrane-intrinsic complex, resulting in impairment
of oxygen evolution. In cyanobacterial cells, high concentrations of NaCl also
inactivate Na+/H+ antiporters (116).
Exposure of the green alga Dunaliella tertiolecta to salinity stress results
in a significant inhibition of photosynthesis, due to a decrease in PSII activity

121
(119). A decrease in PSII activity has also been associated with the transition to
State 2. This was confirmed by Endo and coworkers, who also suggested a
connection between the decrease in PSII quantum yield caused by salinity stress
and that caused by state transitions in Chlamydomonas reinhardtii (120). In the
red alga Porphyra perforata, Satoh and colleagues demonstrated that the salinity
stress-induced decrease in PSII activity was due to a decrease in the excitation
energy reaching PSII reaction centers, as well as damage to the oxidizing side of
PSII (121). Salt stress also inhibits PSII activity in higher plants, including salt-
tolerant plants such as mangroves (122-125). In some reports, the effects of salt
stress on PSII were due to the dissociation of the 23 kDa polypeptide extrinsically
bound to PSII (126). Salt stress has also been reported to reduce D1 protein
turnover in both cyanobacteria and plants (127, 128).
The mechanism of salt stress has also been well established in
cyanobacteria (129-131). It leads to electron transport inhibition at both the donor
and acceptor sides of PSII, damage to the phycobilisomes (membrane-extrinsic
antenna of PSII) as reflected by a significant decrease in phycocyanin content,
and a shift in the distribution of excitation energy from PSII to PSI as suggested
by an increase in qN (129-131). In a study using the cyanobacterium Spirulina,
the downregulation of PSII reaction center proteins was observed without any
inhibition of electron transfer on the donor and acceptor sides of PSII, suggesting
that the effects of salt stress on PSII may vary between species (129). A very
recent paper reported that there were no significant changes in the levels of the
CP47, CP43, cytochrome c550, and D1 proteins (132). The PsbO content in
122
isolated thylakoids, however, decreased. Recent reports show that the effects of
salt stress on higher plants and cyanobacteria are due to the generation of reactive
oxygen species, which affects both the reduced and oxidized sites of PSII (128,
133). Allakhverdiev and coworkers reported that, in addition to PSII, PSI is
equally inactivated by osmotic stress – the present study is focused on further
exploring the role of PSI damage in salt stress (127).
In eukaryotes, the light-harvesting capacity of PSI and PSII is augmented
by the membrane-intrinsic light harvesting complexes LHCI and LHCII. The
LHCI proteins are associated only with PSI and deliver excitation energy to the
PSI core. To the best of our knowledge, there have been no studies on the effects
of salt stress on PSI-LHCI supercomplexes. We have used C. reinhardtii as a
model system to study the effects of high salt conditions on PSI-LHCI. The
present study focuses on changes in the protein profile of PSI-LHCI as well as the
processes of energy transfer and trapping.
MATERIALS AND METHODS
Chlamydomonas cell culture
C. reinhardtii cells were grown in a growth medium with its ingredients listed in
Table 5-1. Cells were grown under both control (NaCl-free) and salt stress (100
mM NaCl) conditions with continuous illumination (30-40 µE m-2 S-1) on a shaker
at 115 rpm to a density where OD 650nm ~1.

123
TABLE 5-1 Composition of Chlamydomonas growth medium
The cells were harvested at 6500 rpm for 10 min in a sorvall GS-03 rotor
(Dupont, Wilimington, DE), then washed and resuspended in a buffer containing
surcrose, 25 mM HEPES (pH 7.5, KOH), 10 mM MgCl2, and 5 mM CaCl2.
Protease activity was inhibited by adding 1 mM each of amino caproic acid and
benzamidine, and the cells were ruptured using a French press at 1080 psi.
Thylakoid isolation
The cell lysate obtained from the French press was spun at 5000-6000 rpm in a
sorvall SS-34 rotor to harvest the thylakoid membranes, which were left in the
pellet. The pellet was resuspended in a buffer containing 0.3 M sucrose, 5 mM
HEPES (pH 7.5, KOH), and 10 mM EDTA. The thylakoids were then pelleted at
2000 x g for 10 min in an SS-34 rotor, and resuspended in a buffer containing 5
mM Tris-HCl (pH 7.5), 0.2 M sorbitol, 5 mM CaCl2, and 10 mM MgCl2.
Solubilization and purification of the PS-LHCI supercomplex
A mild detergent was used to solubilized the thylakoid membrane proteins and
remove the PSI-LHCI complex from the membrane in the form of detergent-
micelles. This was done by adding 0.9% β-DDM to pellet resuspension (with a
Chl concentration of 0.8 to 1.0 mg/ml) and stirring it in ice for 20 min. The
124
solublized thylakoid suspension was centrifuged at 48400 x g using a Ti70 rotor
(Beckman Coulter Inc., Fullerton, CA); the pellet contained fragments of
unsolubilized membrane and was discarded, leaving the detergent-solubilized
membrane proteins in the supernatant.
Linear sucrose density gradients were prepared by placing 9.5 mL of a
solution containing 0.5 M sucrose, 5 mM Tricine (pH 8.0, NaOH), 0.03% β-
DDM, and 0.5 M betaine into six 12 mL centrifuge tubes. The tubes were then
frozen for 2 hours at – 200 C and thawed for 3 hours at 40 C. This establishes a
linear density gradient, in which the solution is most dense at the bottom of the
centrifuge tube and most dilute at the top. The solution containing solubilized
thylakoid proteins is carefully loaded on top of the density gradient solution, and
the centrifuge tubes are loaded into an SW-41 (Beckman Coulter Inc., Fullerton,
CA) swinging bucket rotor. The density gradients are spun in the ultracentrifuge
for 17 hours at 180,000 x g. After sucrose density gradient centrifugation of
solubilized thylakoid membranes, three bands were clearly resolved. For this
study, the lowest band of PSI-LHCI supercomplexes (F3) were collected from the
sucrose gradient and diluted with 3 volumes of 5 mM Tris-HCl, 0.05% β-DDM
and 5 mM CaCl2 at pH 8.0. The diluted samples were then concentrated using a
Centricon 100 (Amicon, Houston, TX) at 4000 x g in an SS-34 rotor at 40 C. The
reason for the dilution and subsequent reconcentration was to remove as much
sucrose as possible.
125
Oxygen uptake and SOD activity measurements
PSI-mediated electron transfer from reduced dichloro phenol indophenol
(DCIPH2) to methyl viologen (MV) was measured by light-induced O2
consumption using a Hansatech oxygen electrode at 22oC. White light
illumination (250 W m -2) was provided by a 150-W quartz-halogen projector
lamp. The reaction mixture was composed of PSI-LHCI supercomplexes (15 mg
Chl/ml), 20 mM Tricine-KOH (pH 8), 200 mM MV, 1 mM NaN2, 100 mM
DCIPH2, 5 mM ascorbate, and 10 mM 3-(3,4 dichlorophenyl)-1,1-dimethylurea
(DCMU). Samples were incubated in the dark for 5 min before measuring.
For Superoxide dismutase (SOD) activity measurements, thylakoid membranes
were suspended in 10mM Tris-HCl (pH 7.5), 0.3 M sorbitol, 1.5m M CaCl2, 10
mM MgCl2, and activity was assayed according to Beauchamp and Fridovich
(1971). The required cocktail for SOD activity estimation was prepared by mixing
27 ml of 50mM sodium phosphate buffer (pH 7.8), 1.5 ml of methionine (300 mg
ml-1), 1 ml of NBT (14.4 mg 10 ml-1), 0.75 ml of Triton X 100 and 1.5 ml of
EDTA. 10 µl of riboflavin (4.4 mg 100 ml-1) and 50 µg of protein were then
added to this mixture. After the contents were mixed in a cuvette, they were
illuminated for 12 min using a Comptalux bulb and the absorbance was measured
at 560 nm.
SDS-denaturing gel electrophoresis and in-gel trypsin digestion
For the analysis of the protein composition of PSI-LHCI supercomplexes from C.
reinhardtii, samples were size-fractionated by gradient SDS-PAGE (15-23%).
Equal amounts of protein (100 µg) were loaded on each lane. The PSI-LHCI

126
supercomplexes were solubilized in 2% SDS and 0.1 M dithiothreitol, and the gel
was stained with Coomassie brilliant blue R250. The desired bands were excised
and diced into 1 mm3 fragments, and then washed three times with 400 µl 50%
acetonitrile/50 mM Tris-HCl, pH 8.0, for 15 min to remove the Coomassie blue
dye. Gel fragments were then soaked in 100% acetonitrile for 5 min, acetonitrile
was removed and the sample was dried in a SpeedVac for 20 min at room
temperature. Dried gel slices were rehydrated in 40 µl of 50 mM Tris-HCl, pH
8.0, containing 400 ng of porcine trypsin (Princeton separations, sequencing
grade). The samples were digested for 18 h at 37oC, extracted with 50%
acetonitrile/5% trifluoroacetic acid for 30 min and dried on a SpeedVac.
MALDI-TOF mass spectrometry and database searches
Tryptic peptides were desalted using C18 ZipTips (Millipore) and eluted with 10
µl of 50% acetonitrile/ 0.1% trifluoroacetic acid. 2 µl aliquots of the sample were
mixed with 1.5 µl of matrix (a saturated solution of α-cyano-4-hydroxycinnamic
acid in 50% acetonitrile/0.1% trifluoroacetic acid) and a droplet of the mixture
(about 1.5 µl) was spotted on the sample plate and dried. Mass spectra were
collected on an Applied Biosystems Voyager DE-STR mass spectrometer and
analyzed with Data Explorer software. From the monoisotopic masses obtained,
the amino acid sequences of matching tryptic fragments of C. reinhardtii PSI-
LHCI proteins were obtained using the MS-Fit program of the online Protein
Prospector software package (UCSF, San Francisco) and the ExPASy Proteomics
Server, as previously reported (134).

127
Immunoblot analysis
PSI-LHCI polypeptides were separated by polyacrylamide gel electrophoresis
(PAGE). Electrophoresis was performed on a 15% separating and 4% stacking gel
of polyacrylamide. Equal quantities of protein were loaded on to each lane. An
equal volume of 2x buffer was added to the aliquots. To identify and quantify the
polypeptides contained in the PSI-LHCI supercomplex, immunoblotting was
carried out essentially as described by (135). Immunoblotting was performed by
electrophoretic transfer of proteins to PVDF membranes. The membrane was
incubated with polyclonal antibodies raised in rabbits. We have used the specific
primary antibodies against PsaB, PsaC, PsaE and PsaF. PsaB and PsaC were
purchased from Agrisera, Sweden and PsaE and PsaF antibodies were a gift from
Prof. Kevin Redding, Arizona State University, USA. Subsequently, secondary
antibodies ligated to horseradish peroxidase were applied. Chemiluminescence
reagents were used to develop the PVDF membrane. The images were recorded
on a Bio-Rad CCD camera.
Circular dichroism measurements
Visible circular dichroism spectra were measured in a Jasco 710
spectropolarimeter. The optical path length of the cell was 1 cm, and the distance
of the sample from the photomultiplier was 5 cm. The spectra were recorded in 1
nm steps with an integration time of 0.3 s and a band pass of 2 nm.
Ultrafast fluorescence spectroscopy
The time vs. wavelength fluorescence intensity surfaces were recorded on a
system consisting of an ultrafast laser and a streak camera, as described

128
previously (Lidell et al. 2008). Briefly, 130 fs light pulses at 800 nm were
generated by a mode-locked Ti:S laser (Mira 900, Coherent Laser) pumped by a
frequency-doubled Nd:YVO4 laser (44% from an 18 W Verdi, Coherent Laser).
The repetition rate of the Ti:S laser was reduced to 4.75 MHz by a pulse picker
(Model 9200, Coherent Laser). The excitation light (800 nm) was frequency
doubled to 400 nm and focused onto a sample cuvette with a 5 mm path length.
Fluorescence was collected at a right angle to the excitation beam and focused on
the entrance slit of a Chromex 250IS spectrograph which was coupled to a
Hamamatsu C5680 streak camera with a M5675 synchroscan sweep unit. The
streak images were recorded on a Hamamatsu C4742 CCD camera. Measurements
were performed on 800 ps, 1.4 ns, and 2 ns timescales, with 1024 pixels of time
resolution. The FWHM of the overall time response of this system was ~6 ps at
the 800 ps timescale, ~12 ps at the 1.4 ns timescale, and ~20 ps at the 2 ns
timescale. The spectral resolution was 0.124 nm in the spectral range of 650-777
nm (1024 pixels). To avoid singlet-singlet annihilation, the pulse energy was
reduced to 0.1 nJ using a neutral density filter. The probability of a single
supercomplex absorbing multiple photons in a single laser pulse was estimated
using Poisson statistics and it was found that less than 2% of emitted photons
could have come from supercomplexes which had received multiple excitations
(136). Global analysis was performed using locally-written software in
MATLAB. The 1024 kinetic traces were binned, resulting in a spectral resolution
of 1.24 nm. A Gaussian shaped instrument response function was used in the
fitting.

129
RESULTS
Trial experiments were carried out to determine a suitable concentration of NaCl
to use for salt-stress studies of C. reinhardtii. The cells were grown with NaCl
concentrations ranging from 10 to 1000 mM. Cells could not be grown at
concentrations greater than 150 mM; 100 mM concentration was used for stress
conditions in this study. Both control and salt-stressed cells were grown to ~1 OD
at 650 nm. A delay in growth was observed in medium with 100 mM NaCl (data
not shown).
Sucrose gradient analysis
PSI-LHCI supercomplexes were isolated using sucrose density gradient
centrifugation. The detergent extracts of the thylakoid membranes were loaded
onto the gradient at equal Chl levels (0.8 mg/mL Chl). After the centrifugation,
three distinct bands were observed in both the control and salt stress samples; the
fractions corresponded to F1 (LHCII), F2 (PSI-LHCI and PSII) and F3 (PSI-
LHCI supercomplexes), as shown in our previous report (134) (Fig. 5-1). For this
study, PSI-LHCI supercomplexes (F3) were collected from the sucrose gradient.
No significant difference in the bands was observed between the control and salt
stress samples (Fig. 5-1).

130
FIGURE 5-1 Separation of PSI-LHCI supercomplexes from solubilized thylakoid membranes by sucrose density centrifugation. See Materials and Methods for further details.
Oxygen uptake analysis and antioxidant enzyme analysis
The electron transfer activity of purified PSI-LHCI supercomplexes from C.
reinhardtii cells grown at 50 and 100 mM NaCl was measured by assaying O2
uptake, as described in materials and methods section. PSI activity was reduced
by 18% and 39%, respectively (Fig. 5-2) compared to the control sample.

131
0
25
50
75
100
PSI
act
ivit
y in
%
Control
50 mM NaCl
100 mM NaCl
0
100
200
control 100 Mm
SO
D a
cti
vit
y (
Un
its
/mg
Ch
l)
FIGURE 5-2. Oxygen uptake activity and SOD activity of PSI-LHCI supercomplexes isolated from cells grown at control (0 mM), 50 mM and 100 mM NaCl. The PSI activity is 350 µmol/mg-1 Chl h-1. A) Oxygen uptake activity B) Total SOD activity.
This result indicates that the activity of the reducing side of PSI is reduced under
salt stress. Total SOD activity was decreased by 78% in thylakoids isolated from
2A
2B
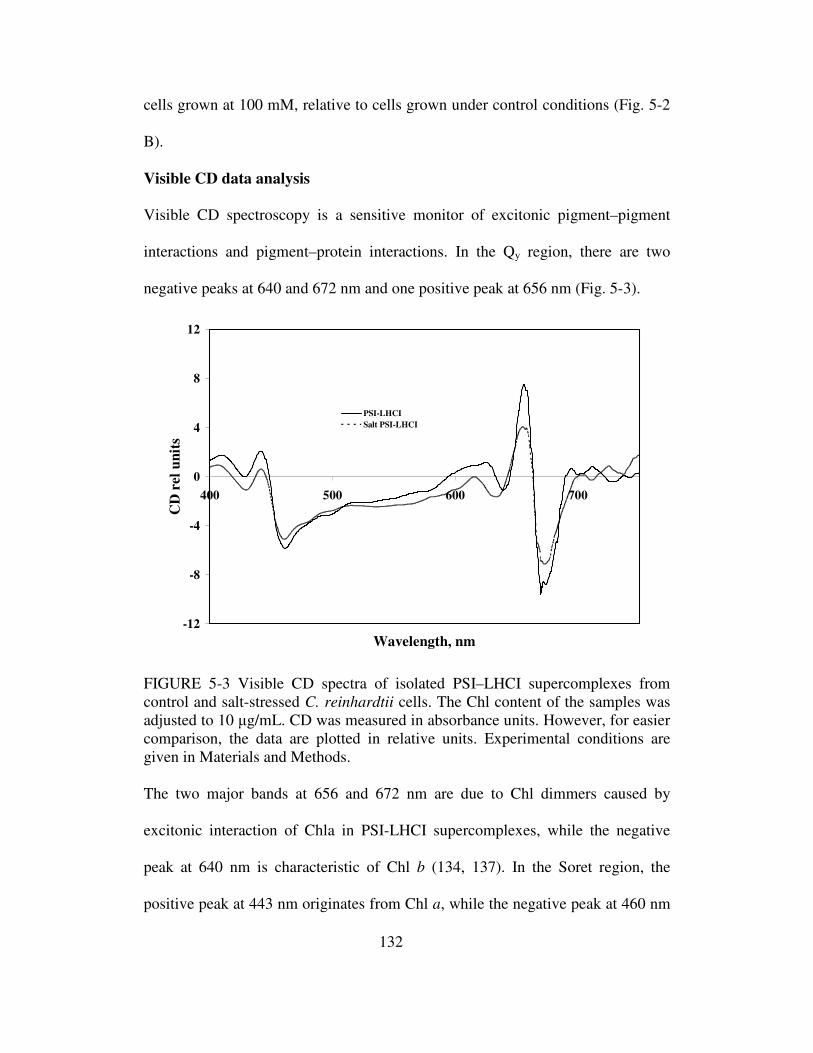
132
cells grown at 100 mM, relative to cells grown under control conditions (Fig. 5-2
B).
Visible CD data analysis
Visible CD spectroscopy is a sensitive monitor of excitonic pigment–pigment
interactions and pigment–protein interactions. In the Qy region, there are two
negative peaks at 640 and 672 nm and one positive peak at 656 nm (Fig. 5-3).
-12
-8
-4
0
4
8
12
400 500 600 700
Wavelength, nm
CD
rel
un
its
PSI-LHCI
Salt PSI-LHCI
FIGURE 5-3 Visible CD spectra of isolated PSI–LHCI supercomplexes from control and salt-stressed C. reinhardtii cells. The Chl content of the samples was adjusted to 10 µg/mL. CD was measured in absorbance units. However, for easier comparison, the data are plotted in relative units. Experimental conditions are given in Materials and Methods. The two major bands at 656 and 672 nm are due to Chl dimmers caused by
excitonic interaction of Chla in PSI-LHCI supercomplexes, while the negative
peak at 640 nm is characteristic of Chl b (134, 137). In the Soret region, the
positive peak at 443 nm originates from Chl a, while the negative peak at 460 nm

133
is characteristic of Chl b. The visible CD spectrum of PSI-LHCI supercomplexes
isolated from C. reinhardtii cells grown at high salt (100 mM) shows a decrease
in the amplitude of the major peaks at 656 and 672 nm. The negative peak at 642
nm showed an increase in amplitude relative to the control, along with a blue shift
of about 7 nm. The Soret band peaks at 443 and 460 nm also decreased in
intensity. The differences in the peak intensity indicate significant differences in
pigment interactions in PSI-LHCI complexes from salt stressed cells
Salt stress effect on the protein content of PSI-LHCI
The proteins were separated by SDS-gel electrophoresis and individual proteins
identified by MALDI-TOF mass spectrometry and immunoblotting. Figs. 5-4 and
FIGURE 5-4 Comparison of the SDS–PAGE polypeptide profiles of thylakoids from C. reinhardtii cells grown under control and salt-stress conditions. A 15-23% gradient gel was used for SDS-PAGE. Equal amounts of protein (100 µg) were loaded onto each lane.
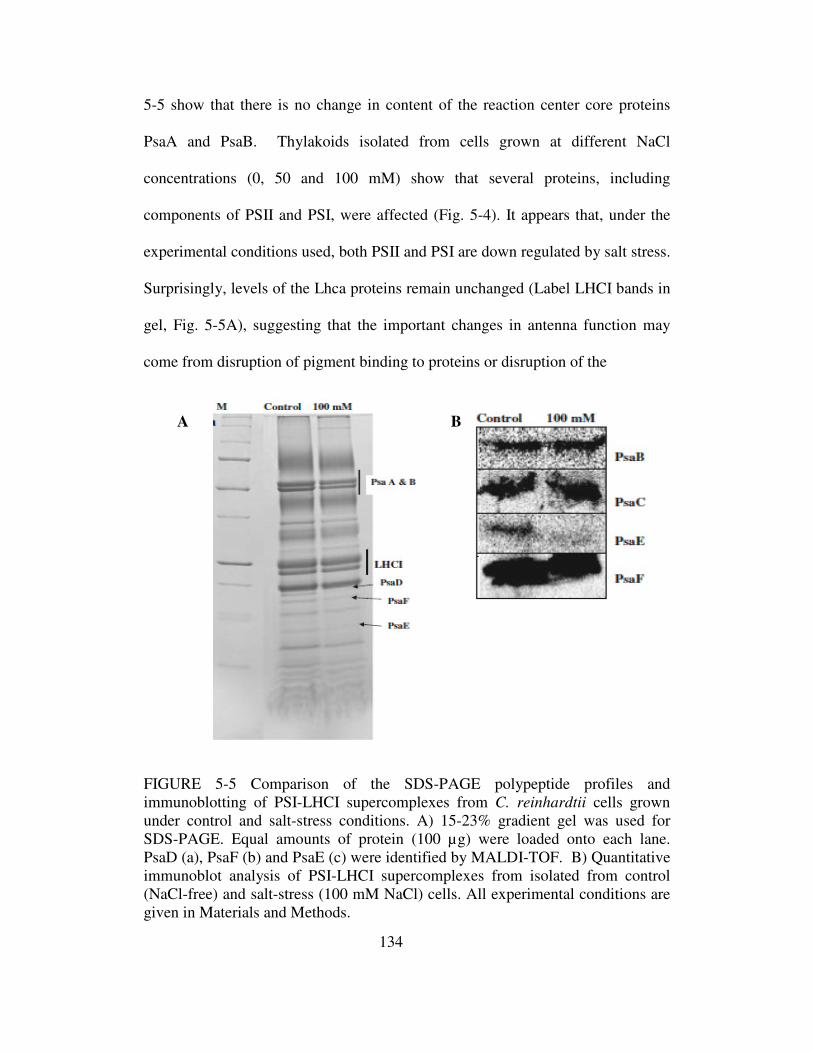
134
5-5 show that there is no change in content of the reaction center core proteins
PsaA and PsaB. Thylakoids isolated from cells grown at different NaCl
concentrations (0, 50 and 100 mM) show that several proteins, including
components of PSII and PSI, were affected (Fig. 5-4). It appears that, under the
experimental conditions used, both PSII and PSI are down regulated by salt stress.
Surprisingly, levels of the Lhca proteins remain unchanged (Label LHCI bands in
gel, Fig. 5-5A), suggesting that the important changes in antenna function may
come from disruption of pigment binding to proteins or disruption of the
FIGURE 5-5 Comparison of the SDS-PAGE polypeptide profiles and immunoblotting of PSI-LHCI supercomplexes from C. reinhardtii cells grown under control and salt-stress conditions. A) 15-23% gradient gel was used for SDS-PAGE. Equal amounts of protein (100 µg) were loaded onto each lane. PsaD (a), PsaF (b) and PsaE (c) were identified by MALDI-TOF. B) Quantitative immunoblot analysis of PSI-LHCI supercomplexes from isolated from control (NaCl-free) and salt-stress (100 mM NaCl) cells. All experimental conditions are given in Materials and Methods.
A B

135
PSI-LHCI interface, rather than from reduced Lhca protein synthesis. More
importantly, levels of the PsaD, PsaF and PsaE proteins were reduced (Fig. 5-5A).
The content of PsaD is decreased upon increasing concentration of NaCl; the
PsaD band is clearly visible in the control thylakoids (Fig. 5-4). This band has
been identified as PsaD by MALDI-TOF. The monoisotopic masses obtained
from MALDI-TOF were analyzed using the Aldente peptide mass fingerprinting
tool (http://www.expasy.org/tools/aldente/) and a match was found to PsaD from
C. reinhardtii in thylakoids. Of all the PSI subunits, PsaE seems to be the most
sensitive and is completely depleted by salt stress (Fig. 5-5B). The immunoblot
data also confirm that levels of these subunits were reduced due to salt stress. In
contrast to the other membrane-extrinsic subunits, levels of PsaC did not change.
Flouroscence decay kinetics
Fluorescence decay spectra were measured using an ultrafast streak camera setup
for PSI-LHCI supercomplexes isolated under salt stress, and for control
conditions. For each sample, kinetics were measured on 800 ps, 1.4 ns, and 2 ns
timescales and fit to three decay components.
The component with the shortest lifetime was very consistent across
samples and timescales, with a lifetime of ~33 ps. Based on comparison with
previous studies of excitation trapping in PSI , this component of the fluorescence
decay can be attributed to the trapping of excitons originating within the PSI core
(76). The second component, which has previously been associated with the
trapping of excitons originating in the peripheral LHCI complexes, is more
heterogeneous (138). As is shown in Table 5-2, however, the variations between

136
samples measured at different time scales are more significant than the
differences between the three samples. Although fitting the fluorescence decay
with three exponentials provides a convenient description of the kinetics, it must
be kept in mind that the real process being measured is far more complicated – the
lifetimes found by global analysis merely provide characteristic time scales for
various decay processes. Variation of the lifetime found by global analysis with
measurement timescale can be attributed to heterogeneity within this decay phase.
TABLE 5-2 Trapping lifetimes obtained from ultrafast flouorescence
spectroscopy
Sample τ1 τ2
Control 32.1 ± 3.6 ps 172.26 ± 42.4
NaCl stress 31.6 ± 3.8 ps 156.5 ± 32.8
Timescale
800 ps 29.8 ± 3.4 ps 136.1 ± 23.6
1.4 ns 33.4 ± 2.4 ps 161.1 ± 13.2
2 ns 34.9 ± 1.7 ps 196.5 ± 21.2
Only the lifetimes of the first two components are presented; the third was typically fixed at 4 ns during fitting and does not represent functional antenna pigments.
Far more insight into the nature of these decay phases can be obtained by
examining the spectral shapes of the three decay components. The shape of the
first (~33 ps) component is extremely consistent among the samples measured
(Fig. 5-6A). Given that the PsaA and PsaB proteins, which bind the bulk of PSI’s
core antenna, appear based on immunoblotting results to be largely unaffected by

137
salt stress, this suggests strongly that only pigments bound to the PSI core
contribute to this component. This is consistent with structural studies that show
that the PSI core is a stable, tightly-integrated complex (14, 75). Similar
conservation can be seen in the spectral shapes of the third component (3-4 ns);
such lifetimes are typically attributed to detergent-solubilized Chl that is not
coupled to PSI (Fig. 5-6C). It should be noted that the amplitude of the
nanosecond component was much lower in the control sample than in the stress
samples and the spectral shapes could only be compared after normalization. This
indicates that the PSI-LHCI from salt stressed cells contains more uncoupled
pigments.
The major difference in the decay-associated spectra of the control and
salt-stress samples can be seen in the spectral shape of the 120-220 ps component
(Fig. 5-6B). While the decay lifetimes are relatively unchanged by cell growth
under salt stress conditions, this component shows a decrease in emission
intensity on the red side of the peak in the salt-stressed samples. Red emission in
C. reinhardtii PSI has previously been associated with strongly-coupled pigments
bound by the LHCI proteins and so this loss of red emission can be attributed to a
disruption of the LHCI antenna system (139-141).

138
FIGURE 5-6 Representative fluorescence decay-associated spectra (FDAS) obtained from ultrafast fluorescence spectroscopy measurements from isolated PSI-LHCI supercomplexes obtained from C. reinhardtii grown under control (NaCl-free) and stress (100 mM NaCl) conditions. Fluorescence decay lifetimes are A) 35-38 ps B) 122-211 ps and C) 2-4 ns. Each curve shown is the average of the fitted curves from the three data sets collected for each sample.
0.8
0.4
0
Control
100 mM NaCl
0.8
0.4
0
Control
100 mM NaCl
760720680640
0.8
0.4
0
Wavelength, nm
A
B
C
a.u
32-34 ps
120-220 ps
3-4 nsControl
100 mM NaCl

139
DISCUSSION
The primary objective of this work was to evaluate the effects of salt stress on
PSI-LHCI supercomplexes from C. reinhardtii, in an effort to understand the
effects of stress on PSI function. Previous research has shown that many types of
abiotic stress affect PSII, but the extent of damage for PSI is less well studied.
Our results indicate, , that stress-related damage to PSI is also significant and may
be an important part of the organism’s overall stress response.
C. reinhardtii cells were grown at NaCl concentrations of 0 (control) and
100 mM, reaching an OD of ~1 at 650 nm. The control cells reached this growth
within four days; growth in high-salt medium took five days to reach the same
density. High salt conditions clearly impair cell growth; the goal of this study has
been to establish the degree to which this growth impairment results from damage
to PSI-LHCI. In particular, we have attempted to determine the structural
integrity of PSI-LHCI under salt stress, as well as functional changes associated
with structural rearrangements. The electron transfer activity was decreased (Fig.
5-2), but levels of the subunits PsaA and PsaB, which form the core of PSI and
bind the majority of the cofactors of the electron transfer chain (ETC) (P700, A,
AO, phylloquinones (A1) and the 4Fe4S clusters, FX) (ETC) , were unchanged.
This suggests that the impairment may lie in energy transfer from LHCI to PSI
core, or in damage to the acceptor side of PSI (terminal FeS clusters FA + FB),
rather than to the oxidizing side of the ETC.
In keeping with these results, the fluorescence decay component
associated with trapping in the PSI core was virtually unchanged between the

140
control and salt stress samples (Fig. 5-6A). Differences were quite apparent in the
second component (Fig. 5-6B), which decays on the 120-220 ps timescale. The
curves look similar on the blue side of the emission peak, but the stressed samples
show significantly less emission on the red side than the control sample. Red-
shifted pigments in photosynthetic systems typically arise from strongly-coupled
dimers of Chl molecules and may exert a significant influence on the exciton
trapping dynamics. Previous spectroscopic studies of green algal PSI have
indicated that the PSI core in C. reinhardtii does not contain any pigments with
transition energies lower than that of P700 – longer-wavelength pigments are
associated only with the peripheral LHCI complexes (139-141). The loss of red-
shifted emission in the salt samples can therefore be attributed to the change in
pigment-pigment interactions of LHCI complexes under stress conditions.
The visible CD data show an increase in amplitude at 676 and 656 nm,
which can be attributed to a loss of tightly coupled Chl a in the LHCI antenna.
The peak associated with Chl b shifts from 640 to 630 nm under salt stress
conditions (Fig. 5-3), suggesting a change in pigment-pigment interactions and
may arise, for example, from a change of the Chl a to Chl b distance.
The stromal acceptor side of the PSI reaction center is damaged by high
salt conditions. Our results show (Figs. 5-4 and 5-5) a clear reduction in the
membrane-extrinsic PsaD and PsaE subunits, as well as the transmembrane PsaF
subunit of PSI. The reduction is most dramatic in the case of PsaE in both
thylakoids and isolated PSI-LHCI supercomplexes. The crystal structure of
Thermosynechococcus PSI shows that PsaE stabilizes the stromal hump and the

141
interaction between the PsaA/B heterodimer and PsaC (14, 142). The higher
plant PSI structure retains the same organization as the cyanobacterial complex
(75); we assume that green algal PSI also retains the same overall architecture.
From our data, it is clear that the degradation of the PSI stromal ridge begins at
PsaE and PsaD. The PsaE protein is located at the reducing side of photosystem I
(PSI) and stabilizes the stromal hump that is involved in docking the soluble
electron acceptors, particularly ferredoxin /flavodoxin (14, 142). While PsaC
binds the terminal electron acceptors FA and FB and is essential for the function of
PSI, PsaD and PsaE stabilize PsaC and the stromal hump that is involved in
ferredoxin binding (143-145).
The damage to PSI subunits is associated with a decrease in SOD activity;
this decrease probably results in higher levels of reactive oxygen species. Similar
results have been observed in Cd stress in plants (146-148). The loss of PsaE at
the reducing side of PSI may cause electron leakage to oxygen in the light
(Mehler reaction), resulting in the formation of reactive oxygen species which
could in turn damage the Fe-S clusters. These results agree with a very recent
report of a deletion mutant of psaE in the cyanobacterium Synechocystis sp. strain
PCC 6803, which shows increased photodamage due to formation of oxygen
radicals (149). As a result, the ferredoxin docking site near the stromal Fe-S
clusters is destabilized, crippling electron transfer through PSI.
Mutagenesis studies have indicated that the subunits on the reducing side
of PSI assemble in a well-defined order: PsaC first, followed by PsaD and PsaE
(150, 151). Under salt-stress conditions, the dramatic decrease in levels of PsaD

142
(Fig. 5-4) is results in the near-elimination of PsaE (Fig. 5-5B); this correlation
supports a scheme in which the presence of PsaD is a prerequisite for PsaE
binding (152). Immunoblotting results also indicate that the levels of PsaC are
virtually unchanged under salt stress (Fig. 5-5B); this is consistent with an
assembly pathway in which PsaC binds first and is removed last when the
complex is disassembled. This likely does not mean, however, that the function
of PsaC is unimpacted by salt stress (153); PsaD has been proposed to play a role
in the structural stabilization of the otherwise labile PsaC (143, 154, 155), and the
magnetic properties of the terminal FeS clusters FA and FB, which bind to PsaC,
are affected by the presence of PsaD (156, 157). In summary, these results
indicate that the acceptor side of PSI is strongly affected by salt stress and the
electron transfer capabilities of FA and FB could be severely impacted, even if
levels of PsaC are unchanged. Furthermore, it is known that the LHCI proteins
attach to PSI near PsaF so the loss of PsaF under salt stress could explain the loss
of LHCI-associated red emission observed in the fluorescence decay-associated
spectra (26, 75) (Fig. 5-6). All of these results appear to be triggered by the
accumulation of ROS damage in the absence of effective protection from SOD;
this supports the idea that accumulation of SOD in response to salt, drought and
cold stress plays a crucial role in helping the cell to survive under environmental
stress conditions.
The SOD is influencing the changes in PSI organization. However, the
PSII was also damaged and thus C.reinhardtii cell growth was impaired due to
change in both PSI and PSII.

143
CHAPTER 6 CONCLUSIONS
In this dissertation new knowledge was acquired about the photosystem I/light
harvesting complexes (PSI-LHCI) and photosystem II (PSII) from the thermo-
acidophilic red alga, Galdieria sulphuraria and the effect of salt stress on the PSI-
LHCI complex of the green alga, Chlamydomonas reinhardtii. The work
presented here shed new light into the evolution of PSI-LHCI and PSII. Results of
this thesis on top-down mass spectrometry usage for characterization of large
integral membrane proteins are of exteme interest to the general scientific
community.
An introduction on photosynthesis and current knowledge of
photosynthetic membrane protein complexes was described in chapter 1. In
chapter 2, isolation and purification of PSI-LHCI supercomplex and PSII from
Galdieria sulphuraria were described. Both isolated photosystems are of high
purity and photochemically active and are used for experiments conducted in
chapter 3 and 4.
In chapter 3, our study described for the first time a functionally tightly
coupled PSI-LHCI complex in an eukaryote (Galdieria sulphuraria) using
electron microscopy and ultra-fast fluorescence spectroscopy. Electron
micrographs of Galdieria PSI-LHCI revealed a tightly coupled complex that may
contain a second layer of light harvesting complexes (LHC’s) on one side of the
monomer. In contrast to higher plants PSI-LHCI complex which contains 4 light
harvesting proteins, Galdieria PSI-LHCI supercomplex contains 8 to 10 light
harvesting proteins per monomer. The most exciting results are from the ultra-fast

144
fluorescence spectroscopy which shows for the first time that the large PSI-LHCI
complex in Galdieria is tightly functionally coupled where excitation energy
transfer between LHCI to the PSI reaction center occurs in a timescale of 47 ps. In
comparison, the PSI-LHCI complex of green algae and plants excitation energy
transfer between LHCI and PSI reaction center occurs in a timescale of 120 ps or
longer which is remarkable as these complexes have only four light harvesting
proteins. Biochemical characterization of the isolated Galdieria PSI-LHCI
complex is highly stable and remains intact during the purification process. This
is futher confirmed by the ultrafast fluorescence spectroscopy results which shows
that by less than 2% of long live chlorophyll fluorescence component is coming
from the uncoupled free chlorophylls. This tight coupling between the PSI and
LHCI proteins is essential for efficient light harvesting for Galdieria, as they
thrive in acidic crevices in volcanic rocks and endolithic habitats which has
consistent low light conditions.
LHC proteins are proposed to have evolved following a series of
duplication and fusion events of Hlips (high light-induced proteins) present in an
ancient photosynthetic organism, an ancestor of today’s cyanobacteria, algae and
higher plants. Phylogenetic studies have shown that LHC proteins of rhodophyta
(red alga) diverged early from an ancestral LHC protein in an ancient
photosynthetic eukaryote and developed independently as chlorophyll-a binding
LHC proteins. Further, it is been proposed that a first fully functional light
harvesting protein will be more likely associated with PSI than with PSII (158).
With Galdieria assumed to represent an ancient PSI, we can assume the LHC
145
proteins associated with its PSI core most likely represents an ancestral LHC
protein evolved from an ancestral prokaryote, older than the current LHC proteins
present in other red algae, green algae and higher plants. Furthermore, the five
LHC proteins identified in Galdieria have a 56 % sequence identity with each
other, forming a homogenous family, indicating that they had evolved from a
common ancestor (39). Considering Galdieria’s habitat, there are only a few
pockets of acidic sites distributed in the Earth. Additionally, Galdieria is
restricted to migration, as they are susceptible to dessication, mesophilic
conditions and neutral pH. So Galdieria must be geographically isolated in their
acidic habitats, which in turn reduces chance of horizontal gene transfer from
other organisms. So our hypothesis is, Galdieria PSI diverged from an ancient
photosynthetic eukaryote with loosely attached antenna complexes, but owing to
their habitat and movement restriction they have adapted in their low light habitat
for hundred million years. Over time, tighter coupling between lhcr proteins with
PSI core in Galdieria might have occurred later due to survival pressure under
light deprived conditions. Adaptation to this unique environment niche over years
might explain the reason for the uniqueness of 30 % of the Galdieria genome in
comparison with other Cyanidiales. Like Galdieria, cyanobacteria habitats are
often characterized by light deprived conditions. But Galdieria and cyanobacteria
might have taken different routes in evolution process for efficient light
harvesting: cyanobacteria had changed its PSI oligomeric state from monomer to
trimer, while Galdieria PSI with its primary loosely attached light harvesting
complexes has optimized its LHCr proteins to a tighter coupling with its PSI core.

146
Our hypothesis is strengthen by the results of a phylogenetic study, stating that
Galdieria and its sister species (cyanidiales) has a long evolutionary history and
they represent one of the ancient forms of red algae, diverged about 1.3 billions
years ago from other red algae forming distinct lineage. It will be of high interest
for future studies to address whether the close coupling observed in our study is
the result of a static, unregulatable arrangement of auxillary antenna proteins, or
whether Galdieria possesses other means (besides traditional state transitions) of
adapting its light-harvesting machinery to variable light conditions. Also, a
phylogenetic analysis study of Galdieria lhcr proteins will beneficial to clarify
our fore-mentioned hypothesis.
In chapter 4, high-resolution top-down MS was used to characterize
eleven integral and five peripheral subunits of a large integral membrane protein,
photosystem II (750 kDa) of the eukaryotic red alga, Galdieria sulphuraria.
Galdieria PSII was used as a model protein to show the amenability of integral
membrane proteins to top-down MS. Galdieria PSII has been characterized with
unprecedented detail with identification of post translational modification of all
the peripheral and small membrane subunits. This study is a technology
advancement paving the way for the usage of top-down mass spectrometry for
characterization of other large integral membrane proteins.
The primary separation used LC MS with concomitant fraction collection
(LC-MS+), yielding around 40 intact mass tags at 100 ppm mass accuracy on a
low-resolution ESI mass spectrometer, whose retention time and mass were used
to guide subsequent high-resolution top-down nano-electrospray FT ion-cyclotron

147
resonance MS experiments (FT-MS). Both collisionally activated and electron
capture dissociation were used to confirm the presence of eleven small subunits to
mass accuracy within 5 ppm; PsbE, PsbF, PsbH, PsbI, PsbJ, PsbK, PsbL, PsbM,
PsbT, PsbX and PsbZ. All subunits showed covalent modifications that fall into
three classes including retention of initiating formyl-methionine, removal of
methionine at the N-terminus with or without acetylation, and removal of a longer
N-terminal peptide. Peripheral subunits identified by top-down analysis included
oxygen-evolving complex subunits PsbO, PsbU, PsbV, as well as two new
subunits, Psb28 (PsbW) and Psb27 (‘‘PsbZ-like’’) not present in cyanobacteria.
Top-down high-resolution MS provides the necessary precision, typically less
than 5 ppm, for identification and characterization of polypeptide composition of
this important membrane protein complex. By using top-down mass spectrometry,
it is easy to see where the actual primary structure diverges from that predicted by
translation of DNA sequence. Top-down high-resolution MS is clearly the
technology of choice for absolute characterization of protein identity and
modification.
In chapter 5, we have used Chlamydomonas reinhardtii as a model system
to study the effects of high salt conditions on PSI-LHCI supercomplexes. This is
the first study that shows a rearrangement of PSI-LHCI supercomplexes under
salt stress and identified functional changes that occur in PSI-LHCI supercomplex
under high salt conditions. Our results indicate that the acceptor side of PSI
consisting of PsaC, PsaD and PsaE is affected by salt stress. This result might also
have a high general impact because nearly 20 to 25 % of the world arable land is

148
affected by soil salinity. These results may be used for example in the future to
develop agricultural crop plants which can grow under higher salt conditions for
higher crop yield.
149
REFERENCES
1. Fromme, P., editor. 2005. Photosynthetic protein complexes : A Structural Approach. Wiley-Blackwell, Weinheim.
2. Blankenship, R. E. 2002. Molecular Mechanisms of Photosynthesis.
Blackwell Science, Oxford. 3. Holland, H. D. 1997. Geochemistry - Evidence for life on Earth more than
3850 million years ago. Science 275:38-39. 4. Olson, J. M. 2006. Photosynthesis in the Archean Era. Photosynthesis
Research 88:109-117. 5. Canfield, D. E., K. S. Habicht, and B. Thamdrup. 2000. The Archean
sulfur cycle and the early history of atmospheric oxygen. Science 288:658-661.
6. Jahnke, L. L., R. E. Summons, J. M. Hope, and D. J. des Marais. 1999.
Carbon isotopic fractionation in lipids from methanotrophic bacteria II: The effects of physiology and environmental parameters on the biosynthesis and isotopic signatures of biomarkers. Geochimica Et Cosmochimica Acta 63:79-93.
7. Marais, D. J. D., H. Strauss, R. E. Summons, and J. M. Hayes. 1992.
Carbon isotope evidence for the stepwise oxidation of the proterozoic environment Nature 359:605-609.
8. Nelson, N., and A. Ben-Shem. 2004. The complex architecture of
oxygenic photosynthesis. Nature Reviews Molecular Cell Biology 5:971-982.
9. Vanselow, C., A. P. M. Weber, K. Krause, and P. Fromme. 2009. Genetic
analysis of the Photosystem I subunits from the red alga, Galdieria sulphuraria. Biochimica Et Biophysica Acta-Bioenergetics 1787:46-59.
10. Loll, B., J. Kern, W. Saenger, A. Zouni, and J. Biesiadka. 2005. Towards
complete cofactor arrangement in the 3.0 angstrom resolution structure of photosystem II. Nature 438:1040-1044.
11. Kurisu, G., H. M. Zhang, J. L. Smith, and W. A. Cramer. 2003. Structure
of the cytochrome b(6)f complex of oxygenic photosynthesis: Tuning the cavity. Science 302:1009-1014.

150
12. Inoue, T., M. Gotowda, H. Sugawara, T. Kohzuma, F. Yoshizaki, Y. Sugimura, and Y. Kai. 1999. Structure comparison between oxidized and reduced plastocyanin from a fern, Dryopteris crassirhizoma. Biochemistry 38:13853-13861.
13. Sawaya, M. R., D. W. Krogmann, A. Serag, K. K. Ho, T. O. Yeates, and
C. A. Kerfeld. 2001. Structures of cytochrome c-549 and cytochrome c(6) from the cyanobacterium Arthrospira maxima. Biochemistry 40:9215-9225.
14. Jordan, P., P. Fromme, H. T. Witt, O. Klukas, W. Saenger, and N. Krauss.
2001. Three-dimensional structure of cyanobacterial photosystem I at 2.5 angstrom resolution. Nature 411:909-917.
15. Morales, R., M. H. Chron, G. Hudry-Clergeon, Y. Petillot, S. Norager, M.
Medina, and M. Frey. 1999. Refined X-ray structures of the oxidized, at 1.3 angstrom, and reduced, at 1.17 angstrom, [2Fe-2S] ferredoxin from the cyanobacterium Anabaena PCC7119 show redox-linked conformational changes. Biochemistry 38:15764-15773.
16. Serre, L., F. Vellieux, M. Medina, C. GomezMoreno, J. C.
FontecillaCamps, and M. Frey. 1996. Crystal structures of a ferredoxin:NADP(+) reductase and of a complex with NADP(+). Biochemical Society Transactions 24:S10-S10.
17. Serre, L., F. M. D. Vellieux, M. Medina, C. GomezMoreno, J. C.
FontecillaCamps, and M. Frey. 1996. X-ray structure of the Ferredoxin:NADP(+) reductase from the cyanobacterium Anabaena PCC 7119 at 1.8 angstrom resolution, and crystallographic studies of NADP(+) binding at 2.25 angstrom resolution. Journal of Molecular Biology 263:20-39.
18. Abrahams, J. P., A. G. W. Leslie, R. Lutter, and J. E. Walker. 1994.
Structure at 2.8-angstrom of F1-ATPase from bovine-heart-mitochondria Nature 370:621-628.
19. Guskov, A., J. Kern, A. Gabdulkhakov, M. Broser, A. Zouni, and W.
Saenger. 2009. Cyanobacterial photosystem II at 2.9-angstrom resolution and the role of quinones, lipids, channels and chloride. Nature Structural & Molecular Biology 16:334-342.
20. Shi, L. X., and W. P. Schroder. 2004. The low molecular mass subunits of
the photosynthetic supracomplex, photosystem II. Biochimica Et Biophysica Acta-Bioenergetics 1608:75-96.
151
21. Grotjohann, I., C. Jolley, and P. Fromme. 2004. Evolution of photosynthesis and oxygen evolution: Implications from the structural comparison of Photosystems I and II. Physical Chemistry Chemical Physics 6:4743-4753.
22. Enami, I., T. Suzuki, O. Tada, Y. Nakada, K. Nakamura, A. Tohri, H.
Ohta, I. Inoue, and J. R. Shen. 2005. Distribution of the extrinsic proteins as a potential marker for the evolution of photosynthetic oxygen-evolving photosystem II. Febs Journal 272:5020-5030.
23. Kammel, M., J. Kern, W. Lubitz, and R. Bittl. 2003. Photosystem II single
crystals studied by transient EPR: the light-induced triplet state. Biochimica Et Biophysica Acta-Bioenergetics 1605:47-54.
24. Campbell, M. K. 2006. Biochemistry. Thomas Brooke/Cole, Belmont,
CA. 25. Fromme, P., P. Jordan, and N. Krauss. 2001. Structure of photosystem I.
Biochimica Et Biophysica Acta-Bioenergetics 1507:5-31. 26. Ben-Shem, A., F. Frolow, and N. Nelson. 2003. Crystal structure of plant
photosystem I. Nature 426:630-635. 27. Amunts, A., O. Drory, and N. Nelson. 2007. The structure of a plant
photosystem I supercomplex at 3.4 angstrom resolution. Nature 447:58-63.
28. Amunts, A., and N. Nelson. 2009. Plant Photosystem I Design in the Light
of Evolution. Structure 17:637-650. 29. Kouril, R., A. Zygadlo, A. A. Arteni, C. D. de Wit, J. P. Dekker, P. E.
Jensen, H. V. Scheller, and E. J. Boekema. 2005. Structural characterization of a complex of photosystem I and light-harvesting complex II of Arabidopsis thaliana. Biochemistry 44:10935-10940.
30. Takahashi, H., M. Iwai, Y. Takahashi, and J. Minagawa. 2006.
Identification of the mobile light-harvesting complex II polypeptides for state transitions in Chlamydomonas reinhardtii. Proceedings of the National Academy of Sciences of the United States of America 103:477-482.
31. Ciniglia, C., H. S. Yoon, A. Pollio, G. Pinto, and D. Bhattacharya. 2004.
Hidden biodiversity of the extremophilic Cyanidiales red algae. Molecular Ecology 13:1827-1838.

152
32. Weber, A. P. M., C. Oesterhelt, W. Gross, A. Brautigam, L. A. Imboden, I. Krassovskaya, N. Linka, J. Truchina, J. Schneidereit, H. Voll, L. M. Voll, M. Zimmermann, A. Jamai, W. R. Riekhof, B. Yu, R. M. Garavito, and C. Benning. 2004. EST-analysis of the thermo-acidophilic red microalga Galdieria sulphuraria reveals potential for lipid A biosynthesis and unveils the pathway of carbon export from rhodoplasts. Plant Molecular Biology 55:17-32.
33. Yoon, H. S., C. Ciniglia, M. Wu, J. M. Comeron, G. Pinto, A. Pollio, and
D. Bhattacharya. 2006. Establishment of endolithic populations of extremophilic Cyanidiales (Rhodophyta). Bmc Evolutionary Biology 6:12.
34. Oesterhelt, C., S. Vogelbein, R. P. Shrestha, M. Stanke, and A. P. M.
Weber. 2008. The genome of the thermoacidophilic red microalga Galdieria sulphuraria encodes a small family of secreted class III peroxidases that might be involved in cell wall modification. Planta 227:353-362.
35. Linka, M., A. Jamai, and A. P. M. Weber. 2008. Functional
Characterization of the Plastidic Phosphate Translocator Gene Family from the Thermo-Acidophilic Red Alga Galdieria sulphuraria Reveals Specific Adaptations of Primary Carbon Partitioning in Green Plants and Red Algae. Plant Physiology 148:1487-1496.
36. Gardian, Z., L. Bumba, A. Schrofel, M. Herbstova, J. Nebesarova, and F.
Vacha. 2007. Organisation of Photosystern I and Photosystem II in red alga Cyanidium caldarium: Encounter of cyanobacterial and higher plant concepts. Biochimica Et Biophysica Acta-Bioenergetics 1767:725-731.
37. Adachi, H., I. Enami, T. Henmi, N. Kamiya, and J. Shen. 2007.
Purification and crystallization of photosystem II complex from a red alga Cyanidium caldarium. Photosynthesis Research 91:PS440.
38. Adachi, H., Y. Umena, I. Enami, T. Henmi, N. Kamiya, and J. R. Shen.
2009. Towards structural elucidation of eukaryotic photosystem II: Purification, crystallization and preliminary X-ray diffraction analysis of photosystem II from a red alga. Biochimica Et Biophysica Acta-Bioenergetics 1787:121-128.
39. Marquardt, J., B. Lutz, S. Wans, E. Rhiel, and W. E. Krumbein. 2001. The
gene family coding for the light-harvesting polypeptides of Photosystem I of the red alga Galdieria sulphuraria. Photosynthesis Research 68:121-130.
40. Enami, I., S. Kikuchi, T. Fukuda, H. Ohta, and J. R. Shen. 1998. Binding
and functional properties of four extrinsic proteins of photosystem II from

153
a red alga, Cyanidium caldarium, as studied by release - Reconstitution experiments. Biochemistry 37:2787-2793.
41. Enami, I., S. Yoshihara, A. Tohri, A. Okumura, H. Ohta, and J. R. Shen.
2000. Cross-reconstitution of various extrinsic proteins and photosystem II complexes from cyanobacteria, red algae and higher plants. Plant and Cell Physiology 41:1354-1364.
42. Dekker, J. P., E. J. Boekema, H. T. Witt, and M. Rogner. 1988. Refined
purification and further characterization of oxygen-evolving and Tris-treated photosystem II particles from the thermophilic cyanobacterium Synechococcus sp. Biochimica Et Biophysica Acta 936:307-318.
43. Kern, J., B. Loll, C. Luneberg, D. DiFiore, J. Biesiadka, K. D. Irrgang, and
A. Zouni. 2005. Purification, characterisation and crystallisation of photosystem II from Thermosynechococcus elongatus cultivated in a new type of photobioreactor. Biochimica Et Biophysica Acta-Bioenergetics 1706:147-157.
44. Li, Y. X., Z. Q. Gao, D. M. Li, G. C. Wang, and F. Wang. 2010. Isolation
and characterization of the oxygen-evolving photosystem II complex from the economical red alga Bangia fusco-purpurea. Russian Journal of Plant Physiology 57:609-614.
45. Nagao, R., T. Tomo, E. Noguchi, S. Nakajima, T. Suzuki, A. Okumura, Y.
Kashino, M. Mimuro, M. Ikeuchi, and I. Enami. 2010. Purification characterization of a stable oxygen-evolving Photosystem II complex from a marine centric diatom, Chaetoceros gracilis Biochimica Et Biophysica Acta-Bioenergetics 1797:576-576.
46. Porra, R. J., W. A. Thompson, and P. E. Kriedemann. 1989. Determination
of accurate extinction coefficients and simultaneous-equations for assaying chlorophyll-a and chlorophyll-b extracted with 4 different solvents - verification of the concentration of chlorphyll standards by atomic-absorption spectroscopy Biochimica et Biophysica Acta 975:384-394.
47. Schagger, H. 2006. Tricine-SDS-PAGE. Nature Protocols 1:16-22. 48. Lees, J. G., and B. A. Wallace. 2002. Synchrotron radiation circular
dichroism and conventional circular dichroism spectroscopy: A comparison. Spectroscopy-an International Journal 16:121-125.
49. Wallace, B. A., and R. W. Janes. 2003. Circular dichroism and
synchrotron radiation circular dichroism spectroscopy: tools for drug

154
discovery (vol 31, pg 631, 2003). Biochemical Society Transactions 31:1531-1531.
50. Miles, A. J., F. Wien, J. G. Lees, A. Rodger, R. W. Janes, and B. A.
Wallace. 2003. Calibration and standardisation of synchrotron radiation circular dichroism and conventional circular dichroism spectrophotometers. Spectroscopy-an International Journal 17:653-661.
51. Lees, J. G., B. R. Smith, F. Wien, A. J. Miles, and B. A. Wallace. 2004.
CDtool - an integrated software package for circular dichroism spectroscopic data processing, analysis, and archiving. Analytical Biochemistry 332:285-289.
52. Whitmore, L., and B. A. Wallace. 2004. DICHROWEB, an online server
for protein secondary structure analyses from circular dichroism spectroscopic data. Nucleic Acids Research 32:W668-W673.
53. Vanstokkum, I. H. M., H. J. W. Spoelder, M. Bloemendal, R.
Vangrondelle, and F. C. A. Groen. 1990. Estimation of protein secondary structure and error analysis from circular-dichroism spectra. Analytical Biochemistry 191:110-118.
54. Sreerama, N., S. Y. Venyaminov, and R. W. Woody. 1999. Estimation of
the number of alpha-helical and beta-strand segments in proteins using circular dichroism spectroscopy. Protein Science 8:370-380.
55. Sreerama, N., and R. W. Woody. 2000. Estimation of protein secondary
structure from circular dichroism spectra: Comparison of CONTIN, SELCON, and CDSSTR methods with an expanded reference set. Analytical Biochemistry 287:252-260.
56. Lees, J. G., A. J. Miles, F. Wien, and B. A. Wallace. 2006. A reference
database for circular dichroism spectroscopy covering fold and secondary structure space. Bioinformatics 22:1955-1962.
57. Gross, W., and C. Schnarrenberger. 1995. Heterotrophic growth of 2
strains of the acido-thermophilic red alga Galdieria sulphuraria Plant and Cell Physiology 36:633-638.
58. Takahashi, T., N. Inoue-Kashino, S. Ozawa, Y. Takahashi, Y. Kashino,
and K. Satoh. 2009. Photosystem II Complex in Vivo Is a Monomer. Journal of Biological Chemistry 284:15598-15606.
155
59. Fromme, P., and H. T. Witt. 1998. Improved isolation and crystallization of Photosystem I for structural analysis. Biochimica Et Biophysica Acta-Bioenergetics 1365:175-184.
60. Hiyama, T., and B. Ke. 1972. Difference spectra and extinction
coefficients of P700 Biochimica et Biophysica Acta 267:160-&. 61. Witt, H., E. Schlodder, C. Teutloff, J. Niklas, E. Bordignon, D. Carbonera,
S. Kohler, A. Labahn, and W. Lubitz. 2002. Hydrogen bonding to P700: Site-directed mutagenesis of threonine A739 of photosystem I in Chlamydomonas reinhardtii. Biochemistry 41:8557-8569.
62. Kitmitto, A., A. Holzenburg, and R. C. Ford. 1997. Two-dimensional
crystals of photosystem I in higher plant grana margins. Journal of Biological Chemistry 272:19497-19501.
63. Whitelegge, J. P., H. M. Zhang, R. Aguilera, R. M. Taylor, and W. A.
Cramer. 2002. Full subunit coverage liquid chromatography electrospray ionization mass spectrometry (LCMS+) of an oligomeric membrane protein - Cytochrome b6f complex from spinach and the cyanobacterium Mastigocladus laminosus. Mol. Cell. Proteomics 1:816-827.
64. Nally, J. E., J. P. Whitelegge, S. Bassilian, D. R. Blanco, and M. A.
Lovett. 2007. Characterization of the outer membrane Proteome of Leptospira interrogans expressed during acute lethal infection. Infection and Immunity 75:766-773.
65. Oostergetel, G. T., W. Keegstra, and A. Brisson. 1998. Automation of
specimen selection and data acquisition for protein electron crystallography. Ultramicroscopy 74:47-59.
66. Arteni, A. A., G. Ajlani, and E. J. Boekema. 2009. Structural organisation
of phycobilisomes from Synechocystis sp strain PCC6803 and their interaction with the membrane. Biochimica et Biophysica Acta 1787.
67. Subramanyam, R., C. Jolley, B. Thangaraj, S. Nellaepalli, A. N. Webber,
and P. Fromme. 2010. Structural and functional changes of PSI-LHCI supercomplexes of Chlamydomonas reinhardtii cells grown under high salt conditions. Planta 231:913-922.
68. Jolley, C. 2007. Structure and dynamics in photosystem I. In Department
of Physics. Arizona State University, Tempe, Arizona.

156
69. Liddell, P. A., M. Gervaldo, J. W. Bridgewater, A. E. Keirstead, S. Lin, T. A. Moore, A. L. Moore, and D. Gust. 2008. Porphyrin-based hole conducting electropolymer. Chemistry of Materials 20:135-142.
70. Nakamura, A., M. Akai, E. Yoshida, T. Taki, and T. Watanabe. 2003.
Reversed-phase HPLC determination of chlorophyll a ' and phylloquinone in Photosystem I of oxygenic photosynthetic organisms - Universal existence of one chlorophyll a ' molecule in Photosystem I. European Journal of Biochemistry 270:2446-2458.
71. Yoshida, E., A. Nakamura, and T. Watanabe. 2003. Reversed-phase
HPLC determination of chlorophyll a ' and naphthoquinones in photosystem I of red algae: Existence of two menaquinone-4 molecules in photosystem I of Cyanidium caldarium. Analytical Sciences 19:1001-1005.
72. Boekema, E. J., A. Hifney, A. E. Yakushevska, M. Piotrowski, W.
Keegstra, S. Berry, K. P. Michel, E. K. Pistorius, and J. Kruip. 2001. A giant chlorophyll-protein complex induced by iron defciency in cyanobacteria. Nature 412:745-748.
73. Germano, M., A. E. Yakushevska, W. Keegstra, H. J. van Gorkom, J. P.
Dekker, and E. J. Boekema. 2002. Supramolecular organization of photosystem I and light- harvesting complex I in Chlamydomonas reinhardtii. Febs Letters 525:121-125.
74. Dekker, J. P., and E. J. Boekema. 2005. Supramolecular organization of
thylakoid membrane proteins in green plants. Biochimica Et Biophysica Acta-Bioenergetics 1706:12-39.
75. Amunts, A., N. Nelson, and O. Drory. 2007. The structure of plant
photosystem I at 3.4 angstrom resolution. Photosynthesis Research 91:PS249.
76. Gobets, B., and R. van Grondelle. 2001. Energy transfer and trapping in
photosystem I. Biochimica Et Biophysica Acta-Bioenergetics 1507:80-99. 77. Bibby, T. S., J. Nield, and J. Barber. 2001. Iron deficiency induces the
formation of an antenna ring around trimeric photosystem I in cyanobacteria. Nature 412:743-745.
78. Andrizhiyevskaya, E. G., D. Frolov, R. van Grondelle, and J. P. Dekker.
2004. Energy transfer and trapping in the Photosystem I complex of Synechococcus PCC 7942 and in its supercomplex with IsiA. Biochimica Et Biophysica Acta-Bioenergetics 1656:104-113.
157
79. Melkozernov, A. N., T. S. Bibby, S. Lin, J. Barber, and R. E. Blankenship. 2003. Time-resolved absorption and emission show that the CP43 ' antenna ring of iron-stressed Synechocystis sp PCC6803 is efficiently coupled to the photosystem I reaction center core. Biochemistry 42:3893-3903.
80. Melkozernov, A. N., J. Kargul, S. Lin, J. Barber, and R. E. Blankenship.
2005. Spectral and kinetic analysis of the energy coupling in the PSI-LHC I supercomplex from the green alga Chlamydomonas reinhardtii at 77 K. Photosynthesis Research 86:203-215.
81. Ihalainen, J. A., I. H. M. van Stokkum, K. Gibasiewicz, M. Germano, R.
van Grondelle, and J. P. Dekker. 2005. Kinetics of excitation trapping in intact Photosystem I of Chlamydomonas reinhardtii and Arabidopsis thaliana. Biochimica Et Biophysica Acta-Bioenergetics 1706:267-275.
82. Boekema, E. J., P. E. Jensen, E. Schlodder, J. F. L. van Breemen, H. van
Roon, H. V. Scheller, and J. P. Dekker. 2001. Green plant photosystem I binds light-harvesting complex I on one side of the complex. Biochemistry 40:1029-1036.
83. Allen, J. F. 2003. State transitions - a question of balance. Science
299:1530-1532. 84. Rochaix, J. D. 2002. Chlamydomonas, a model system for studying the
assembly and dynamics of photosynthetic complexes. Febs Letters 529:34-38.
85. Wollman, F. A. 2001. State transitions reveal the dynamics and flexibility
of the photosynthetic apparatus. Embo Journal 20:3623-3630. 86. Oesterhelt, C., E. Schmalzlin, J. M. Schmitt, and H. Lokstein. 2007.
Regulation of photosynthesis in the unicellular acidophilic red alga Galdieria sulphuraria. Plant Journal 51:500-511.
87. Nam, H. J., J. Jeon, and S. Kim. 2009. Bioinformatic approaches for the
structure and function of membrane proteins. Bmb Reports 42:697-704. 88. Whitelegge, J., F. Halgand, P. Souda, and V. Zabrouskov. 2006. Top-
down mass spectrometry of integral membrane proteins. Expert Rev. Proteomics 3:585-596.
89. Whitelegge, J. P., C. B. Gundersen, and K. F. Faull. 1998. Electrospray-
ionization mass spectrometry of intact intrinsic membrane proteins. Protein Science 7:1423-1430.

158
90. Zabrouskov, V., and J. P. Whitelegge. 2007. Increased coverage in the transmembrane domain with activated-ion electron capture dissociation for top-down Fourier-transform mass spectrometry of integral membrane proteins. Journal of Proteome Research 6:2205-2210.
91. Whitelegge, J. 2009. Confident Assignment of Post-Translational
Modifications Using Top-Down Mass Spectrometry. Mol. Cell. Proteomics:S15-S15.
92. Ploscher, M., B. Granvogl, M. Zoryan, V. Reisinger, and L. A. Eichacker.
2009. Mass spectrometric characterization of membrane integral low molecular weight proteins from photosystem II in barley etioplasts. Proteomics 9:625-635.
93. Gross, W. 2000. Ecophysiology of algae living in highly acidic
environments. Hydrobiologia 433:31-37. 94. Whitelegge, J. 2004. HPLC and Mass Spectrometry of Intrinsic Membrane
Proteins. In HPLC of Peptides and Proteins:Methods and Protocols. M.-I. Aguilar, editor. Humana Press, New Jersey. 323-340.
95. Yakushevska, A. E., P. E. Jensen, W. Keegstra, H. van Roon, H. V.
Scheller, E. J. Boekema, and J. P. Dekker. 2001. Supermolecular organization of photosystem II and its associated light-harvesting antenna in Arabidopsis thaliana. Eur. J. Biochem. 268:6020-6028.
96. Bendtsen, J. D., H. Nielsen, G. von Heijne, and S. Brunak. 2004.
Improved prediction of signal peptides: SignalP 3.0. Journal of Molecular Biology 340:783-795.
97. Tohri, A., T. Suzuki, S. Okuyama, K. Kamino, A. Motoki, M. Hirano, H.
Ohta, J. R. Shen, Y. Yamamoto, and I. Enami. 2002. Comparison of the structure of the extrinsic 33 kDa protein from different organisms. Plant and Cell Physiology 43:429-439.
98. Ohta, H., A. Okumura, S. Okuyama, A. Akiyama, M. Iwai, S. Yoshihara,
J. R. Shen, M. Kamo, and I. Enami. 1999. Cloning, expression of the psbU gene, and functional studies of the recombinant 12-kDa protein of photosystem II from a red alga Cyanidium caldarium. Biochemical and Biophysical Research Communications 260:245-250.
99. Okumura, A., H. Ohta, Y. Inoue, and I. Enami. 2001. Identification of
functional domains of the extrinsic 12 kDa protein in red algal PSII by limited proteolysis and directed mutagenesis. Plant and Cell Physiology 42:1331-1337.
159
100. Enami, I., M. Iwai, A. Akiyama, T. Suzuki, A. Okumura, T. Katoh, O. Tada, H. Ohta, and J. R. Shen. 2003. Comparison of binding and functional properties of two extrinsic components, Cyt c550 and a 12 kDa protein, in cyanobacterial PSII with those in red algal PSII. Plant and Cell Physiology 44:820-827.
101. Glockner, G., A. Rosenthal, and K. Valentin. 2000. The structure and gene
repertoire of an ancient red algal plastid genome. Journal of Molecular Evolution 51:382-390.
102. Dobakova, M., R. Sobotka, M. Tichy, and J. Komenda. 2009. Psb28
Protein Is Involved in the Biogenesis of the Photosystem II Inner Antenna CP47 (PsbB) in the Cyanobacterium Synechocystis sp PCC 6803. Plant Physiology 149:1076-1086.
103. Babu, M. M., and K. Sankaran. 2002. DOLOP-database of bacterial
lipoproteins. Bioinformatics 18:641-643. 104. Roose, J. L., and H. B. Pakrasi. 2008. The Psb27 protein facilitates
manganese cluster assembly in photosystem II. Journal of Biological Chemistry 283:4044-4050.
105. Chen, H., D. Y. Zhang, J. K. Guo, H. Wu, M. F. Jin, Q. T. Lu, C. M. Lu,
and L. X. Zhang. 2006. A Psb27 homologue in Arabidopsis thaliana is required for efficient repair of photodamaged photosystem II. Plant Mol.Biol. 61:567-575.
106. Granvogl, B., M. Zoryan, M. Plocher, and L. A. Eichacker. 2008.
Localization of 13 one-helix integral membrane proteins in photosystem II subcomplexes. Analytical Biochemistry 383:279-288.
107. Kashino, Y., W. M. Lauber, J. A. Carroll, Q. J. Wang, J. Whitmarsh, K.
Satoh, and H. B. Pakrasi. 2002. Proteomic analysis of a highly active photosystem II preparation from the cyanobacterium Synechocystis sp PCC 6803 reveals the presence of novel polypeptides. Biochemistry 41:8004-8012.
108. Gomez, S. M., J. N. Nishio, K. F. Faull, and J. P. Whitelegge. 2002. The
chloroplast grana proteome defined by intact mass measurements from liquid chromatography mass spectrometry. Mol. Cell. Proteomics 1:46-59.
109. O'Connor, H. E., S. V. Ruffle, A. J. Cain, Z. Deak, I. Vass, J. H. A.
Nugent, and S. Purton. 1998. The 9-kDa phosphoprotein of photosystem II. Generation and characterisation of Chlamydomonas mutants lacking

160
PSII-H and a site-directed mutant lacking the phosphorylation site. Biochim. Biophys. Acta-Bioenerg. 1364:63-72.
110. Kashino, Y., H. Koike, M. Yoshio, H. Egashira, M. Ikeuchi, H. B. Pakrasi,
and K. Satoh. 2002. Low-molecular-mass polypeptide components of a photosystem II preparation from the thermophilic cyanobacterium Thermosynechococcus vulcanus. Plant and Cell Physiology 43:1366-1373.
111. Devitry, C., B. A. Diner, and J. L. Popot. 1991. Photosystem-II particles
from Chlamydomonas-reinhardtii - purification, molecular-weight, small subunit composition, and protein-phosphorylation. Journal of Biological Chemistry 266:16614-16621.
112. Yoon, H. S., J. D. Hackett, and D. Bhattacharya. 2006. A genomic and
phylogenetic perspective on endosymbiosis and algal origin. Journal of Applied Phycology 18:475-481.
113. Katoh, H., and M. Ikeuchi. 2001. Targeted disruption of psbX and
biochemical characterization of photosystem II complex in the thermophilic cyanobacterium Synechococcus elongatus. Plant and Cell Physiology 42:179-188.
114. Storf, S., E. J. Stauber, M. Hippler, and V. H. R. Schmid. 2004. Proteomic
analysis of the photosystem I light-harvesting antenna in tomato (Lycopersicon esculentum). Biochemistry 43:9214-9224.
115. Brini, F., M. Hanin, I. Mezghani, G. A. Berkowitz, and K. Masmoudi.
2007. Overexpression of wheat Na+/H+ antiporter TNHX1 and H+-pyrophosphatase TVP1 improve salt- and drought-stress tolerance in Arabidopsis thaliana plants. Journal of Experimental Botany 58:301-308.
116. Allakhverdiev, S. I., Y. Nishiyama, I. Suzuki, Y. Tasaka, and N. Murata.
1999. Genetic engineering of the unsaturation of fatty acids in membrane lipids alters the tolerance of Synechocystis to salt stress. Proceedings of the National Academy of Sciences of the United States of America 96:5862-5867.
117. Dernetriou, G., C. Neonaki, E. Navakoudis, and K. Kotzabasis. 2007. Salt
stress impact on the molecular structure and function of the photosynthetic apparatus - The protective role of polyamines. Biochimica Et Biophysica Acta-Bioenergetics 1767:272-280.
118. Miyao, M., and N. Murata. 1983. Partial disintegration and reconstitution
of the photosynthetic oxygen evolution system - binding of 24 kDa and 18 kDa polypeptides Biochimica Et Biophysica Acta 725:87-93.

161
119. Gilmour, D. J., M. F. Hipkins, A. N. Webber, N. R. Baker, and A. D. Boney. 1985. The effect of ionic stress on photosynthesis in Dunaliella teriolecta - chlorophyll fluorescence kinetics and spectral characteristics Planta 163:250-256.
120. Endo, T., U. Schreiber, and K. Asada. 1995. Suppression of quantum yield
of photosystem II by hyperosmotic stress in Chlamydomonas reinhardtii
Plant and Cell Physiology 36:1253-1258. 121. Satoh, K., C. M. Smith, and D. C. Fork. 1983. Effect of salinity on
primary processes of photosynthesis in the red alga Porphyra perforta Plant Physiology 73:643-647.
122. Everard, J. D., R. Gucci, S. C. Kann, J. A. Flore, and W. H. Loescher.
1994. Gas-exchange and carbon partitioning in the leaves of celery (Apium
graveolens) at various levels of root zone salinity Plant Physiology 106:281-292.
123. Misra, A. N., S. M. Sahu, M. Misra, N. K. Ramaswamy, and T. S. Desai.
1999. Sodium chloride salt stress induced changes in thylakoid pigment-protein complexes, photosystem II activity and thermoluminescence glow peaks. Zeitschrift Fur Naturforschung C-a Journal of Biosciences 54:640-644.
124. Parida, A. K., A. B. Das, and B. Mittra. 2003. Effects of NaCl stress on
the structure, pigment complex composition, and photosynthetic activity of mangrove Bruguiera parviflora chloroplasts. Photosynthetica 41:191-200.
125. Tiwari, B. S., A. Bose, and B. Ghosh. 1997. Photosynthesis in rice under a
salt stress. Photosynthetica 34:303-306. 126. Murata, N., P. S. Mohanty, H. Hayashi, and G. C. Papageorgiou. 1992.
Glycinebetaine stabilizes the association of extrinsic proteins with the photosynthetic oxygen evolving complex Febs Letters 296:187-189.
127. Allakhverdiev, S. I., and N. Murata. 2008. Salt stress inhibits
photosystems II and I in cyanobacteria. Photosynthesis Research 98:529-539.
128. Al-Taweel, K., T. Iwaki, Y. Yabuta, S. Shigeoka, N. Murata, and A.
Wadano. 2007. A bacterial transgene for catalase protects translation of D1 protein during exposure of salt-stressed tobacco leaves to strong light. Plant Physiology 145:258-265.

162
129. Lu, C. M., and A. Vonshak. 1999. Characterization of PSII photochemistry in salt-adapted cells of cyanobacterium Spirulina platensis. New Phytologist 141:231-239.
130. Sudhir, P. R., D. Pogoryelov, L. Kovacs, G. Garab, and S. D. S. Murthy.
2005. The effects of salt stress on photosynthetic electron transport and thylakoid membrane proteins in the cyanobacterium Spirulina platensis. Journal of Biochemistry and Molecular Biology 38:481-485.
131. Verma, K., and P. Mohanty. 2000. Changes of the photosynthetic
apparatus in Spirulina cyanobacterium by sodium stress. Zeitschrift Fur Naturforschung C-a Journal of Biosciences 55:16-22.
132. Gong, H. M., Y. L. Tang, J. Wang, X. G. Wen, L. X. Zhang, and C. M.
Lu. 2008. Characterization of photosystem II in salt-stressed cyanobacterial Spirulina platensis cells. Biochimica Et Biophysica Acta-Bioenergetics 1777:488-495.
133. Takahashi, S., and N. Murata. 2008. How do environmental stresses
accelerate photoinhibition? Trends in Plant Science 13:178-182. 134. Subramanyam, R., C. Jolley, D. C. Brune, P. Fromme, and A. N. Webber.
2006. Characterization of a novel photosystem I-LHCI supercomplex isolated from Chlamydomonas reinhardtii under anaerobic (State II) conditions. Febs Letters 580:233-238.
135. Towbin, H., T. Staehelin, and J. Gordon. 1979. Electrophoretic transfer of
proteins from polyacrylamide gels to nitrocellulose sheets - procedure and some applications Proceedings of the National Academy of Sciences of the United States of America 76:4350-4354.
136. Cho, H. M., L. J. Mancino, and R. E. Blankenship. 1984. Light saturation
curves and quantum yields in reaction centers from photosynthetic bacteria Biophysical Journal 45:455-461.
137. Bassi, R., and D. Simpson. 1987. Chlorophyll-protein complexes of barley
photosystem I European Journal of Biochemistry 163:221-230. 138. Ihalainen, J. A., F. Klimmek, U. Ganeteg, I. H. M. van Stokkum, R. van
Grondelle, S. Jansson, and J. P. Dekker. 2005. Excitation energy trapping in photosystem I complexes depleted in Lhca1 and Lhca4. Febs Letters 579:4787-4791.
139. Gibasiewicz, K., V. M. Ramesh, S. Lin, N. W. Woodbury, and A. N.
Webber. 2002. Excitation dynamics in eukaryotic pS I from

163
Chlamydomonas reinhardtii CC 2696 at 10 K. Direct detection of the reaction center exciton states. Journal of Physical Chemistry B 106:6322-6330.
140. Gibasiewicz, K., V. M. Ramesh, A. N. Melkozernov, S. Lin, N. W.
Woodbury, R. E. Blankenship, and A. N. Webber. 2001. Excitation dynamics in the core antenna of PSI from Chlamydomonas reinhardtii CC 2696 at room temperature. Journal of Physical Chemistry B 105:11498-11506.
141. Gibasiewicz, K., A. Szrajner, J. A. Ihalainen, M. Germano, J. P. Dekker,
and R. van Grondelle. 2005. Characterization of low-energy chlorophylls in the PSI-LHCI supercomplex from Chlamydomonas reinhardtii. A site-selective fluorescence study. Journal of Physical Chemistry B 109:21180-21186.
142. Jensen, P. E., R. Bassi, E. J. Boekema, J. P. Dekker, S. Jansson, D. Leister,
C. Robinson, and H. V. Scheller. 2007. Structure, function and regulation of plant photosystem I. Biochimica Et Biophysica Acta-Bioenergetics 1767:335-352.
143. Chitnis, P. R., Q. Xu, V. P. Chitnis, and R. Nechushtai. 1995. Function
and organization of photosystem I - polypeptides Photosynthesis Research 45:181-181.
144. Ohoka, H., Y. Takahashi, K. Kuriyama, K. Saeki, and H. Matsubara.
1988. The protein responsible for center A/B in spinach photosystem I - isolation with iron-sulfur cluster(s) and complete sequence analysis Journal of Biochemistry 103:962-968.
145. Setif, P., N. Fischer, B. Lagoutte, H. Bottin, and J. D. Rochaix. 2002. The
ferredoxin docking site of photosystem I. Biochimica Et Biophysica Acta-Bioenergetics 1555:204-209.
146. Chaoui, A., S. Mazhoudi, M. H. Ghorbal, and E. ElFerjani. 1997.
Cadmium and zinc induction of lipid peroxidation and effects on antioxidant enzyme activities in bean (Phaseolus vulgaris L). Plant Science 127:139-147.
147. Sandalio, L. M., H. C. Dalurzo, M. Gomez, M. C. Romero-Puertas, and L.
A. del Rio. 2001. Cadmium-induced changes in the growth and oxidative metabolism of pea plants. Journal of Experimental Botany 52:2115-2126.
148. Somashekaraiah, B. V., K. Padmaja, and A. R. K. Prasad. 1992.
Phytotoxicity of cadmium ions on germinating seedlings of mung bean
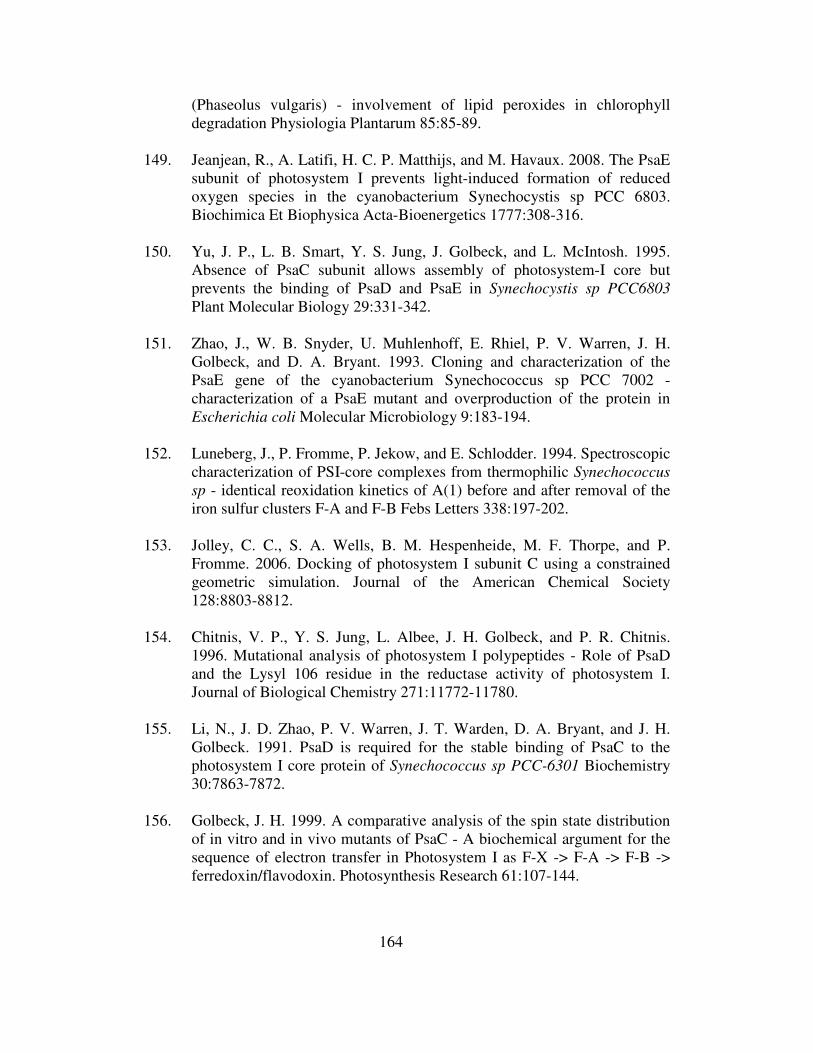
164
(Phaseolus vulgaris) - involvement of lipid peroxides in chlorophyll degradation Physiologia Plantarum 85:85-89.
149. Jeanjean, R., A. Latifi, H. C. P. Matthijs, and M. Havaux. 2008. The PsaE
subunit of photosystem I prevents light-induced formation of reduced oxygen species in the cyanobacterium Synechocystis sp PCC 6803. Biochimica Et Biophysica Acta-Bioenergetics 1777:308-316.
150. Yu, J. P., L. B. Smart, Y. S. Jung, J. Golbeck, and L. McIntosh. 1995.
Absence of PsaC subunit allows assembly of photosystem-I core but prevents the binding of PsaD and PsaE in Synechocystis sp PCC6803 Plant Molecular Biology 29:331-342.
151. Zhao, J., W. B. Snyder, U. Muhlenhoff, E. Rhiel, P. V. Warren, J. H.
Golbeck, and D. A. Bryant. 1993. Cloning and characterization of the PsaE gene of the cyanobacterium Synechococcus sp PCC 7002 - characterization of a PsaE mutant and overproduction of the protein in Escherichia coli Molecular Microbiology 9:183-194.
152. Luneberg, J., P. Fromme, P. Jekow, and E. Schlodder. 1994. Spectroscopic
characterization of PSI-core complexes from thermophilic Synechococcus
sp - identical reoxidation kinetics of A(1) before and after removal of the iron sulfur clusters F-A and F-B Febs Letters 338:197-202.
153. Jolley, C. C., S. A. Wells, B. M. Hespenheide, M. F. Thorpe, and P.
Fromme. 2006. Docking of photosystem I subunit C using a constrained geometric simulation. Journal of the American Chemical Society 128:8803-8812.
154. Chitnis, V. P., Y. S. Jung, L. Albee, J. H. Golbeck, and P. R. Chitnis.
1996. Mutational analysis of photosystem I polypeptides - Role of PsaD and the Lysyl 106 residue in the reductase activity of photosystem I. Journal of Biological Chemistry 271:11772-11780.
155. Li, N., J. D. Zhao, P. V. Warren, J. T. Warden, D. A. Bryant, and J. H.
Golbeck. 1991. PsaD is required for the stable binding of PsaC to the photosystem I core protein of Synechococcus sp PCC-6301 Biochemistry 30:7863-7872.
156. Golbeck, J. H. 1999. A comparative analysis of the spin state distribution
of in vitro and in vivo mutants of PsaC - A biochemical argument for the sequence of electron transfer in Photosystem I as F-X -> F-A -> F-B -> ferredoxin/flavodoxin. Photosynthesis Research 61:107-144.

165
157. Vassiliev, I. R., M. L. Antonkine, and J. H. Golbeck. 2001. Iron-sulfur clusters in type I reaction centers. Biochimica Et Biophysica Acta-Bioenergetics 1507:139-160.
158. Durnford, D. G., J. A. Deane, S. Tan, G. I. McFadden, E. Gantt, and B. R.
Green. 1999. A phylogenetic assessment of the eukaryotic light-harvesting antenna proteins, with implications for plastid evolution. Journal of Molecular Evolution 48:59-68.

166
APPENDIX A
STOCK GROWTH MEDIA SOLUTIONS FOR GALDIERIA SULPHURARIA

167
Appendix A. Stock media solutions for Galdieria sulphuraria
Trace elements solution (1 litre)
2.86 g H3Bo3 1.82 g MnCl2.4H2O 220 mg ZnSO4.7H2O 130 mg (NH4)6 Mo7O27.4H2O 80 mg CuSO4.5H2O 40 mg NaVo3.4H2O 40 mg CoCl2.6H2O Fe-EDTA solution (100 ml)
690 mg FeSO4 930 mg EDTA Heat it to dissolve it. 10X Growth Medium (1 litre)
1.5 mg (NH4)2SO4 300 mg MgSO4.7H2O 300 mg KH2PO4 20 mg CaCl2.2H2O 1.5 ml Fe-EDTA solution 2 ml trace element solution Adjust the pH of the medium to 2 with sulfuric acid.

168
APPENDIX B MS/MS FRAGMENTATION OF LIGHT HARVESTING COMPLEXES (LHCr)
OF GALDIERIA SULPHURARIA
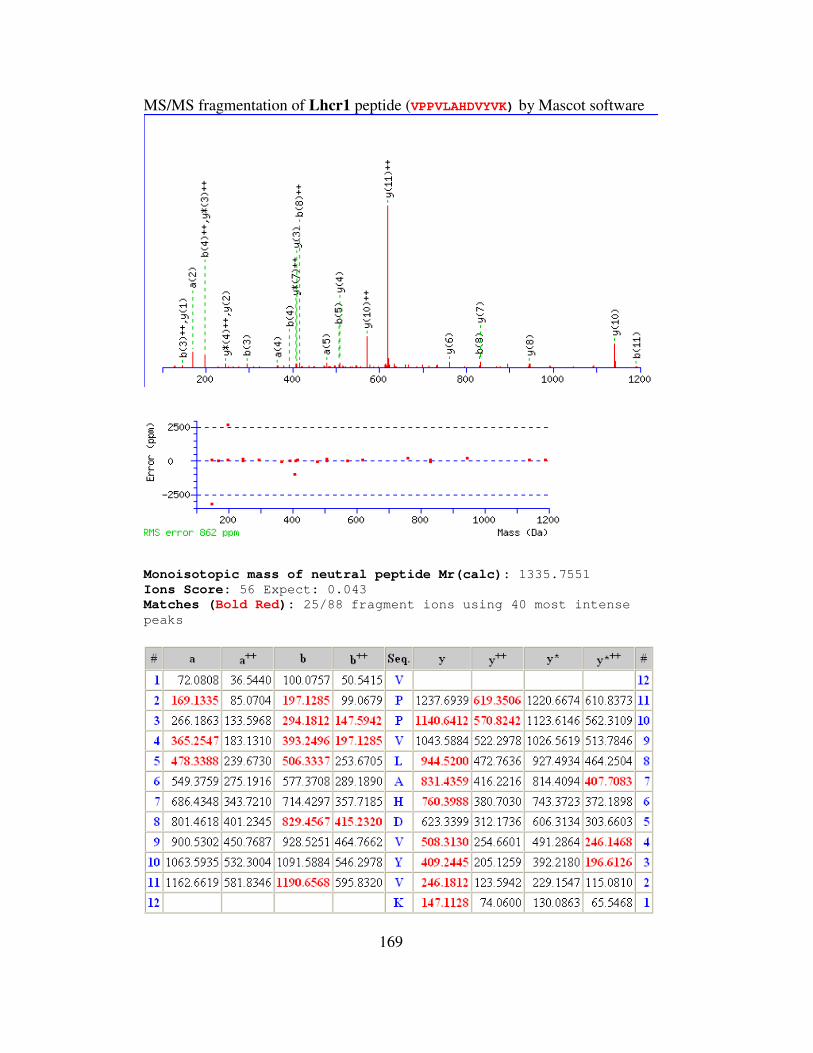
169
MS/MS fragmentation of Lhcr1 peptide (VPPVLAHDVYVK) by Mascot software
Monoisotopic mass of neutral peptide Mr(calc): 1335.7551
Ions Score: 56 Expect: 0.043
Matches (Bold Red): 25/88 fragment ions using 40 most intense
peaks

170
MS/MS fragmentation of LHCr2 peptide (EPGYFGFDPLGLGK) by Mascot software
Monoisotopic mass of neutral peptide Mr(calc): 1495.7347
Fixed modifications: Carbamidomethyl (C)
Ions Score: 62 Expect: 0.01
Matches (Bold Red): 21/104 fragment ions using 68 most intense
peaks
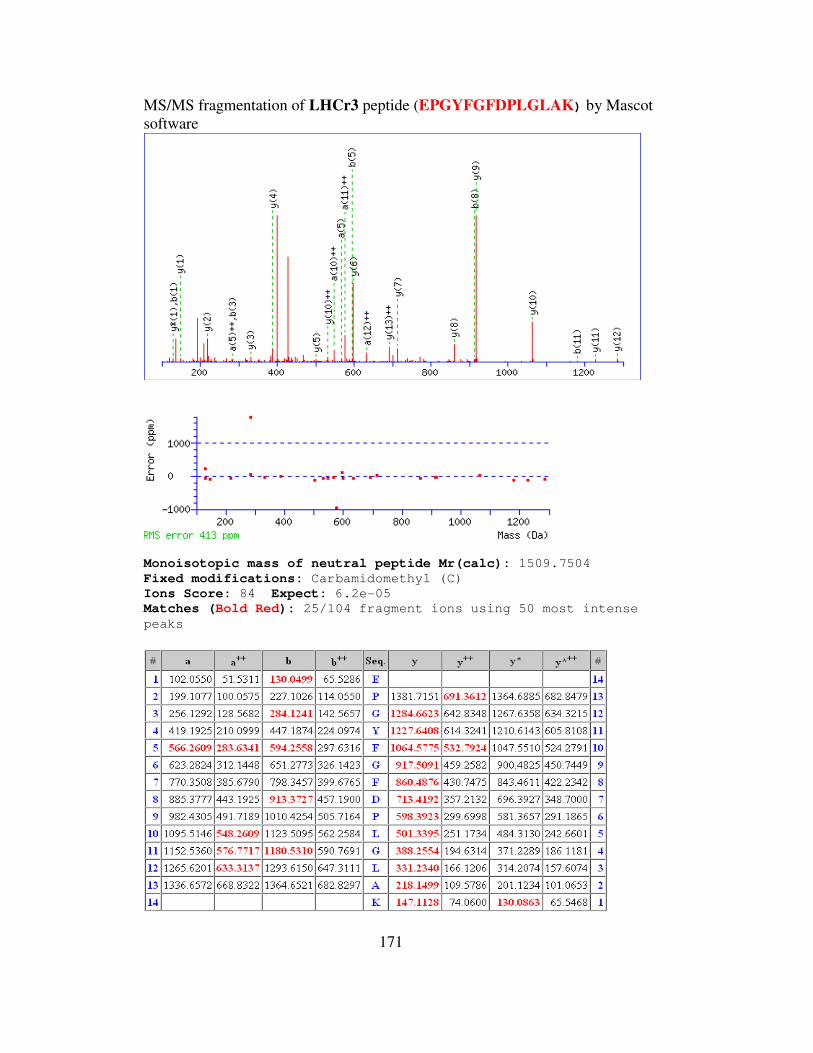
171
MS/MS fragmentation of LHCr3 peptide (EPGYFGFDPLGLAK) by Mascot software
Monoisotopic mass of neutral peptide Mr(calc): 1509.7504
Fixed modifications: Carbamidomethyl (C)
Ions Score: 84 Expect: 6.2e-05
Matches (Bold Red): 25/104 fragment ions using 50 most intense
peaks
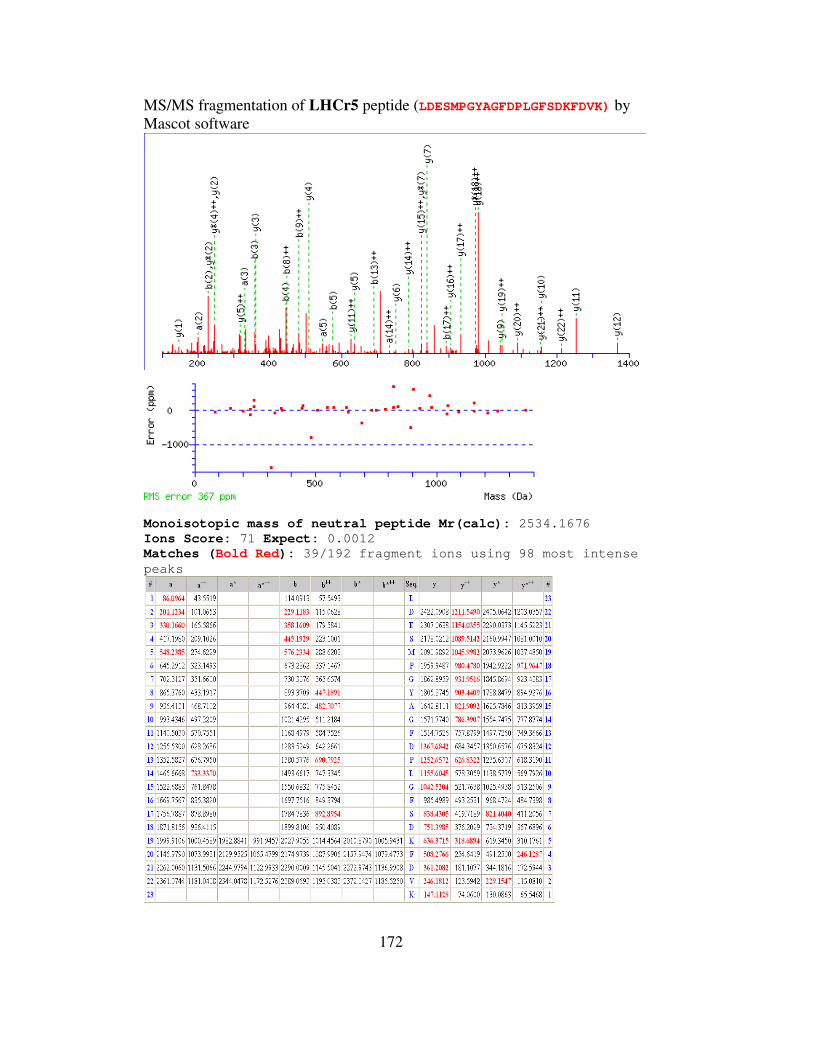
172
MS/MS fragmentation of LHCr5 peptide (LDESMPGYAGFDPLGFSDKFDVK) by Mascot software
Monoisotopic mass of neutral peptide Mr(calc): 2534.1676
Ions Score: 71 Expect: 0.0012
Matches (Bold Red): 39/192 fragment ions using 98 most intense
peaks

173
APPENDIX C
CO-AUTHORS PERMISSION FOR USE OF THE PUBLISHED ARTICLE AS CHAPTER 5
174
Appendix C
The co-authors of the article “Structural and functional changes of PSI-LHCI
supercomplexes of Chlamydomonas reinhardtii cells grown under high salt
conditions” published in Planta Journal (2010: 231 (4): 913-922) have granted
permission for the use of article as a chapter in this dissertation.