Isolation of buildings from ground vibration: a review of ...den/papers/Isolation of Buildings from...
14
39 Isolation of buildings from ground vibration: a review of recent progress D E Newland, MA, ScD, FEng, FIMechE, FIEE and H E M Hunt, PhD, CEng, MIMechE Department of Engineering, University of Cambridge Many buildings near railways are mounted on rubber springs to isolate them from ground vibration. This paper reviews the theory o f resiliently mounted buildings and discusses recent calculations of the effects of (a) diffkent damping models and (b) piled foundations. The paper also describes site measurements in London and laboratory tests in Cambridge which are being made to support new analytical work. 1 PREAMBLE One of the authors (DEN) was an undergraduate at Cambridge when Dick Bishop was a lecturer here and subsequently came to know Dick well in several capac- ities, but particularly as a fellow member of the Edi- torial Panel of this Journal for many years; the other (HEMH) now lectures in Dick’s old department on the same subjects. It is an honour to have this opportunity to contribute to his memorial issue. In doing so the authors offer their sincere tribute to Professor Bishop’s remarkable achievements in vibration engineering. Others have recorded his many accomplishments, but one particular quality was his encouragement of col- leagues. This short review paper is offered as a mark of respect and gratitude for that encouragement and for all his work. This includes many papers on the vibration of beams, plates and structures which are subjects close to the authors’ present one of building vibration. 2 INTRODUCTION In the United Kingdom, the six-storey Albany Court building in London was the first to be isolated against ground-transmitted vibration from an underground railway (1). Underneath the building, the railway had a set of switch points; the vibrations generated in a pre- vious building on the same site were said to be ‘fairly perceptible’ with r.m.s. vibration levels up to 1 mm/s. The new building was mounted on laminated rubber springs which were designed to give a vertical fre- quency of 7 Hz. According to measurements taken shortly after its completion, the vibration environment in the sprung building was reported to be in the range 0.16-0.25 mm/s for a bandwidth of 3-30 Hz. Waller (2) recorded that ‘The (Albany Court) building was behav- ing substantially as a rigid body’. This conclusion, that the behaviour of buildings on springs could be explained by the motion of a rigid body on a damped elastic spring, became conventional wisdom which has only been challenged relatively recently. There are two explanations for this. Firstly, the Albany Court building was a small building (a block of seven flats over the The MS was received on 17 September 1990 and was accepted for publication on 6 February 1991 station booking hall); secondly, the vibration measuring equipment available at the time was relatively primitive. No narrow-band analyses were made and there are no more recent measurements at this site known to the authors. In the twenty-year period that has elasped since Albany Court was built, very much bigger buildings have been mounted on springs and methods of vibra- tion measurement and analysis have become much more sophisticated. As a result there has been a growing realization that a resiliently mounted building is a complex dynamical system in which the properties of the foundation, the method of isolation, and the flex- ibility and damping of the building all contribute to the overall dynamic response. It is now recognized that this response cannot be described by a simple model of a mass on a spring. However, the alternative has not yet been agreed in the sense that there is no generally accepted model for calculating the effectiveness of vibra- tion isolation measures for buildings. In this paper recent progress towards that objective is described. A first impression might be that the large- scale finite element computer programs now available would make the necessary calculations straightforward in principle (if complex in setting up the detailed geometry required). It turns out that the problem is much more complicated than this because of lack of knowledge about how damping should be described and about how it is distributed throughout a building and because of the complex soil/structure interaction that occurs at the foundation of the building. 3 THEORETICAL PREDICTIONS OF VIBRATION TRANSMISSION For a rigid mass on a flexible foundation, the transmis- sibility of harmonic vibration from the ground has the well-known form shown as the solid line in Fig. I. Transmissibility is defined as the ratio of the amplitude of response of the supported mass to the amplitude of excitation of the ground. The high-frequency response decays at a rate of 20 dB/decade and the width of the resonant peak depends upon the damping ratio of the resilient support. This dynamical model assumes linear viscous damping, linear elasticity and only vertical exci- tation. Proc Instn Mech Engrs Vol 205 COS390 I @ IMechE 1991 09S4-4062/91 $2.00 + .OS
Transcript of Isolation of buildings from ground vibration: a review of ...den/papers/Isolation of Buildings from...

39
Isolation of buildings from ground vibration: a review of recent progress
D E Newland, MA, ScD, FEng, FIMechE, FIEE and H E M Hunt, PhD, CEng, MIMechE Department of Engineering, University of Cambridge
Many buildings near railways are mounted on rubber springs to isolate them from ground vibration. This paper reviews the theory of resiliently mounted buildings and discusses recent calculations of the effects of (a) diffkent damping models and (b) piled foundations. The paper also describes site measurements in London and laboratory tests in Cambridge which are being made to support new analytical work.
1 PREAMBLE
One of the authors (DEN) was an undergraduate a t Cambridge when Dick Bishop was a lecturer here and subsequently came to know Dick well in several capac- ities, but particularly as a fellow member of the Edi- torial Panel of this Journal for many years; the other (HEMH) now lectures in Dick’s old department on the same subjects. It is an honour to have this opportunity to contribute to his memorial issue. In doing so the authors offer their sincere tribute to Professor Bishop’s remarkable achievements in vibration engineering. Others have recorded his many accomplishments, but one particular quality was his encouragement of col- leagues. This short review paper is offered as a mark of respect and gratitude for that encouragement and for all his work. This includes many papers on the vibration of beams, plates and structures which are subjects close to the authors’ present one of building vibration.
2 INTRODUCTION
In the United Kingdom, the six-storey Albany Court building in London was the first to be isolated against ground-transmitted vibration from an underground railway (1). Underneath the building, the railway had a set of switch points; the vibrations generated in a pre- vious building on the same site were said to be ‘fairly perceptible’ with r.m.s. vibration levels up to 1 mm/s. The new building was mounted on laminated rubber springs which were designed to give a vertical fre- quency of 7 Hz. According to measurements taken shortly after its completion, the vibration environment in the sprung building was reported to be in the range 0.16-0.25 mm/s for a bandwidth of 3-30 Hz. Waller (2) recorded that ‘The (Albany Court) building was behav- ing substantially as a rigid body’. This conclusion, that the behaviour of buildings on springs could be explained by the motion of a rigid body on a damped elastic spring, became conventional wisdom which has only been challenged relatively recently. There are two explanations for this. Firstly, the Albany Court building was a small building (a block of seven flats over the
The MS was received on 17 September 1990 and was accepted for publication on 6 February 1991
station booking hall); secondly, the vibration measuring equipment available at the time was relatively primitive. No narrow-band analyses were made and there are no more recent measurements at this site known to the authors.
In the twenty-year period that has elasped since Albany Court was built, very much bigger buildings have been mounted on springs and methods of vibra- tion measurement and analysis have become much more sophisticated. As a result there has been a growing realization that a resiliently mounted building is a complex dynamical system in which the properties of the foundation, the method of isolation, and the flex- ibility and damping of the building all contribute to the overall dynamic response. It is now recognized that this response cannot be described by a simple model of a mass on a spring. However, the alternative has not yet been agreed in the sense that there is no generally accepted model for calculating the effectiveness of vibra- tion isolation measures for buildings.
In this paper recent progress towards that objective is described. A first impression might be that the large- scale finite element computer programs now available would make the necessary calculations straightforward in principle (if complex in setting up the detailed geometry required). It turns out that the problem is much more complicated than this because of lack of knowledge about how damping should be described and about how it is distributed throughout a building and because of the complex soil/structure interaction that occurs at the foundation of the building.
3 THEORETICAL PREDICTIONS OF VIBRATION TRANSMISSION
For a rigid mass on a flexible foundation, the transmis- sibility of harmonic vibration from the ground has the well-known form shown as the solid line in Fig. I . Transmissibility is defined as the ratio of the amplitude of response of the supported mass to the amplitude of excitation of the ground. The high-frequency response decays at a rate of 20 dB/decade and the width of the resonant peak depends upon the damping ratio of the resilient support. This dynamical model assumes linear viscous damping, linear elasticity and only vertical exci- tation.
Proc Instn Mech Engrs Vol 205 COS390 I@ IMechE 1991 09S4-4062/91 $2.00 + .OS

D E NEWLAND AND H E M HUNT
.- - .- -0 .9 E 2 E
% -10
-20
?i
;* I :
I ' I ' 1: I t I : < 2 !i !i 5 I I
0 20 40 60 80 100 120 140 160 180 200
Frequency Hz
Fig. 1 Transmissibility curves for a 30 m elastic column resting on a 9 Hz resilient foundation at its base: dashed curve, column damping assumption A; chained curve, column damping assumption B; solid curve, a rigid column of the same total mass. (Displacement excitation below base of resilient pad at h = 0; displacement response measured imme- diately above pad at z = 0, see Fig. 2)
3.1 Response of a single column For the theoretical case of a flexible elastic column (with damping) supported vertically on a resilient pad, the transmissibility for vertical displacement excitation at ground level (that is on top of the pile in Fig. 2) and displacement response at height z is given in Newland (3) for a number of different cases. Exact results have been calculated by solving the partial differential equation in Appendix 1. Two of these cases are shown as the dashed and chained curves in Fig. 1. They apply for a damped elastic column of 30 m height which is mounted on a damped resilient pad at its base, h = 0 in
30 m
Ir I 'i
, Flexible column
Dibplacement rebponse at position z (metres) above ground level , Resilient pad at position h (metres) above ground level
Fig. 2 Damped eiastic column with resilient pad: model for vertical vibration analysis
Part C : Journal of Mechanical Engineering Science
Fig. 2, and for which the response is calculated at z = 0, immediately above the pad. The properties of the resilient pad are such that, for a rigid column of the same mass as the flexible column, the undamped natural frequency of the suspension would be 9 Hz and its damping ratio would be 0.1. The material of the column has the density and elasticity of concrete (see Appendix 2) and there are two different damping assumptions. Damping assumption A (dashed) is one for which all the column modes have the same band- width. Damping assumption B (chained) is one for which the modal bandwidth increases in proportion to the square of the mode's natural frequency. The two damping assumptions may be combined in any propor- tion; however, all the results in this paper are shown for pure damping A or pure damping B as indicated. The physical models which these damping assumptions describe are (A) distributed viscous damping to ground and (B) internal distributed viscous damping [see refer- ence (3), Fig. 12.201. Numerical data are given in Appendix 2.
Similar results are given by Grootenhuis (4) using a third damping assumption that the modal bandwidth increases in proportion to frequency (not frequency squared). This is the consequence of using a complex elastic modulus for the column with a constant ratio of real part to imaginary part.
All these response calculations use the exact theory for the longitudinal vibration of a continuous elastic column. The resilient isolation pad is modelled by a linear, massless spring with viscous damping in our cal- culations (Fig. l) and by a linear, massless spring with hysteretic damping in the calculations by Grootenhuis (4).
Figure 1 illustrates the importance of modelling a building as a flexible structure. Local resonances of the supported assembly greatly modify the transmissibility and the form of the transmissibility curve depends on the elasticity of the building and the damping mecha- nism. The role of different damping models is clearly important in determining overall response levels. At present there is little fundamental knowledge about the mechanisms of energy dissipation in large buildings and research is in progress to try to obtain more informa- tion.
3.2 Response of a column on a pile The column calculations described above determine the ratio of the vibration level on the column above the isolation pad to that below the isolation pad. In prac- tice, the isolation pad will rest upon the building's foun- dations which are generally piles embedded in the ground. Therefore it is important to calculate the trans- mission of vibration from the surroundings through a building's foundation in order to determine the level of vibration likely to occur below the isolation pad.
A dynamical system has been studied consisting of a vertical elastic column mounted on a single vertical pile, both with and without an intermediate resilient iso- lation pad. Both the column and the pile have the same dimensions and material properties as those for the cal- culations shown in Fig. l, with damping assumption A (constant modal bandwidth). The modified response of the column-pile system is shown in Fig. 3a to d, as cal-
0 IMechE 1991

L oz- oz -
01- & z 01- & E’ E. 9 - -.
1:: 1::
2 E. 2
9 E.
- -.
00Z 081 091 OPI OZI 001 08
I------
or“
t
0 r“
OOZ 081 091 OPI 021 001 08 09 OP OZ OP -
t OE -
oz I
1 OP -
OE -
oz -
01- g
0
01
oz

42 D E NEWLAND AND H E M HUNT
-30
-40-
. . . . .. - . . - . ..._ . _ . . . .
_... . . . . . ..... . . . . . . ’.. :. , .. . . .
. . .
. . . . . . - .. __: .. . . . .
. . - ..._.. . *
Frequency Hz
Frequency HZ
(a) Transmissibility curve for response at the top of the column (z = 30 m) and excitation at the pile cap for a column resting on a pile, with an isolation pad located at h = 0 m (solid line), 10 m (dashed), 20 m (chained) and 29.75 m (dotted) from the base of the column. The three-dimensional figure (b) shows the variation of transmissibility with pad position chang- ing continuously from 0 to 30 m
nearly at the top). The stiffness of the pad is calculated at each location to give a rigid-body resonant frequency of 9 Hz, so that the pad stiffness reduces linearly with its position up the column. The equivalent damping coefficient is also adjusted so that the damping ratio remains at 0.1 for all pad positions. From Fig. 4a, it is clear that, for response measured at the top of the column (z = 30 m) and excitation measured at the base (z = 0), the position of the isolation pad significantly influences transmissibility. When the pad is at the top of the column (dotted curve), the transmissibility becomes close to that for the rigid mass shown in Fig. 1, because the small piece of column remaining is very stiff com- pared with the stiffness of the isolation pad; the reson- ance peaks that are still observable arise from the motion of the part of the column below the pad. An overall picture of the variation of transmissibility with pad position is shown in Fig. 4b.
These results show that quite simple elastic models have vibration amplitudes that vary widely with posi- tion and frequency. Similar variations occur in real buildings. Advance knowledge of the distribution of vibrational energy within a large building may have Part C: Journal of Mechanical Engineering Science
important practical consequences in the building’s design. For example, the location of isolation pads could then be chosen so as to minimize vibration at a particularly sensitive location such as an operating theatre in a hospital.
3.3 Response of more complicated structures-the
The theoretical results discussed above are for the longi- tudinal vibration of a vertical elastic column mounted on a resilient base. For the simple case in Fig. 1, an exact theoretical solution is possible; for Figs 3 and 4 the column and pile are modelled exactly, and an approximate model for the soil is used. For more com- plicated cases, involving assemblies of columns and beams, an exact vibration analysis of the ‘building is‘no longer practicable and various attempts have been made to devise ad hoc. models of particular buildings. Swallow (8) uses a lumped parameter model of a single vertical column with additional masses and springs attached to represent the action of connected floors. The soil/foundation interaction is modelled by a mass and spring, subject only to vertical excitation. Damping is included by assuming complex stiffnesses. The author concludes that the standard of isolation achieved depends markedly on structural features and suggests that good isolation relies upon tuning a building to its specific site.
Willford (9) uses a somewhat similar model for prac- tical calculations. This also consists of a single vertical column, but the connected floors are modelled by finite element idealizations, each floor having four elements. The soil model is a frequency-dependent spring and dashpot whose parameter values depend on foundation size and the estimated shear wave velocity in the soil. Willford’s model has been used to analyse several build- ings in London, and apparently achieved good agree- ment with site measurements.
We have modelled a two-dimensional frame structure having two columns and two connecting floors using a finite element model. In order to determine how many elements to include in this model, the response of a single column was first calculated by finite element analysis to compare with the exact results described above. The results quoted below were computed by Bhaskar (lo), using his own finite element program. They have been compared with similar results obtained by Wilson (11) using the MARC-K2 program. There are some detailed differences between the results obtained, due we believe to differences in the way in which damping is included in the finite element models. Figure 5a and b shows Bhaskar’s results for the response of the same elastic column as in Fig. 1. They show transmis- sibility measured across the resilient pad when this is located at the base of the column, h = 0. Calculations are compared with the known exact solution for both damping assumptions A (Fig. 5a) and B (Fig. 5b). Four finite elements represent the column and a discrete spring and viscous damper model the isolation pad. In the MARC-K2 program, it is difficult to select a discrete damper as an element so that the pad is represented by an additional (fifth) element with its own stiffness and damping. In both graphs, the exact solution is shown as the solid line for comparison with the results computed
finite element method
Q IMechE 1991
ISOLATION OF BUILDINGS FROM GROUND VIBRATION: A REVIEW OF RECENT PROGRESS 43
l o t
-40 I I 0 20 40 60 80 100 120 140 160 180 200
Freauencv Hz
(a) For damping assumption A
20 I I
Frequency Hz
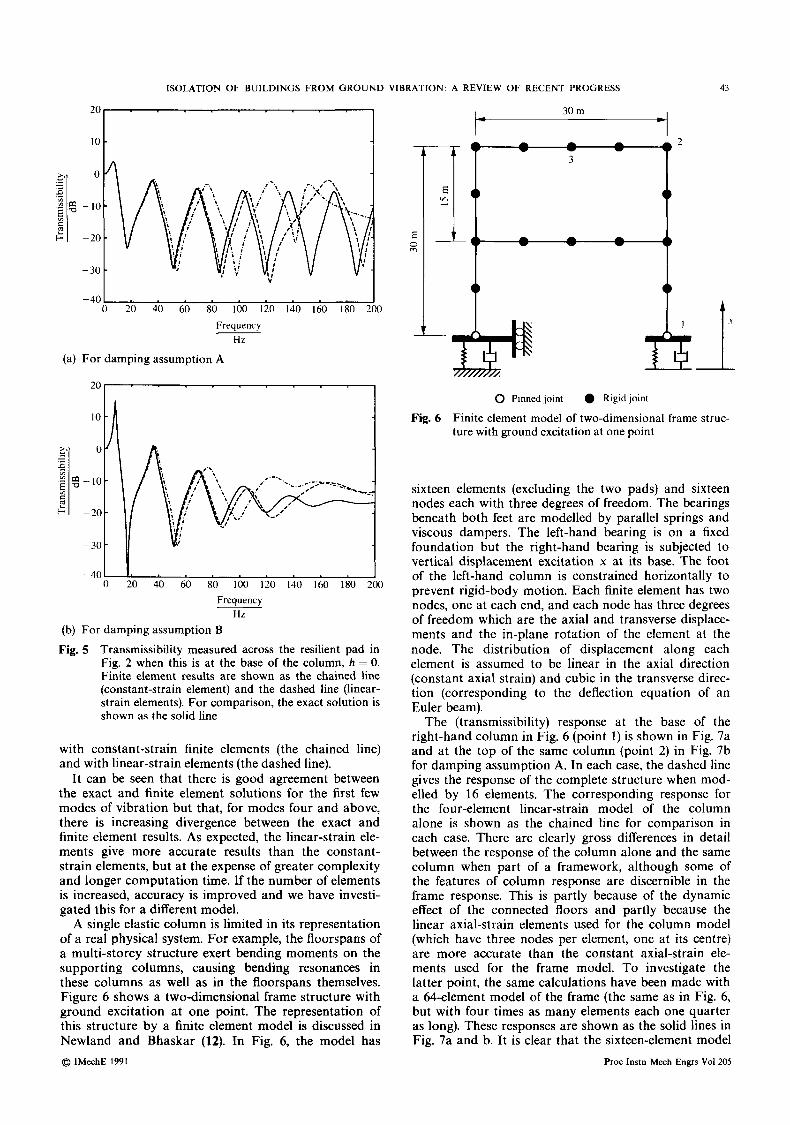
(b) For damping assumption B Fig. 5 Transmissibility measured across the resilient pad in
Fig. 2 when this is at the base of the column, h = 0. Finite element results are shown as the chained line (constant-strain element) and the dashed line (linear- strain elements). For comparison, the exact solution is shown as the solid line
with constant-strain finite elements (the chained line) and with linear-strain elements (the dashed line).
It can be seen that there is good agreement between the exact and finite element solutions for the first few modes of vibration but that, for modes four and above, there is increasing divergence between the exact and finite element results. As expected, the linear-strain ele- ments give more accurate results than the constant- strain elements, but at the expense of greater complexity and longer computation time. If the number of elements is increased, accuracy is improved and we have investi- gated this for a different model.
A single elastic column is limited in its representation of a real physical system. For example, the floorspans of a multi-storey structure exert bending moments on the supporting columns, causing bending resonances in these columns as well as in the floorspans themselves. Figure 6 shows a two-dimensional frame structure with ground excitation at one point. The representation of this structure by a finite element model is discussed in Newland and Bhaskar (12). In Fig. 6, the model has @ IMechE 1991
30 m
a a 2 v t t t 3
E 0 m L
I + I I
$i 0 Pinnedjoint Rigidjoint
Fig. 6 Finite element model of two-dimensional frame struc- ture with ground excitation at one point
sixteen elements (excluding the two pads) and sixteen nodes each with three degrees of freedom. The bearings beneath both feet are modelled by parallel springs and viscous dampers. The left-hand bearing is on a fixed foundation but the right-hand bearing is subjected to vertical displacement excitation x at its base. The foot of the left-hand column is constrained horizontally to prevent rigid-body motion. Each finite element has two nodes, one at each end, and each node has three degrees of freedom which are the axial and transverse displace- ments and the in-plane rotation of the element at the node. The distribution of displacement along each element is assumed to be linear in the axial direction (constant axial strain) and cubic in the transverse direc- tion (corresponding to the deflection equation of an Euler beam).
The (transmissibility) response at the base of the right-hand column in Fig. 6 (point 1) is shown in Fig. 7a and at the top of the same column (point 2) in Fig. 7b for damping assumption A. In each case, the dashed line gives the response of the complete structure when mod- elled by 16 elements. The corresponding response for the four-element linear-strain model of the column alone is shown as the chained line for comparison in each case. There are clearly gross differences in detail between the response of the column alone and the same column when part of a framework, although some of the features of column response are discernible in the frame response. This is partly because of the dynamic effect of the connected floors and partly because the linear axial-strain elements used for the column model (which have three nodes per element, one at its centre) are more accurate than the constant axial-strain ele- ments used for the frame model. To investigate the latter point, the same calculations have been made with a 64-element model of the frame (the same as in Fig. 6, but with four times as many elements each one quarter as long). These responses are shown as the solid lines in Fig. 7a and b. It is clear that the sixteen-element model
Proc Instn Mech Engrs Vol 205

44 D E NEWLAND AND H E M HUNT
-40 I I 0 20 40 60 80 100 120 140 160 180 200
Frequency H7
(a) For point 1
t
\
, \ '.
\
- 40 0 20 40 60 80 100 120 140 160 180
Frequency Hz
Fig. 7 Transmissibility curves for the frame in Fig. 6. The solid curve in each case is for the 64-element model, the dashed for the 16-element model and the chained gives for comparison the response of a single column with four linear-strain elements. Damping assumption A
begins to fail above about 100 Hz, and that the two models differ in detail above about 50 Hz.
Generally the floor structures of a building are sub- structures with low natural frequencies. Therefore they interact, particularly with the column modes which have low natural frequencies. These features can be observed in the frame transmissibility curves of Fig. 8a for damping assumption A and Fig. 8b for damping assumption B. The response a t mid-span of the top floor, point 3 in Fig. 6, is compared with the response at the top of a column alone. As in Fig. 7, the response of the 16-element frame model is given by the dashed line, the 64-element frame model by the solid line, and the four-element column model by the chained line. We observe that the two frame response curves diverge after about 20 Hz. This, of course, is the limitation of the finite element technique; for accuracy at the higher fre- quencies of multi-modal systems, it is necessary to use a very large number of elements. There is also the ques- tion of damping, and it is clear from the differences between Fig. 8a and b that the correct choice of damping model is as important as the correct choice of element size.
(b) For point 2
Part C: Journal of Mechanical Engineering Science
. . !!
-30 -
0 20 40 60 80 100 120 140 160 180 200 Frequency
Hz (a) For damping assumption A
-- I f ,
I -40 I I
0 20 40 60 80 100 120 140 160 180 Frequency
Hz
(b) For damping assumption B Fig. 8 Transmissibility curves for a portal frame calculated
for point 3 of the frame in Fig. 6. The solid curve in each case shows the response calculated with the 64- element model, dashed for the 16-element model and chained gives for comparison the response at the top of a single column with four linear-strain elements
3.4 Unified models that include sources of vibration In order to model a complete building accurately, or even part of a building, there is much further work to do. A reliable representation of the foundation is neces- sary, and there has been a considerable amount of work on the dynamic properties of foundations [see, for example, reference (13)]. Although there have been spe- cific calculations on the dynamics of rigid foundation blocks on a semi-infinite elastic medium [for example reference (14)] and of the vibration of piles (7), there have been very few attempts [reference (15), for example] to bring these theories together to calculate how the design of a building's foundation affects the transmission of vibration into the building. None is sup- ported by site measurements. Although there has been much work on the response of buildings and their foun- dations to earthquake loading, this concentrates on the very low frequency (below 2 Hz) shear response of the building, not on its response to typical ground vibration frequencies.
As a next step, it is intended to combine the pile @ IMechE 1991

ISOLATION OF BUILDINGS FROM GROUND VIBRATION: A REVIEW OF RECENT PROGRESS 45
model described in Section 3.2 with a finite element model of part of a building in order to study the response of the combined system. In addition, it is hoped that the representation of damping in the finite element model will be improved by introducing the results of the experimental work described below. The overall objective is to describe quantitatively the com- plete process of vibration transmission from roads and railways. There are three main stages : (a) determination of the excitation by analysis of vehicle response to road or rail roughness, (b) transmission of vibration through the road or rail system and the surrounding ground and finally (c) the combined response of pile, isolation pad and building.
Work on the ground transmission problem is already well advanced. It is possible to estimate the levels of ground vibration transmitted from roads and railways in certain circumstances, using a combination of site measurements and theory. Some studies are based on traditional wave propagation theory [for example, refer- ence (16)] while others make use of substantial finite element calculations [see, for instance, references (17) and (lS)].
In a recent study by Hunt (19, 20) random process theory has been incorporated into a conventional visco- elastic half-space model of the ground so that the roadway may be treated as an infinite line of random loading. For busy roads, when many vehicles are con- tributing to ground vibration measured at a given point near the road, a statistical treatment of vehicle dynamics makes it possible to predict ground vibration levels in a green field site (20). This model applies for vibration measurements at distances further from the roadway than the mean vehicle spacing. The model has been validated by comparison with field tests at two sites where dynamic properties of the ground (including damping) were obtained by impulse testing. Measured ground vibration spectra are shown in Fig. 9 (as the broken lines) and compared with the results of calcu- lations based on this statistical theory, the details of which are given briefly in Appendix 1. There are two peaks, one at about 2-3 Hz and the other at about 7- 15 Hz. in the calculated and measured responses which
5 10 15 20 25 30 35 40
Frequency Hz
Fig. 9 Calculated vibration levels at distances of 100, 200 and 300 m from a busy roadway near Cambridge compared with vibration levels measured at distances of 200 m (dashed line) and 300 m (chained)
@ IMechE 1991
correspond to the vehicle bounce and wheel hop fre- quencies respectively. The attenuation with distance of the higher frequency measured vibration is larger than predicted, probably because material damping in the soil is higher than that included in the theoretical model at these frequencies.
4 FIELD MEASUREMENTS
Although there have been many ad hoc measurements of building vibration, the authors are not aware of many detailed publications in the literature. Swallow (8) gives some limited data for an isolated building and Jakobsen (21, 22) gives some measurements for houses close to a railway line. In nine reports by the Office for Research and Experiments of the International Union of Railways (23), a variety of railway vibration data and analysis is assembled.
One reason for the lack of published data may be the difficulty of obtaining accurate and repeatable results. The authors’ experience is that successful site measure- ments of structural and ground vibration necessarily require sophisticated electronic equipment. It is desir- able to have two, but preferably more, high-sensitivity accelerometers which can be placed at strategic points for simultaneous data collection. This needs a central data logger and calls for a number of long data cables and remote amplifiers which can transmit data long dis- tances without picking up extraneous noise. Digital rather than analogue recording eliminates tape recorder noise, and the time consuming step of digitizing data at a later stage is avoided. It is also possible to perform some data analysis on site if the data logger is con- nected to a computer. Digitized data amount to several tens of megabytes after a day of collecting vibration data, so a fast digital tape storage device is useful.
Practical difficulties on construction sites may include the absence of mains power, adverse weather conditions and hazards posed by normal construction activities. These are particularly troublesome when long cable runs traverse busy passageways. Communication is greatly hindered on large, and often noisy, building sites so a two-way radio is invaluable.
4.1 Instrumentation The instrumentation that has been used to collect build- ing vibration data for the work described later in this section is shown in Fig. 10. The principal components are a bank of six B&K8318 high-sensitivity acceler- ometers and their corresponding line-drive supply amplifiers which allow low-level vibration data to be transmitted over distances up to 1 km. A CED sixteen- channel data logger driven by a PC allows data to be collected easily and transferred directly to a tape- streamer.
4.2 Impulse response techniques If a known input excitation is used, it is possible to use measured response data to make quantitative estimates of the dynamic characteristics of ground, foundation and building. In order to produce measurable levels of vibration in a large structure, a large impulse is required. We have found that sufficient excitation may
Proc Instn Mech Engrs Vol 205

46 D E NEWLAND AND H E M HUNT
I 16-channel I data logger/
Line drive supplies B & K 2813 Accelerometers - I, ~,
Accelerometer DJB 302 Al03lW
Charge amplifiers B & K 251 I I lll11111111lll1 -
IBM PClAT Tecrnar tape-strearner
. Impulse hammer
Fig. 10 Schematic of instrumentation used to measure vibration in large buildings
be provided by dropping a 20 kg mass from a height of 2 m. The mass is attached to a pivoted hammer arm because this is convenient to transport and to set up. The hammer head is fitted with a 50 kN force trans- ducer and an accelerometer. The accelerometer allows the measured force to be corrected for the inertial loading of the mass in front of the force transducer. The magnitude of each applied impulse is very repeatable and therefore impulse testing can be carried out while other noisy activities are in progress. When a number of impulse responses are averaged together, extraneous uncorrelated noise is largely eliminated.
4.3 Analysis of field data In a very short time, an enormous quantity of field data can be collected, both from impulse response tests and from measurements of ambient vibration.
The quantity of impulse test data can be reduced quickly by averaging all impulses for one given configu- ration. Frequency-response functions may then be cal- culated by discrete Fourier transformation. An example of such impulse response data is shown in Fig. 11 for the case of the impulse response of a pile.
For vibration data generated, for example, by passing trains, it is more difficult to reduce the quantity of data, largely because each train input is different. The authors have found the following procedure to be satisfactory.
Part C: Journal of Mechanical Engineering Science
Each measured vibration signal is divided into two parts. During the first part, train vibration is clearly dominant while the signal measured in the second part is largely due to ambient noise as the train passes into the distance. The power-spectral densities of these two parts of the measured data are calculated and plotted on the same graph. Comparison between them makes it possible to determine which facets of the vibration spec- trum are apparently due to the passing train and which are components of the ambient noise. An example of this is shown in Fig. 12.
Transmissibility functions may be estimated from the measured data. They are calculated from the first part of the signal, which is dominated by train vibration. The estimation is complicated because of the many path- ways for transmission that may exist. Suppose that it is required to estimate the transmissibility across a resilient isolation pad in the column of a building. Assume that transducers on either side of the pad have recorded the local vertical accelerations (for example) while a train is passing. Since the vibration transmitted across the pad will be correlated with that below the pad, the transmissibility can be estimated from the formula (24)
where index 1 denotes the transducer below the pad, @ IMechE 1991

ISOLATION OF BUILDINGS FROM GROUND VIBRATION: A REVIEW OF RECENT PROGRESS 41
.- - 2
-60 L 1 0 0.02 0.04 0.06 0.08 0. I
Time (a) Applied impulse
3 2 - 0
Time - s
(b) Pile cap response, demonstrating repeatability
Frequency Hz
Magnitude of corresponding frequency-response function, calculated from measured data (solid line) and from theory (dashed line)
I 1 0 20 40 60 80 100 120 140 160 180 200
Frequency Hz
(d) Phase of the frequency-response function, calculated from measured data (solid line) and from theory (dashed line)
Fig. 11 Impulse response of a pile measured at Gloucester Park
index 2 the transducer above the pad and S(w) the spec- tral density at angular frequency w. This formula incor- porates the cross-spectral density function S , l (w) and is close to a true estimate of the transmissibility provided that only a small amount of the correlated vibration at 2 arrives by paths other than through the pad. An alter- native calculation of the transmissibility
includes the total response above the pad, regardless of the transmission path and regardless of its correlation with vibration below the pad. Tdirec, should be used to estimate the true transmissibility but the occupants of a building do not distinguish between correlated and uncorrelated vibration, and so will be interested in Total. Estimates of rota, do not require simultaneous measurement of vibration at 1 and 2 since the cross- spectrum is not required. An example of transmissibility estimates determined from the above two formulae is @ IMechE 1991
shown in Fig. 12e. 7;ota,(w) is plotted as the solid line and Girec,(w) as the dashed line.
There are a number of ways of dealing with the problem of incoherent data when calculating transmis- sibilities; some of these are described by Bendat and Piersol (25). The calculation of coherence for multi- input systems is complex and that for distributed inputs, such as road or railway excitation, even more so. If all the inputs to a system are measured, then the multiple- coherence functions will approach unity, provided that the system is behaving linearly and that there is no noise in the instrumentation. Since it is impractical to measure all inputs to a building, poor coherence is inev- itable.
4.4 Measurements at Gloucester Park A combined residential and retail complex is under con- struction above the Gloucester Road underground railway station in London. The station serves two underground lines, the three surface tracks of the Dis- trict and Circle Line and the two deeper tracks of the Piccadilly Line. A single-storey retail block is being built on top of a concrete raft which spans the three surface tracks and the station platform. The residential block, a ten-storey structure adjacent to the retail block, is supported on piles that pass within a few metres of the Piccadilly Line. It is anticipated that the retail block will be influenced more strongly by vibrations from surface trains than from those of the Piccadilly Line, but the residential block will be influenced by vibrations from both.
Vibrations transmitted into the residential block are being monitored throughout the various stages of con- struction of the building. Some preliminary measure- ments were made when the site was bare and again later after the piles had been placed and these have been compared with subsequent measurements made as the building progresses. As described above, both impulse response and train vibration data are being collected.
In the first instance, vibration measured above and below an isolation pad is shown in Fig. 12a and b during the passage of a train. It can be seen in the time traces that, after the train had departed, there is still a significant amount of ambient noise. The power spec- trum of the vibration measured above and below the pad has been computed both from train-generated and ambient vibration. The line shown between the two phases ‘train’ and ‘ambient’ is determined approx- imately by eye from the signal below the pad; the same dividing line is used for the signal above the pad (where the two phases are less distinct). In each case, it can be seen from Fig. 12c and d that ambient noise is responsible for some of the spectral peaks in the vibra- tion spectrum that occurs during the passage of a train. The transmissibility function GireCt(o) and Total(w) are shown in Fig. 12e and the difference between them indi- cates that there is a large amount of vibration reaching the floor above the pad which is not correlated with vibration below the pad. The direct transmissibility shows greater peakiness which is more characteristic of the theoretical column response than the smoother total transmissibility.
Impulse testing has produced a clear picture of the way in which the piles respond to vibration applied
Proc lnstn Mech Engrs Vol 205

48
.-
2
D E NEWLAND A N D H E M HUNT
E 2 - N ;; 0 o ” E
-2
10 1
-6
-8 -10-
:t 4
- - Train Ambient
E 2
5
2
I
m m
.-
-
e, g g 2
- 2 % E 6 0.6 r < 0.4 e , -
10-4
1 I
Ambient -8 1 Time -101 I
0 0.5 I 1.5 2 2.5 3 3.5 4 4.5 5 Time
s (b) Vibration below the pad
10-51 . . . , . . , . , 1 0 20 40 60 80 100 120 140 160 180 200
10-4 I 0 20 40 60 80 100 120 140 160 180 200
Frequency H7
(d) Power spectra below the pad
-40 I 0 20 40 60 80 100 120 140 160 180 200
Frequency Hz
(e) Transmissibility curves
Frequency Hz
(c) Power spectra above the pad
Frequency Hz
(f) Coherence between signals
Fig. 12 Measurement of transmissibility across an isolation pad: (a) shows vibration measured above and (b) below the pad, divided into two parts marked ‘train’ and ‘ambient’; (c) shows the corresponding power spectra above the pad and (d) below the pad, calculated separately for ‘train’ (solid line) and ‘ambient’ (dashed) vibration; (e) shows transmissibility curves Tota,(m) (solid line) and ?&,(m) (dashed) for train vibration only; (0 shows coherence between signals in (a) and (b) for the duration when a train can be detected
Part C: Journal of Mechanical Engineering Science Q IMechE 1991

ISOLATION OF BUILDINGS FROM GROUND VIBRATION: A REVIEW OF RECENT PROGRESS 49
I
6: 8
5 0
2
from the pile cap, as shown in Fig. 11. The repeatability of impulses is clear here as five impulses and their responses have been superimposed in Fig. l l a and b. When averaged together, noise before and after the impulse is largely eliminated. The waviness of the impulse trace (at about 40 Hz) after the delivery of the impulse is due to the natural frequency of vibration of the hammer arm itself. Although this is corrected for in the analysis, a small disturbance remains in the frequency-response curve at about 40 Hz. The magni- tude and phase of the frequency-response function cal- culated from these impulses is shown in Fig. l l c and d and compared with the pile response predicted from theory (Section 3). Soil properties for the pile model have been determined by fitting the best impulse response to the measured data and are given in Appen- dix 2. Very good agreement has been obtained between measurement and theory. A similar pile model for esti- mating the response of the building to vibration gener- ated from below is currently under development.
Vibration data from trains passing through the Picca- dilly Line beneath the apartment block have been mea- sured at several stages during construction and vibration spectra at ground level near a pile cap are shown at two stages of construction in Fig. 13a and b. It
10'
$ 10-1
E 10-2
", "z? E 2
Frequency Hz
(a) Building at pile cap level
Freauencv Hz
(b) Building having reached sixth floor level (halfway to its
Fig. 13 Vibration spectra during the passage of several trains measured at pile cap level at two stages of construction
final height)
0 IMechE 1991
is important to show many measured spectra for each case to emphasize the variability of train excitation and to show that it is not sensible to average these spectra together. It appears that vibration levels at pile cap level are reducing as construction progresses.
At the time of publication, the Gloucester Park build- ing is still under construction. There is much more data to be collected and analysed as the building nears com- pletion, which it is hoped will shed new light on the way in which buildings respond to ground vibration.
5 LABORATORY EXPERIMENTS
Realistic full-scale tests on building components are very difficult to carry out in a normal-sized laboratory. However, it is possible to determine some of the dynamic properties of concrete which is one of the,prin- cipal load-bearing and vibration-transmitting com- ponents in many modern buildings. As shown earlier, a realistic model for damping is essential for calculating how vibration propagates within a building. To this end, various concrete columns with a variety of different reinforcement configurations have been set up and tested in Cambridge.
5.1 Vibration of concrete columns Figure 14 shows the configuration of three reinforced- concrete columns whose impulse responses have been measured. Data for these columns are given in Appen- dix 2. Impulsive excitation was applied by tapping the columns lightly with an aluminium hammer having a plastic heald. The mass of the
0
*
0
ammer head was about
0 Column I Column 2 Column 3 Reinforced Prestressed Reinforced
and only only prestressed
Fig. 14 Reinforcement configurations of three experimental concrete columns. The impulse hammer is shown here for axial tests on column 1 and for bending tests on column 2, and the accelerometer position is marked with an asterisk
Proc lnstn Mech Engrs Vol 205

50 D E NEWLAND AND H E M HUNT
0.25 kg; the mass of each column was about 700 kg. Peak column displacements were of the order of a few micrometres.
Figure 15a and b shows typical frequency responses for axial and bending vibration. These have been derived from measured impulse responses taken with the beams supported horizontally on axially thin sup- ports located as close as possible to the nodes of the fundamental bending mode. In Fig. 15a, the axial modes of each column are clearly visible, spaced uniformly at multiples of about 500 Hz. For the bending vibration of a free beam, the natural frequencies are expected to follow closely the sequence 3’, 52, 7’, 9’, ..., but it is found in Fig. 15b that the even harmonics are absent. This is because the columns were struck at mid-span which is theoretically a nodal point for the even modes. Also the natural frequencies of bending modes above the first three show significant deviation from their theoretical sequence because the beam’s supports con- strain higher modes in differing degrees. Local reson- ances of the support system are responsible for the subsidiary peaks on Fig. 15b.
60
40
20
0 I 2 4 5 3 0
Frequency kHz
(a) Axial response when struck at the end of the column
Freauencv Hz
(b) Bending response when struck at mid-span Fig. 15 Response at the point of excitation for a typical
reinforced-concrete column. Frequency responses have been derived from measured impulse responses with peak displacements of a few micrometres; nor- malization of spectral components is arbitrary
Part C: Journal of Mechanical Engineering Science
Table 1 Damping Q-factors for axial and bending vibration at the fundamental frequencies of the three columns in Fig. 14
Column 1 Column 2 Column 3
Axial (500 Hz) 134 129 143 Bending (65 Hz) 106 130 144
The damping Q-factors for each column (Q = 1/25 where [ is the modal damping ratio) have been calcu- lated for the fundamental 500 Hz axial vibration mode and for the 65 Hz bending mode; these are shown in Table 1. Further tests have also been made (26) on these and other reinforced-concrete columns, some of them suspended horizontally on long, soft cords. The results indicate that the variation of damping between columns with differing reinforcing configurations is small and that the damping coefficients are not strongly depen- dent on frequency. This supports the use of a hysteretic damping assumption for a pure column; however, for buildings (where damping may be ten times greater than the values in Table l), it is still not clear which damping assumption should be used or indeed what is the origin of most of the structural damping found in practice. The calculation of damping from a measured impulse response has been made by a method due to Wood- house (27) which involves calculating spectra over ten different short time intervals during the decay of vibra- tion. For a given mode, the height of the appropriate spectral peak is observed to reduce with time. This variation with time is plotted and a curve-fitting pro- cedure then gives an approximate estimate of the modal damping coefficient. The results obtained have been found to be very reliable except when there are two modes whose frequencies are very close together.
6 CONCLUSIONS
Isolation from ground vibration is an important feature of many modern buildings. In recent years, much work has been done to understand the way in which build- ings respond to ground vibration and the methods by which the standard of isolation can be improved. The simplest traditional model of an isolated building as a rigid mass on a spring is inadequate. More advanced models represent flexible columns and floors by finite elements and use a lumped parameter or other approx- imate representation of the foundation. These allow the principal low-frequency modes of vibration to be accounted for but cannot yet model behaviour in the full frequency range of interest. New analytical models which incorporate ground interaction are under devel- opment and a better representation of damping is being sought by laboratory and field testing. The aim is to extend the analysis of the complete dynamical system, including its excitation process, in order to permit reli- able design calculations of a building’s vibration environment.
REFERENCES
1 Waller, R. A. Buildings on springs. Nature, 1966, 211(5051), 794-
2 Waller, R. A. Building on springs., 1969, International Series of
@ IMechE I991
796.
Monographs in Civil Engineering, Vol. 2 (Pergamon, Oxford).

IS01 ATION OF BUILDINGS FROM GROUND VIBRATION: A REVIEW OF RECENT PROGRESS 51
3 Newland, D. E. Mechanical vibration analysis and computation, 1989 (Longman, Harlow and John Wiley, New York).
4 Grootenhuis, P. Structural elastomeric bearings and resilient seat- ings. Polymers and polymer composites in construction, 1989, Ch. 9 (Thomas Telford, London).
5 Cryer, D. P. Isolation of structures from vehicle-induced vibration. Cambridge University Engineering Department Report, May 1990.
6 Hunt, H. E. M. and Cryer, D. P. Site and laboratory experiments on vibration transmission. Proc. Inst. Acoust. Conf Vibr. in Build- ings, 1990, 12(7), 39.
7 Novak, M. Vertical vibration of floating piles. J . Engng Mechanics Dio. Am. SOC. ofcivi l Engrs, 1977, 103(EMl), 153-168.
8 Swallow, J. C. Modelling of isolation of buildings from ground- borne vibration. Proceedings of Twelfth International Conference on Acoustics, Canada, 1986, D1-4.
9 Willford, M. R. Personal communication, Ove Arup and Partners, Consultants in Acoustics and Vibration, London, 1990.
10 Bhaskar, A. Personal communication, Cambridge University Engineering Department, 1990.
11 Wilson, R. C. An investigation of vibration transmission through tall buildings. Cambridge University Engineering Department, Part 11 project report, 1988.
12 Newland, D. E. and Bhaskar, A. Calculation of vibration in struc- tures. Proc. Inst. Acoust. Conf Vibr. in Buildings, 1990,12(7), 11.
13 Richart, Jr , F. E., Woods, R. D. and Hall, Jr, J. R. Vibrations of soils andfoundations, 1970 (Prentice-Hall, Englewood Cliffs, N.J.).
14 Hamidzadeh-Eraghi, H. R. and Grootenhuis, P. The dynamics of a rigid foundation on the surface of an elastic half-space. Earthquake Engng and Struct. Dyn., 1981,9,501-515.
15 Gaul, L. Dynamics of frame foundations interacting with soil. Trans. ASME, J. Mech. Des., 1980,102, 303-310.
16 Taniguchi, E. and Sawada, K. Attenuation with distance of traffc-
induced vibrations. Soils and Foundations, J . Jap. SOC. Soil Mech. and Foundation Engng, 1979,19(2), 1528.
17 Hanazato, T. and Ugai, K. Analysis of traffic-induced vibrations by FEM. Soils and Foundations, J . Jap. SOC. Mech. and Foundation Engng, 1983,23(1), 144-150.
18 Haupt, W. A. Numerical methods for the computation of steady state harmonic wave fields. Proceedings of International Sympo- sium on Dynamical methods in soil and rock mechanics, Karlsriihe, 1977, Vol. 1, pp. 255280 (NATO-Institute of Soil and Rock Mechanics).
19 Hunt, H. E. M. Modelling of road vehicles for calculation of traflic-induced ground vibration as a random process. J . Sound Vibr., 1991, 144(l), 41-51.
20 Hunt, H. E. M. Stochastic modelling of traffic-induced ground vibration, J. Sound. Vibr., 1991,144(1), 53-70.
21 Jnkobsen, J. Ground vibration from rail traffc. J. Low Frequency Noise and Vibr., 1987,6,96103.
22 Jakobsen, J. Transmission of ground-borne vibration in buildings. J. Low Frequency Noise and Vibr., 1989,8,75-80.
23 Office for Research and Experiments. Question D 151 : Vibrations transmitted through the ground (nine reports published over four years), 1981-1984, (Office for Research and Experiments of the International Union of Railways, Utrecht).
24 Newlad, D. E. Random oibrations and spectral analysis, 2nd edition, 1984 (Longman, Harlow and John Wiley, New York).
25 Bendat, J. S. and Piersol, A. G. Random data: analysis and mea- surement procedures, 2nd edition, 1986 (John Wiley, New York).
26 Bhaskar, A. Damped vibration of concrete bars and beams. Pro- ceedings of International Conference on Tr@c effects on struc- tures and the enoironment, The Low Tatras, Czechoslovakia, 1991 (Slovak Academy of Sciences) (to be published).
27 Woodhouse, J. Personal communication, Cambridge University Engineering Department, 1990.
APPENDIX 1
Principal equations
(a) Vibration of an elastic column with damping (Section 3.1)
The governing differential equation for longitudinal vibration y at a distance z up an elastic column with damping is [from reference (3)]
a Z y p ay E a3y E a 2 y E aZy at2 p at a z 2 azz - + - - - -id - ~ - -- = 0
with Young's modulus E and density p. Three distinct damping assumptions are described by the parameters p, q and 6 as follows:
Damping P, v , 6 Physical interpretation X j wj
Viscous (A) ,u # 0, q = 6 = 0 Damping proportional to absolute velocity PIP
Hysteretic (C) 6 # 0, p = q = 0 Damping not physically realizable 6Wj Viscous (B) q # 0, p = 6 = 0 Damping proportional to time derivative of spring force qwf
where 2Cjoj is the modal bandwidth. Damping assumption C is commonly used, and although it does not satisfy causality conditions (3) it gives rise to a modal bandwidth proportional to frequency, a compromise between the constant modal bandwidth of damping assumption A and the modal bandwidth proportional to frequency squared of damping assumption B.
(b) Vibration of an elastic pile with damping (Section 3.2)
The governing differential equation for longitudinal vibration y at depth z and angular frequency w of a pile modelled as a continuous column (with damping assumption A only) embedded in an elastic continuum is [from reference (7)].
aZy ,U a y E a 2 y G H : ~ ) ( K ~ ~ ) -+-----+- y = o at2 p at p azz P A lCr0 ~ 6 2 ) ( K r , )
where K = w/c,. Pile properties are as defined for the column above with pile radius l o , cross-sectional area A, soil shear modulus G, shear-wave speed c, and where H$j2)(ao) and are Hankel functions of the second kind of order 0 and 1.
@ IMechE 1991 Proc Instn Mesh Engrs Vol 205
52 D E NEWLAND AND H E M HUNT
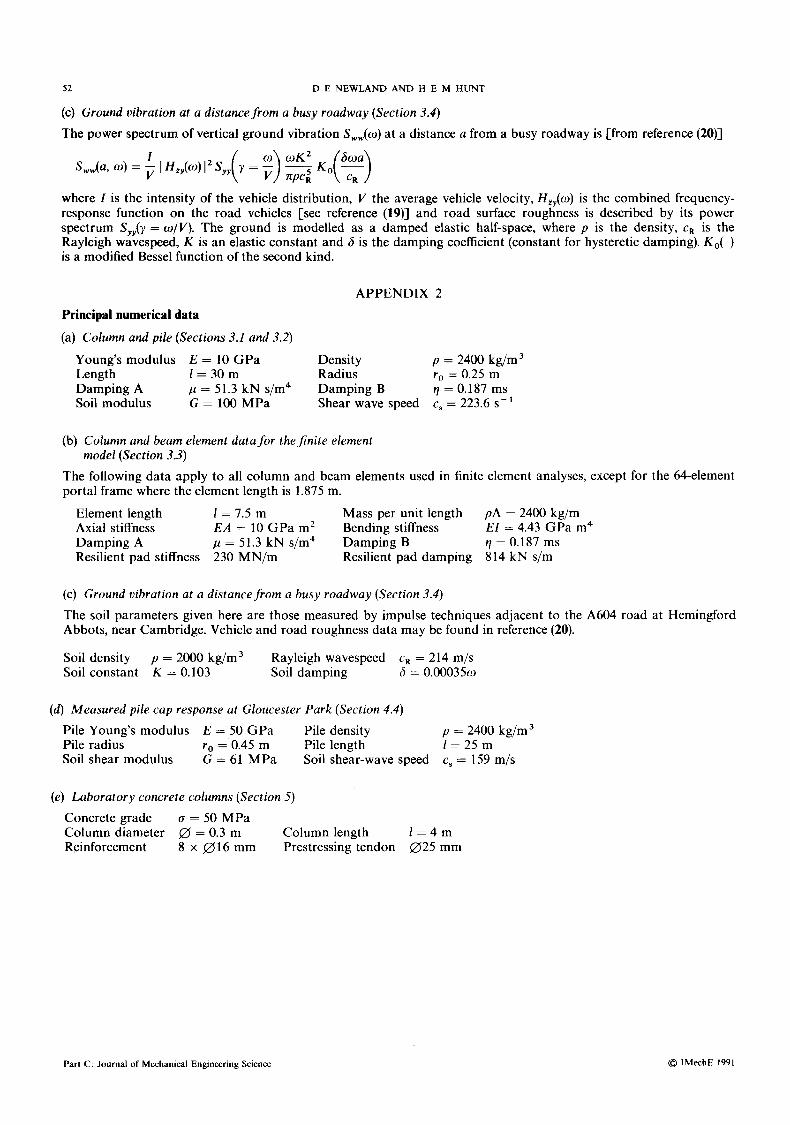
(c) Ground vibration at a distance from a busy roadway (Section 3.4)
The power spectrum of vertical ground vibration S W w ( o ) at a distance a from a busy roadway is [from reference (20)]
where 1 is the intensity of the vehicle distribution, V the average vehicle velocity, H,,(w) is the combined frequency- response function on the road vehicles [see reference (19)] and road surface roughness is described by its power spectrum Syy(y = w/V). The ground is modelled as a damped elastic half-space, where p is the density, cR is the Rayleigh wavespeed, K is an elastic constant and 6 is the damping coefficient (constant for hysteretic damping). KO( ) is a modified Bessel function of the second kind.
APPENDIX 2
Principal numerical data
(a) Column and pile (Sections 3.1 and 3.2)
Young's modulus E = 10 GPa Density p = 2400 kg/m3 Length 1 = 3 0 m Radius ro = 0.25 m Damping A p = 51.3 kN s/m4 Damping B r] = 0.187 ms Soil modulus G = 100 MPa Shear wave speed c, = 223.6 s - '
(b) Column and beam element data for theJinite element
The following data apply to all column and beam elements used in finite element analyses, except for the 64-element portal frame where the element length is 1.875 m.
model (Section 3.3)
Element length 1 = 7.5 m Mass per unit length pA = 2400 kg/m Axial stiffness E A = 10 GPa m2 Bending stiffness E l = 4.43 GPa m4 Damping A p = 51.3 kN s/m4 Damping B 9 = 0.187 ms Resilient pad stiffness 230 MN/m Resilient pad damping 8 14 kN s/m
(c) Ground vibration at a distance from a busy roadway (Section 3.4)
The soil parameters given here are those measured by impulse techniques adjacent to the A604 road at Hemingford Abbots, near Cambridge. Vehicle and road roughness data may be found in reference (20).
Soil density p = 2000 kg/m3 Rayleigh wavespeed cR = 214 m/s Soil constant K = 0.103 Soil damping 6 = 0.000350
(d) Measured pile cap response at Gloucester Park (Section 4.4)
Pile Young's modulus E = 50 GPa Pile density p = 2400 kg/m3 Pile radius r,, = 0.45 m Pile length 1 - 2 5 m Soil shear modulus G = 61 MPa Soil shear-wave speed c, = 159 m/s
(e) Laboratory concrete columns (Section 5 )
Concrete grade Column diameter 0 = 0.3 m Column length 1 = 4 m Reinforcement 8 x 0 1 6 mm Prestressing tendon 0 2 5 mm
CJ = 50 MPa
Part C: Journal of Mechanical Engineering Science @ IMechE 1991