isolation and characterization of iron-oxidizing bacteria from boiling
144
ISOLATION AND CHARACTERIZATION OF IRON-OXIDIZING BACTERIA FROM BOILING SPRINGS LAKE AND THE POTENTIAL ROLE OF FERROUS IRON IN CARBON AND SULFUR CYCLING By Francine Arroyo A Thesis Presented to The Faculty of Humboldt State University In Partial Fulfillment of the Requirements for the Degree Master of Science in Biology Committee Membership Patricia L. Siering, Ph.D., Committee Chair Mark S. Wilson, Ph.D. Matthew Hurst, Ph.D. Kristine Brenneman, Ph.D. Michael Mesler, Ph.D., Graduate Coordinator December, 2012
Transcript of isolation and characterization of iron-oxidizing bacteria from boiling

ISOLATION AND CHARACTERIZATION OF IRON-OXIDIZING BACTERIA
FROM BOILING SPRINGS LAKE AND THE POTENTIAL ROLE OF FERROUS
IRON IN CARBON AND SULFUR CYCLING
By
Francine Arroyo
A Thesis
Presented to
The Faculty of Humboldt State University
In Partial Fulfillment of the Requirements for the Degree
Master of Science in Biology
Committee Membership
Patricia L. Siering, Ph.D., Committee Chair
Mark S. Wilson, Ph.D.
Matthew Hurst, Ph.D.
Kristine Brenneman, Ph.D.
Michael Mesler, Ph.D., Graduate Coordinator
December, 2012

ii
ABSTRACT
ISOLATION AND CHARACTERIZATION OF IRON-OXIDIZING BACTERIA
FROM BOILING SPRINGS LAKE AND THE POTENTIAL ROLE OF FERROUS
IRON IN CARBON AND SULFUR CYCLING
Francine Arroyo
Boiling Springs Lake (BSL) is a 52˚C, pH 2, iron and sulfur-rich thermal feature
in Lassen National Volcanic Park (California, USA). Previous community composition
studies of small subunit rRNA and RuBisCo genes revealed an abundance of phylotypes
closely related to an Acidimicrobium strain isolated from Yellowstone National Park. As
an ideal candidate to examine its contribution to primary production in BSL, we
attempted to isolate Acidimicrobium and related iron-oxidizing Bacteria from BSL. We
obtained 23 isolates that shared 99% rRNA gene identity with their closest cultured
relative: 16 were identified as Sulfobacillus acidophilus, four as Alicyclobacillus sp., and
three isolates had nearly identical rRNA gene sequences to the previously identified
Acidimicrobium clones. We characterized most isolates for pH and temperature growth
range and optima, and we assessed their abilities to oxidize iron, pyrite, sulfur and
tetrathionate. Morphology of Acidimicrobium isolates was analyzed with transmission
and scanning electron microscopy. The Acidimicrobium isolates were Gram positive,
non-endospore-forming rods with a complex cellular envelope. Optimal growth

iii
temperature and pH for many isolates correlated with conditions at BSL. Acidimicrobium
and Sulfobacillus isolates oxidized 10 mM iron when amended with 0.01% yeast extract.
Acidimicrobium isolates were inhibited at iron concentrations ≥25 mM. Acidimicrobium
and some Sulfobacillus isolates were able to oxidize pyrite when amended with yeast
extract. We found no evidence for sulfur or tetrathionate oxidation by any of the isolates.
These results will further our understanding of the potential role of Acidimicrobium and
related iron-oxidizing Bacteria in the iron and carbon cycles in BSL.
iv
ACKNOWLEDGEMENTS
I would first like to thank my advisor, Patricia Siering, for her unyielding support
and time dedicated to making sure that I complete my thesis in a timely manner. I cannot
accurately express my gratitude for her efforts these past three and a half years. She is a
role model for hard work, passion for teaching, and all-around joyful person to work
with. I can only hope to maintain my head above water in the wake that she leaves
behind.
Many thanks to my committee members for their continued support and time
dedicated for reviewing this endless thesis. Mark was always available to answer any
questions that I would have, from assistance with sequence alignments to recipes for
posole soup. Many thanks to Matt for all his help in setting up the iron oxidation assays
and allowing me access to the Chemistry department’s diode array spectrophotometer.
To Dr. B for showing me how much fun it is to monitor the Secchi depth.
My work utilizing electron microscopy could not have been done without the
patience and guidance of Casey Lu. I would also like to thank Marty Reed and Lewis
McCrigler for helping me through the technical difficulties with the microscopes.
Dr. Barrie Johnson from the University of Wales (Bangor, U.K.) provided me
with insight on successful growth maintenance of the finicky A. ferrooxidans ICPT.
Many members of the H.E.A.T. lab contributed to my work. Jennifer Hampton’s
initial attempts of isolating Acidimicrobium provided me with the framework of methods
and media to use in my isolation attempts. Jon Schultz and Clay Carey assisted me with

v
clone library construction. Connor Fitzhugh eagerly helped me analyze my experimental
data using AICc under the guidance of Dr. Rob Van Kirk.
I would like to thank my partner, Max Cannon, for moving to Arcata with me and
personally supporting me through my emotional vicissitudes.
Thanks to the helpful and optimistic staff and faculty of the Department of
Biology. It has been a pleasure.
Funding was provided by the National Science Foundation (Patricia Siering, PI,
grant no. MCB-0702018).
vi
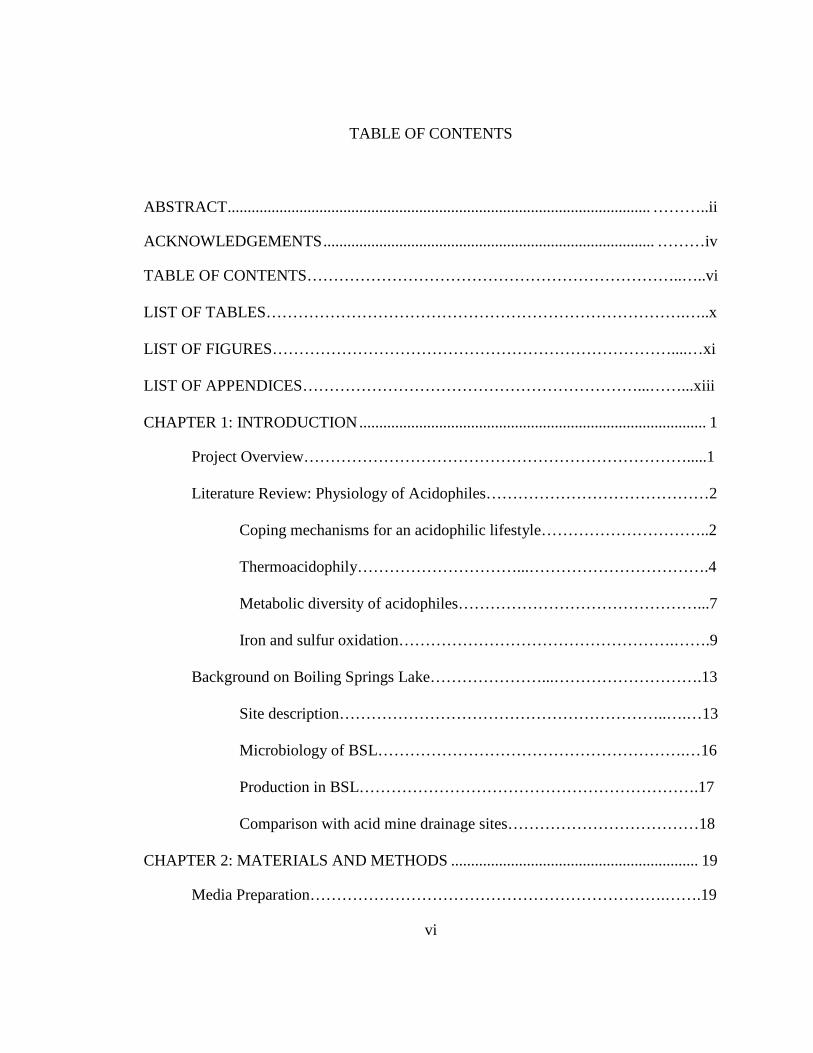
TABLE OF CONTENTS
ABSTRACT .......................................................................................................... ………..ii
ACKNOWLEDGEMENTS ................................................................................... ………iv
TABLE OF CONTENTS……………………………………………………………..…..vi
LIST OF TABLES…………………………………………………………………….…..x
LIST OF FIGURES…………………………………………………………………....…xi
LIST OF APPENDICES………………………………………………………...……...xiii
CHAPTER 1: INTRODUCTION ....................................................................................... 1
Project Overview……………………………………………………………….....1
Literature Review: Physiology of Acidophiles……………………………………2
Coping mechanisms for an acidophilic lifestyle…………………………..2
Thermoacidophily…………………………...…………………………….4
Metabolic diversity of acidophiles………………………………………...7
Iron and sulfur oxidation…………………………………………….…….9
Background on Boiling Springs Lake…………………...……………………….13
Site description……………………………………………………..….…13
Microbiology of BSL………………………………………………….…16
Production in BSL……………………………………………………….17
Comparison with acid mine drainage sites………………………………18
CHAPTER 2: MATERIALS AND METHODS .............................................................. 19
Media Preparation………………………………………………………….…….19
vii
Isolation of Sulfobacillus and Alicyclobacillus Strains…………………….…….22
Sample collection……………………………..………………………….22
Winogradsky column enrichments…………………………………...….23
Selection and purification of isolates…………………………………….24
Isolation of Acidimicrobium sp. from BSL……………….……………….……..26
Sample collection………………………………………………….……..26
Isolation and purification…………………………………………...……26
Identification of Isolates by 16S rRNA Gene Sequencing………………………29
Acidimicrobium-specific 16S rRNA primer design……………………...29
SSU rRNA gene amplification by PCR………………………………….30
Clone library construction and sequence analysis……………………….31
Morphology of Acidimicrobium by Electron Microscopy…………………….…34
Transmission electron microscopy (TEM)……………………………....34
Scanning electron microscopy (SEM)……………………………...……35
Physiological Characterization of Isolates……………………………………….35
Preparation of inocula and growth assessment…………………………..35
Determination of pH and temperature range and optima for growth…….37
Growth experiments………………………………………...……37
Linear regression models and Akaike information criterion
(AICc)……………………………………………………….……37
Iron and pyrite as energy sources…………………………………….…..38
Iron and pyrite oxidation via ferrozine assay…………………………….39

viii
Sulfur and tetrathionate oxidation………………………………………..40
CHAPTER 3: RESULTS .................................................................................................. 41
Isolation, Identification and Naming of Alicyclobacillus and Sulfobacillus
Isolates…………………………………………………………………………...41
Isolation, Identification and Naming of Acidimicrobium Isolates…...…………..43
Electron Microscopy of Acidimicrobium…………………………………...……50
Physiological Characterization of Isolates……………………………………….54
Determination of temperature and pH range and optima………….……..54
Growth experiments……………………………………….…..…54
Linear regression modeling of pH and temperature data………...64
Evaluation of iron and pyrite as potential energy sources……………….69
Measurements of iron oxidation……………………………………...….74
Pyrite oxidation…………………………………………………………..75
Sulfur and tetrathionate oxidation………………………………………..80
CHAPTER 4: DISCUSSION ............................................................................................ 86
Attempts to Isolate Acidimicrobium from BSL……………………………….…86
Isolation and physiological characterization of Acidimicrobium…....…..89
Cell morphology of Acidimicrobium…………………………………….97
Caveats associated with growth measurements…………………..…….100
Isolation and physiological characterization of Sulfobacillus…..…..….100
Using AIC analysis to differentiate between strains of Sulfobacillus
and between species of Sulfobacillus and Acidimicrobium…….…....…103

ix
Isolation and physiological characterization of Alicyclobacillus….……103
Speculation on Role of Acidophilic Isolates in BSL…………….…………..…106
Summary………………………………………………………………..………109
Future Work…………………………………………………………………….111
APPENDICES…………………………………………………………………….……115
REFERENCES ............................................................................................................... 119
x
LIST OF TABLES
Table Page 1 16S rRNA primers utilized……………..……………………………………..…33 2 16S rRNA gene sequence analysis, isolation conditions, and morphology of isolates…………………………………………………………………..…….…46 3 Summary of temperature and pH ranges and optima for Acidimicrobium, Sulfobacillus, and Alicyclobacillus isolates………………………….……..……63 4 AICc of the top linear regression models of division rate (generations/time) according to pH, temperature, and strain of Sulfobacillus isolates.……….……..66 5 Sulfobacillus isolate sub-groups organized by common temperature and pH ranges/optima………………………………………………………………….....67 6 AICc of the top linear regression models of division rate (generations/time) according to pH, temperature, strain, and/or sub-groups of Sulfobacillus sp. isolates....................................................................................................................67 7 AICc of the top linear regression models of division rate (generations/time) according to pH, temperature, and species of Acidimicrobium and
Sulfobacillus…………………………………………………………………….. 68 8 Summary of iron, pyrite, sulfur and tetrathionate oxidation results for Acidimicrobium and Sulfobacillus……………………...……………………..…85

xi
LIST OF FIGURES Figure Page 1 Model of electron transport chain in Gram negative Acidithiobacillus ferrooxidans……………………………………………………………………..12 2 Boiling Springs Lake (BSL) with sites A and D designated by arrows…….…...15 3 Flow chart schematic summarizing methods for isolation of Sulfobacillus and Alicyclobacillus strains………………………………………………………..…25 4 Flow chart schematic summarizing methods for isolation of Acidimicrobium
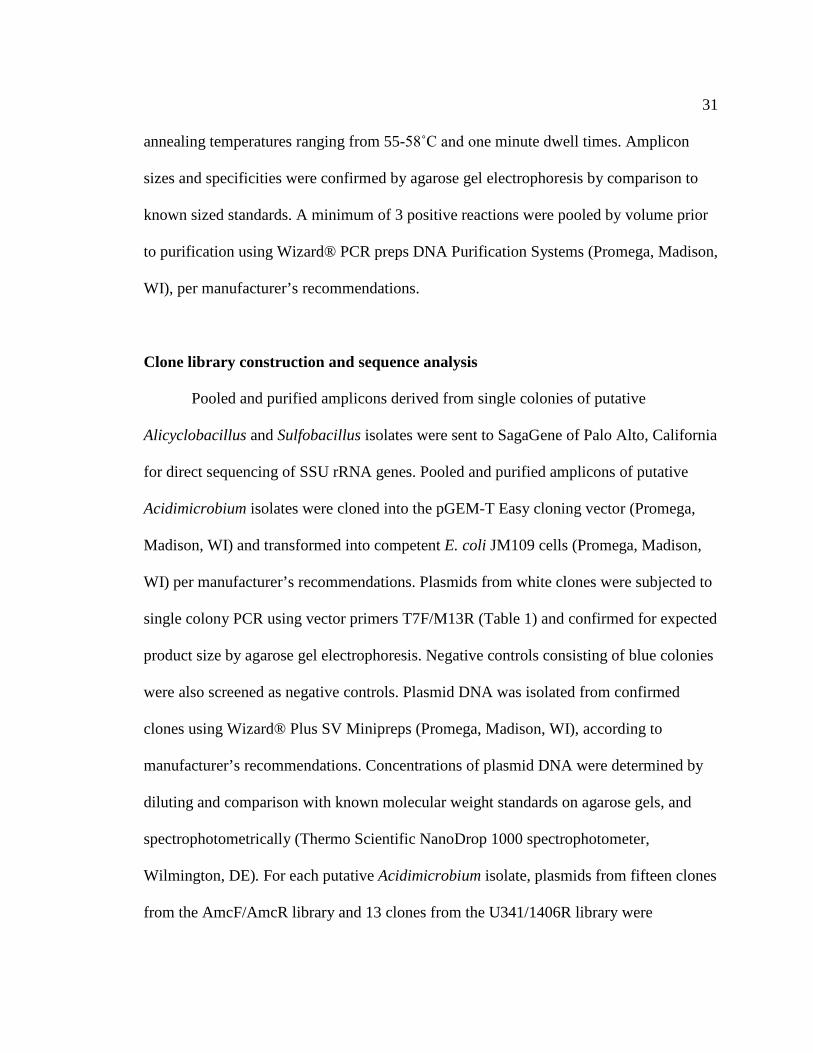
sp………………………………………………………………………………....28 5 Comparison of colony morphology between Sulfobacillus and Acidimicrobium isolates……………………………………………………………………………48 6 Gram stained photographs of representative Sulfobacillus isolates (a), Alicyclobacillus isolates (b), and Acidimicrobium isolates (c) and A. ferrooxidans ICPT (d) viewed by 1000X light microscopy…………………………………….49 7 Electron micrographs of Acidimicrobium EAO4 in Heterotrophic medium….…52 8 Cell morphology comparison of Acidimicrobium EAO2 (left) and A. ferrooxidans ICPT (right) in Mixotrophic medium………………………………………..…...53 9 Three patterns of temperature growth for Sulfobacillus isolates represented by JAO2 (a), JWO20m (b), and JWO22m (c)………………………………………...57 10 Three patterns of pH ranges and optima for Sulfobacillus isolates…………..….58 11 Three patterns for permissible temperature range of growth for Alicyclobacillus isolates……………………………………………………………………….…..59 12 Unique patterns for pH range and optima for Alicyclobacillus isolates…..……..60 13 Comparison of temperature range and optima between Acidimicrobium isolate EAO2 and A. ferrooxidans ICPT…………………………………………...…….61

xii
LIST OF FIGURES (CONTINUED)
Figure Page 14 Comparison of pH range and optima between Acidimicrobium isolate EAO2 and A. ferrooxidans ICPT…………………………………………………………..…62 15 Comparison of autotrophic growth at varying iron concentrations, supplemented with either air or enhanced CO2, between A. ferrooxidans ICPT (top) and isolate EAO4 (bottom)……………………………………………………………...…...72 16 Mixotrophic growth comparison of A. ferrooxidans ICPT (a), Acidimicrobium EAO1 (b), and Sulfobacillus JWO19m (c)………...………………………..……73 17 Comparison of growth and concomitant iron oxidation by Acidimicrobium and Sulfobacillus strains………………………………………………………..….…77 18 Comparison of iron oxidation in 1% Pyrite medium by Acidimicrobium EAO4
(a) and Sulfobacillus JWO19m (b)…..……………………………..………….…78 19 Comparison of dissolution of pyrite by Acidimicrobium (a) and Sulfobacillus (b) isolates………………………………………………………………………...….79 20 Comparison of growth in Sulfur and Tetrathionate media by A. ferrooxidans ICPT (a) and Acidimicrobium isolate EAO4 (b)……………………………………….83 21 Comparison of growth in Sulfur and Tetrathionate media by Sulfobacillus isolates JWO19m (a) and JWO19m (b)………………………………………………..….84

xiii
LIST OFAPPENDICES Appendix Page A Freezing of cultures……………………………………………………..............115 B Maintenance of cultures……………………………...…………………………116 C Statistical equations used for linear regression…………………………………117

1
CHAPTER 1: INTRODUCTION
Project Overview
Boiling Springs Lake (BSL) is a 50-93˚C, pH 2, oligotrophic iron and sulfur-rich
thermal feature located in Lassen National Volcanic Park (California, USA). The
compounded stresses of high temperature, low nutrients and pH select for a microbial
community capable of tolerating and thriving at the extremes of life. The abundance of
reduced iron (102, 103) and presumably sulfur species in BSL provides possible energy-
generating mechanisms for organisms living in the hot spring. Sequences from small
subunit rRNA genes revealed representatives from each of the domains of life, wherein
novel Archaea and Bacteria appear to dominate the sediment community, and Bacteria
closely related to Acidimicrobium and Hydrogenobaculum spp. appear to be the most
abundant organisms in the water column (116, 117). The aim of this study was to
investigate the role of an abundant Bacteria phylotype (Acidimicrobium spp.) detected in
SSU rRNA and RuBisCo gene clone libraries (102, 117). Our goals were to (i) isolate
Acidimicrobium spp. and/or physiologically/phylogenetically similar bacteria, (ii)
investigate morphological characteristics of Acidimicrobium utilizing electron
microscopy, and (iii) determine optimal growth conditions of isolates and their ability to
oxidize iron, sulfur, and pyrite. By studying the autecology of thermoacidophilic, iron-
oxidizing Acidimicrobium and other members of the community, we can make better
predictions of ecological interactions and active biogeochemical processes in BSL.

2
Literature Review: Physiology of Acidophiles
Coping mechanisms for an acidic lifestyle
Generally, there are two categories of acidophiles. Extreme acidophiles have pH
optima for growth at <3, and moderate acidophiles grow optimally at pH 3-5 (52). Acid-
tolerant organisms that are metabolically active at low pH, have a growth optima of pH
≥5. In this study, we will focus on the physiology of extreme acidophiles, herein referred
to as acidophiles. Although the environment in which acidophiles live is low in pH,
acidophiles require an intracellular pH close to neutral (82). In order to maintain a pH
homeostasis in contrast to an external environment with a concentration of protons 10-4 M
or higher, acidophiles have adapted many coping mechanisms to survive and thrive in
acidic environments.
Acidophiles have a highly impermeable membrane that prevents ingress of
protons (10). Surprisingly, no differences in the structure of cell membranes between
acidophilic and neutrophilic bacteria have been identified (54). Yet, many Archaea, such
as Ferroplasma acidiphillum YT, Thermoplasma acidophilum, Sulfolobus solfactaricus,
and Picrophilus oshimae have membranes composed of tetraether lipids (41, 95, 101,
112). Ether linkages are less sensitive to acid hydrolysis than bacterial (and eukaryal)
ester linkages (54).
Similar to neutrophiles, acidophiles also utilize pH gradients and membrane
potentials to generate a proton motive force (PMF) (10). PMF is essential for converting
ATP from ADP using membrane-bound ATPases, transporting substances across
3
membranes, and driving flagella movement in flagellated Bacteria (54). In contrast to
neutrophiles, acidophilic bacteria actively pump protons out of the cell often in concert
with symport or antiport of other substances to maintain homeostasis at a cost of ATP.
Acidophiles also actively pump cations such as K+ into the cell, resulting in a more
positive intra-membrane potential than neutrophilic cells (1). The positive internal
membrane potential protects acidophilic cells when ATP is limiting, thereby preventing
acidification of the cytoplasm which leads to death (71). The positive membrane potential
also confers some protection against many positive charged cations, such as transition
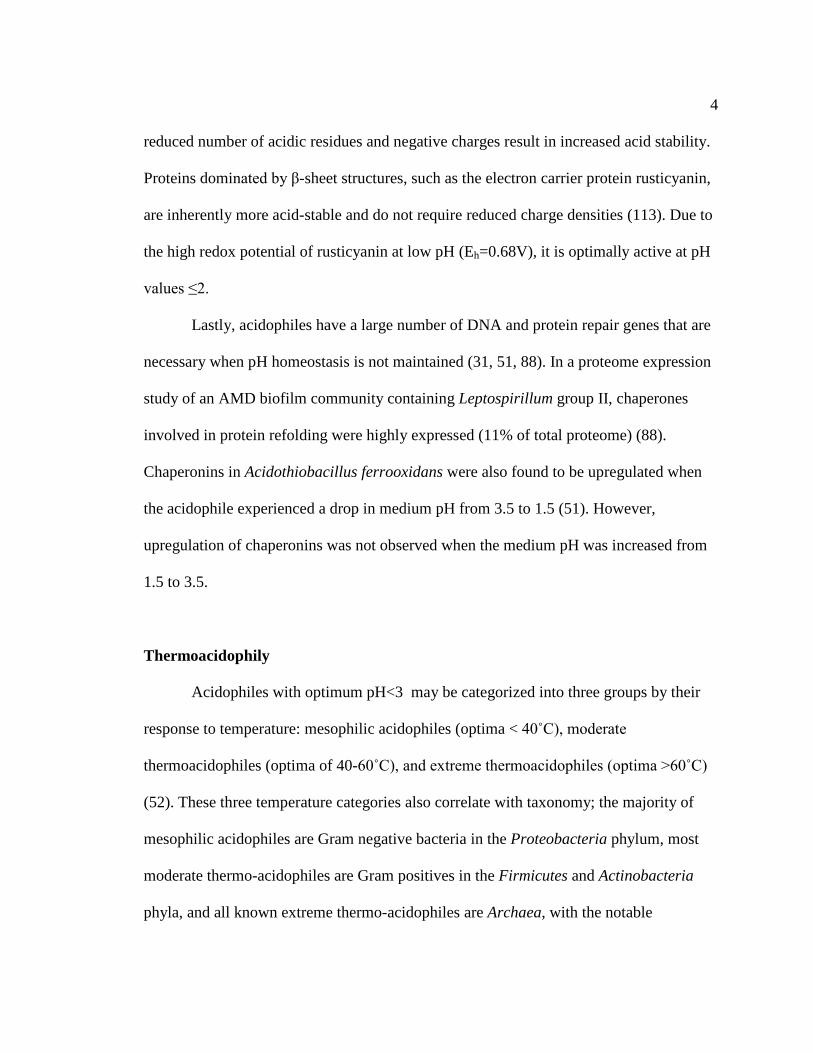
metals that are often present at high concentrations in acidic environments.
Consequences of possessing a positive internal membrane potential include
increased sensitivities to both low molecular weight organic acids (i.e. acetic and pyruvic
acids) and common anions like nitrate (82). Due to the pKa values for many of these
organic acids in acidic environments, the acids occur in the protonated form and can be
transported into the cells of acidophiles. Protonated acids dissociate in the circumneutral
cytoplasm and result in acidification of the cytoplasm. Interestingly, all acidophiles able
to grow at extremely acidic pH (<0) are heterotrophs that have genes encoding organic
acid degradation pathways (6). However, it is not known whether the ability to degrade
organic acids is a pH homeostatic mechanism.
Proteins and enzymes located on the exterior of the cell have adapted to be acid-
stable and active at low pH. Generally, proteins that are dominated by α-helical structures
have a reduced charge density (72). As pH decreases, protonation of acidic residues
increases, leading to protein unfolding due to the increase in repelling forces. Therefore, a
4
reduced number of acidic residues and negative charges result in increased acid stability.
Proteins dominated by β-sheet structures, such as the electron carrier protein rusticyanin,
are inherently more acid-stable and do not require reduced charge densities (113). Due to
the high redox potential of rusticyanin at low pH (Eh=0.68V), it is optimally active at pH
values ≤2.
Lastly, acidophiles have a large number of DNA and protein repair genes that are
necessary when pH homeostasis is not maintained (31, 51, 88). In a proteome expression
study of an AMD biofilm community containing Leptospirillum group II, chaperones
involved in protein refolding were highly expressed (11% of total proteome) (88).
Chaperonins in Acidothiobacillus ferrooxidans were also found to be upregulated when
the acidophile experienced a drop in medium pH from 3.5 to 1.5 (51). However,
upregulation of chaperonins was not observed when the medium pH was increased from
1.5 to 3.5.
Thermoacidophily
Acidophiles with optimum pH<3 may be categorized into three groups by their
response to temperature: mesophilic acidophiles (optima < 40˚C), moderate
thermoacidophiles (optima of 40-60˚C), and extreme thermoacidophiles (optima >60˚C)
(52). These three temperature categories also correlate with taxonomy; the majority of
mesophilic acidophiles are Gram negative bacteria in the Proteobacteria phylum, most
moderate thermo-acidophiles are Gram positives in the Firmicutes and Actinobacteria
phyla, and all known extreme thermo-acidophiles are Archaea, with the notable
5
exception of Hydrogenobaculum (in the Aquificales phylum in Bacteria). The highest
known temperature limits for growth at circumneutral pH by phototrophy,
chemoheterotrophy, and chemoautolithotrophy, are 75°C (3), 113˚C (13), and 122˚C
(108), respectively. The record for the highest temperature of growth is held by
methanogenic archaeon Methanopyrus kandleri at 122˚C. Based on the upper limits of
temperature stability for ATP, amino acids and peptides, the maximum temperature limit
for life is estimated at ~150°C (114, 115). However, since many of the structural and
physiological stresses associated with living in acidic habitats are similar to (and
compounded by) also living at high temperature - it is unlikely that thermoacidophily
would function at such a high temperature. For instance, the most acidophilic prokaryote
known is archaeon Picrophilus oshimae that grows optimally at pH 0.7 and grows at
temperatures between 45-65˚C (opt. 60˚C) (6, 98). Acidianus infernus is able to grow at
the highest temperature (range 65-96˚C; optimum 90˚C) and lowest pH (1-5.5; optimum
~2) combination known to support growth (99).
Cells must be able to maintain their PMF in order to sustain growth at high
temperatures. Ion permeability increases with increasing temperatures, which can disrupt
the PMF (112). However, the acidophile’s positive internal membrane potential helps
alleviate some of the stresses from increased temperatures by preventing ingress of
protons. In addition, cell membranes of Bacteria living in high temperature environments
are adapted to limit proton permeation by increasing the degree of saturated fatty acids,
increasing chain length of acyl chains, and increasing chain branching (86, 90, 107). As a
result, these heat-adapted membranes are able to maintain a liquid-crystalline structure in

6
spite of the increased entropy induced by high temperatures. As mentioned earlier, many
Archaea contain glycerol tetraether lipids in their membranes which form covalently
linked mono-layers. These mono-layer lipids increase the stability of the membrane and
reduce proton permeation (54).
Unlike acid-stable proteins, thermal stability of proteins tend toward a higher
abundance of charged amino acid residues with increasing growth temperature, and
reduced frequency of polar residues (6, 60, 96). In theory, electrostatic interactions,
including salt bridges, increase internal bonding of proteins due to their long range (4Å)
in comparison to van der Waals forces. An increase in protein surface charge increases
intracellular solubility of proteins (20).
Extreme thermophiles contain unique chaperonins to prevent and protect against
protein denaturation. Heat shock proteins (HSP) have been correlated with adaptive
thermotolerance across all domains of life (94). The first evidence for the role of HSP in
thermotolerance was found in the hyperthermophilic archaeon Sulfolobus shibatae (110,
111). When S. shibatae was exposed to 88°C for 60 minutes, cells were able to thrive for
40 minutes at a normally lethal temperature of 95°C. High levels of chaperone expression
for hsp60 accompanied the acquired heat tolerance.
There are no recognizable differences in genome sequence content as a whole
between thermophiles and mesophiles, however there is a bias for increased GC content
in tRNA and rRNA of thermophiles (49). The additional hydrogen bond between GC
base pairs (versus AU base pairs) provides a more thermally resistant double stranded
RNA molecule. Coding sequences of mRNAs of thermophiles also show a preference for

7
certain dinucleotides (ex. CC and GG) at the first and second position of codons (60).
Secondary structures of nucleic acids are stabilized by monovalent and divalent
cations (Na+, K+, and Mg2+), as well as linear and branched polyamines (70). Cations and
polyamines shield the highly negative phosphate backbone of DNA and RNA to facilitate
proper folding. Moreover, hyperthermophiles contain a family of DNA topoisomerases
called reverse gyrases that produces negative supercoiling (58). Generation of negatively
supercoiled DNA provides additional thermal protection to dsDNA that is positively
supercoiled in most mesophilic organisms.
Metabolic diversity of acidophiles
Chemolithotrophy is more prevalent among acidophiles than it is in any other
physiologic group of microorganisms (52). Chemolithothrophy is the ability to derive
energy from purely inorganic sources. Chemolithotrophs are often numerous in low pH
environments because inorganic energy sources are usually more abundant than organic
carbon (53). The extremely acidic (pH 0.8 to 1.38) and metal-rich waters in the
Richmond mine at Iron Mountain are dominated by iron-oxidizing bacteria Ferroplasma
sp. and Leptospirillium spp. (34). Leptospirillium ferrooxidans and iron- and sulfur-
oxidizing Acidithiobacillus ferrooxidans are also the most commonly detected Bacteria
in the acidic (~pH 2) cool waters (15-25°C) of Tinto River in southwestern Spain (42). In
addition, chemolithotrophy is considered the source of primary production in
environments lacking sunlight like deep sea vents (78) and in environments too hot for
photoautotrophic growth such as thermal hot springs (12).

8
Mixotrophs may derive energy from inorganic compounds while requiring
organic compounds for their carbon needs. Simultaneous assimilation of an inorganic
energy source and organic carbon provides mixotrophs with an advantage in acidic
environments that have fluctuating concentrations of organic carbon or reduced inorganic
energy sources (43). Heterotrophic acidophiles utilize organic compounds as both carbon
and energy sources and can grow aerobically, anaerobically, or both, depending on the
species and environmental conditions.
The redox potential of environments that prokaryotes inhabit can vary. When
present, oxygen is the most commonly used electron acceptor (esp. for iron oxidizers)
due to the high redox potential of +1.2 mV (at pH 2). However, most environments that
acidophiles and/or thermophiles occupy are anoxic or reducing in nature because of the
inputs of gases like H2 and H2S and reduced oxygen solubility at elevated temperatures
(18, 106). Alternative electron acceptors for anaerobic respiration include ferric iron and
sulfate. At pH<2.5, the ferrous/ferric couple reaction has a strong positive redox potential
(+0.77 V) that is slightly less electropositive than the oxygen/water couple. Therefore
ferric iron is an attractive alternative terminal electron acceptor to molecular oxygen.
Although the theoretic energy yield is reduced when growing anaerobically versus
aerobically, there is an advantage for anaerobic autotrophic growth. A study calculating
energy requirements for biomass synthesis by chemolithoautotrophs between oxic and
anoxic environments found a 10-fold greater energy requirement for aerobes relative to
anaerobes (74).

9
Iron and sulfur oxidation
Iron sulfides, notably pyrite (FeS2), are the most abundant sulfide minerals in the
lithosphere and constitute an important reservoir of reduced sulfur and iron. Ferrous iron
(Fe2+) is highly soluble and readily auto-oxidized to insoluble ferric iron (Fe3+) by
molecular oxygen at pH values greater than 5 (36). At low pH (<5), ferrous iron is less
susceptible to auto-oxidation. Therefore, most evidence for the enzymatic oxidation of
iron is from studies at acidic pH (36). Thermodynamically, oxidation of ferrous iron is
not a lucrative energy source (6.5 kcal/mol at pH 2.5) since it barely produces enough
energy for the synthesis of 1 mol of ATP (7 kcal/mol) (64). In order to provide enough
energy for autotrophic metabolism, approximately 18.5 mol of Fe2+ would have to be
oxidized to fix 1 mol carbon (assuming 120 kcal to produce 1 mol C at 100% efficiency)
(105). CO2 fixation by the Calvin Benson pathway requires NAD(P)H which is produced
by the reduction of NAD(P)+ by electrons obtained during growth. Studies of
Acidithiobacillus ferrooxidans (87) describe this process utilizing Fe2+ as the reducing
power. The redox potential of iron oxidation is more positive than the
NAD(P)+/NAD(P)H couple, therefore electrons must be transported ‘uphill” against the
electropotential gradient (Fig. 1). This process consumes energy in the form of ATP and
is termed reverse electron transport. Although the free energy associated with the
oxidation of ferrous iron is very low, the high concentration of ferrous iron in many
acidic habitats allows it to be an important electron donor for many acidophiles.
Ferric iron is also very soluble and abundant at pH<2.5 (36). In addition to the use
of Fe3+ as an alternative electron acceptor, ferric iron has been argued to be the major

10
oxidant of pyrite (38, 97) as:
FeS2 + 6Fe3+ + 3H2O Fe2+ + S2O32- + 7Fe2+ + 6H+.
At low pH, thiosulfate (S2O32-) is not stable and hydrolyzes to various forms of
polysulfides, as well as sulfate (SO42-) and elemental sulfur. Currently, it is impossible to
distinguish between direct and indirect oxidation of pyrite by microbes. However, due to
the preference of Fe3+ over O2 as the chemical oxidant of pyrite, iron-oxidizing bacteria
can facilitate the oxidative dissolution of pyrite in the presence of oxygen.
Sulfur is one of the most abundant elements in the lithosphere and is an essential
nutrient for all life forms (52). Although biological processes such as fermentation and
nitrification generate acidity, sulfur oxidation processes are responsible for generating
most of the extremely acidic habitats around the world (54). Oxidation of sulfur by
autotrophic and heterotrophic microorganisms generates sulfuric acid as:
S˚ + H2O + 1.5O2 H2SO4.
In the absence of carbonates or other basic minerals or buffers, dramatic decreases
in pH will result from sulfur oxidation. Some chemolithotrophic prokaryotes can obtain
some or all of their energy needs from the oxidation of elemental sulfur (S˚) and/or
various reduced inorganic sulfur compounds (RISCs). Utilization of S˚ and RISCs are
more energetically favorable than ferrous iron (52). Elemental sulfur and RISCs (such as
thiosulfate and tetrathionate) provide more electrons per mole of sulfur than ferrous iron.
For example, one electron from the oxidation of Fe2+ to Fe3+ is released, versus six
electrons from the oxidation of S˚ to SO42-. Also, the electrons obtained from the
oxidation of S˚ and RISCs enter the electron transport chain at a higher redox potential

11
than electrons from ferrous iron; therefore, more ATP is produced per mole of substrate.
For example, the free energy available (at pH 2) from the oxidation of S2O32- to H2SO4 is
-762.47kJ/mol while Fe2+ oxidation is -138.89 kJ/mol. During CO2 fixation by
autotrophs, electrons are thus readily available for the reduction of NAD(P)+ to
NAD(P)H, eliminating the need for reverse electron transport. This effect is evident in
the disproportionately higher growth yields obtained when Acidothiobacillus
ferrooxidans is grown on sulfur versus iron (45) and the greater cell densities of
autotrophic sulfur oxidizers over iron oxidizers in bioreactors (84).

12
Figure 1. Model of electron transport chain in Gram-negative Acidithiobacillus ferrooxidans (87). During the oxidation of ferrous iron to ferric iron, electrons are used to reduce oxygen and protons to water (solid straight arrows). However, when utilizing electrons from ferrous iron for CO2 fixation, electrons are transported “uphill” (dotted straight arrows) by the electron transport chain to NAD(P) via ubiquinone (UQ). Key: OM, outer membrane; IM, inner membrane; RUS, rusticyanin; Cyc, cytochrome c.
Cyc2OM
Fe2+ Fe3+
Rus
Cyc c4 Cyc c4
IM Cytochromeoxidase
bc1complex UQ NADH dehydrogenase
2 H+ + ½ O2 H2O NAD(P) + H+ NAD(P)HCYTOPLASM
PERIPLASM

13
Background on Boiling Springs Lake
Site description
Lassen Volcanic National Park (LVNP) is located at the south end of the Cascade
Range and features an array of hydrothermal activity, including the large, hot, acidic lake
known as Boiling Springs Lake (BSL). BSL is the largest hot spring in North America
with a surface area of ~18,000m2; the size and pH appear relatively stable from direct
summer measurements (1999-2012) despite seasonal variations (27, 102, 103). BSL is a
designated National Science Foundation Microbial Observatory, in which the ecosystem
within this hydrothermal lake is being investigated in our laboratory in collaboration with
biologists Gordon Wolfe at Chico State University and Kenneth Stedman at Portland
State University.
The LVNP hydrothermal features result from a vapor-dominated system that
produces acidic waters (~pH 2.0). BSL has lower chloride (~1 ppm) and higher sulfate
(~967 ppm) (102, 103) concentrations than most of the liquid-dominated geothermal
systems in Yellowstone National Park (50). Compared to other acidic systems (34, 42,
57), heavy metals in BSL (other than Fe; ~38 ppm) are present in low amounts (<0.1
ppm) (102, 103). BSL is oligotrophic (TOC and DOC ~1 ppm) despite receiving major
inputs of allochthonous organic material from surrounding alpine forest (102). The
geothermal hot spring is a well-mixed water feature, filled with suspended sediments of
mostly fine clay that result in a secchi depth of <10 cm (102, 117). The majority of BSL
and site A (Fig. 2) have a summer temperature range of 50-55°C (102, 103, 116) while
14
winter temperatures range from 39.8-48˚C (39, 117). Active geothermal inputs can be
observed in the south end of the lake (Fig. 2, site D) with summer temperatures ranging
from 65-95°C (103, 116, 117).

15
Figure 2. Boiling Springs Lake (BSL) with sites A and D designated by arrows. BSL is an acidic (pH ~2), thermal, iron-sulfide-rich hot spring in Lassen National Volcanic Park, CA, USA. Average summer water temperature of sites A and D are 52˚C and 82˚C, respectively. Average winter water temperature at the cooler portion of the lake is ~48˚C.
A
D

16
Microbiology of BSL
The composition of the planktonic and sediment prokaryotic community of BSL
(at sites A and D) was explored by analyzing multiple 16S rRNA gene clone libraries
(116, 117). Due to the warmer and more variable conditions at site D versus site A,
phylotype richness was expected to be lower at site D than at site A, and considerable
differences were expected in terms of community composition. However, no significant
reduction in phylotype richness was found in site D, and the communities at sites A and
D were surprisingly similar despite the 30˚C temperature differential. Convective mixing
and gas inputs into the system seem to homogenize the communities in this system (117).
Archaeal phylotypes were numerically abundant in sediment samples while water
samples were dominated by bacterial phylotypes. The four most prevalent phylotypes in
the clone libraries derived from sediment samples shared an average of ~85% sequence
identity to the closest cultivated Archaea representative, suggesting the presence of
diverse novel organisms (116). The most prevalent phylotypes in the clone libraries from
the water column (117) shared 99% sequence identity with Acidimicrobium sp. Y0018
isolated from Yellowstone National Park (57) and Hydrogenobaculum sp. Y04 ANCI.
Both phylotypes were also present as minor members in the sediment clone libraries. The
closest cultured relative to Acidimicrobium sp. is the sole and type strain Acidimicrobium
ferrooxidans ICPT (Genebank accession number CP001631), isolated from Icelandic hot
springs in the Krisuvik geothermal area (24). Members of the species have been isolated
or detected molecularly in warm, acidic, iron-sulfur-, or mineral-sulfide-rich
environments (16, 24, 80). Acidimicrobium ferrooxidans is an autotrophic and

17
mixotrophic bacterium that is able to oxidize iron and grow anaerobically on Fe3+ with
the presence of an organic carbon donor.
Production in BSL
Recently, functional genes were assessed using functional gene clones libraries
and functional gene microarray from BSL site A water (102). Thirteen different primer
sets were used to target genes encoding for enzymes from 5 known carbon fixation
pathways; Calvin Cycle (RuBisCo forms I, II, and II), Reductive TCA (ATP citrate lyase
and citryl CoA lyase), Reductive Acetyl CoA (formyl tetrahydrofolate synthetase), and 3-
Hydroxypropionate/4-Hydroxybuturate (malonyl CoA lyase). Both cbbL primer sets
targeting RuBisCo I (k2f/v2r and 595F/1387R), amplified a sequence that shared 86-88%
nucleotide identity (94-96% amino acid identity) to Acidimicrobium ferrooxidans DSM
10331. An additional sequence was amplified with 595F/1378R only, sharing 88-89%
nucleotide identity with Acidithiobacillus caldus (97% amino acid).
Geochip analysis showed that the majority of the carbon cycling signal on the
microarray was due to hybridization of BSL DNA to probes associated with heterotrophy
(102). BSL is limited by both inorganic and organic carbon, suggesting that microbial
production is fueled by primary and secondary production. Heterotrophic and/or
mixotrophic acidophiles are commonly found growing alongside chemoautotrophic
primary producers in natural (57) and anthropogenic (42, 57, 84, 89) acidic environments.

18
Comparison with Acid Mine Drainage Sites
Studies of acid mine drainage (AMD) systems provide one of the best examples
for understanding interactions among microbial communities in acidic habitats. Key
players found in AMD systems can be categorized as iron oxidizers, sulfur oxidizers and
heterotrophs (89). Autotrophic iron oxidizers are required to generate ferric iron to
solubilize minerals (ie. pyrite) as well as provide organic carbon to stimulate growth of
other players. Sulfur oxidizers grow optimally with added carbon sources, producing
sulfuric acid to keep the pH at the optimum for the iron oxidizing acidophiles. The
presence of heterotrophs aids in degrading small soluble metabolites produced by
autotrophs that may be self-inhibitory (e.g. pyruvic and glycolic acid).
Similar ecological roles found in the microbial community of AMD systems may
also occur in BSL. The presence of RuBisCo I from Acidimicrobium (102) along with the
high prevalence of Acidimicrobium in BSL planktonic 16S rRNA clone libraries (11,
117), suggests that this organism may be an important primary producer in BSL. In this
study, we isolated iron-oxidizing Acidimicrobium along with physiologically similar
Sulfobacillus sp. and heterotrophic Alicyclobacillus spp.. These three moderately
thermophilic genera represent potentially different metabolic functions in the BSL
ecosystem. By conducting physiological and metabolic characterization of these
organisms, we will begin to understand their roles in this extreme environment. We
determined optimal growth conditions for isolates and investigated the ability for some
isolates to oxidize iron, pyrite, sulfur, and tetrathionate.
19
CHAPTER 2: MATERIALS AND METHODS
Media Preparation
Ferrous sulfate with trypticase soy broth (FeTSB) medium contained, per liter, 1.8
g (NH4)2SO4, 0.7 g MgSO4 x 7 H2O, 0.25 g TSB (BD Diagnostic Systems, USA), 10 g
FeSO4 x 7 H2O, distilled water, and was adjusted to pH 2.0 with 37 N H2SO4. Ferrous
sulfate and potassium tetrathionate with TSB broth (FeSo) contained mineral salts and
TSB described above, with the following modifications, per liter: reduction of FeSO4 x 7
H2O to 6.69 g, addition of 0.7 g K2S4O6 and pH adjusted to 2.5 with 37 N H2SO4.
Plates of FeTSB and FeSo were prepared by amending broth recipes described
above (55). Three separate solutions were prepared and adjusted to pH 2.5 with 37 N
H2SO4: TSB-mineral salts (in 740 ml), ferrous sulfate (6.69 g/L FeSO4 x 7 H2O in 50 ml
distilled water) and potassium tetrathionate (0.7 g/L K2S4O6 in 10 ml distilled water). The
autoclaved TSB-mineral solution was cooled to <40˚C, prior to the aseptic addition of
filter-sterilized (0.2 µm Micropore filters) ferrous sulfate and potassium tetrathionate
solutions. Agarose from a 10X solution that was also autoclaved separately and cooled to
~60˚C, was added to base medium of FeTSB or FeSo (post-autoclaving) to a final
concentration of 0.7% or 0.5% (v/v), respectively. Media were rapidly mixed and
distributed into sterile petri plates.
Overlay plates of FeTSBo and FeSo (55) were prepared similarly to the single
layer counterparts described above with the following amendments. FeTSBo and FeSo
are two-layered solid gels that contain acidophilic heterotroph Acidiphilium SJH in the

20
bottom layer. When the autoclaved TSB-mineral solution cools to <40˚C, Acidiphilium
SJH is added to a final concentration of ~106 cells/ml, mixed with the agarose solution
and aseptically distributed to thick petri plates at half the depth and allowed to solidify.
The top layer is then rapidly assembled and poured over the solid bottom layer. Prior to
inoculation into the bottom layer, Acidiphilium SJH (NCIMB 12826) was grown in liquid
medium containing, per liter, 6.96 g FeSO4 x 7 H2O, 0.7 g K2S4O6, 1.8 g galactose and
0.25 g TSB, at pH 2.5 and incubated at 30˚C for up to 3 days (56).
Liquid 1X PTYG medium contained, per liter, 0.25 g peptone, 0.25 g tryptone,
0.5 g yeast extract, 0.5 g dextrose, 0.6 g MgSO4 x 7H2O, 0.07 g CaCl2 x 2H2O, distilled
water, and adjusted to pH 2.0 with 37 N H2SO4. Gelrite-solidified 1X PTYG medium was
prepared by adding 5 ml per liter each of 2 M MgCl2 and 0.5 M CaCl2 solutions to the
aforementioned liquid medium. A 2X gelrite solution was prepared separately and
adjusted to pH 2.9 with 37 N H2SO4. Post autoclaving, gelrite was added to PTYG base
medium (at 80˚C) to a final concentration of 0.8%. Media were rapidly mixed and
distributed into sterile petri plates.
Washed agarose/yeast extract (WAYE) medium contained, per liter, 0.2 g yeast
extract, 0.5 g MgSO4 x 7H2O, 0.15 g (NH4)2SO4, 0.1 g KCl, 0.01 g Ca(NO3)2, distilled
water, and adjusted to pH 2.5 with H2SO4 (55). A water-washed agarose solution (250
ml) was prepared and autoclaved separately; agarose (7.0 g) was soaked for
approximately 30 minutes in 1 L distilled water with continuous mixing. The solution
was allowed to settle for 15 minutes and the supernatant was decanted. The washed
agarose was centrifuged 10,000 rpm (RC5C Sorvall Instruments DuPont fixed angle rotor

21
SA-600) and the agarose pellets re-suspended in 250 ml distilled water and sterilized by
autoclaving. After autoclaving, the yeast/salts and agarose solutions were combined. Five
ml of a 0.2 µm filter-sterilized ferrous sulfate solution (0.696 g FeSO4 x 7 H2O in 5 ml
distilled water at pH 2.0) was aseptically added to the combined medium prior to
distributing to petri plates.
Autotrophic, Heterotrophic, Mixotrophic, Pyrite, Sulfur, Sulfur/YE,
Sulfur/YE/trace Fe, Tetrathionate, Tetrathionate/YE, and YE media for Acidimicrobium
cultivation contained different amendments to the following basal mineral salts, per liter,
0.4 g MgSO4 x 7H2O, 0.2 g (NH4)2SO4, 0.1 g KCl, and 0.1 g K2HPO4. Autotrophic
medium was composed of mineral salts amended with 13.9 g/l FeSO4 x 7H2O adjusted to
pH 1.7 with 37 N H2SO4 (24), Heterotrophic medium was composed of basal mineral
salts amended with 0.01 g/l FeSO4 x 7H2O and adjusted to pH 2.0 with H2SO4 (24).
Mixotrophic medium was composed of mineral salts amended with 2.9 g/l FeSO4 x 7H2O
and adjusted to pH 2.0 with 37 N H2SO4 (24). Yeast extract was aseptically added to
sterilized, cooled Heterotrophic and Mixotrophic media to a final concentration of
0.025% from a previously autoclaved 3% (wt/vol) solution in distilled water. Pyrite
medium contained mineral salts amended with 1% (wt/vol) ground rock pyrite and pH
adjusted to 2.0 with 37 N H2SO4. Sulfur medium contained mineral salts amended with
0.5% (wt/vol) elemental sulfur (S˚) and pH adjusted to 2.0 with 37 N H2SO4. Elemental
sulfur was sterilized by tyndallization (unpressurized heating at 100˚C for 1 hour each for
3 successive days). Sulfur/YE medium was prepared identically to Sulfur medium but
also contained 0.01%YE from previously autoclaved 3% (wt/vol) solution in distilled

22
water. Sulfur/YE/trace Fe medium was prepared identically to Sulfur/YE medium but
were amended with 0.036 mM FeSO4. Tetrathionate medium contained mineral salts
adjusted to 2.0 with 37 N H2SO4. After autoclaving, 5 mM K2S4O6 was added aseptically
to mineral salts with a 0.2 µm filter from a 100mM stock solution adjusted to 2.0 with 37
N H2SO4. The pH remained at 2.0. Tetrathionate/YE medium was prepared identically to
Tetrathionate medium, but also contained 0.01% YE from previously autoclaved 3%
(wt/vol) solution in distilled water. YE medium contained mineral salts adjusted to 2.0
with 37 N H2SO4. After autoclaving, 0.01% YE was added from previously autoclaved
3% (wt/vol) solution in distilled water.
All media were sterilized by autoclaving at 121˚C, 15 PSI for 20 minutes unless
noted otherwise.
Isolation of Sulfobacillus and Alicyclobacillus Strains
The work described in this section was done by former undergraduate Jennifer
Hampton and by my advisor Patricia Siering.
Sample collection
During the summer of 2009, sediment/water slurry samples were aseptically
collected from the shoreline at BSL site A and D (Fig. 2) as previously described (103,
116, 117). Duplicate ½ serial extinction dilutions (to 2.56 x 10⁻⁶) were prepared in sealed
Balch tubes on site into three different types of liquid media (FeTSB, FeSo, and
Acidimicrobium autotrophic liquid media) and incubated at 45˚C and 50˚C on return to

23
campus (approximately 8-10 hours post-collection); enrichment headspaces were
replenished with 0.2 µm filter-sterilized air every two weeks. Additionally, 100 µL of
undiluted and diluted (10-1-10-3) slurry samples from each site were plated onto FeTSB
and FeSo plates on site, and incubated in sealed plastic containers at 45˚C and 50˚C on
return to campus (approximately 8-10 hours post-collection).
Winogradsky column enrichments
Duplicate Winogradsky-type Ferrous Sulfate and Ferric Citrate enrichment
columns were created in 200 mm x 25 mm glass test tubes from BSL sediment and water
(site A), and one of each type were incubated at room temperature in a sunny window,
and at 45°C in the dark for 1.5-5 months prior to culturing attempts. Enrichment columns
was prepared by amending BSL sediment with an equal volume of a 2X media solution
prepared in BSL site water, and pH adjusted to 2.8 with 5 N H2SO4: (1) Ferrous Sulfate
(FeSO4) enrichment contained (final concentration in g/L)- 3.0 g (NH4)2SO4, 0.5 g
K2HPO4, 0.5 g MgSO4-7H2O, 0.1 g KCl, 0.01 g Ca(NO3)2, 44.22 g FeSO4-7H2O; and (2)
Ferric Citrate enrichment contained (final concentration in g/L)- 13.7 g ferric citrate, 5.6
g sodium lactate (60% solution), 2.5 g NaHCO3, 1.5 g NH4Cl, 0.6 g NaH2PO4, 0.1 g KCl,
10 ml each of Wolfes’s vitamin and mineral solutions (8).
FeTSB, FeTSBo, FeSo, FeSo and WAYE plates were inoculated in duplicate with
100 μl of material from each column listed above. The plates were incubated at 50°C
aerobically (in sealed plastic containers) and microaerobically using BD* Diagnostic
anaerobic jars (Mitsubishi AnaeroPak*-Microaero, Mitsubishi Gas Chemical, Company,
24
Inc.). Serial extinction dilutions of material from each type of enrichment column were
prepared by inoculating duplicate series of ½ serial extinction dilution tubes to a final
dilution of 2.56 x 10⁻⁶. For each enrichment type, three different liquid types of media
were inoculated: FeSo, FeTSB and Autotrophic, and each series was incubated at 45°C
and 50°C. Headspace was replenished weekly with 0.2 µm filter-sterilized air.
Selection and purification of isolates
Once significant growth was obtained from plates (Fig. 3), unique colony types
were selected for single colony isolation (SCI). These unique colony types were re-
streaked for SCI until they appeared pure (single colony morphology per plate and single
cell morphology at 1000X phase contrast microscopy). When the most dilute growth-
positive tubes in a dilution series contained a single cell morphology type (as indicated by
1000X phase contrast microscopy), they were diluted again (1/2 dilutions to 2.5 x 10⁻⁶).
After three rounds of extinction dilution culturing, the culture was considered pure (Fig.
3). Streaking for single colony isolation was also attempted from extinction dilution
tubes. Information regarding maintenance and freezing of isolates can be found in the
appendix (App. A, B).

25
Figure 3. Flow chart schematic summarizing methods for isolation of Sulfobacillus and Alicyclobacillus strains. Individual slurry samples were collected from BSL sites A and D (Fig. 2). Samples from both sites were spread onto plates or diluted to extinction in liquid media (see methods). Duplicate Winogradsky column enrichments were made from amending Site A mud with enrichment media. Post-incubation, enrichment columns were inoculated onto a variety of solid media and diluted to extinction in liquid media. Cultures were purified by single colony isolation (SCI) or extinction dilution culturing, and purity was verified microscopically. The isolation of Sulfobacillus and Alicyclobacillus was accomplished by former undergraduate Jennifer Hampton under the direction of Dr. Patricia Siering in our laboratory.
Spread -plated
Slurry Sample
Winogradsky Column Enrichments
Serial Extinction Dilutions Spread-
plated Serial Extinction Dilutions
SCI
Single Colony Isolation (SCI)
Check for Purity of Isolates

26
Isolation of Acidimicrobium sp. from BSL
Sample collection
On June 25, 2010, water samples were aseptically collected from the shoreline at
BSL site A (Fig.2) as previously described (103, 116, 117). Temperature and pH were
recorded on site using Thermo-Orion290A Plus meter (Fisher Scientific, Pennsylvania,
PA). Sediment was allowed to settle, prior to cultivation efforts. Within two hours of
collection, site water was inoculated for enrichment or onto plates (Fig. 4). Samples for
enrichment were diluted (in sterile media) to 1/30, 1/100, 1/1000, and 1/5000 and
inoculated into Wheaton serum bottles containing either of the three liquid media
(Autotrophic, Heterotrophic, or Pyrite); final volumes were 15 or 30 ml, in 60 or 100 ml
bottles, respectively. FeSo and FeSo plates were inoculated by spread-plating with 100 µl
of undiluted, 1/10, 1/100, and 1/1000 dilutions (in sterile media) of sample. Bottles were
sealed, and all inoculated media were left at ambient temperature for approximately 24
hours, followed by incubation at 45˚C and 50˚C upon return to HSU. The headspace of
all serum bottles was replaced weekly with air that was passed through a gas filter and
0.2 µm syringe filter. Plates were incubated in sealed plastic containers.
Isolation and purification
Morphology and relative cell densities (growth) were monitored weekly by phase
contrast microscopy (400X and 1000X phase contrast microscopy) over the course of two
months. Enrichments that showed growth in the most dilute bottle were diluted to

27
extinction by serial 1/10 dilutions (to 1 x 10⁻⁸ final dilution) into fresh media. All
enrichments showing growth were spread-plated (100 µl) onto FeSo and FeSo, and
incubated at source temperature of the enrichment.
Inoculated plates were observed daily for evidence of growth. Once significant
growth was obtained, unique colony types were selected for SCI and were re-streaked
until they appeared pure. Plates that indicated growth of a potential iron-oxidizing
bacteria (red/orange encrusted colonies or smears) were screened via PCR with
Acidimicrobium-specific 16S rRNA primers AmcF/AmcR and universal primers (see II.
D.1). Information regarding maintenance and freezing of isolates can be found in the
appendix (App. A, B).

28
Figure 4. Flow chart schematic of methods summarizing isolation of Acidimicrobium sp. Water from slurry sample collected from site A (Fig. 2) was inoculated onto plates and enrichment media (see Methods). Plates were also inoculated from all enrichments showing growth and incubated at enrichment source temperature. Serial extinction dilutions were started from the most dilute enrichment showing growth and incubated at source temperature. Cultures inoculated onto plates were streaked for purity by single colony isolation (SCI). Purity of isolates was verified by plate and cell morphology. Orange colonies/smears were screened via PCR with Acidimicrobium-specific SSU rRNA primers AmcF/AmcR (see Methods and Table 1).
Check for Purity of Isolates
Spread -plated
Supernatant from Slurry Sample
Enrichments
Spread-plated Serial
Extinction Dilutions
SCI
Single Colony Isolation (SCI)
Screen Orange Colonies/Smears by PCR (AmcF/AmcR)

29
Identification of Isolates by 16S rRNA Gene Sequencing
Acidimicrobium-specific 16S rRNA primer design
16S rRNA gene sequences derived from members of the Acidimicrobium genus
(in Actinobacteria phylum) were obtained from the Ribosomal Database Project
(http://rdp.cme.msu.edu/) and from the NCBI database (http://www.ncbi.nlm.nih.gov/).
Using the program Sequencher 4.8 (Gene Codes Corporation, Ann Arbor, MI), these
sequences were aligned with sequences from the Acidimicrobium phylotype found in
BSL sites A and D (117). Additionally, sequences of other taxonomically-related species
(e.g. members of the Firmicutes phylum – Alicyclobacillus, Sulfobacillus, Geobacillus,
and members of the Actinobacteria phylum – Arthrobacter, Microbacterium,
Staphylococcus) that have been detected and isolated from BSL (47, 116, 117) were
imported and aligned in Sequencher with the Acidimicrobium sequences. This alignment
was scanned for stretches of nucleotides which were fairly conserved in the
Acidimicrobium 16S genes, but different from the other taxonomically-related BSL
dwellers. Fifteen possible primer sequences (some in the forward and some in the reverse
direction) were obtained from this alignment. The Ribosomal Database project and
NCBI nucleotide BLAST were used to analyze the in silico specificity of each primer to
the Acidimicrobium genus. Potential primers and primer pairs were analyzed in the
program OligoAnalyzer 3.1
(http://www.idtdna.com/analyzer/applications/oligoanalyzer/) for their likelihood of
forming primer dimers and hairpins, etc. We chose to use a previously published reverse

30
primer Amf:995 (25), subsequently called AmcR, with a forward primer (AmcF)
designed herein. AmcF and AmcR target positions 554-577, 995-974 (E. coli
numbering), respectively (Table 1). The design and testing of these primers was
conducted by former undergraduates Jennifer Hampton and Jonathon Schultz under the
direction of Dr. Patricia Siering in our laboratory.
SSU rRNA gene amplification by PCR
Orange colonies and growth smears were screened by whole cell (single-colony)
PCR as putative Acidimicrobium isolates using primers (AmcF/AmcR). Isolates that were
positive for amplification with AmcF/AmcR primers were subjected to additional PCR
reactions to amplify the entire SSU rRNA gene using primer sets 8F/690R and
341F/U1406R (Table 1). Whole cell PCR using primer set U341F/U1406R was not
possible for Acidimicrobium-positive isolates. Instead, we collected cells grown in liquid
heterotrophic medium at 45˚C for ~1 week until the maximum cell density was reached.
One milliliter volumes of culture (2 ml total) were centrifuged at 10,000 x g for 5
minutes, decanted, and then resuspended with 1 ml nuclease-free water. Different
dilutions of resuspended cells were subjected to PCR amplification. Primers 8F/690R
and U515F/P1525R or U341F/U1406R (Table 1) were used to amplify the entire SSU
rRNA genes for all putative Alicyclobacillus and Sulfobacillus isolates. For each putative
isolate, six individual colonies (or growth smears) from freshly cultivated plates were
subjected to whole cell PCR amplification in separate 25 µL reactions. Reactions were
prepared in MasterMix (Promega Corporation, Madison, WI), and amplified using
31
annealing temperatures ranging from 55-58˚C and one minute dwell times. Amplicon
sizes and specificities were confirmed by agarose gel electrophoresis by comparison to
known sized standards. A minimum of 3 positive reactions were pooled by volume prior
to purification using Wizard® PCR preps DNA Purification Systems (Promega, Madison,
WI), per manufacturer’s recommendations.
Clone library construction and sequence analysis
Pooled and purified amplicons derived from single colonies of putative
Alicyclobacillus and Sulfobacillus isolates were sent to SagaGene of Palo Alto, California
for direct sequencing of SSU rRNA genes. Pooled and purified amplicons of putative
Acidimicrobium isolates were cloned into the pGEM-T Easy cloning vector (Promega,
Madison, WI) and transformed into competent E. coli JM109 cells (Promega, Madison,
WI) per manufacturer’s recommendations. Plasmids from white clones were subjected to
single colony PCR using vector primers T7F/M13R (Table 1) and confirmed for expected
product size by agarose gel electrophoresis. Negative controls consisting of blue colonies
were also screened as negative controls. Plasmid DNA was isolated from confirmed
clones using Wizard® Plus SV Minipreps (Promega, Madison, WI), according to
manufacturer’s recommendations. Concentrations of plasmid DNA were determined by
diluting and comparison with known molecular weight standards on agarose gels, and
spectrophotometrically (Thermo Scientific NanoDrop 1000 spectrophotometer,
Wilmington, DE). For each putative Acidimicrobium isolate, plasmids from fifteen clones
from the AmcF/AmcR library and 13 clones from the U341/1406R library were

32
sequenced in both directions by Sagagene BioScience Corporation (Palo Alto, CA) with
the ABI3730xl genetic analyzer.
Sequences were analyzed and vector sequences were removed using the
Sequencher DNA sequence software 4.8 (Gene Codes Corporation, Ann Arbor, MI).
SDSC Biology Workbench 3.2 (http://workbench.sdsc.edu/) was utilized to perform
alignments of sequences to each other in Clustal W and to estimate genetic distances
using Clustal Dist (109). Sequence identity was compared to those in the NCBI database
(http://www.ncbi.nlm.nih.gov/) using the basic alignment local alignment search tool
(BLAST) for nucleotide sequences (4). We searched the Nucleotide collection (nr/nt)
database using Megablast (optimized for highly similar sequences). Strain identification
was accomplished with the help of former undergraduates Clayton Carey and Jonathon
Schultz under the direction of Dr. Patricia Siering.

33
Table 1. 16S rRNA primers utilized.
Primer Direction Sequence Reference U8F Forward 5’-AGAGTTTGATCCTGGCTCAG-3’ (63) U690R Reverse 5’-TCTACGCATTTCACC-3’ (63) U515F Forward 5′-GTGCCAGCAGCCGCGGTAA-3’ (92) P1525R Reverse 5’-AAGGAGGTGATCCAGCC-3’ (63) U341F Forward 5’-CCTACGGGRSGCAGCAG-3’ (44) U1406R Reverse 5’-GACGGGCGGTGTGTRCA-3’ (92) AmcF Forward 5’-GTCGGATGTGAAATCACCAGGCTC-3’ This work AmcR Reverse 5’-CTCTGCGGCTTTTCCCTCCATG-3’ (25) T7F Forward 5’-TACGACTCACTATAGGG-3’ Promega
pGem T easy protocol
M13R Reverse 5’-CAGGAAACAGCTATGAC-3’ Promega pGem T easy protocol

34
Morphology of Acidimicrobium by Electron Microscopy
Isolates EAO1, EAO2, EAO4 and the Acidimicrobium ferrooxidans ICPT (DSM
10331, type strain) were grown in Heterotrophic and Mixotrophic medium at 45˚C for 1
week until they reached late exponential/early stationary phase.
Transmission electron microscopy (TEM)
Exponential phase cultures were cooled to room temperature and 4 ml of culture
were spun down in a centrifuge at 12000 x g to pellet cells. Centrifuged tubes were
immediately placed in ice, supernatant was removed and pellet was resuspended in 1 ml
3% (V/V) glutaraldehyde in 50 mM cacodylate buffer-HCl (pH 7.0). Cells were fixed at
room temperature for 1h, then placed on ice for at least 15 min. Fixed cells were
harvested by centrifugation at 12000 x g, washed in 1 ml of 50 mM cacodylate buffer-
HCl (pH 7.0) buffer (3 times), and stained with 1% (vol/vol) osmium tetroxide in distilled
water. Cells were centrifuged and rinsed with 1 ml of distilled water (3 times), and
embedded in 4% agar blocks. The Pelco BioWave® 3451 lab microwave system (Ted
Pella Inc., Redding, CA) was utilized for dehydration and infiltration processes per
manufacturer’s recommendations. Agar blocks were sliced and dehydrated in a graded
series of increasing ethanol concentrations (25%, 50%, 75%, and 100%) at 40 seconds
each (37˚C) using the microwave system. Resin ERL-4221 (3,4-Epoxycyclohexylmethyl
3,4-epoxycyclohexanecarboxylate) (Ted Pella, Inc., Redding , CA) was prepared using
the standard block formulation, per manufacturer’s recommendation. Dehydrated sections
were infiltrated in a series of increasing resin concentrations for 15 minutes each at 45˚C,

35
using the microwave system. The first resin mixture contained equal volumes of resin and
100% ethanol. Immediately following, sections were infiltrated into fresh resin, twice in
succession. Samples were transferred to BEEM capsules or molds and allowed to
polymerize overnight in a 60˚C oven. Ultrathin sections were cut on Reichert Om U2
ultramicrotome with a Diatome diamond knife and post-stained with uranyl acetate and
lead citrate (91). All samples were observed with a Phillips EM 208S transmission
electron microscope operated at 60 kV.
Scanning electron microscopy (SEM)
Four one-ml volumes of exponential phase cultures (grown approximately 1
week) were collected onto a 0.2 µm nucleopore membrane filter and immediately fixed in
3% (V/V) glutaraldehyde in 50 mM cacodylate buffer-HCl (pH 7.0). Cells were fixed at
room temperature for 1h. After fixation, cells were washed with 50 mM cacodylate
buffer-HCl (pH 7.0) and dehydrated in a graded series of increasing ethanol
concentrations (25%, 50%, 75%, and 3 times in 100%) for 10 minutes each. The center
of the membrane filter was cut and then processed through a critical point dryer (Polaron,
Watford, England) and sputter-coated with gold. All samples were observed with Topcon
ABT-32 scanning electron microscope from 25-30 kV and 6 mm working distance.

36
Physiological Characterization of Isolates
Preparation of inocula and growth assessment
Acidimicrobium sp., Sulfobacillus sp., and Alicyclobacillus sp. isolates obtained
from this work (Table 3) and A. ferrooxidans ICPT were examined for optimal growth
conditions and possible energy sources. For all growth experiments, inocula were
prepared by subculturing single colonies or smears (for Acidimicrobium isolates) from
fresh (1-5 days old) FeSo plates (for Acidimicrobium and Sulfobacillus), or 1X PTYG-
gelrite plates (for Alicyclobacillus sp.), into specified media, and incubating at 50˚C until
cultures were in exponential phase as determined by (microscopically) following
increases in cell number over time. Equal numbers of actively growing cells were
transferred, in duplicate, to experimental medium to an initial cell density of
approximately 5x10³ cells/ml. All growth experiments, except those for determination of
temperature and pH range and optima, were conducted with media prepared at pH 2.0
and incubated at 50˚C. For experiments lasting longer than 5 days, the headspaces of
tubes were replenished every 5 days with 0.2 µm filter-sterilized air. For growth
experiments with Acidimicrobium and Sulfobacillus, relative growth was assessed by
direct counts using a hemocytometer (400X phase contrast microscopy) at a minimum of
three different time points during exponential growth. Differences in morphologies
associated with variable growth condition(s), if any, were noted. Growth experiments
with Alicyclobacillus were monitored by both direct cell counts and optical density at 595
nm using Bausch & Lomb Spectronic 20 (Rochester, NY) spectrophotometer.

37
The average of direct cell counts for each time point was used to first calculate n,
the number of generations during the period of exponential growth as:
Equation 1:
where N is the final cell number and N0 is the initial cell number. To determine doubling
time (or time/generation), the duration of exponential growth (t) expressed in hours was
divided by n.
Determination of pH and temperature optima and range for growth
Growth experiments. Inocula cultures and growth experiments for determination
of optimal temperature and pH were prepared in liquid Heterotrophic medium (pH 2.0)
for Acidimicrobium and Sulfobacillus, and in 1X PTYG liquid medium (pH 3.0) for
Alicyclobacillus. To determine temperature ranges and optima for growth of isolates,
duplicate tubes were incubated at 25˚C, 30˚C, 35˚C, 45˚C, 50˚C, 60˚C and 70˚C. To
determine pH ranges and optima, duplicates were inoculated into liquid medium adjusted
to pH 1.0, 2.0, 3.0, 4.0, 5.0, 6.0 and 7.0 (with H2SO4 and NaOH), and incubated at 50˚C
(for isolates obtained in this work) or 45˚C (A. ferrooxidans ICPT).
Linear regression models and Akaike information criterion (AICc). In order
to determine whether pH and temperature variables could distinguish among 11
Sulfobacillus isolates (Table 4) and/or could distinguish between species of
𝑛𝑛 =𝑙𝑙𝑙𝑙𝑙𝑙𝑙𝑙− 𝑙𝑙𝑙𝑙𝑙𝑙𝑙𝑙0
𝑙𝑙𝑙𝑙𝑙𝑙2

38
Acidimicrobium and Sulfobacillus, we performed a linear regression and ranked models
by AICc (73) with R software (version 2.15.1) (see Appendix equations for generating
AICc values). To compare various growth rates of isolates, we first calculated the number
of generations produced during exponential phase (see Eq.1). The division rate was used
as the response variable in the analysis, and this was calculated by dividing the number of
generations per unit of time in an exponentially growing culture. Regression and AIC
analyses and interpretation were conducted by Connor Fitzhugh, a graduate student in our
laboratory under the direction of Dr. Rob Van Kirk in the department of Mathematics at
HSU.
Iron and pyrite as energy sources
Autotrophic growth of Acidimicrobium sp. (EAO1 and EAO4 isolated in this
work, and A. ferrooxidans ICPT) were compared under varying iron concentrations with a
headspace of enhanced CO2 (3-5% v/v) or filter-sterilized air. Inocula cultures grown in
Autotrophic medium were sub-cultured into fresh Autotrophic medium containing the
following iron concentrations; 50 mM, 25 mM, 10 mM, 2 mM, 0.68 mM, 0.136 mM, and
0 mM. Isolates obtained in this work were incubated at 50˚C, and the ICPT type strain
was incubated at 45˚C.
Mixotrophic growth of EAO1, A. ferrooxidans ICPT, JAO1, and JWO19m were
examined. Inocula cultures grown in Mixotrophic medium were sub-cultured into fresh
Mixotrophic medium, amended as follows: no YE or iron (mineral salts only), no iron
(0.01%YE only), no YE (10 mM FeSO4 only), heterotrophic (0.01% YE and 0.036 mM

39
FeSO4), and 0.01%YE amended separately with 1 mM, 10 mM, 25 mM or 50 mM
FeSO4. In addition, inocula cultures were sub-cultured into fresh Pyrite medium amended
with 0.01%YE.
Iron and pyrite oxidation via ferrozine assay
Evidence of iron and pyrite oxidation was observed by comparing growth and
ferrous iron oxidation using the colorimetric ferrozine assay (66) which measures total
soluble ferrous iron. All assays were analyzed, in triplicate, using HP8452A diode array
spectrophotometer at 562 nm. Samples, controls and standard solutions were treated
identically.
Acidimicrobium isolates, A. ferrooxidans ICPT, and six Sulfobacillus isolates
(JAO1, JWO13, JWO19m, JWO20m, JWO21m, and JWO22m) were cultured in
Mixotrophic medium with YE amended to 0.01% and sub-cultured separately into
Mixotrophic and Pyrite media, with and without 0.01% YE. After growth, a 25 µL
sample of culture (cooled to room temperature) was combined with 5 mL of ferrozine (1
g/liter) in 50 mM HEPES (N-2-hydroxyethylpiperazine-N’-2-ethanesulfonic acid) buffer
at pH 7. Negative controls containing 2.5% (v/v) glutaraldehyde-killed EAO1 at
maximum cell density (106 cells/ml) and uninoculated media were also monitored for
abiotic iron oxidation. A calibration curve (R2≥0.9950) using Autotrophic media (at pH
2.0) as standard solutions and reagent/sample blank (basal salts only at pH 2.0) were
prepared and monitored for each time point. Ferrous iron concentration was measured

40
spectrophotometrically (562 nm) after complexation with ferrozine reagent within 2
hours of sampling/calibration preparation.
Pyrite dissolution (oxidation) was assessed by reducing the total soluble iron that
was present with 0.1 M hydroxylamine hydrochloride in 0.1 M HCl for 10 seconds prior
to combining sample with ferrozine/HEPES, as described above. Additional standards
were prepared as follows: calibration curve using FeCl3 in 0.5 M hydrochloric acid; 0.5
M HCl reagent blank; and negative control of unreduced 25 M FeCl3. Ferric iron
concentrations were calculated as the difference between total soluble iron and ferrous
iron.
Sulfur and tetrathionate oxidation
Sulfobacillus isolates (JAO1, JWO19m, JWO20m, JWO21m, JWO22m) ,
Acidimicrobium isolates (EAO1, 2 and 4), and A. ferrooxidans ICPT were assessed for
their ability to oxidize sulfur and tetrathionate. Inocula were prepared by culturing
Sulfobacillus isolates in Sulfur/YE media and Acidimicrobium in Heterotrophic medium.
Both genera were sub-cultured to either Sulfur media (with and without 0.01% YE),
Tetrathionate (with and without 0.01% YE), and YE media (0.01% YE). Additionally,
Acidimicrobium strains were inoculated into Heterotrophic medium, Heterotrophic
medium adjusted to 0.01% YE (heterotrophic), and Sulfur/YE/trace Fe medium (0.036
mM FeSO4). Evidence of sulfur oxidation to sulfate was determined by measuring culture
pH. The pH of uninoculated controls was also monitored to control for abiotic
acidification.
41
CHAPTER 3: RESULTS
Isolation, Identification and Naming of Alicyclobacillus and Sulfobacillus Isolates
Twenty isolates were obtained from plated samples of Winogradsky enrichments
or from BSL site A spread plates (Table 2). No isolates were obtained from serial
extinction dilutions. Eleven isolates were obtained from the FeSO4 Winogradsky
enrichments, eight of which (JWO10, JWO11, JW012, JWO13, JWO16m, JWO17m,
JWO18m, and JWO19m) were obtained from columns incubated at room temperature by a
sunny window, and 3 isolates (JWO20m, JWO21m, JWO22m) were obtained from
columns incubated at 45˚C in the dark. Regardless of enrichment incubation temperature,
all isolates obtained from FeSO4 Winogradsky enrichments were obtained by sub-
culturing enrichment onto FeSo at 50˚C for 5-10 days. Seven of the isolates were
obtained from microaerobic incubations (JWO16m - JWO22m) while the others were
obtained from aerobic incubations (JWO10, JWO11, JWO12, and JWO13). All isolates
from the FeSO4 Winogradsky enrichments produced round ‘fried egg’ colony
morphologies. The ‘fried egg’ colonies appeared as dark orange growth in the center of
the colony surrounded by white growth (Fig. 5a). The cell morphology of these isolates
ranged from thick (0.5-0.8 µm thick) single/paired rods to filamentous (not shown). All
the above-described Winogradsky isolates produced spherical terminal endospores (not
shown).
The two isolates (JWW6 and JWO15) obtained from ferric citrate Winogradsky
enrichments were from columns that were incubated aerobically at room temperature by a

42
sunny window. Isolate JWW6 was obtained by sub-culturing onto WAYE at 50˚C for 3-5
days. JWW6 produced round white colonies consisting of single and paired rods (~0.5µm
thick) with oval terminal endospores. Isolate JWO15 was sub-cultured onto FeSo at 50˚C
for 5-10 days. JWO15 produced round ‘fried egg’ colonies comprised of motile single
and filamentous rods (not shown) with spherical terminal endospores.
Seven isolates (JAO1, JAO2, JAO3, JAO4, JAW5, JAW7, and JAW8) were
obtained from direct plating of BSL samples onto FeSo solid media with aerobic
incubation at 50˚C for 3-5 days. Isolates JAO1-4 produced either ‘fried egg’ or round
orange colony morphologies containing cells as single, paired, or filamentous rods with
spherical terminal endospores. Single rods were about 0.5-0.8µm in diameter, and the
length was 1.6µm and longer (Fig. 6a). Isolates JAW5, JAW7, and JAW8 produced
white/off-white colonies. JAW5 and JAW7 produce similar white, defined margin
colonies consisting of single, paired or short chains of rod-shaped cells (~0.8µm thick)
(not shown). JAW8 produces irregular flat off/white colonies, and cells consistently
appear as slightly longer chains than JAW5 and JAW7 (Fig 6b). All three JAW isolates
produce oval endospores at the terminal end (not shown).
SSU rRNA genes from isolates JAO1 - JAW8 were amplified with
U341F/U1406R, and those from JWO10 - 15 and JWO16m - JWO22m were amplified
using 8F/690R and 515F/1525R and used to generate a single contig that corresponded to
the near-complete 16S rRNA gene. Sequence analyses identified 16 isolates as
Sulfobacillus acidophilus (BLAST ID 99%) and 4 as Alicyclobacillus tolerans or
Alicyclobacillus sp. DSM 6481 (99%) (Table 2). The sixteen isolates closely related to S.
43
acidophilus all produced orange ‘fried egg’ colony morphologies. All isolates closely
related to Alicyclobacillus sp. produced white colonies. All twenty isolates were Gram
stained and appeared Gram variable or Gram positive (1000X oil immersion microscopy)
(Fig. 6a, b).
Each isolate obtained was identified by a four digit code that describes isolation
source and morphology XXX#. The first letter signifies isolation attempts by Jennifer
Hampton (J). The second letter indicates the source of isolation such as BSL site A (A) or
Winogradsky enrichment (W). The third letter describes the color of the colony
morphology as orange (O) or white (W). The number at the end is the numerical order
that the isolates were obtained for the attempted isolation series. The ‘m’ subscript
identifies organisms that were isolated under microaerobic conditions.
Isolation, Identification and Naming of Acidimicrobium Isolates
At the time of sampling, BSL site A water was 50.8˚C and pH 2.37. Three EAO
strains were isolated at 45˚C from a combination of serial extinction dilutions and streak
plates derived from enrichments in 1% pyrite or Autotrophic medium (Table 2). After
~14 days, both enrichments were turbid and yellow, indicating iron oxidation. EAO1 and
EAO4 were obtained from dilutions of 1% pyrite enrichment streaked onto FeSo and
FeSo, respectively. Enrichment cultures contained numerous thin (diameter <0.5 µm)
rods of varying length that lacked endospores. When enrichments were sub-cultured on
ferrous sulfate plates for 6-14 days, no single colonies were observed. Instead, dark

44
orange smears that contained cells of similar morphology to those observed in previous
enrichments were found (Fig. 5b).
EAO2 was obtained from Autotrophic liquid medium enrichment (1/5000) sub-
cultured onto FeSo plates. The enrichment contained mobile thin (< 0.5 µm diameter),
short and filamentous rods devoid of endospores (Fig. 6c). Plate growth after 6-14 days
incubation also appeared as bright orange smears instead of single colonies, and the
smears contained similar cell morphologies as were observed in the enrichment. Orange
smears from EAO1, EAO2 and EAO4 were positive for Acidimicrobium when screened
by PCR with AmcF/AmcR primers (Table 1).
No growth was observed after two rounds of serial extinction dilutions from either
medium type. Although there was growth in Heterotrophic 50˚C enrichments (containing
various sized rods), I was unable to obtain growth on plates after subculturing. We also
inoculated activated carbon plates that were prepared the same as FeSo and FeSo, but
contained 2% charcoal in both layers. We postulated that the addition of charcoal may
enhance selection of iron-oxidizing autotrophs by adsorbing inhibitory metabolites (e.g.
organic acids) produced during autotrophic growth. Activated carbon plates produced
comet shaped growth smears but could not be further sub-cultured. In addition to EAO1,
EAO2, and EAO4, thirteen other “isolates” were followed. These other thirteen isolates
varied in colony morphologies from round translucent/white to yellow streaks/comets.
Since these isolates were negative for amplification with Acidimicrobium specific 16S
rRNA primers AmcF/AmcR, we discontinued working with them.

45
SSU rRNA genes of EAO isolates were amplified using both primer sets
U341F/U1406R (~1100nt) and AmcF/AmcR (450nt) (Table 1). The 16S rRNA short
sequence amplified by the AmcF/AmcR primer set aligns in the middle of the longer
sequence amplified by the universal primer set over the 313-737 bp region. Analysis of
sequences from both primer sets for EAO1, EAO2, and EAO4 showed 99% 16S rRNA
gene sequence identity to Acidimicrobium sp. Y0018, A. ferrooxidans ICPT, and to each
other over the entire length analyzed (Table 2). Acidimicrobium sp. Y0018 is a phylotype
previously identified in SSU rRNA libraries prepared from BSL derived DNA (117).
Each isolate was identified by a four digit code that describes isolation source and
morphology XXX#. The first letter represents the isolation method of either enrichment
(E) or spread plating (P). The second letter indicates the source of isolation such as BSL
site A (A). The third letter describes the color of the colony morphology as orange (O) or
white (W). The number at the end is the numerical order that the isolates were obtained
for the attempted isolation series.

46
Table 2. 16S rRNA gene sequence analysis, isolation conditions, and morphology of isolates. Identity of isolates was determined by BLAST analysis of near-complete 16S rRNA genes over 1100 nta or 1500 ntb (4). Colony morphologies were observed during single colony isolation onto FeSo (Acidimicrobium/Sulfobacillus) or 1X PTYG (Alicyclobacillus). All isolates are rods and size was measured from images taken by electron microscopy (EM) or phase contrast (PC). Production of endospores was indicated as either absent (-) or present (+) as spherical endospores (s), oval endospores (o), and position of spore on the terminal end (t). Gram stain results were either positive (+), negative (-) or variable (v). Additional abbreviations include; room temperature (RT), extinction dilutions (ED), and not determined (ND).
Isolate Most related organisms %Sequence similarity
Enrichment/Isolation conditions (dilution) Colony morphology
Cell morphology (diameter µm)
Produce endospores
Gram stain
EAO1 Acidimicrobium sp. Y0018, A. ferrooxidans ICPT
99a 1% pyrite enrichment 45˚C/ 1st series ED (10-1), FeSo 45˚C
Orange smears Single, paired, filamentous (0.3-0.4 EM)
- +
EAO2 Acidimicrobium sp. Y0018, A. ferrooxidans ICPT
99a Autotrophic enrichment 45˚C/ FeSo 45˚C
Orange smears Single, paired, filamentous (0.3-0.4 EM)
- +
EAO4 Acidimicrobium sp. Y0018, A. ferrooxidans ICPT
99a 1% pyrite enrichment 45˚C/ 1st series ED (10-1), FeSo 45˚C
Orange smears Single, paired, filamentous (0.3-0.4 EM)
- +
JAO1 Sulfobacillus acidophilus 99a FeSo 50˚C Round fried egg Single, paired (0.8 PC)
+(s/t) +/v
JAO2 Sulfobacillus acidophilus 99a FeSo 50˚C Round orange Single, paired (0.5 EM)
+(s/t) ND
JAO3 Sulfobacillus acidophilus 99a FeSo 50˚C Round fried egg Paired +(s/t) ND
JAO4 Sulfobacillus acidophilus 99a FeSo 50˚C Round fried egg Filamentous +(s/t) +/v
JAW5 Alicyclobacillus tolerans 99a FeSo 50˚C Round white Single, paired, short chained (0.8 PC)
+(o/t) v
JWW6 Alicyclobacillus sp. DSM 6481
99a Winogradsky Ferric Citrate RT/ WAYE 50˚C
Round white Singe, paired (0.8 PC)
+(o/t) v

47
(Table 2 continued)
JAW7 Alicyclobacillus tolerans 99a FeSo 50˚C Round off-white Single, paired (0.8 PC)
+(o/t) v
JAW8 Alicyclobacillus tolerans 99a FeSo 50˚C Irregular flat white Chains (0.8 PC) +(o/t) v
JWO10 Sulfobacillus acidophilus 99b Winogradsky FeSO4 RT/ FeSo 50˚C
Round fried egg Filamentous +(s/t) ND
JWO11 Sulfobacillus acidophilus 99b Winogradsky FeSO4 RT/ FeSo 50˚C
Round fried egg Filamentous +(s/t) ND
JWO12 Sulfobacillus acidophilus 99b Winogradsky FeSO4 RT/ FeSo 50˚C
Round fried egg Filamentous +(s/t) ND
JWO13 Sulfobacillus acidophilus 99b Winogradsky FeSO4 RT/ FeSo 50˚C
Round fried egg Single, paired, filamentous (0.5-0.8 PC)
+(s/t) +/v
JWO15 Sulfobacillus acidophilus 99b Winogradsky Ferric Citrate RT/ FeSo 50˚C
Round fried egg Filamentous +(s/t) ND
JWO16m Sulfobacillus acidophilus 99b Winogradsky FeSO4 RT/ FeSo 50˚C
Round fried egg Single, paired (0.5-0.8 PC)
+(s/t) +/v
JWO17m Sulfobacillus acidophilus 99b Winogradsky FeSO4 RT/ FeSo 50˚C
Round fried egg Paired, filamentous (0.5-0.8 PC)
+(s/t) +/v
JWO18m Sulfobacillus acidophilus 99b Winogradsky FeSO4 RT/ FeSo 50˚C
Round fried egg Single, paired (0.5-0.8 PC)
+(s/t) +/v
JWO19m Sulfobacillus acidophilus 99b Winogradsky FeSO4 RT/ FeSo 50˚C
Round fried egg Single, paired (0.5-0.8 PC)
+(s/t) +/v
JWO20m Sulfobacillus acidophilus 99b Winogradsky FeSO4 45˚C/ FeSo 50˚C
Round fried egg Single, paired (0.5-0.8 PC)
+(s/t) +/v
JWO21m Sulfobacillus acidophilus 99b Winogradsky FeSO4 45˚C/ FeSo 50˚C
Round fried egg Single, paired (0.5-0.8 PC)
+(s/t) +/v
JWO22m Sulfobacillus acidophilus 99 b Winogradsky FeSO4 45˚C/ FeSo 50˚C
Round fried egg Single, paired (0.5-0.8 PC)
+(s/t) +/v
48
a)
Figure 5. Comparison of colony morphology between Sulfobacillus and Acidimicrobium isolates. Sulfobacillus JWO18m (a) as well as all other Sulfobacillus isolates readily produces single colonies with a ‘fried egg’ morphology when cultured on FeSo plates. On the contrary, Acidimicrobium EAO isolates, represented by EAO2 (b), have difficulty forming single colonies and instead produce flat orange “smears” when streaked onto FeSo plates. The orange pigment is indicative of iron-oxidizing bacteria in which the ferrous iron present in the agar is oxidized to ferric iron and precipitated onto the agar’s surface.
a) b)

49
Figure 6. Gram stained photographs of representative Sulfobacillus isolates (a), Alicyclobacillus isolates (b), and Acidimicrobium isolates (c) and A. ferrooxidans ICPT (d) viewed by 1000X light microscopy. Sulfobacillus and Acidimicrobium isolates/type strain were grown on FeSo plates at 50˚C for 2-4 days. Alicyclobacillus isolates were grown on 1X PTYG pH 2.9 at 50˚C for 2 days. All Sulfobacillus isolates (not shown) had similar cell morphologies to JAO1. Alicyclobacillus isolates (not shown) are similar to JAW8. Acidimicrobium EAO isolates have similar morphologies to EAO2. Small gray circles found on all images are dust particles on microscope (i.e. when mechanical stage is moved, spots remain). Size bar = 5µm.
b) Alicyclobacillus JAW8
c) Acidimicrobium EAO2
d) A. ferrooxidans ICPT
a) Sulfobacillus JAO1
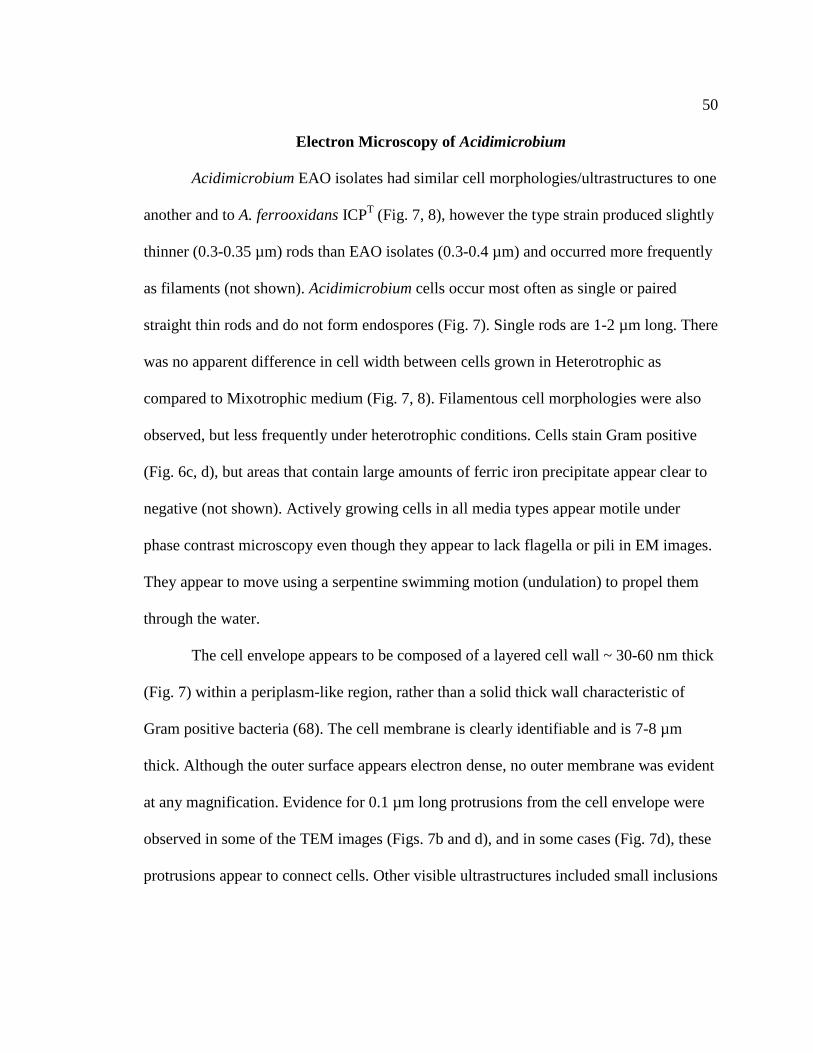
50
Electron Microscopy of Acidimicrobium
Acidimicrobium EAO isolates had similar cell morphologies/ultrastructures to one
another and to A. ferrooxidans ICPT (Fig. 7, 8), however the type strain produced slightly
thinner (0.3-0.35 µm) rods than EAO isolates (0.3-0.4 µm) and occurred more frequently
as filaments (not shown). Acidimicrobium cells occur most often as single or paired
straight thin rods and do not form endospores (Fig. 7). Single rods are 1-2 µm long. There
was no apparent difference in cell width between cells grown in Heterotrophic as
compared to Mixotrophic medium (Fig. 7, 8). Filamentous cell morphologies were also
observed, but less frequently under heterotrophic conditions. Cells stain Gram positive
(Fig. 6c, d), but areas that contain large amounts of ferric iron precipitate appear clear to
negative (not shown). Actively growing cells in all media types appear motile under
phase contrast microscopy even though they appear to lack flagella or pili in EM images.
They appear to move using a serpentine swimming motion (undulation) to propel them
through the water.
The cell envelope appears to be composed of a layered cell wall ~ 30-60 nm thick
(Fig. 7) within a periplasm-like region, rather than a solid thick wall characteristic of
Gram positive bacteria (68). The cell membrane is clearly identifiable and is 7-8 µm
thick. Although the outer surface appears electron dense, no outer membrane was evident
at any magnification. Evidence for 0.1 µm long protrusions from the cell envelope were
observed in some of the TEM images (Figs. 7b and d), and in some cases (Fig. 7d), these
protrusions appear to connect cells. Other visible ultrastructures included small inclusions

51
(~80 nm diameter), ribosomes, nucleoid region and a single large inclusion (~150 nm
diameter) or poly-β-hydroxybutyrate (PHB) granule. Mesosome artifacts were not
observed. Although the fixative was at pH 7.0, no evidence of lysis during fixation was
evident in EM images.
In scanning and transmission electron micrographs of Acidimicrobium EAO1, 2, 4
and A. ferrooxidans ICPT, large quantities of unknown particulates were observed (SEM
images Fig. 7a, 8a, TEM images not shown). These particulates range from 50-100 nm
in diameter and occur singly or aggregated. Characterized by thick dark surfaces, these
particulates resemble nanoparticles such as iron oxides or carbon filaments (77).
However, the hollow or lighter interior is not characteristic of oxides. These particulates
also appear as phase dense under phase contrast microscopy in both Heterotrophic and
Mixotrophic media (not shown).

52
c)
P R
M
N
I
W 0.5µm
Figure 7. Electron micrographs of Acidimicrobium EAO4 in Heterotrophic medium. Individual cells are 0.3-0.4 µm thick and 1-2 µm long and occur as (a) single, paired, or filamentous rods. The cell wall (W) is 30-60 nm thick with layering (c) and protrusions indicated by arrow (b and d). Visible ultrastructures are shown in (c); bilayer membrane (M), ribosomes (R), inclusions (I), nucleoid region (N), and potential single large poly-β-hydroxybutyrate (P) (or other type of ) inclusion granule. Similar structures were seen in other EAO isolates and ICPT strain. White arrow in image (a) shows unidentified nanoparticles present in media. Scale of each image is represented by length of size bars in microns.
0.1µm
b)
d)
0.5µm
1.0µm
a)

53
Figure 8. Cell morphology comparison of Acidimicrobium EAO2 (left) and A. ferrooxidans ICPT (right) in Mixotrophic medium. EAO2 (a, c) has a slightly thicker diameter of 0.4 µm than the type strain at 0.35 µm. Cells in Mixotrophic and Heterotrophic medium have similar thickness. However, filamentous cells are more frequent in Mixotrophic medium. Results for EAO2 are similar for all EAO isolates (not shown). White arrow in image (a) shows unidentified nanoparticles present in media. SEM micrographs (a, b) contain 1.0 µm size bars and TEM micrographs (c, d) have 0.5 µm size bars.
b)
d)
a) b)
c)

54
Physiological Characterization of Isolates
Determination of temperature and pH range and optima
Growth experiments. Most Sulfobacillus isolates grew at 45-50˚C (Fig. 9a),
while three (JAO1, JWO16m, and JWO20m) were able to grow up to 60˚C (Fig. 9b), and
JWO22m was able to grow as low as 35˚C (Fig. 9c). The minimum pH for most
Sulfobacillus isolates was 2.0 (Fig. 10a), however JWO21m was capable of growth at pH
1.0 (Fig. 10b). Half of the isolates (JWO16m-21m) showed a distinct optimal pH of 2.0.
The other half (JAO1, JAO2, JWO12, JWO13, JWO18m, and JWO22m) had an optimal
pH between 2.0 and 3.0 (i.e. pH 2.5) (Fig. 10c). Collectively, Sulfobacillus isolates
obtained in this study were observed to grow in Heterotrophic medium from 35-60˚C and
pH 1-5, with an optimum of ~50˚C and pH 2.0-2.5. The optimal doubling time for all
Sulfobacillus isolates ranged from 3-7 hrs and maximum cell densities in Heterotrophic
medium were 5.20x10⁵-8.08x10⁶ cells/ml. Growth results for Sulfobacillus isolates are
summarized in Table 3.
Each Alicyclobacillus isolate had a unique physiology with respect to temperature
and pH preferences. Alicyclobacillus tolerans isolates JAW8 and JAW7 had a similar
permissible temperature range for growth (30-50°C) (Fig. 11a), but had different pH
ranges and optima. JAW8 had a narrower pH range (3.0-4.0) and lower optimum (pH
3.0) than JAW7 (range 2.0-4.0; optimum pH 4.0) (Fig. 12a, b). Alicyclobacillus sp.
JWW6 had the highest permissible temperature range for growth of 45-60°C (Fig. 11b).

55
JWW6 was also the only Alicyclobacillus isolate to have a permissible growth pH of 5.0
(range 3-5) (Fig. 12c). There was no notable difference in growth rates and yields at pH
3.0 and pH 4.0. The maximum cell densities at 50°C and either pH 3.0 or 4.0 were
7.71x10⁷ cells/ml or 8.44x10⁷ cells/ml, respectively. The doubling time of 0.8 hr was the
same at both pH values. The temperature and pH range for JAW5 were more restrictive
than was observed for other strains, with growth only occurring at 45-50°C (Fig. 11c),
pH 3.0 (Fig. 12d).
As a group, the permissible growth temperature and pH ranges of Alicyclobacillus
in 1X PTYG medium were 30-60˚C and 2.0-5.0, respectively. Alicyclobacillus isolates
had a higher pH optimum (pH 3.0-4.0) than the other two genera, but maintained a
similar optimum temperature (~50˚C). Alicyclobacillus isolates reached the highest cell
densities (range of 2.46 x10⁷-8.44x10⁷ cells/ml) and maintained the fastest doubling time
(range of 0.8-2.2 hrs) compared to the two other genera examined in this study. Growth
results for Alicyclobacillus isolates are summarized in Table 3.
All Acidimicrobium isolates obtained in this study isolates displayed a narrow
permissible temperature range for growth of 45-50˚C (Fig. 13a). EAO2 and EAO4 were
capable of growth in pH 2.0-4.0 (Fig. 14a), while EAO1 was capable of growth from pH
2.0-5.0 (not shown). The optimal temperature and pH for all EAO isolates were 50˚C and
pH 2.0. Optimal doubling times in Heterotrophic medium for EAO isolates ranged from
6.3-7.3 hrs and maximum cell densities ranged 3.24x10⁶-3.32x10⁶ cells/ml (Table 3).

56
Compared to the EAO isolates, A. ferrooxidans ICPT type strain had a wider
permissible temperature range for growth (30-50˚C) and similar pH range 2.0-4.0 (Fig.
13 and 14). Optimal temperature and pH were 45-50˚C and pH 2.0. The type strain had
an average doubling time ~6 hrs and reached 10X higher cell densities (avg. 4x10⁷
cells/ml) than all the EAO isolates obtained in this study. However, maximum cell
densities at pH 2.0 and 3.0 may have been even higher since growth curves were not
followed into stationary phase (Fig. 14b). Growth results are summarized in Table 3.

57
1.00E+03
1.00E+04
1.00E+05
1.00E+06
0 10 20 30 40 50 60 70 80
cells
/ m
l
time/hrs
time (hr)
a) JAO2
1.00E+03
1.00E+04
1.00E+05
1.00E+06
1.00E+07
0 20 40 60 80 100 120
cells
/ m
l
time (hr)
b) JWO20m
20°C30°C35°C45°C50°C60°C70°C
1.00E+03
1.00E+04
1.00E+05
1.00E+06
0 10 20 30 40 50 60 70 80
cells
/ m
l
time/hrs
time (hr)
c) JWO22m Figure 9. Three patterns of temperature growth for Sulfobacillus isolates represented by JAO2 (a), JWO20m (b), and JWO22m (c). Duplicates of each isolate were grown in Heterotrophic medium at pH 2.0, across a range of incubation temperatures. The average cell density at each time point was plotted. All Sulfobacillus isolates were able to grow at 45-50˚C and optimally at 50˚C. Temperature growth curves of JWO12, JWO13, JWO17m, JWO18m, JWO19m, and JWO21m were similar to JAO2. Three isolates (JAO1, JWO16m and JWO20m), represented by JWO20m, were able to grow at 60˚C. JWO22m was the only Sulfobacillus isolate capable of growing at 35˚C. Lines are only shown for conditions that were permissive for growth. Error bars represent standard error.
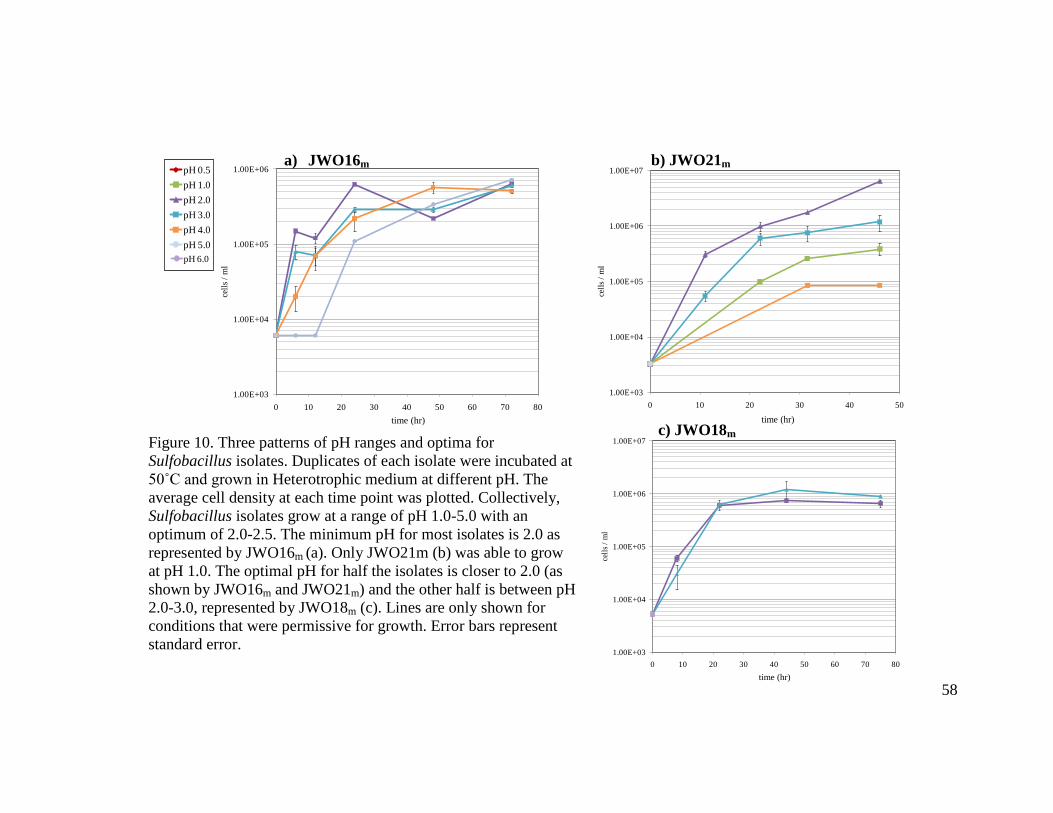
58
1.00E+03
1.00E+04
1.00E+05
1.00E+06
1.00E+07
0 10 20 30 40 50
cells
/ m
l
time / hr
time (hr)
b) JWO21m
1.00E+03
1.00E+04
1.00E+05
1.00E+06
0 10 20 30 40 50 60 70 80
cells
/ m
l
time/hr
time (hr)
a) JWO16m
1.00E+03
1.00E+04
1.00E+05
1.00E+06
1.00E+07
0 10 20 30 40 50 60 70 80
cells
/ m
l
time / hr
time (hr)
c) JWO18m
Figure 10. Three patterns of pH ranges and optima for Sulfobacillus isolates. Duplicates of each isolate were incubated at 50˚C and grown in Heterotrophic medium at different pH. The average cell density at each time point was plotted. Collectively, Sulfobacillus isolates grow at a range of pH 1.0-5.0 with an optimum of 2.0-2.5. The minimum pH for most isolates is 2.0 as represented by JWO16m (a). Only JWO21m (b) was able to grow at pH 1.0. The optimal pH for half the isolates is closer to 2.0 (as shown by JWO16m and JWO21m) and the other half is between pH 2.0-3.0, represented by JWO18m (c). Lines are only shown for conditions that were permissive for growth. Error bars represent standard error.
pH 0.5pH 1.0pH 2.0pH 3.0pH 4.0pH 5.0
pH 6.0

59
1.00E+04
1.00E+05
1.00E+06
1.00E+07
1.00E+08
0 20 40 60 80 100
cells
/ m
l
time/hr
20˚C30°C35°C45°C50°C60°C70°C
time (hr)
a) JAW8
1.00E+03
1.00E+04
1.00E+05
1.00E+06
1.00E+07
1.00E+08
0 5 10 15 20 25 30 35 40 45
cells
/ m
l
time/hr
time (hr)
b) JWW6
1.00E+03
1.00E+04
1.00E+05
1.00E+06
1.00E+07
1.00E+08
0 5 10 15 20 25
cells
/ m
l
time/hr
time (hr)
c) JAW5
Figure 11. Three patterns for permissible temperature range of growth for Alicyclobacillus isolates. Duplicates were grown in 1X PTYG medium at pH 3.0 with varying incubation temperatures. All Alicyclobacillus isolates had an optimum temperature for growth of 50°C, but had different permissible temperature ranges of growth. Isolate JAW8 (a) and JAW7 (not shown) had the widest temperature range of 30-50°C. Isolate JWW6 had the hottest temperature range 45-60°C (b). The narrowest temperature range (45-50°C) was observed for JAW5 (c). Results from direct cell counts and optical density readings (not shown) yielded similar results, but optical density measurements required incubation periods twice as long as direct counts. Lines are only shown for conditions that were permissive for growth. Error bars represent standard error.
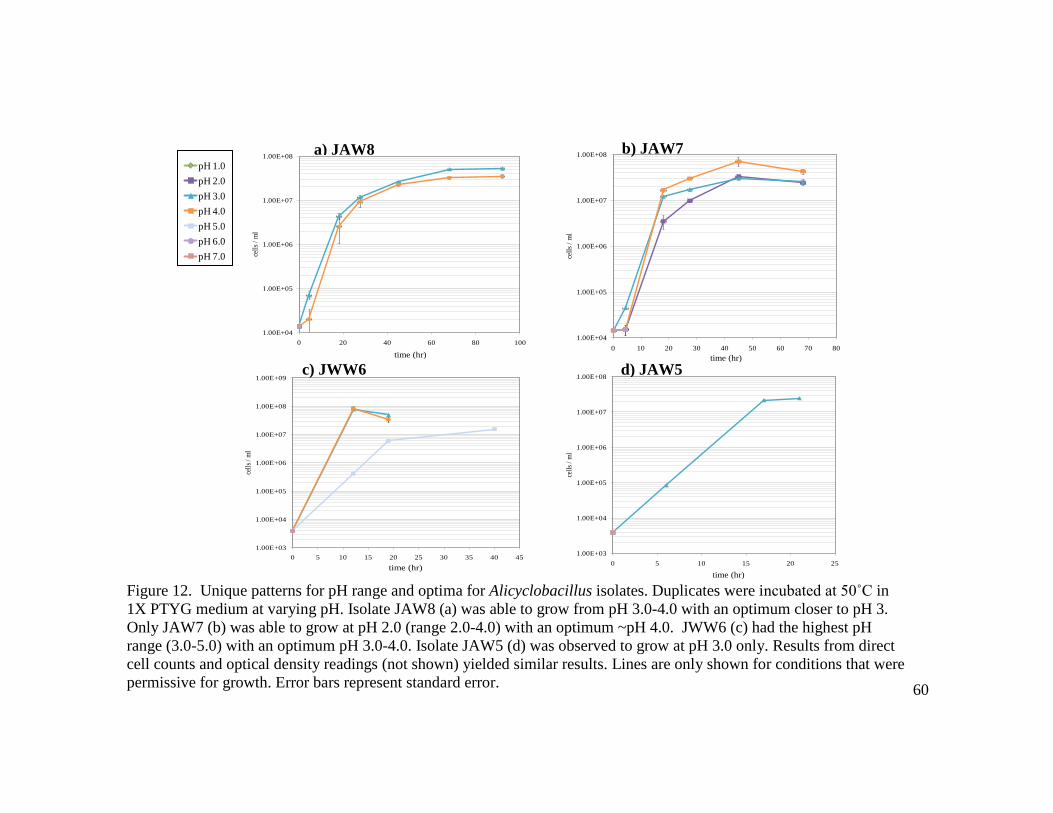
60
Figure 12. Unique patterns for pH range and optima for Alicyclobacillus isolates. Duplicates were incubated at 50˚C in 1X PTYG medium at varying pH. Isolate JAW8 (a) was able to grow from pH 3.0-4.0 with an optimum closer to pH 3. Only JAW7 (b) was able to grow at pH 2.0 (range 2.0-4.0) with an optimum ~pH 4.0. JWW6 (c) had the highest pH range (3.0-5.0) with an optimum pH 3.0-4.0. Isolate JAW5 (d) was observed to grow at pH 3.0 only. Results from direct cell counts and optical density readings (not shown) yielded similar results. Lines are only shown for conditions that were permissive for growth. Error bars represent standard error.
pH 1.0pH 2.0pH 3.0pH 4.0pH 5.0pH 6.0pH 7.0
1.00E+04
1.00E+05
1.00E+06
1.00E+07
1.00E+08
0 10 20 30 40 50 60 70 80
cells
/ m
l
time/hr
time (hr)
b) JAW7
1.00E+04
1.00E+05
1.00E+06
1.00E+07
1.00E+08
0 20 40 60 80 100
cells
/ m
l
time / hr
time (hr)
a) JAW8
1.00E+03
1.00E+04
1.00E+05
1.00E+06
1.00E+07
1.00E+08
0 5 10 15 20 25ce
lls /
ml
time/hr
time (hr)
d) JAW5
1.00E+03
1.00E+04
1.00E+05
1.00E+06
1.00E+07
1.00E+08
1.00E+09
0 5 10 15 20 25 30 35 40 45
cells
/ ml
time/hr
time (hr)
c) JWW6
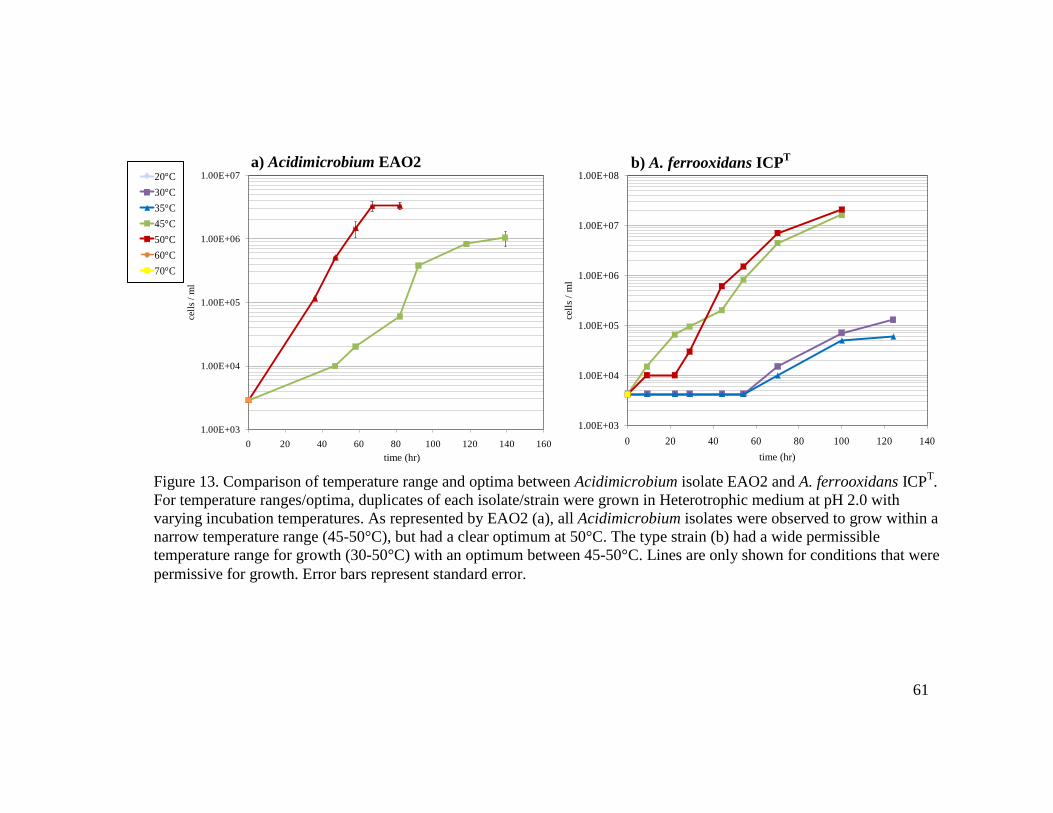
61
1.00E+03
1.00E+04
1.00E+05
1.00E+06
1.00E+07
0 20 40 60 80 100 120 140 160
cells
/ m
l
time/hr
time (hr)
a) Acidimicrobium EAO2
1.00E+03
1.00E+04
1.00E+05
1.00E+06
1.00E+07
1.00E+08
0 20 40 60 80 100 120 140
cells
/ m
l
time/hr
time (hr)
b) A. ferrooxidans ICPT
20°C30°C35°C45°C50°C60°C70°C
Figure 13. Comparison of temperature range and optima between Acidimicrobium isolate EAO2 and A. ferrooxidans ICPT. For temperature ranges/optima, duplicates of each isolate/strain were grown in Heterotrophic medium at pH 2.0 with varying incubation temperatures. As represented by EAO2 (a), all Acidimicrobium isolates were observed to grow within a narrow temperature range (45-50°C), but had a clear optimum at 50°C. The type strain (b) had a wide permissible temperature range for growth (30-50°C) with an optimum between 45-50°C. Lines are only shown for conditions that were permissive for growth. Error bars represent standard error.

62
Figure 14. Comparison of pH range and optima between Acidimicrobium isolate EAO2 and A. ferrooxidans ICPT. For pH range/optima, duplicates were incubated at 45˚C (type strain) or 50°C (EAO isolates) with varying media pH. The pH range for EAO2 (a), EAO4 (not shown), and ICPT type strain (b) was 2.0-4.0 with an optimum at pH 2.0. Isolate EAO1 (not shown) had a slightly wider pH range of 2.0-5.0. Lines are only shown for conditions that were permissive for growth. Error bars represent standard error.
1.00E+03
1.00E+04
1.00E+05
1.00E+06
1.00E+07
0 20 40 60 80 100
cells
/ m
l
time/hr
pH 1.0
pH 2.0
pH 3.0
pH 4.0
pH 5.0
pH 6.0
time (hr)
a) Acidimicrobium EAO2
1.00E+03
1.00E+04
1.00E+05
1.00E+06
1.00E+07
1.00E+08
0 20 40 60 80 100 120 140 160 180
cells
/ m
l
time/hr
time (hr)
b) A. ferrooxidans ICPT

63
Table 3. Summary of temperature and pH ranges and optima for Acidimicrobium, Sulfobacillus, and Alicyclobacillus isolates. Each organism was inoculated, in duplicate, into media at different pH while incubated at a constant temperature and into media at a constant pH while incubated across a range of temperatures (see Methods). Ranges indicate minimum and maximum temperatures/pH that growth was observed (average of duplicates). Doubling time is the measure of time required for the cell population to double during exponential phase (see Methods). Temperature and pH conditions that contain both the fastest doubling time and highest maximum yield (cells/ml) are the optimal (opt.) growth conditions.
Organism Temperature range ˚C (opt.) pH range (opt.)
Opt. doubling time (~hr)
Maximum cells/ml (at pH/°C)
A. ferrooxidans ICPT 30-50 (45-50) 2.0-4.0 (~2.0) 6.5 2.06 x 10⁷ (2/50)
Acidimicrobium sp. EAO1 45-50 (~50) 2.0-5.0 (~2.0) 6.3 3.24 x 10⁶ (2/50)
Acidimicrobium sp. EAO2 45-50 (~50) 2.0-4.0 (~2.0) 6.4 3.32 x 10⁶ (2/50)
Acidimicrobium sp. EAO4 45-50 (~50) 2.0-4.0 (~2.0) 7.3 3.31 x 10⁶ (2/50)
S. acidophilus JAO1 45-60 (50-60) 2.0-5.0 (2.0-3.0) 3.8 1.37 x 10⁶ (2/60)
S. acidophilus JAO2 45-50 (~50) 2.0-5.0 (2.0-3.0) 3.8 1.07 x 10⁶ (3/50)
S. acidophilus JWO12 45-50 (~50) 2.0-5.0 (2.0-3.0) 3.8 7.10 x 10⁵ (3/50)
S. acidophilus JWO13 45-50 (~50) 2.0-4.0 (2.0-3.0) 2.1 5.20 x 10⁵ (2/50)
S. acidophilus JWO16m 45-60 (~50) 2.0-5.0 (~2.0) 3.6 6.30 x 10⁵ (2/50)
S. acidophilus JWO17m 45-50 (~50) 2.0-3.0 (~2.0) 2.6 7.55 x 10⁶ (2/50)
S. acidophilus JWO18m 45-50 (~50) 2.0-3.0 (~3.0) 3.2 1.20 x 10⁶ (3/50)
S. acidophilus JWO19m 45-50 (~50) 2.0-3.0 (~2.0) 3.1 4.63 x 10⁶ (2/50)
S. acidophilus JWO20m 45-60 (~50) 2.0-3.0 (~2.0) 2.6 1.45 x 10⁶ (2/60)
S. acidophilus JWO21m 45-50 (~50) 1.0-4.0 (~2.0) 3.2 8.08 x 10⁶ (2/50)
S. acidophilus JWO22m 35-50 (~50) 2.0-5.0 (2.0-3.0) 4.4 9.45 x 10⁵ (2/50)
Alicyclobacillus tolerans JAW5 45-50 (~50) 3.0 1.4 2.46 x 10⁷ (3/50)
Alicyclobacillus sp. JWW6 45-60 (~50)` 3.0-5.0 (3.0-4.0) 0.8 8.44 x 10⁷ (4/50)
Alicyclobacillus tolerans JAW7 30-50 (~50) 2.0-4.0 (~4.0) 2.2 7.00 x 10⁷ (4/50)
Alicyclobacillus tolerans JAW8 30-50 (~50) 3.0-4.0 (~3.0) 1.9 5.25 x 10⁷ (3/50)

64
Linear regression modeling of pH and temperature data. After graphing the
division rate (generations/time) (z) for each growth experiment, it was clear that the
maximum rate for most of the Sulfobacillus strains occurred at 50˚C and pH 2.0, and
response values decreased in both the temperature (x) and pH (y) directions. This
curvature could only be described using higher order polynomial terms. A new data set
was constructed that included generations/time, pH, and temperature, as well as the actual
values of pH and temperature when raised to the 2nd, 3rd and 4th powers (i.e. x, x2, x 3, x
4, y, y2,y3,y4). While these exponentiated values contain little interpretable biological
information, they are important in terms of providing the numerical information
necessary for fitting the models.
To determine whether strain is an important predictor of growth rate, only
utilizing the observations for Sulfobacillus, we tested 47 different linear models with
every different combination of predictors (x, x2, x 3, x 4, y, y2, y3, y4, and strain). While we
tested for interaction between ‘strain’ and each x and y (at each power), the lack of full
replication prevented testing for interaction between temperature and pH. Experimental
treatments were limited and did not include all possible temperatures and pH values.
Treatments only included a temperature range of 30, 35, 40, 50, 60, 70°C at a constant
pH of 2.0 and a pH range of 1.0, 2.0, 3.0, 4.0, 5.0, 6.0, 7.0 at a constant temperature of
50°C. AICc scores pointed to 4 best-fit models that included 99% of the cumulative
weight (Table 4), and only differed by whether to include a third or fourth order ‘x’ or ‘y’
variable. Neither of these included strain as a predictor. Diagnostics on the top model
were checked by residual plots, and they were generally all agreeable, with the exception

65
of one observation (growth at pH 1.0) that was exerting extreme leverage. The R2 for
the top model was 0.6219, indicating a reasonably good fit, given the number of
parameters included in the model.
The addition of strain to a model added at least 11 parameters and several more when
accounting for interactions of strain and pH/temperature. AIC penalizes for the addition
of parameters, thus inclusion of strain may have been penalized in the AICc score. We
attempted to reduce the number of parameters by grouping the strains into six
physiological similar groups (Table 5). We then retested all the models with ‘strain’ as
well as ‘group’ replacing strain. After ranking the models, the top two were the same as
before, while the third model did contain group as a single categorical predictor (Table
6). However, the inclusion of group only raised the log-likelihood value from 91.017 to
91.0374 and increased the delta AICc by close to 2, indicating that ‘group’ was an
uninformative pseudo-variable. Therefore, only pH and temperature were indicated as
variables most likely to affect growth rate of Sulfobacillus strains. With these data we
cannot distinguish different permissible growth ranges for pH and temperature among our
Sulfobacillus isolates.
When we ranked models for growth data of Acidimicrobium strains (including
ICPT) in addition to the Sulfobacillus strain data discussed above, the top 16 models
included species as a predictor with 100% cumulative weight (Table 7).

66
Table 4. AICc of the top linear regression models of division rate (generations/time) according to pH, temperature, and strain of Sulfobacillus isolates. Parameters include the average growth rate of duplicates incubated at 50˚C with varying pH (1.0-6.0) and incubated across a temperature range of 30-60˚C at pH 2.0. Data for Sulfobacillus isolates JAO1, JAO2, JWO12, JWO13, JWO16m, JWO17m, JWO18m, JWO19m, JWO20m, JWO22m were used in this study. Variables ‘x’ and ‘y’ refer to temperature and pH values tested for division rate ‘z’. Model* No. of
parameters Log-likelihood
AICc Delta AICc
Akaike weight
Cumulative weight
lm(z~x+x2+x3+x4+y+y2+y3,data=polymic) 9 91.017 -160.983 0 0.536 0.536 lm(z~x+x2+x3+x4+y+y2+y3+y4,data=polymic) 10 91.7117 -159.63 1.3528 0.2725 0.8086 lm(z~x+x2+x3+y+y2+y3,data=polymic) 8 88.164 -157.928 3.0552 0.1163 0.9249 lm(z~x+x2+x3+y+y2+y3+y4,data=polymic) 9 89.0502 -157.05 3.9337 0.075 0.9999 lm(z~x+x2+x3+y+y2,data=polymic) 7 79.2242 -142.612 18.3708 0.0001 1 lm(z~x+x2+x3+y,data=polymic) 6 77.1392 -140.924 20.0597 0 1 lm(z~x+x2+x3+x4+y+y2+y3+strain,data=polymic) 19 96.4441 -139.378 21.6052 0 1

67
Table 5. Sulfobacillus isolate sub-groups organized by common temperature and pH ranges/optima. All isolates were grown in Heterotrophic medium held at pH 2.0 for temperature experiments and incubated at 50˚C for pH experiments. Group Sulfobacillus sp. isolates pH range (optimum) Temperature (˚C) 1 JAO1, JWO16m 2-5 (2-3) 45-60; opt. ~50 2 JAO2, JWO12, JWO13 2-4 (2-3) 45-50; opt. ~50 3 JWO17m, JWO18m, JWO19m 2-3 (2) 45-50; opt. ~50 4 JWO20m 2-3 (2) 45-60; opt. ~50 5 JWO21m 1-4 (2) 45-50; opt. ~50 6 JWO22m 2-5 (2-3) 35-50; opt. 50
Table 6. AICc of the top linear regression models of growth rate (generations/time) according to pH, temperature, strain, and/or sub-groups of Sulfobacillus sp. isolates. Parameters include the average growth rate of duplicates incubated at 50˚C with varying pH (1.0-6.0) and incubated across a temperature range of 30-60˚C at pH 2.0. Data for Sulfobacillus isolates JAO1, JAO2, JWO12, JWO13, JWO16m, JWO17m, JWO18m, JWO19m, JWO20m, JWO22m were used in this study. ‘Group’ refers to 6 sub-groups of common physiology from the 10 isolates tested (Table 5). Variables ‘x’ and ‘y’ refer to temperature and pH values tested for growth rate ‘z’.
Model* No. of parameters
Log-likelihood
AICc Delta AICc
Akaike weight
Cumulative weight
lm(z~x+x2+x3+x4+y+y2+y3,data=polymic11) 9 91.017 -160.983 0 0.2945 0.2945 lm(z~x+x2+x3+x4+y+y2+y3+y4,data=polymic11) 10 91.7117 -159.63 1.3528 0.1498 0.4443 lm(z~x+x2+x3+x4+y+y2+y3+group,data=polymic11) 10 91.0374 -158.282 2.7015 0.0763 0.5206 lm(z~x+x2+x3+y+y2+y3,data=polymic11) 8 88.164 -157.928 3.0552 0.0639 0.5845 lm(z~x+x2+x3+y+y2+y3+group+group:x,data=polymic11) 10 90.8571 -157.921 3.0622 0.0637 0.6482 lm(z~x+x2+x3+y+y2+y3+group+group:x+group:y+group:x2,data= polymic11)
12 93.6861 -157.801 3.1825 0.0600 0.7082

68
Table 7. AICc of the linear regression models of growth rate (generations/time) according to pH, temperature, and species of Acidimicrobium and Sulfobacillus. Parameters include the average growth rate of duplicates incubated at 50˚C with varying pH (1.0-6.0) and incubated across a temperature range of 30-60˚C at pH 2.0. Species of Sulfobacillus included isolates JAO1, JAO2, JWO12, JWO13, JWO16m, JWO17m, JWO18m, JWO19m, JWO20m, and JWO22m. ‘Species’ of Acidimicrobium included EAO1, EAO2, EAO4, and A. ferrooxidans ICPT. Variables ‘x’ and ‘y’ refer to temperature and pH values tested.
Model Equation No. of parameters
Log-likelihood AICc
Delta AICc
Akaike weight
Cumulative weight
lm(z~x+x2+x3+x4+y+y2+y3+y4+species+species:y+species:x,data=polymic11) 13 125.8514 -220.913 0 0.3864 0.3864
lm(z~x+x2+x3+x4+y+y2+y3+y4+species+species:y+species:x+species:x2,data=polymic11) 14 126.327 -219.054 1.8593 0.1525 0.539
lm(z~x+x2+x3+y+y2+y3+species+species:x+species:y,data=polymic11) 11 121.8007 -218.217 2.6964 0.1004 0.6393 lm(z~x+x2+x3+x4+y+y2+y3+species,data=polymic11) 10 120.2585 -217.732 3.1811 0.0788 0.7181 lm(z~x+x2+x3+x4+y+y2+y3+y4+species+species:x,data=polymic11) 12 122.3777 -216.703 4.2099 0.0471 0.7652 lm(z~x+x2+x3+x4+y+y2+y3+y4+species+species:y+species:x+species:x2+species:y2,data=polymic11) 15 126.3956 -216.305 4.6086 0.0386 0.8038
lm(z~x+x2+x3+y+y2+y3+species+species:x+species:y+species:x2,data=polymic11) 12 122.1433 -216.235 4.6788 0.0372 0.841
lm(z~x+x2+x3+y+y2+y3+species+species:x+species:y+species:y2,data=polymic11) 12 121.8452 -215.638 5.275 0.0276 0.8687
lm(z~x+x2+x3+x4+y+y2+y3+y4+species+species:y,data=polymic11) 12 121.7834 -215.515 5.3985 0.026 0.8947 lm(z~x+x2+x3+x4+y+y2+y3+y4+species,data=polymic11) 11 120.402 -215.419 5.4939 0.0248 0.9194 lm(z~x+x2+x3+x4+y+y2+y3+y4+species,data=polymic11) 11 120.402 -215.419 5.4939 0.0248 0.9442 lm(z~x+x2+x3+y+y2+y3+species+species:x,data=polymic11) 10 118.7697 -214.755 6.1586 0.0178 0.962 lm(z~x+x2+x3+y+y2+y3+species+species:y,data=polymic11) 10 118.6017 -214.419 6.4946 0.015 0.977 lm(z~x+x2+x3+y+y2+y3+species,data=polymic11) 9 117.2926 -214.335 6.5781 0.0144 0.9914 lm(z~x+x2+x3+y+y2+y3+y4+species,data=polymic11) 10 117.5678 -212.351 8.5626 0.0053 0.9968 lm(z~x+x2+x3+y+y2+y3+species+species:x+species:y+species:y2+species:x2+species:y3+species:x3,data=polymic11) 15 123.914 -211.342 9.5718 0.0032 1.0000

69
Evaluation of iron and pyrite as potential energy sources
For A. ferrooxidans ICPT, growth rates and max cell densities in Autotrophic
medium increased with increasing iron concentrations (up to 50 mM) when grown with a
filter-sterilized air headspace (Fig. 15a). Cultures grown in 50 mM FeSO4 with a CO2
enhanced headspace had a slightly higher growth rate and yield when compared to
growth in the lower iron concentrations (Fig. 15b), but differences in yield and rates were
less pronounced (than for air-grown cultures), and the results for growth in 25 mM FeSO4
were somewhat anomalous with apparent yield decreasing after 48 hrs. Iron
concentrations ≤10mM had similar growth rates/max yields whether grown in headspace
of enhanced CO2 or air.
Conversely, EAO1 and EAO4 isolates cultured in Autotrophic medium with
either air- or CO2- enhanced atmosphere rarely reached 105 cells/ml (Fig. 15c, d) (EAO2
not tested). Moreover, similar or greater yields were obtained in the inoculated negative
control (containing no iron) for both EAO1 and EAO4 air-cultures and EAO4 CO2-
cultures than in tubes with iron. No growth was observed for the inoculated (no iron)
control for EAO1 CO2-cultures (not shown). Therefore, autotrophic growth of EAO1 and
EAO4 was not observed for cultures regardless of the headspace gas composition, or iron
concentration.
All Acidimicrobium strains examined in Mixotrophic media (i.e. containing yeast
extract) had significantly greater growth rates and reached a maximum density of at least
two orders of magnitude higher than was observed in Autotrophic media (Compare Figs.

70
15 and 16). To determine the minimum concentration of YE required for optimal growth,
we compared growth of EAO1 in Mixotrophic medium with varying YE concentrations
of 0%, 0.01%, 0.02%, and 0.025% (not shown). There was no difference between growth
rates and maximum cell yields for 0.01%-0.025% YE. Therefore we used the lowest
yeast extract (0.01%) concentration conducive for growth for all other mixotrophic
studies.
The highest yields (~107cells/ml) of A. ferrooxidans type strain ICPT were
observed in Mixotrophic and Heterotrophic medium (Fig. 16a). Collectively, cultures
grown in 1-50 mM FeSO4 Mixotrophic medium had faster doubling times (~4.4 hrs) than
when grown in the same medium lacking iron (doubling time 12.5 hrs). The type strain
had minimum to no growth (yields ≤1x10⁵ cells/ml) in Pyrite/YE medium, Mixotrophic
media without YE, or the negative control without YE or iron.
EAO1 grew the fastest (doubling time of 4.2 hrs) and reached the highest cell
densities (~107 cells/ml) when grown with 1-10 mM FeSO4 in Mixotrophic and
Heterotrophic medium (Fig. 16b). The next fastest doubling times were ~4.8hrs, 5.3hrs,
and 5.7hrs for 25-50 mM Mixotrophic, Mixotrophic without iron media, and 1%
Pyrite/YE medium, respectively. Growth in all three media reached similar yields of
5x10⁶ cells/ml. Minimal to no growth (yields ≤1x10⁵ cells/ml) was observed in
Mixotrophic medium without YE, or the negative control without YE and iron. Optimal
growth of EAO isolates in terms of yield and doubling time occurred in Mixotrophic
media at 0.036-10 mM FeSO4/0.01%YE.
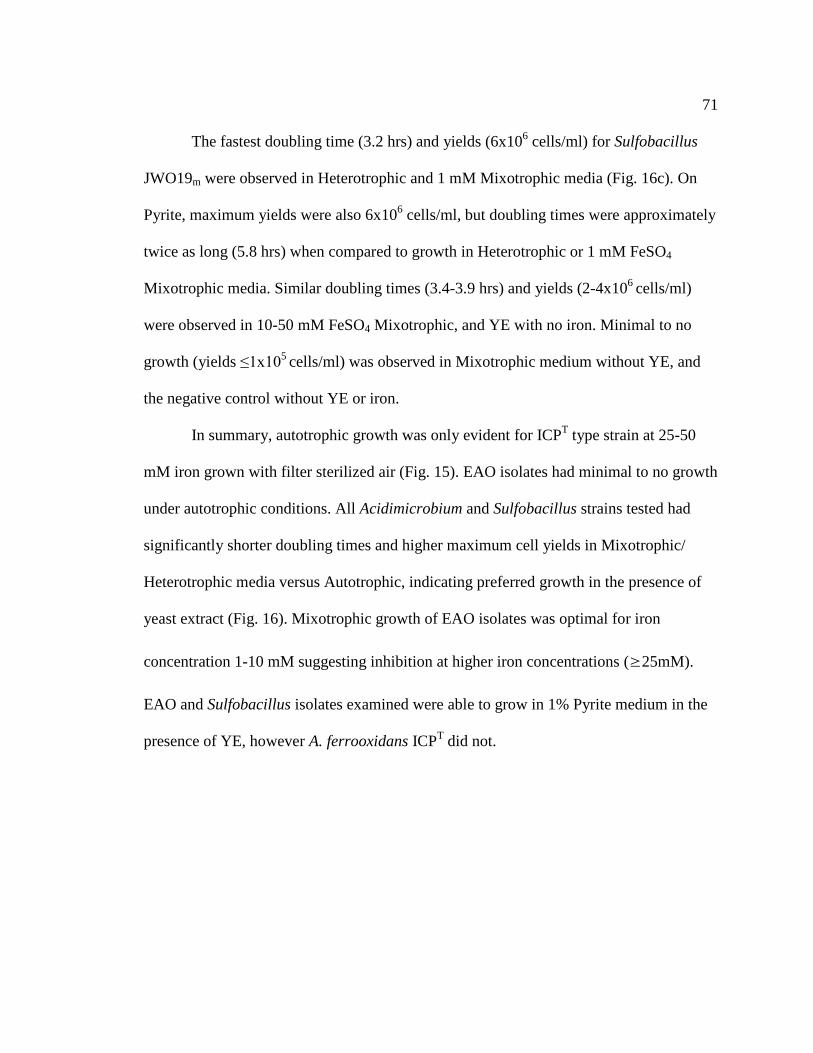
71
The fastest doubling time (3.2 hrs) and yields (6x10⁶ cells/ml) for Sulfobacillus
JWO19m were observed in Heterotrophic and 1 mM Mixotrophic media (Fig. 16c). On
Pyrite, maximum yields were also 6x10⁶ cells/ml, but doubling times were approximately
twice as long (5.8 hrs) when compared to growth in Heterotrophic or 1 mM FeSO4
Mixotrophic media. Similar doubling times (3.4-3.9 hrs) and yields (2-4x10⁶ cells/ml)
were observed in 10-50 mM FeSO4 Mixotrophic, and YE with no iron. Minimal to no
growth (yields ≤1x10⁵ cells/ml) was observed in Mixotrophic medium without YE, and
the negative control without YE or iron.
In summary, autotrophic growth was only evident for ICPT type strain at 25-50
mM iron grown with filter sterilized air (Fig. 15). EAO isolates had minimal to no growth
under autotrophic conditions. All Acidimicrobium and Sulfobacillus strains tested had
significantly shorter doubling times and higher maximum cell yields in Mixotrophic/
Heterotrophic media versus Autotrophic, indicating preferred growth in the presence of
yeast extract (Fig. 16). Mixotrophic growth of EAO isolates was optimal for iron
concentration 1-10 mM suggesting inhibition at higher iron concentrations (≥25mM).
EAO and Sulfobacillus isolates examined were able to grow in 1% Pyrite medium in the
presence of YE, however A. ferrooxidans ICPT did not.

72
Figure 15. Comparison of autotrophic growth at varying iron concentrations, supplemented with either air or enhanced CO2, between A. ferrooxidans ICPT (top) and isolate EAO4 (bottom). Duplicates were grown in Autotrophic medium at varying iron concentrations (mM Fe) and incubated at 45°C. Culture headspaces were replenished with either filter-sterilized air (left) or enhanced CO2 (3-5% v/v) (right) after inoculation and before incubation. Only EAO isolates included a negative control of cultures inoculated into medium with no iron (basal salts only). EAO1 (not shown) had similar results as EAO4. Error bars represent standard error.
1.00E+03
1.00E+04
1.00E+05
1.00E+06
0 20 40 60 80 100 120
cells
/ m
l
time / hr
50 mM Fe
25 mM Fe
10 mM Fe
0.68 M Fe
0.136 mM Fe
time (hr)
a) A. ferrooxidans ICPT w/ air
1.00E+03
1.00E+04
1.00E+05
0 10 20 30 40 50 60 70 80
cells
/ m
l
time / hr
time (hr)
d) EAO4 w/ CO2
1.00E+03
1.00E+04
1.00E+05
0 10 20 30 40 50 60 70 80
cells
/ m
l
time / hr
50 mM Fe25 mM Fe10 mM Fe2 mM Fe0.68 mM Fe0.136 mM Fenegative control
time (hr)
c) EAO4 w/ air
1.00E+03
1.00E+04
1.00E+05
1.00E+06
0 20 40 60 80 100 120
cells
/ m
l
time / hr
time (hr)
b) A. ferrooxidans ICPT w/ CO2

73
Figure 16. Mixotrophic growth comparison of A. ferrooxidans ICPT (a), Acidimicrobium EAO1 (b), and Sulfobacillus JWO19m (c). Duplicates of each organism were inoculated into the following pH 2.0 medium and incubated at 50°C: Mixotrophic at varying iron concentrations (Fe/YE), 1% Pyrite/YE, Heterotrophic (hetero) adjusted to 0.01% YE, Mixotrophic without iron (YE only), Autotrophic adjusted to 10 mM FeSO4 (10 mM Fe only), and Mixotrophic without iron or YE as the negative control. Error bars are standard error.
1.0E+03
1.0E+04
1.0E+05
1.0E+06
1.0E+07
0 10 20 30 40 50
cells
/ m
l
time / hr
time (hr)
c) Sulfobacillus JWO19m
1.0E+03
1.0E+04
1.0E+05
1.0E+06
1.0E+07
0 10 20 30 40 50 60 70 80
cells
/ m
l
time / hr
50 mM Fe/YE25 mM Fe/YE10 mM Fe/YE1 mM Fe/YE1% pyrite/YEheteroYE only10 mM Fe onlynegative control
time (hr)
a) A. ferrooxidans ICPT
1.0E+03
1.0E+04
1.0E+05
1.0E+06
1.0E+07
0 10 20 30 40 50 60 70 80
cells
/ m
l
time / hr
time (hr)
b) Acidimicrobium EAO1
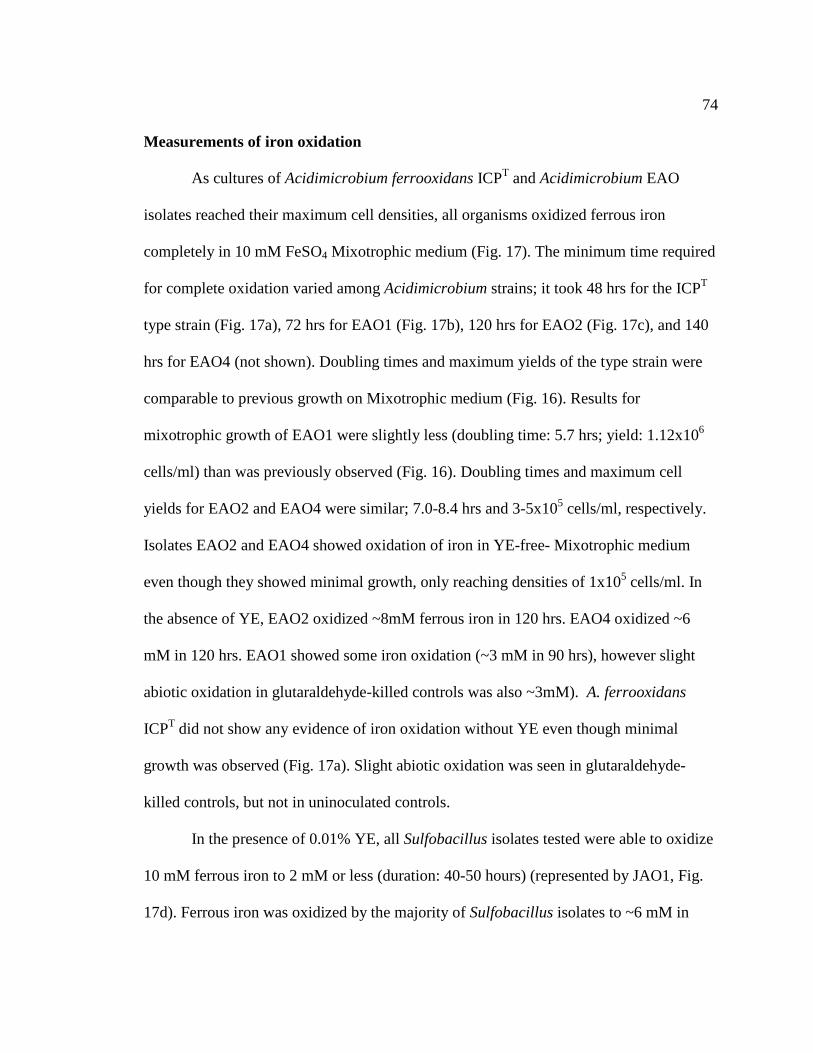
74
Measurements of iron oxidation
As cultures of Acidimicrobium ferrooxidans ICPT and Acidimicrobium EAO
isolates reached their maximum cell densities, all organisms oxidized ferrous iron
completely in 10 mM FeSO4 Mixotrophic medium (Fig. 17). The minimum time required
for complete oxidation varied among Acidimicrobium strains; it took 48 hrs for the ICPT
type strain (Fig. 17a), 72 hrs for EAO1 (Fig. 17b), 120 hrs for EAO2 (Fig. 17c), and 140
hrs for EAO4 (not shown). Doubling times and maximum yields of the type strain were
comparable to previous growth on Mixotrophic medium (Fig. 16). Results for
mixotrophic growth of EAO1 were slightly less (doubling time: 5.7 hrs; yield: 1.12x10⁶
cells/ml) than was previously observed (Fig. 16). Doubling times and maximum cell
yields for EAO2 and EAO4 were similar; 7.0-8.4 hrs and 3-5x10⁵ cells/ml, respectively.
Isolates EAO2 and EAO4 showed oxidation of iron in YE-free- Mixotrophic medium
even though they showed minimal growth, only reaching densities of 1x10⁵ cells/ml. In
the absence of YE, EAO2 oxidized ~8mM ferrous iron in 120 hrs. EAO4 oxidized ~6
mM in 120 hrs. EAO1 showed some iron oxidation (~3 mM in 90 hrs), however slight
abiotic oxidation in glutaraldehyde-killed controls was also ~3mM). A. ferrooxidans
ICPT did not show any evidence of iron oxidation without YE even though minimal
growth was observed (Fig. 17a). Slight abiotic oxidation was seen in glutaraldehyde-
killed controls, but not in uninoculated controls.
In the presence of 0.01% YE, all Sulfobacillus isolates tested were able to oxidize
10 mM ferrous iron to 2 mM or less (duration: 40-50 hours) (represented by JAO1, Fig.
17d). Ferrous iron was oxidized by the majority of Sulfobacillus isolates to ~6 mM in

75
cultures without YE even though no growth was observed. Only JWO19m showed
evidence of some growth in the absence of YE by reaching cell densities slightly above
1x10⁵ cells/ml and oxidized ~7 mM ferrous iron (not shown). Maximum cell densities of
JWO19m were similar to the growth observed in Mixotrophic medium (Fig. 16c). Slight
abiotic iron oxidation was seen in glutaraldehyde-killed controls, but not in uninoculated
controls.
A summary for iron oxidation studies for all isolates tested is found in Table 8.
Pyrite oxidation
At time zero, ~3.5 mM ferrous iron was already present in uninoculated 1% Pyrite
medium (Fig. 18). In the presence of 0.01% YE, all EAO isolates were able to oxidize
this ferrous iron completely by 50-90 hours post inoculation (Fig. 18a). EAO2 and EAO4
had similar faster doubling times (4.8-5.1 hrs) and greater yields (2x10⁷ cells/ml) than
EAO1 (~6 hrs and 5x10⁶ cells/ml) (not shown). Growth rates and maximum cell yields of
EAO1 were similar to growth observed in Pyrite/YE medium (compare Figs. 16b and
18a). Slight oxidation (1-1.5 mM) of ferrous iron was observed in EAO cultures grown
in Pyrite without YE. Maximum cell yields for all EAO isolates in Pyrite without YE was
1x10⁵ cells/ml. A. ferrooxidans ICPT did not grow in Pyrite medium (with or without
yeast) nor did it oxidize iron present in the medium (data not shown).
EAO isolates in Pyrite/YE medium were followed for evidence of pyrite
oxidation by monitoring pyrite dissolution (increase in total soluble iron). At time zero,
there was ~5 mM total soluble iron already present in the Pyrite medium at pH 2.0 (Fig.
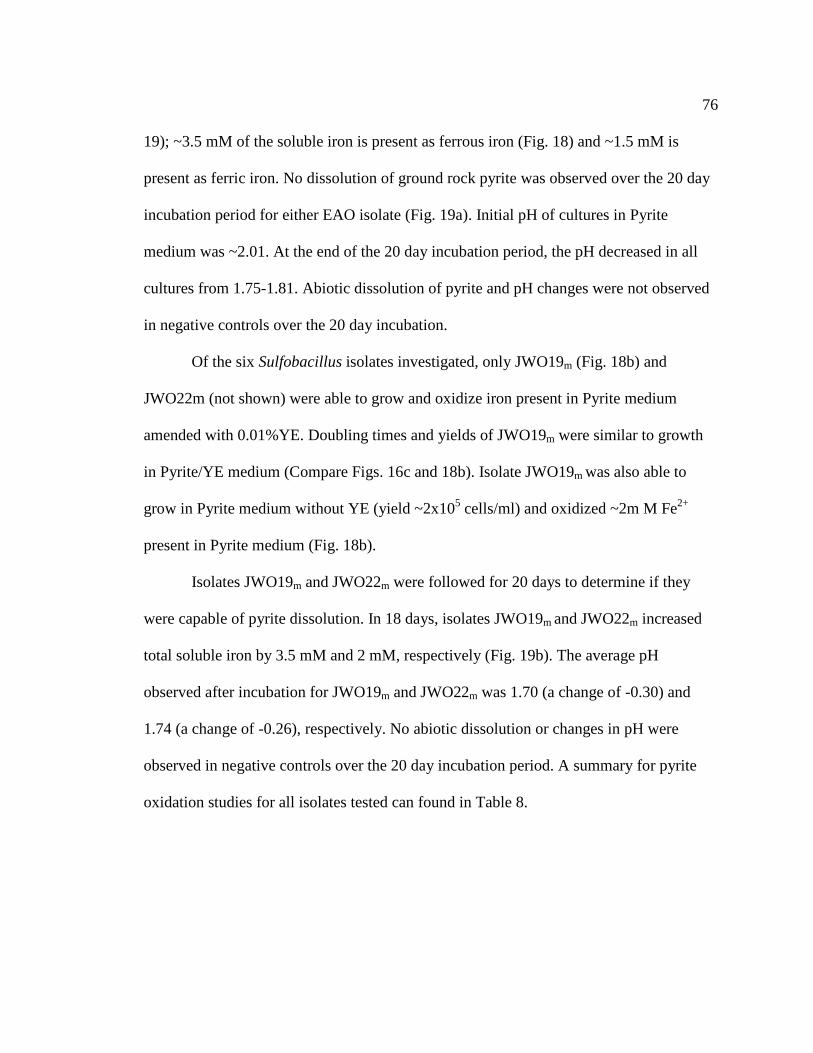
76
19); ~3.5 mM of the soluble iron is present as ferrous iron (Fig. 18) and ~1.5 mM is
present as ferric iron. No dissolution of ground rock pyrite was observed over the 20 day
incubation period for either EAO isolate (Fig. 19a). Initial pH of cultures in Pyrite
medium was ~2.01. At the end of the 20 day incubation period, the pH decreased in all
cultures from 1.75-1.81. Abiotic dissolution of pyrite and pH changes were not observed
in negative controls over the 20 day incubation.
Of the six Sulfobacillus isolates investigated, only JWO19m (Fig. 18b) and
JWO22m (not shown) were able to grow and oxidize iron present in Pyrite medium
amended with 0.01%YE. Doubling times and yields of JWO19m were similar to growth
in Pyrite/YE medium (Compare Figs. 16c and 18b). Isolate JWO19m was also able to
grow in Pyrite medium without YE (yield ~2x10⁵ cells/ml) and oxidized ~2m M Fe2+
present in Pyrite medium (Fig. 18b).
Isolates JWO19m and JWO22m were followed for 20 days to determine if they
were capable of pyrite dissolution. In 18 days, isolates JWO19m and JWO22m increased
total soluble iron by 3.5 mM and 2 mM, respectively (Fig. 19b). The average pH
observed after incubation for JWO19m and JWO22m was 1.70 (a change of -0.30) and
1.74 (a change of -0.26), respectively. No abiotic dissolution or changes in pH were
observed in negative controls over the 20 day incubation period. A summary for pyrite
oxidation studies for all isolates tested can found in Table 8.

77
a) A. ferrooxidans ICPT
0
2
4
6
8
10
12
1.0E+03
1.0E+04
1.0E+05
1.0E+06
1.0E+07
0 10 20 30 40 50
mM
[FeI
I]
cells
/ m
l
time/hr
Fe/YE growth
Fe growth
glut-killed growth
Fe/YE mM [Fe II]
Fe mM [Fe II]
glut-killed mM [Fe II]
uninoculated mM [Fe II]
time (hr)
Figure 17. Comparison of growth and concomitant iron oxidation by Acidimicrobium and Sulfobacillus strains. The average of duplicate samples was plotted over time for A. ferrooxidans ICPT (a), Acidimicrobium EAO1 (b), Acidimicrobium EAO2 (c), and Sulfobacillus JAO1 (d). Acidimicrobium EAO4 had similar results as EAO2, and all Sulfobacillus isolates (with the exception of JWO19m) had similar results as JAO1. Double-Y axis graph shows growth (cells/ml) (left) and concentration of ferrous iron (mM [Fe II]) (right) over time in Mixotrophic medium with 0.01%YE (circle) and without YE (triangle), incubated at 50°C. Growth curves are represented by solid lines and ferrous iron oxidation is represented by dotted lines. Negative controls were glutaraldehyde-killed EAO1/JAO1 (square), and uninoculated Mixotrophic medium (black dashed line). Glutaraldehyde-killed cells were fixed near potential maximum cell densities of ~106 cells/ml for Acidimicrobium (EAO1; a, b, c) and Sulfobacillus (JAO1; d). Regardless of medium type, negative controls had similar results. Slight apparent abiotic oxidation of iron was seen in killed controls but not in uninoculated controls. Error bars represent standard error.
b) Acidimicrobium EAO1
0
2
4
6
8
10
12
1.0E+03
1.0E+04
1.0E+05
1.0E+06
1.0E+07
0 10 20 30 40 50 60 70 80
mM
[Fe
II]
cells
/ m
l
time/hr
time (hr)
c) Acidimicrobium EAO2
0
2
4
6
8
10
12
1.0E+03
1.0E+04
1.0E+05
1.0E+06
1.0E+07
0 20 40 60 80 100 120
mM
[Fe
II]
cells
/ m
l
time/hr
time (hr)
0
2
4
6
8
10
12
1.00E+03
1.00E+04
1.00E+05
1.00E+06
1.00E+07
0 20 40 60 80 100 120
mM
[Fe
II]
cells
/ m
l
time/hr
time (hr)
d) Sulfobacillus JAO1

78
0
2
4
6
8
10
12
14
1.00E+03
1.00E+04
1.00E+05
1.00E+06
1.00E+07
0 20 40 60 80 100 120
mM
[Fe
II]
cells
/ m
l
time / hr
P/YE growth
P growth
glut-killed growth
P/YE mM [Fe II]
P mM [Fe II]
glut-killed mM [Fe II]
uninoculated mM [Fe II]
time (hr)
0
2
4
6
8
10
12
14
1.00E+03
1.00E+04
1.00E+05
1.00E+06
1.00E+07
0 20 40 60 80 100 120
mM
[Fe
II]
cells
/ m
l
time / hr
time (hr)
a) Acidimicrobium EAO4
Figure 18. Comparison of iron oxidation in 1% Pyrite medium by Acidimicrobium EAO4 (a) and Sulfobacillus JWO19m (b). Double-Y axis graph shows growth (cells/ml) (left) and concentration of ferrous iron (mM [Fe II]) (right) over time. Duplicates were grown in 1% Pyrite medium with 0.01%YE (circle) and without 0.01%YE (triangle) and incubated at 50˚C. Growth curves are represented by solid lines, and ferrous iron oxidation is represented by dotted lines. Negative controls were glutaraldehyde-killed EAO1 (a) or JAO1 (b) (square) and uninoculated (black dashed line) in Mixotrophic medium. Glutaraldehyde-killed controls were inoculated at near maximum cell densities. All Acidimicrobium isolates tested have similar growth and iron oxidation results as seen in (a). Only JWO19m and JWO22m were able to grow on 1% Pyrite with 0.01%YE; no other Sulfobacillus isolate grew in either Pyrite medium type. Standard error bars are shown.
b) Sulfobacillus JWO19m
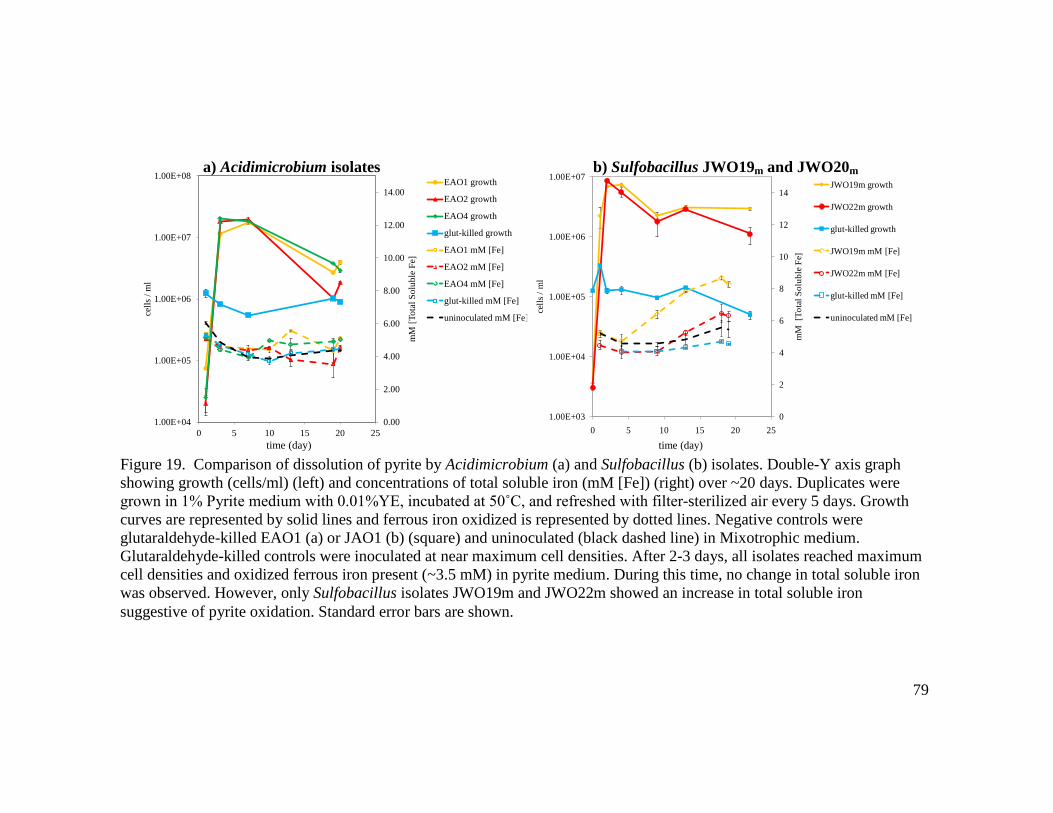
79
Figure 19. Comparison of dissolution of pyrite by Acidimicrobium (a) and Sulfobacillus (b) isolates. Double-Y axis graph showing growth (cells/ml) (left) and concentrations of total soluble iron (mM [Fe]) (right) over ~20 days. Duplicates were grown in 1% Pyrite medium with 0.01%YE, incubated at 50˚C, and refreshed with filter-sterilized air every 5 days. Growth curves are represented by solid lines and ferrous iron oxidized is represented by dotted lines. Negative controls were glutaraldehyde-killed EAO1 (a) or JAO1 (b) (square) and uninoculated (black dashed line) in Mixotrophic medium. Glutaraldehyde-killed controls were inoculated at near maximum cell densities. After 2-3 days, all isolates reached maximum cell densities and oxidized ferrous iron present (~3.5 mM) in pyrite medium. During this time, no change in total soluble iron was observed. However, only Sulfobacillus isolates JWO19m and JWO22m showed an increase in total soluble iron suggestive of pyrite oxidation. Standard error bars are shown.
0.00
2.00
4.00
6.00
8.00
10.00
12.00
14.00
1.00E+04
1.00E+05
1.00E+06
1.00E+07
1.00E+08
0 5 10 15 20 25
mM
[Tot
al S
olub
le F
e]
cells
/ m
l
time / day
EAO1 growth
EAO2 growth
EAO4 growth
glut-killed growth
EAO1 mM [Fe]
EAO2 mM [Fe]
EAO4 mM [Fe]
glut-killed mM [Fe]
uninoculated mM [Fe]
time (day)
a) Acidimicrobium isolates
0
2
4
6
8
10
12
14
1.00E+03
1.00E+04
1.00E+05
1.00E+06
1.00E+07
0 5 10 15 20 25
mM
[To
tal S
olub
le F
e]
cells
/ m
l
time / day
JWO19m growth
JWO22m growth
glut-killed growth
JWO19m mM [Fe]
JWO22m mM [Fe]
glut-killed mM [Fe]
uninoculated mM [Fe]
time (day)
b) Sulfobacillus JWO19m and JWO20m

80
Sulfur and tetrathionate oxidation
In the presence and absence of trace iron (0.036 mM), growth of A. ferrooxidans
ICPT and EAO isolates in Sulfur/YE and Sulfur/YE/trace Fe media resulted in similar
average cell yields ~1x10⁷ cells/ml (Fig. 20). However, there was an initial lag phase of
~22 hr and ~45 hr for EAO cultures in Sulfur/YE and Sulfur/YE/trace Fe, respectively.
No growth was observed for either Acidimicrobium strain in Sulfur medium without YE
(not shown).
There was no difference in doubling time or maximum yields for either strain
between Heterotrophic and Heterotrophic/0.01% YE media. These media only differ in
terms of YE concentrations: Heterotrophic contains 0.025% and Heterotrophic/0.01% YE
contains 0.01%. Strain ICPT had slightly faster doubling times and greater growth yields
in Heterotrophic and Heterotrophic/0.01%YE media than S/YE, S/YE/trace Fe and YE
media (Fig 20a). This suggests that the addition of trace iron did not affect growth of the
type strain in the presence of sulfur. Even though EAO strains had an initial lag phase for
growth in sulfur-containing media, they reached 2X higher cell densities in media
containing sulfur than without (Fig. 20b). The lowest yields for EAO strains occurred in
YE medium at 3x10⁶ cells/ml suggesting that sulfur or trace iron positively affect growth.
The pH of all the cultures reduced slightly over time by ~0.05, however, there was no
difference between pH changes observed in inoculated versus uninoculated tubes.
No growth was observed in Tetrathionate media, with or without YE, for any of
the Acidimicrobium strains (Fig. 20). Moreover, there was no change in culture pH over
the 100-140 day incubation period.

81
All Sulfobacillus isolates had similar growth yields (1-3x10⁶ cells/ml) in
Sulfur/YE media (Fig. 21). Collectively, growth yields in Sulfur media without YE were
very low and ranged from ~5x10⁴-1x10⁵ cells/ml. There was no difference between
maximum yields of isolates JAO1, JWO20m, JWO21m, and JWO22m in Sulfur/YE versus
YE media (Fig. 22a). Only JWO19m had slightly greater yields in Sulfur/YE medium
(3x10⁶ cells/ml) versus YE medium (1x10⁶ cells/ml) (Fig. 21b). There was no change in
culture pH over the 100 day incubation period for any of the isolates tested.
Sulfobacillus isolates JAO1, JWO19 m, JWO20 m, JWO21 m, and JWO22 m did
grow in Tetrathionate/YE (Tet/YE) medium with yields ranging from 5x10⁶-9x10⁶
cells/ml (Fig. 21). With the exception of JAO1, all other Sulfobacillus isolates had
doubling times ~2X slower in Tet/YE versus YE media (Fig. 21b). Since both medium
types contained YE but differed with the presence or absence of tetrathionate, growth of
these cultures was inhibited by tetrathionate. Only JAO1 had similar growth rates and
yields in Tet/YE and YE media (Fig. 21a).
Three isolates JAO1, JWO19m, and JWO22m, were also inoculated into a lower
concentration of tetrathionate (2.5 mM) to see if tetrathionate-mediated growth inhibition
occurred. The two isolates (JWO19m and JWO22m) whose growth was inhibited in
Tet/YE media containing 5 mM Tetrathionate were not inhibited in 2.5 mM Tet/YE
media (Fig. 21b); growth rates and yields in 2.5 mM Tet/YE were similar to YE medium.
For JAO1, no growth was observed in 2.5 mM Tet/YE.
No growth was observed for the majority of Sulfobacillus isolates in Tetrathionate
medium (without YE) at either tetrathionate concentration (Fig. 21). Again, only JAO1
82
showed evidence of growth in 5 mM Tetrathionate medium (without YE), with yields of
3x10⁵ cells/ml (Fig. 21a). There was no change in culture pH of Tetrathionate media
(with or without YE) over the 100 day incubation period for any of the isolates.
A summary of growth in sulfur and tetrathionate results for all genera tested are
found in Table 8.
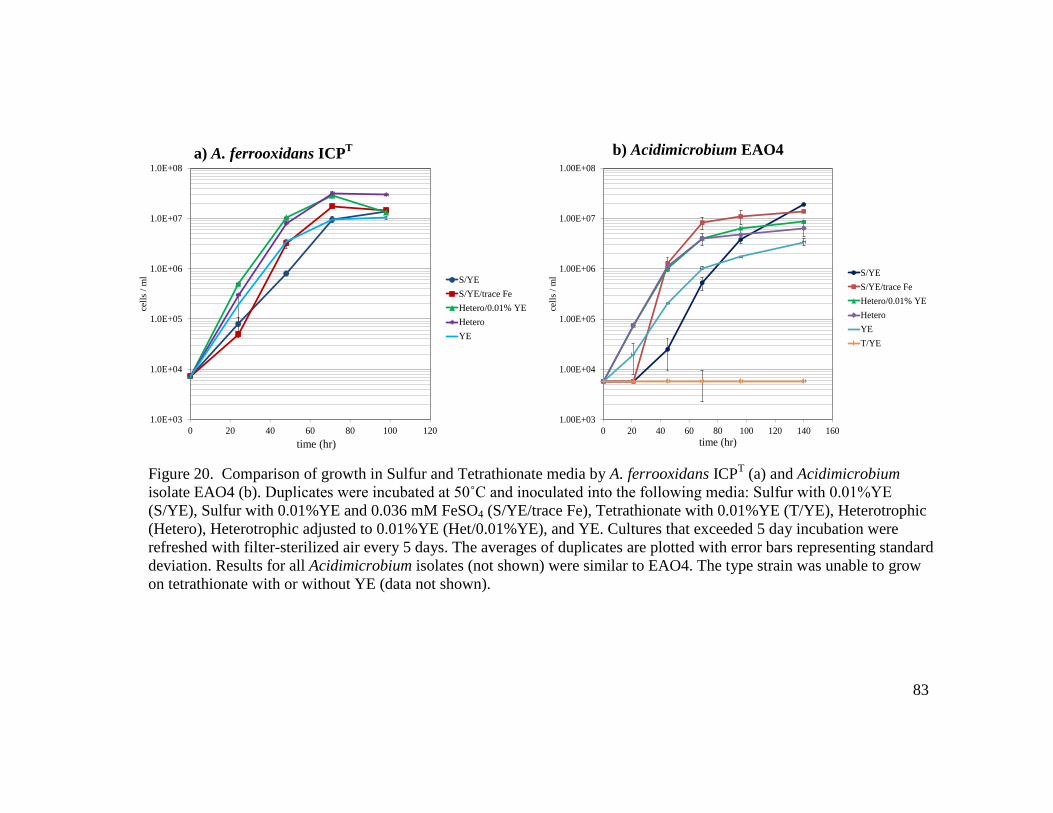
83
Figure 20. Comparison of growth in Sulfur and Tetrathionate media by A. ferrooxidans ICPT (a) and Acidimicrobium isolate EAO4 (b). Duplicates were incubated at 50˚C and inoculated into the following media: Sulfur with 0.01%YE (S/YE), Sulfur with 0.01%YE and 0.036 mM FeSO4 (S/YE/trace Fe), Tetrathionate with 0.01%YE (T/YE), Heterotrophic (Hetero), Heterotrophic adjusted to 0.01%YE (Het/0.01%YE), and YE. Cultures that exceeded 5 day incubation were refreshed with filter-sterilized air every 5 days. The averages of duplicates are plotted with error bars representing standard deviation. Results for all Acidimicrobium isolates (not shown) were similar to EAO4. The type strain was unable to grow on tetrathionate with or without YE (data not shown).
1.0E+03
1.0E+04
1.0E+05
1.0E+06
1.0E+07
1.0E+08
0 20 40 60 80 100 120
cells
/ m
l
time / hr
S/YES/YE/trace FeHetero/0.01% YEHeteroYE
time (hr)
1.00E+03
1.00E+04
1.00E+05
1.00E+06
1.00E+07
1.00E+08
0 20 40 60 80 100 120 140 160
cells
/ m
l
time / hr
S/YES/YE/trace FeHetero/0.01% YEHeteroYET/YE
time (hr)
a) A. ferrooxidans ICPT b) Acidimicrobium EAO4

84
Figure 21. Comparison of growth in Sulfur and Tetrathionate media by Sulfobacillus isolates JAO1 (a) and JWO19m (b). Duplicates were incubated at 50˚C and inoculated into the following media: Sulfur with 0.01%YE (S/YE), Sulfur (S), Tetrathionate (5 mM T), Tetrathionate with 0.01% YE (5 mM T/YE), Tetrathionate adjusted to 2.5 mM (2.5 mM T), Tetrathionate adjusted to 2.5 mM with 0.01% YE (2.5 mM T/YE), and YE. The averages of duplicates are plotted with error bars representing standard error. JAO1 was the only Sulfobacillus isolate able to grow in 5 mM tetrathionate. Results for all other Sulfobacillus isolates were most similar to JWO19m, with a few exceptions (see Results: Sulfur and Tetrathionate Oxidation section). No cells were observed for JWO19m in 2.5mM T medium.
1.00E+03
1.00E+04
1.00E+05
1.00E+06
1.00E+07
0 20 40 60 80 100
cells
/ m
l
time / hr
S/YE
S
5 mM T/YE
5 mM T
2.5 mM T/YE
2.5 mM T
YE
time (hr)
a) Sulfobacillus JAO1
1.00E+03
1.00E+04
1.00E+05
1.00E+06
1.00E+07
0 20 40 60 80
cells
/ m
l
time / hr
time (hr)
b) Sulfobacillus JWO19m

85
Table 8. Summary of iron, pyrite, sulfur and tetrathionate oxidation results for Acidimicrobium and Sulfobacillus. Duplicate tubes, per organism, were inoculated into the following media: Autotrophic adjusted to 10mM FeSO4 (Auto), Mixotrophic (Mixo), 1%Pyrite/0.01%YE (P/YE), 0.5%Sulfur/0.01%YE (S/YE), and 5 mM Tetrathionate/0.01%YE (T/YE) and incubated at 50°C (see Methods). Positive (+) or negative (-) for growth/activity was indicated. Cultures that reached a maximum cell density of 105 cells/ml were referred to as minimal growth (m). Apparent inhibition (I) was also observed for 5 mM T/YE and positive growth at a lower concentration of 2.5 mM was indicated.
*Autotrophic growth of the ICPT type strain was observed at iron concentrations >25 mM and minimal growth at ≤10 mM.
Organism
Growth and Fe2+ oxidation in Auto medium
Growth and Fe2+ oxidation in Mixo medium
Growth in Pyrite/YE and dissolution of pyrite
Growth in S/YE
Growth in 5 mM T/YE
A. ferrooxidans ICPT m*/- +/+ -/- + -
Acidimicrobium sp. EAO1 m/- +/+ +/+ + -
Acidimicrobium sp. EAO2 m/+ +/+ +/+ + -
Acidimicrobium sp. EAO4 m/+ +/+ +/+ + -
S. acidophilus JAO1 m/+ +/+ -/- + + (-2.5 mM)
S. acidophilus JWO13 m/+ +/+ -/- + ND
S. acidophilus JWO19m m/+ +/+ +/+ + I (+2.5 mM)
S. acidophilus JWO20m m/+ +/+ -/- + I
S. acidophilus JWO21m m/+ +/+ -/- + I
S. acidophilus JWO22m m/+ +/+ +/+ + I (+2.5 mM)
86
CHAPTER 4: DISCUSSION
Attempts to Isolate Acidimicrobium from BSL
The purpose of this thesis project was to isolate Acidimicrobium; during these
attempts, we also isolated numerous Sulfobacillus and Alicyclobacillus (Table 2). Both
genera are commonly found alongside Acidimicrobium and are routinely isolated together
(14, 25, 59, 81, 84). Although Sulfobacillus and Alicyclobacillus are rare members of the
BSL community based on molecular surveys (116), they are among the most common
heterotrophic isolates obtained at acidic pH (47). It is often the case that molecular
approaches identify the dominant members of the community while cultivation methods
capture the rare members (100). Similarities and key differences in physiology among
isolates help to explain why certain organisms were easier to cultivate than others.
Spread plating from dilutions of BSL water did not produce Acidimicrobium
isolates which leads me to believe that higher cell densities are required to produce
colonies (i.e. the plating efficiency of this genus never reaches 100%). Sulfobacillus and
Alicyclobacillus strains have been isolated using the spread plate method (Table 2) (47).
Commonly, dilutions of samples are done to prevent overcrowding of cells on plates
because some organisms do not form colonies at high densities or multiple species may
grow together in a single colony leading to erroneous identification of isolates (69).
However, this does not appear to be the case for EAO isolates since the minimum
threshold for growth was ~2x10³cells/ml (not shown). Among bacterial populations, the
“Allee effect” is a common phenomenon in which there is a positive correlation between

87
growth rate and inoculum population density until a maximum threshold is reached that is
unique for each species and set of conditions (2). Populations of bacteria can be induced
to grow by quorum sensing, and this is likely to play a role in threshold densities
permissive for growth of many species.
EAO strain growth on FeSo plates appeared as orange smears instead of single,
isolated colonies (Fig. 6). Since single colonies are presumed to derive from a single cell,
they are the target growth morphology when purifying organisms on solid media. In
previous Acidimicrobium isolation attempts, these smears were discarded since they were
not thought to be a pure culture (Patricia Siering, personal communication). Preference
for single colonies that evinced iron oxidation was often followed, leading to isolation of
Sulfobacillus strains instead of Acidimicrobium. By utilizing a PCR screening method
with Acidimicrobium-specific primers, we were finally able to focus on the most
promising cultures and successfully isolate Acidimicrobium. It is not uncommon for
strains that were previously unable to grow on solid media, to adapt and form colonies on
agar after several attempts (22). For example, during the isolation of Acidimicrobium
strains ICPT and Y0018, difficulty in acquiring single colonies was also observed (24,
57). Single colonies were finally obtained after several weeks of serial cultures in
Autotrophic and Mixotrophic medium for ICPT and Y0018, respectively.
Cultivation of acidophilic organisms onto solid media has long been problematic
(43). Even though the same acidophiles can grow in non-gelled media with similar or
identical components as gelled-media, reproducible growth on gelled-media was often
impossible. In particular, iron oxidizers such as Leptospirillum ferrooxidans were

88
categorized as incapable of growth on solid media until recent advances addressed the
problems inhibiting growth of acidophiles (43, 55, 56). Many gelling agents, including
agar, are polysaccharides that hydrolyze in hot, acidic liquors. Although heat sterilization
of the acidic components and the gelling agents are done separately to help minimize
hydrolysis, hydrolysis of gelling agents continues under incubation temperatures for
acidophilic thermophiles. The polysaccharide backbone structure for agar (and agarose)
is similar, and is composed of galactose residues or charged groups of mostly pyruvic
acid (54). Chemolithotrophic acidophiles are highly sensitive to these soluble organic
acids present in the acidified gelling media, particularly pyruvic acid. At low pH, the
organic acids are mainly undissociated lipophilic acids that can readily pass through
cellular membranes. Once inside the circumneutral cytoplasm of acidophiles, the acids
dissociate and acidify the cytoplasm.
In order to circumvent organic acid toxicity from the hydrolysis of agarose, we
used the overlay technique for isolation (55, 56). Although we achieved “growth” in the
form of smears for EAO isolates, we were unable to obtain single colonies. Thus,
assessing whether a culture is free of contamination is difficult. There are a few reasons
why organisms are unable to grow as single colonies. Although components of un-gelled
and gelled media are similar, it is difficult to control for water availability and gas
concentrations. Plates that are incubated at > 50˚C are placed in sealed plastic containers
in order to reduce moisture loss. However, water loss is apparent as volume of plate
reduces over time and accumulation of water on lid increases. The majority of plate
growth is found underneath the surface of the FeSo (and FeSo) plates instead of on the
89
surface where the ferric iron oxides precipitate. Due to the growth-inhibiting
concentrations of iron in FeSo plates (25 mM), EAO strains may prefer regions of the
plate where iron concentrations (particularly ferric iron) are lowest. By reducing iron
concentrations in FeSo plates (to 1 mM and 10 mM), I have been able to obtain more
repreducible growth of EAO isolates (not shown). In addition, microaerobic conditions
produce more reliable growth of EAO strains. Perhaps microaerobic conditions help
reduce iron oxidation rates by EAOs, thereby allowing the isolates to accumulate on the
surface of plates before the iron oxide precipitates become inhibitory. Although high iron
concentrations are inhibitory, enough iron needs to be present for the orange phenotype to
be visible to aid in preliminary identification of iron oxidizers present in media. For
instance, plates containing 1 mM FeSO4 produce translucent/white smears/tiny colonies
(not shown). Further work will be needed to determine optimal conditions for the
formation of colonies. Purity of samples is currently determined by verifying
homogenous cell morphology in cultures with phase contrast microscopy.
Isolation and physiological characterization of Acidimicrobium
Attempting to isolate Acidimicrobium was a challenging prospect. Even though
Acidimicrobium has been identified molecularly in multiple warm, acidic, mineral
sulfide-rich environments (9, 34, 42, 67, 93), only three strains have been isolated,
including the type strain A. ferrooxidans ICPT. The ICPT type strain was isolated from a
Krísuvík geothermal area in Iceland (24), and a member of the same species, strain TH3,
was isolated from a copper mine leach dump in the U.S. (80). Acidimicrobium spp.

90
Y0018 was isolated from Frying Pan Hot Spring at the outer fringe of the Norris Geyser
area in Yellowstone National Park (57). Unfortunately, water chemistry data from
isolation source sites are scarce. The only information provided was for strain Y0018 (57)
where the authors described all six sample sites as acidic (pH 2.7-3.7) and variable in
temperature (30-83˚C). The only specific reference to source conditions for strain Y0018
was that it was isolated from one of the “cooler sites” that was <70˚C.
Nevertheless, we obtained three isolates EAO1, EAO2, and EAO4 that share 99%
16S rRNA gene sequence identity with Acidimicrobium spp. Y0018, the A. ferrooxidans
type strain ICPT, and to each other (Table 3). These Acidimicrobium isolates also shared
99% 16S rRNA gene sequence identity with the Acidimicrobium phylotype previously
identified as abundant in BSL sites A and D SSU rRNA gene clone libraries (11, 117).
The most effective method for isolation of Acidimicrobium EAO strains was by
enriching at 45˚C in 1% pyrite or in Autotrophic medium, and sub-culturing from
enrichments onto FeSo (single layer or overlay) plates (Table 3). These isolation methods
are consistent with isolation of both Y0018 and ICPT strains that were obtained by
enriching site water samples in 1% pyrite at pH 2.0 (24, 57). The growth morphology of
EAO strains on FeSo plates complicated its isolation since the strains did not form
colonies.
EAO isolates were found to have a narrow permissible range of growth around
45-50˚C, whereas A. ferrooxidans ICPT had a wide range of growth from 30-50˚C (Table
4). Even though the enrichment and isolation temperature was 45˚C, the optimum
temperature for growth of EAO was closer to 50˚C (Fig. 13, Table 3, 4). EAO isolates

91
had significant differences in growth rate between 45˚C and 50˚C. Doubling time at 50˚C
was generally 2-4X greater than at 45˚C. This is not surprising considering that the
optimum temperature for EAO isolates reflects the constant summer temperatures of BSL
at site A (50-55˚C) (116). In addition, the lower isolation temperature may have
contributed to slowing growth rates of other organisms present in enrichments that may
have out-competed Acidimicrobium strains if grown at 50˚C. The A. ferrooxidans ICPT
strain was reported to have an optimum temperature of 48˚C (24), however I did not find
a significant difference between growth rates or maximum cell densities reached between
45˚C and 50˚C. This may explain why authors alternate between the two stated
temperature optima. Even though EAO isolates were unable to grow at 60˚C and above,
presence of Acidimicrobium 16S rRNA phylotypes from site D samples (~85˚C) can be
explained by the convective mixing of BSL (117).
However, considering the narrow permissible temperature range for growth of
EAO isolates, it is surprising that Acidimicrobium isolates are able to survive during
severe temperature drops in the winter. Winter temperatures of 37-45˚C have been
monitored at below the observed minimum for growth of EAO isolates (116, 117).
Acidimicrobium may not be actively growing at these temperatures, but this non-spore-
forming bacterium may be able to tolerate temperatures beyond its limits of growth. A
large number of non-spore-forming bacteria are capable of maintaining cellular structure
and continue significant gene expression under a dormancy state known as viable but
nonculturable (VBNC) (28, 85). The common response of VNBC cells to stress is the
inability to develop into colonies on routine culture media even though cells may remain

92
viable for long periods of time. Although much of the work has focused on Gram
negative bacteria and pathogens, many nonpathogenic and Gram positive bacteria are
capable of entering a VBNC state (85). Cells that enter a VBNC state are induced by a
number of chemical and environmental factors such as nutrient starvation (29) and
incubation outside the normal temperature range of growth (118). Cells undergo a
reduction in size (dwarfing), reduction in nutrient transport, respiration rates, and
macromolecular synthesis (85). During the period of VBNC in Vibrio sp., biosynthesis
continues, ATP levels remain high and novel starvation and cold shock proteins are
formed. In addition, extensive modifications to the cell walls of VBNC cells versus
exponentially growing cells appear to be a hallmark for distinguishing a VBNC state
(104). Rearrangements of cell walls have been observed in both cells of VBNC Gram
positive and Gram negative bacteria (30, 104). It has been suggested that dormancy and
resuscitation from this state could indicate a strategy to test the suitability for growth of
the environment (37). A few resuscitated cells may act as “scouts” and send a quorum
sensing signal to the remaining VBNC cells indicating that the stressful environment is
now permissive for growth. Overall, results for EAO isolates from temperature and pH
growth studies strongly suggest that Acidimicrobium strains are active in BSL. In the
future, we will need to test viability of EAO isolates or ability to enter a VBNC state after
induction at temperatures outside their permissible range of growth.
Acidimicrobium EAO isolates were inhibited by iron concentrations ≥25 mM and
grew optimally at 0.036-10 mM (Fig. 16b); this is surprising given the maximal growth
of A. ferrooxidans ICPT in 50 mM FeSO4. Yet, the lower acceptable range of iron for

93
EAO isolates is consistent with iron concentrations found at BSL (103). Although the
iron concentration in BSL is considered high for a natural environment (~38 ppm; 0.68
mM) (102), the concentration of iron in isolation media Autotrophic (50 mM) and FeSo
plates (25 mM ) was much higher in order to select for iron-oxidizers. Among iron-
oxidizing acidophiles, Sulfobacillus and others have a higher tolerance for the end
product of iron oxidation (i.e. Fe3+) than Acidimicrobium species (25). Researchers
initially pursued isolation of Acidimicrobium-like organisms in order to obtain more
efficient thermophilic, acidophilic iron-oxidizing bacteria for extraction of metals from
materials containing high mineral sulfide concentrations (i.e. biomining) (16, 24, 81, 83).
Such an organism would also have to be capable of tolerating the harsh conditions in
biomining reactors (i.e. high concentration of metals) (24). Lower iron concentrations in
isolation media would select for a wider range of iron-oxidizing phenotypes. For this
reason, researchers may have intentionally selected an unnaturally high iron
concentration for isolation in order to select for strains that could be active members in
the biomining consortia. In order to obtain different species or ecotypes of
Acidimicrobium from BSL in the future, we will need to lower the iron concentrations in
isolation media.
Autotrophic growth using ferrous iron as an energy source was very poor for
EAO isolates, rarely reaching 1x10⁵ cells/ml (Fig. 15c, d). However, unlike A.
ferrooxidans ICPT, EAO isolates did show evidence of iron oxidation at 10 mM FeSO4
(Fig. 18) even though cell yields were minimal. Maximum cell yields of the type strain
were 8X greater at 50 mM FeSO4 than 10 mM (Fig. 15a) in Autotrophic media. In our

94
study, we analyzed autotrophic iron oxidation for the type strain and our isolates at 10
mM FeSO4 whereas the previously reported studies of the type strain used 50 mM (24).
However, 50mM FeSO4 is inhibitory to EAO isolates. If this study were repeated, I
would expect to see evidence of iron oxidation for the type strain at 50 mM FeSO4 given
that cell yields were slightly higher at this iron concentration. Previous studies for uptake
of radiolabeled bicarbonate by ICPT in Autotrophic medium (50 mM FeSO4) suggests
that the type strain is able to fix CO2 from the energy derived from iron oxidation (P.L.
Siering, unpublished).
A. ferrooxidans ICPT appears to require a higher concentration of iron than EAO
isolates to grow autotrophically utilizing iron as an energy source. It is possible that the
EAO isolates may have a higher affinity for iron sequestering than strain ICPT. If strains
of EAO and ICPT were grown in mixed cultures, EAO isolates would prevail in lower
iron concentrations and ICPT strains would dominate in higher iron concentrations.
Alternatively, strain ICPT may have been isolated from an environment that was not as
oligotrophic as BSL. Previous studies often reference A. ferrooxidans as
‘heterotrophically-inclined’ due to the increased cell yields in the presence of organic
carbon or yeast extract (24). A clearer division between autotrophic and heterotrophic
lifestyles of strain ICPT may exist instead of being considered a true mixotroph. In order
to obtain enough energy to fix CO2 and grow autotrophically, strain ICPT may require
higher concentrations of iron. The minimal growth observed could have been a result of
carryover of organic molecules present in sub-cultures, initially inducing some
heterotrophic growth.

95
On the other hand, EAO isolates (specifically EAO2 and EAO4) may truly be
Mixotrophs. Similar to the type strain, EAO1 rapidly oxidizes iron and reaches higher
cell yields than the other EAO isolates in the presence of YE, but was unable to oxidize
iron under autotrophic conditions (Fig. 17b). EAO2 and EAO4 actively oxidize iron both
autotrophically and mixotrophically, with little difference in maximum cell yields
obtained under these different growth conditions (Fig. 18c). There are a few possible
explanations for these observations. First, isolates EAO2 and EAO4 may be oxidizing
iron autotrophically to maintain basal metabolism similar to a VBNC state. Although cell
densities do not increase, energy from iron may continue to drive active proton export to
maintain intracellular positive electron potential for PMF and fix just enough CO2 to
maintain biosynthesis. Second, a small difference in maximum yields in iron-containing
media (with or without yeast extract) may suggest that EAO isolates continue to fix CO2
even in the presence of an additional organic carbon source (e.g. yeast extract). Even
though BSL receives allochthonous inputs of organic carbon, the system remains
oligotrophic. The detection of RuBisCo I from members of Acidimicrobium suggests that
EAO isolates are capable of fixing CO2 in situ. The division between autotrophy and
heterotrophy is blurred because EAO isolates are adapted to continuous oligotrophy. A
previous study of S. acidophilus (strain ALV) found that the mixotroph incorporated 20%
of fixed-CO2 even when glucose was present (119). Yeast extract is a complex ingredient
that contains organic carbon as well as growth factors and vitamins. Alternatively, the
slight enhanced growth in the presence of yeast extract may be due to the other
components present, not solely organic carbon. Since we did not observe an increase in
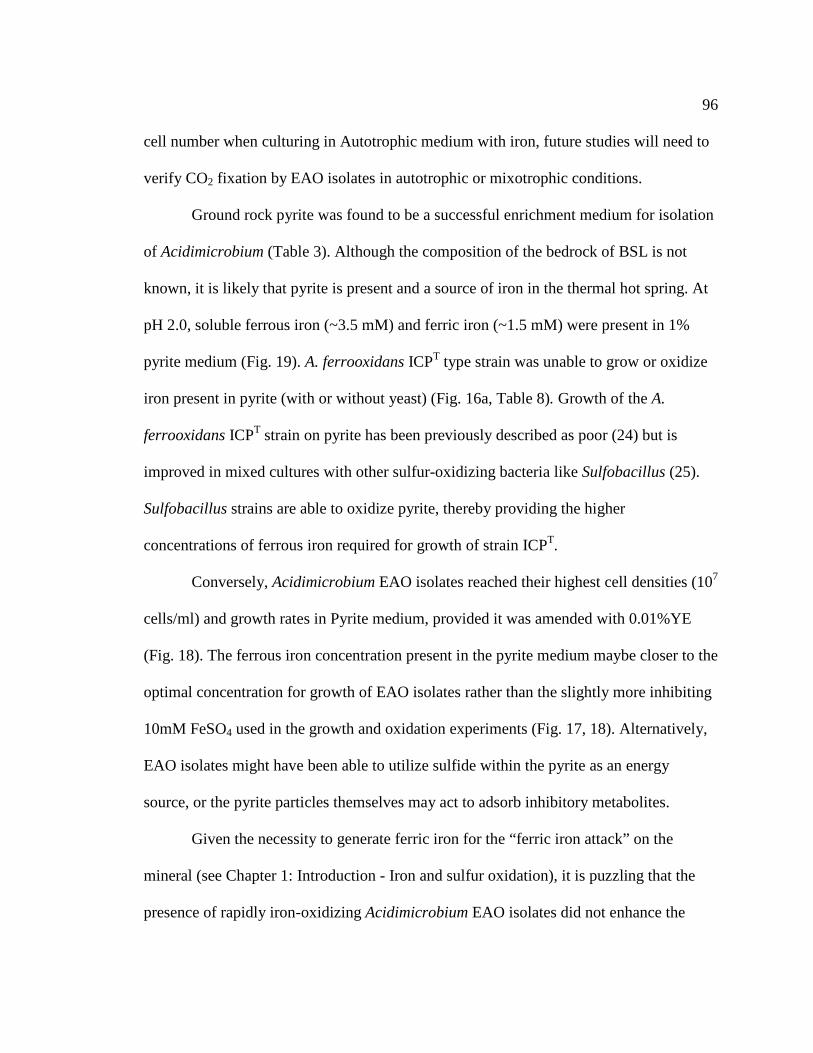
96
cell number when culturing in Autotrophic medium with iron, future studies will need to
verify CO2 fixation by EAO isolates in autotrophic or mixotrophic conditions.
Ground rock pyrite was found to be a successful enrichment medium for isolation
of Acidimicrobium (Table 3). Although the composition of the bedrock of BSL is not
known, it is likely that pyrite is present and a source of iron in the thermal hot spring. At
pH 2.0, soluble ferrous iron (~3.5 mM) and ferric iron (~1.5 mM) were present in 1%
pyrite medium (Fig. 19). A. ferrooxidans ICPT type strain was unable to grow or oxidize
iron present in pyrite (with or without yeast) (Fig. 16a, Table 8). Growth of the A.
ferrooxidans ICPT strain on pyrite has been previously described as poor (24) but is
improved in mixed cultures with other sulfur-oxidizing bacteria like Sulfobacillus (25).
Sulfobacillus strains are able to oxidize pyrite, thereby providing the higher
concentrations of ferrous iron required for growth of strain ICPT.
Conversely, Acidimicrobium EAO isolates reached their highest cell densities (107
cells/ml) and growth rates in Pyrite medium, provided it was amended with 0.01%YE
(Fig. 18). The ferrous iron concentration present in the pyrite medium maybe closer to the
optimal concentration for growth of EAO isolates rather than the slightly more inhibiting
10mM FeSO4 used in the growth and oxidation experiments (Fig. 17, 18). Alternatively,
EAO isolates might have been able to utilize sulfide within the pyrite as an energy
source, or the pyrite particles themselves may act to adsorb inhibitory metabolites.
Given the necessity to generate ferric iron for the “ferric iron attack” on the
mineral (see Chapter 1: Introduction - Iron and sulfur oxidation), it is puzzling that the
presence of rapidly iron-oxidizing Acidimicrobium EAO isolates did not enhance the
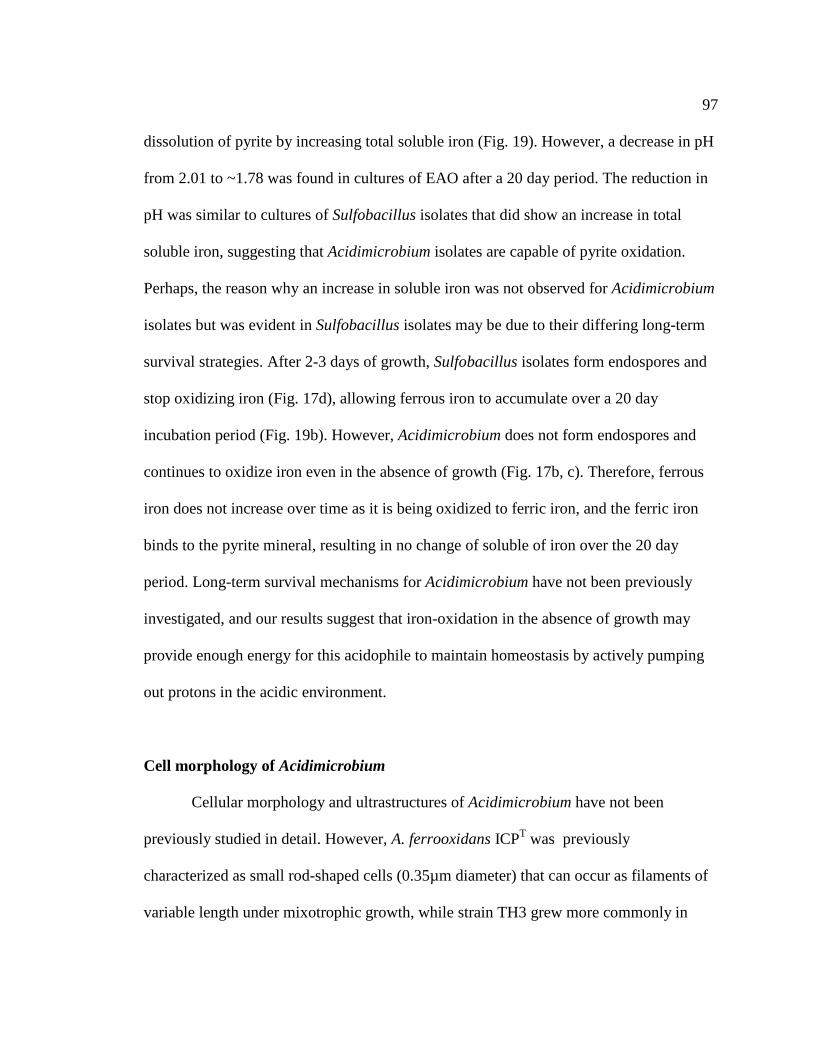
97
dissolution of pyrite by increasing total soluble iron (Fig. 19). However, a decrease in pH
from 2.01 to ~1.78 was found in cultures of EAO after a 20 day period. The reduction in
pH was similar to cultures of Sulfobacillus isolates that did show an increase in total
soluble iron, suggesting that Acidimicrobium isolates are capable of pyrite oxidation.
Perhaps, the reason why an increase in soluble iron was not observed for Acidimicrobium
isolates but was evident in Sulfobacillus isolates may be due to their differing long-term
survival strategies. After 2-3 days of growth, Sulfobacillus isolates form endospores and
stop oxidizing iron (Fig. 17d), allowing ferrous iron to accumulate over a 20 day
incubation period (Fig. 19b). However, Acidimicrobium does not form endospores and
continues to oxidize iron even in the absence of growth (Fig. 17b, c). Therefore, ferrous
iron does not increase over time as it is being oxidized to ferric iron, and the ferric iron
binds to the pyrite mineral, resulting in no change of soluble of iron over the 20 day
period. Long-term survival mechanisms for Acidimicrobium have not been previously
investigated, and our results suggest that iron-oxidation in the absence of growth may
provide enough energy for this acidophile to maintain homeostasis by actively pumping
out protons in the acidic environment.
Cell morphology of Acidimicrobium
Cellular morphology and ultrastructures of Acidimicrobium have not been
previously studied in detail. However, A. ferrooxidans ICPT was previously
characterized as small rod-shaped cells (0.35µm diameter) that can occur as filaments of
variable length under mixotrophic growth, while strain TH3 grew more commonly in

98
filaments under all growth conditions (24). Acidimicrobium EAO isolates also occurs as
small rods, and are generally straight and thin (0.3-0.4 µm). Interestingly, I noticed that
the A. ferrooxidans ICPT produced extremely long (10-25 µm) filaments only in the
presence of iron (≥10 mM FeSO4) (Fig. 6), at stationary phase, and after accidental
exposure to trace levels of nitric acid contained in residue from acid-washing of
glassware. Many microorganisms produce filaments under stressful conditions such as
oxygen deficiencies in aerobic granules in sequencing batch reactors (SBRs) (65) and
heat stress in B. subtilis (121). Inhibition of growth and cell division (i.e. filamentous
growth) of Bacillus subtilis is correlated with knockout of ftsH that encodes for energy-
dependent metalloprotease as well as sensitivities to heat and salt stresses (121).
Motility of A. ferrooxidans ICPT was reported to occur during heterotrophic
growth on yeast extract (24). However, I noticed motility in the apparent absence of
flagella by both the type strain and EAO isolates during exponential growth in all
medium types. Interestingly, A. ferrooxidans ICPT contains genes encoding for flagella
and pili (26). For example, genes that encode for proteins such as FlgK a hook-associated
protein and CpaB a protein associated with pilus assembly. It is possible that flagella
might still exist in our Acidimicrobium isolates. Flagella are often too small to see in
phase contrast without the use of specialized stains. Preparation of samples for electron
microscopy was collected during early stationary phase in which motility was not
observed. Flagellar structures may have been disassembled during stationary phase or the
procedure to preserve the structure for visualization under electron microscopy may need
to be improved.

99
Ultra-structures of Acidimicrobium have not been previously reported, and this
study provides a first look as to the intracellular complexity of this genus. Due to the
composition of the envelope, TEM images of cells can be mistaken for Gram-negative
cells rather than Gram-positive (Fig. 8, 9). There appears to be a periplasm-like region
similar to a Gram negative cell, but this region contains a thick, layered cell wall instead
of a thin cell wall. As expected for a Gram-positive organism, the envelope appears to
lack an outer membrane. The envelope is similar to another Gram positive member of the
high G-C Actinobacteria – Acidothermus cellulolyticus (76). EAO isolates appear purple
when Gram stained (Fig. 5c), and SEM images of cell surfaces are smooth which is
characteristic of Gram positive bacteria (68). Protrusions from the cell wall surface (Fig.
7b, d) may be evidence of pili used for conjugation or nanowires used for electron
transfer. Yet, these protrusions were only found in a few images and may also be artifacts
from sampling and preparation.
Transmission electron microscopy for the Acidimicrobium EAO isolates and the
A. ferrooxidans ICPT revealed a single large inclusion within cells in both medium types
(Fig. 7, 8); this may function as an energy or carbon storage (68). Generally, inclusions
can vary in size, are often numerous within cells, and contain unique membranes (61).
The most common inclusions found in prokaryotes consist of poly-β-hydroxybutric acid
(PHB) that bond via ester linkages to form a long PHB polymer, eventually aggregating
into granules (68). PHBs and other poly-β-hydroxyalkanoates (PHAs) are often
synthesized in the presence of excess carbon suggesting a role in carbon storage. All
EAO isolates and the type strain were grown in the presence of carbon (in the form of

100
yeast extract), leading to the possibility that these large inclusions are some type of PHA.
Also, cells collected for electron microscopy preparation were at the transition of
exponential to stationary phase, and this may explain why only a single granule or
absence of granules was observed in cells. It is also possible that the large inclusions are
processing.
The unknown particulates present in all EM images are indicative of mineral
oxides (possibly iron oxides) (77). All cultures contained iron that was autoclaved which
may have resulted in the formation of solid particulates (43). However further
investigation is needed to verify that these are not biological in origin. Alternatively,
particulates may be the result of other components found in the media. TEM grids were
post-stained with uranyl acetate and lead citrate. These positive stains appear as phase
dense and bind to phosphate and amino groups as well as other anions (91). Therefore,
phase dense particles do not necessarily indicate cellular components, but other
components that may be present in the media (i.e. organic wastes).
Caveats associated with growth measurements
Cell yields of 1x10⁵ cells were considered minimal growth for all organisms and
conditions tested, and this was equivalent to cell yields obtained in negative controls
(with no added energy source present beyond what was contained in the inoculum) (Fig.
15 and 16). At this cell density and lower, sampling and microscopic counting errors
significantly increase as indicated by large vertical standard error bars (all growth
figures); such errors make it more difficult to determine optimal conditions for growth. In

101
my growth experiments, I counted a maximum of 25 different fields per sample when cell
counts were below 106/ml. One of the reasons why optical density methods were not used
to determine cell yields in our study was due to the lack of visible turbidity in cultures
and issues associated with measuring turbidity of cultures containing particulate iron
oxides. Optical density (OD) methods require that cells absorb light in a concentration
dependent manner and that a particular threshold of at least 106cells/ml is achieved to
detect OD spectrophotometrically. Most of my studies did not meet this threshold. For
our purposes, the direct count method was the best method available for cell counting.
Isolation and physiological characterization of Sulfobacillus
Strains of the genus Sulfobacillus are commonly found and isolated from
geothermal environments, mineral sulfide mines, coal and mineral spoil heaps, and
commercial metal leaching dumps (7, 17, 40, 120). Four species are currently classified
in the genus Sulfobacillus: S. thermosulfidooxidans, S. acidophilus, S. sibiricus, and S.
thermotolerans (14, 40, 75, 81). All strains of the genus Sulfobacillus have a mixotrophic
metabolism on Fe2+, S0, S4O62-, S2O3
2-, and sulfide minerals such as pyrite in the presence
of low levels of yeast extract (0.01-0.2%). All strains are Gram positive and produce
spherical endospores. Sixteen isolates obtained in this study shared 99% 16S rRNA
nucleotide identity with S. acidophilus (Table 2).
There were similarities found among the physiologies of Sulfobacillus and
Acidimicrobium isolates. Optimal temperature and pH were similar between the two
genera (Table 3). Autotrophic growth on iron, pyrite, elemental sulfur, or tetrathionate

102
was not evident for either genus (Fig. 16, 17, 19, 20) as was previously shown for
representative of Sulfobacillus and Acidimicrobium (24, 81). However, both genera were
able to oxidize iron rapidly in the presence and absence of yeast extract (10mM
FeSO4/0.01%YE) (Fig. 17). There was no evidence for sulfur/tetrathionate oxidation in
the presence of yeast extract for either Acidimicrobium or Sulfobacillus, though we did
not run chemical analysis to ensure that no oxidation occurred. This was an unexpected
result for Sulfobacillus because sulfur oxidation is a hallmark phenotype for the genus.
Previous studies (81) indicated that a drop of culture pH from 3.0 to 1.67 was observed
whereas our studies did not observe a drop in culture pH. It is possible that the pH of the
media we used for the sulfur oxidation studies was too low to observe a significant drop
in pH (pH 2). Sulfur oxidation may have occurred but was undetectable by the methods
used, and/or sulfur may be oxidized by another route. Further studies will be needed to
verify this result as it would imply a new phenotype for Sulfobacillus.
Although there were physiological similarities found among Sulfobacillus and
Acidimicrobium, key differences may explain why Sulfobacillus can be cultivated more
readily than Acidimicrobium. Doubling time for Sulfobacillus was often 2X faster than
Acidimicrobium in identical conditions (i.e. optimal temperature/pH/Heterotrophic
medium) (Table 3). Organisms with a faster growth rate have an advantage when
competing for similar limited resources (i.e. organic carbon). Sulfobacillus isolates can
tolerate changes in temperature/nutrients because they have a wide temperature range for
growth as well as the ability to produce endospores. Changes in environmental
conditions, particularly temperature, may have occurred during sampling from BSL.
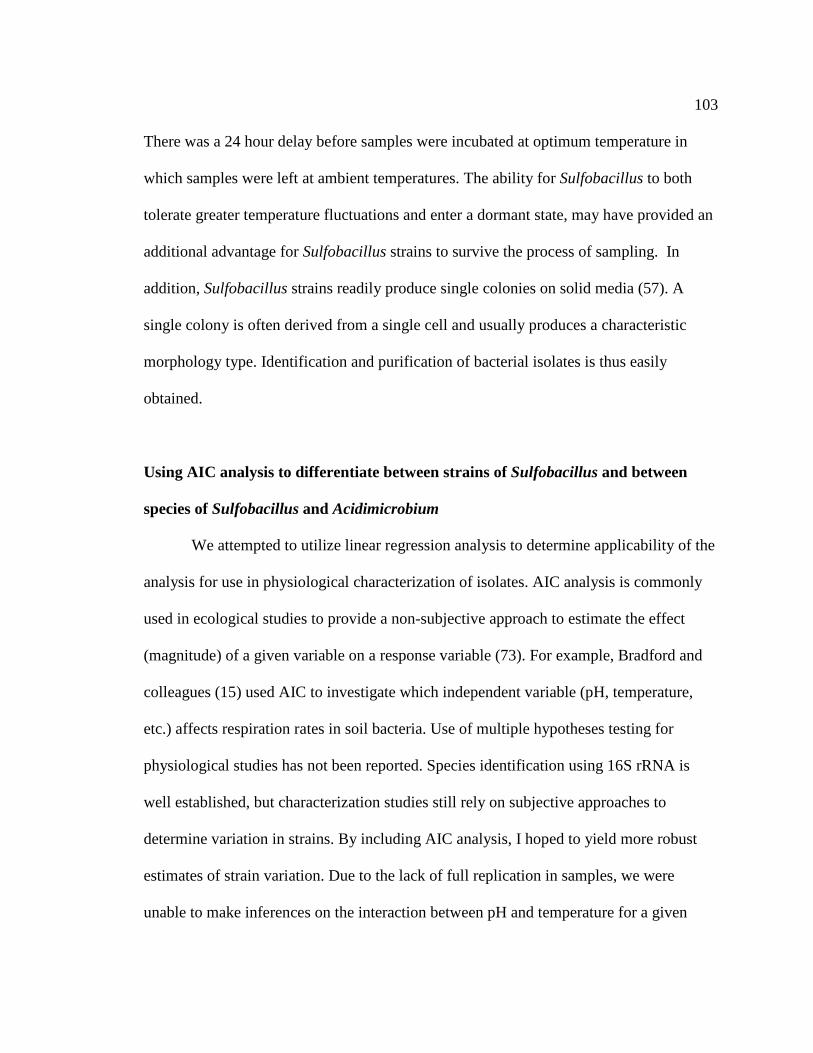
103
There was a 24 hour delay before samples were incubated at optimum temperature in
which samples were left at ambient temperatures. The ability for Sulfobacillus to both
tolerate greater temperature fluctuations and enter a dormant state, may have provided an
additional advantage for Sulfobacillus strains to survive the process of sampling. In
addition, Sulfobacillus strains readily produce single colonies on solid media (57). A
single colony is often derived from a single cell and usually produces a characteristic
morphology type. Identification and purification of bacterial isolates is thus easily
obtained.
Using AIC analysis to differentiate between strains of Sulfobacillus and between
species of Sulfobacillus and Acidimicrobium
We attempted to utilize linear regression analysis to determine applicability of the
analysis for use in physiological characterization of isolates. AIC analysis is commonly
used in ecological studies to provide a non-subjective approach to estimate the effect
(magnitude) of a given variable on a response variable (73). For example, Bradford and
colleagues (15) used AIC to investigate which independent variable (pH, temperature,
etc.) affects respiration rates in soil bacteria. Use of multiple hypotheses testing for
physiological studies has not been reported. Species identification using 16S rRNA is
well established, but characterization studies still rely on subjective approaches to
determine variation in strains. By including AIC analysis, I hoped to yield more robust
estimates of strain variation. Due to the lack of full replication in samples, we were
unable to make inferences on the interaction between pH and temperature for a given

104
Sulfobacillus strain. However, we were able to determine that there was no difference
between interactions of pH or temperature on strains; inferring sub-species or ecotypes
could not be distinguished for pH and temperature alone. Given the low number of
replicates and similarity of growth rates across temperatures and pH (Table 3), I would
have arrived at the same conclusion. The models for distinguishing between species of
Sulfobacillus and Acidimicrobium were significant, thus accurately identifying species.
Results from AIC were not ground-breaking, but as an exercise for using multiple-model
testing, it proved informative.
Isolation and physiological characterization of Alicyclobacillus
Alicyclobacillus strains are ubiquitous acidophiles found in soils and water of
geothermal areas as well as nongeothermal soils (i.e. from gardens or woods), fruit juices,
ores and wastewater sludge (21, 33, 35, 46, 62). The genus Alicyclobacillus contains 17
species in which the majority are easily distinguished from each other by phenotypic and
chemotaxonomic characteristics (32). Alicyclobacillus species encompass a wide
temperature and pH range for growth from 4-70˚C and pH 0.5-6.5, respectively, and all
species produce ovoid endospores. Species of Alicyclobacillus can be categorized into
three groups determined by growth temperature ranges: hyperthermophiles like Al.
acidocaldarius ranging from 45-70˚C (opt. ~65˚C), thermophiles like Al. acidophilus
ranging from 20-65˚C (opt. 40-55˚C), and mesophiles like Al. tolerans ranging from 4-
55˚C (opt. 35-42˚C). Most species of Alicyclobacillus appear to be strictly
chemoorganotrophic. Two species (Al. tolerans and Al. disulfidooxidans) are
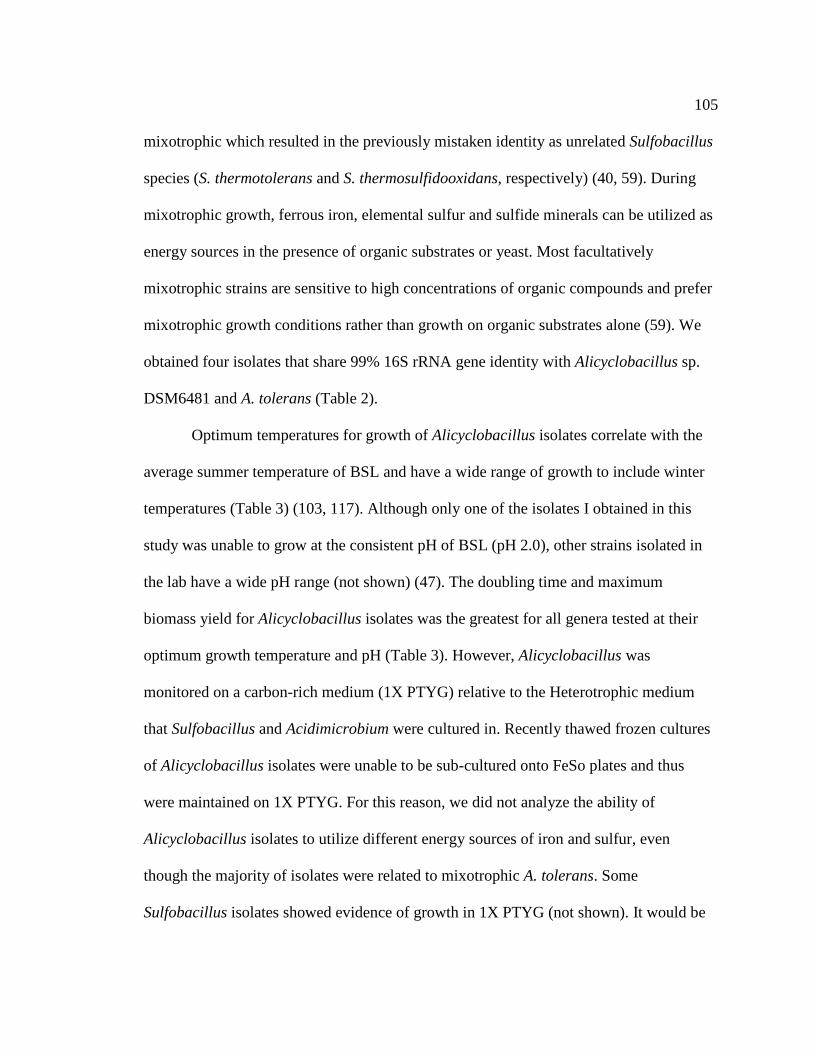
105
mixotrophic which resulted in the previously mistaken identity as unrelated Sulfobacillus
species (S. thermotolerans and S. thermosulfidooxidans, respectively) (40, 59). During
mixotrophic growth, ferrous iron, elemental sulfur and sulfide minerals can be utilized as
energy sources in the presence of organic substrates or yeast. Most facultatively
mixotrophic strains are sensitive to high concentrations of organic compounds and prefer
mixotrophic growth conditions rather than growth on organic substrates alone (59). We
obtained four isolates that share 99% 16S rRNA gene identity with Alicyclobacillus sp.
DSM6481 and A. tolerans (Table 2).
Optimum temperatures for growth of Alicyclobacillus isolates correlate with the
average summer temperature of BSL and have a wide range of growth to include winter
temperatures (Table 3) (103, 117). Although only one of the isolates I obtained in this
study was unable to grow at the consistent pH of BSL (pH 2.0), other strains isolated in
the lab have a wide pH range (not shown) (47). The doubling time and maximum
biomass yield for Alicyclobacillus isolates was the greatest for all genera tested at their
optimum growth temperature and pH (Table 3). However, Alicyclobacillus was
monitored on a carbon-rich medium (1X PTYG) relative to the Heterotrophic medium
that Sulfobacillus and Acidimicrobium were cultured in. Recently thawed frozen cultures
of Alicyclobacillus isolates were unable to be sub-cultured onto FeSo plates and thus
were maintained on 1X PTYG. For this reason, we did not analyze the ability of
Alicyclobacillus isolates to utilize different energy sources of iron and sulfur, even
though the majority of isolates were related to mixotrophic A. tolerans. Some
Sulfobacillus isolates showed evidence of growth in 1X PTYG (not shown). It would be

106
interesting to re-examine and compare doubling times and maximum cell yields of
Sulfobacillus isolates in 1X PTYG medium. Unfortunately, Acidimicrobium isolates were
unable to grow in 1X PTYG. As mentioned earlier, EAO isolates may prefer autotrophic
and/or mixotrophic lifestyle for growth due to the oligotrophic conditions of BSL.
Overall, physiological parameters suggest that Alicyclobacillus strains are r-strategists
that respond quickly to carbon inputs into BSL, and other students in the laboratory are
investigating this hypothesis.
Incidentally, media with organic carbon will select for r-strategists from an
oligotrophic habitat. Alicyclobacillus strains are inherently easier to cultivate since they
have fairly rapid growth rates and produce single colonies on gelled-media containing
0.05% each of glucose and yeast extract (and organic N at 0.05%). However, only a few
species of Alicyclobacillus are mixotrophs with the ability to utilize iron as an energy
source (40, 59). Isolates we obtained in this study that were related to mixotroph A.
tolerans produced white colonies (Table 2) and did not maintain viability on FeSo plates.
Speculation on Role of Acidophilic Isolates in BSL
Microbial communities in the environment are composed of interactive systems
with multiple levels of organization (48). Physiological results from Acidimicrobium,
Sulfobacillus, and Alicyclobacillus isolates suggest that they may be active members of
the community in BSL (Table 3), each with a unique role to play. The dominant presence
of Acidimicrobium phylotypes in multiple SSU rRNA and RuBisCo gene clone libraries
from BSL (11, 116, 117) suggests that Acidimicrobium are important members of the

107
BSL community, and that may play important roles in primary production, iron and
sulfur cycling. The ecological significance of the potentially rare members of the
community, Sulfobacillus and Alicyclobacillus, should not be underestimated. These may
not be well represented in previous clone libraries because of their ability to sporulate,
thus evading lysis during DNA extraction procedures. Although the significance of rare
members is often unknown, they may act as a “seed bank” of bacteria that become much
more abundant when conditions in the environment changes (100). Here, I propose the
roles and interactions of Acidimicrobium, Sulfobacillus, and Alicyclobacillus isolates in
BSL.
Acidimicrobium and Sulfobacillus are distantly related yet share similar
physiologies. Isolates from both genera showed iron oxidation under autotrophic and
mixotrophic conditions (Fig. 18). We did not monitor CO2 fixation by EAO and
Sulfobacillus isolates, however the detection of RuBiSCo I from Acidimicrobium in
molecular surveys (102) indicate that it is possible. Sulfobacillus acidophilus has also
been reported to contain genes in the Carbon Benson Cycle (i.e. cbbL) (19). Carbon
fixation pathways for mixotrophic species of Alicyclobacillus are still unknown. The
genome of Al. tolerans or Al. disulfidooxidans has not been sequenced and studies
investigating presence of C-fixing genes have not been performed. Acidimicrobium may
be able to utilize iron from BSL as an energy source for autotrophic/mixotrophic growth
or for maintaining cell viability in the absence of growth. However, Acidimicrobium may
not be able to provide enough organic molecules in the form of pyruvic acid to

108
heterotrophic members of the community. Instead, the significant role of Acidimicrobium
may be continuous iron oxidation in the BSL.
Active iron oxidation by both genera may supply ferric iron to the system. At low
pH (2.0), the majority of soluble iron present is in the form of ferrous iron. By providing
Fe3+ to the system, organisms that require ferric iron for anaerobic respiration (including
Acidimicrobium, Sulfobacillus, Al. tolerans, Acidicaldus organivorus) can be satisfied.
Also, ferric iron is considered the major oxidant for pyrite dissolution. Two Sulfobacillus
isolates (JWO19m and JWO22m) and all Acidimicrobium isolates showed evidence for
pyrite oxidization (Fig. 19, Table 8). The role of Sulfobacillus and Acidimicrobium in
pyrite oxidation in situ may be significant since this activity results in the generation of
reduced iron and intermediate redox state sulfur compounds which potentially can be
used as energy sources by lithotrophic and mixotrophic members of the community.
Sulfobacillus strains have the potential to oxidize sulfur autotrophically and
mixotrophically (81), however we did not find evidence for sulfur/tetrathionate oxidation
in the Sulfobacillus isolates examined (Table 8). Considering that this is a hallmark
phenotype for Sulfobacillus, further testing will be required to verify this result. Sulfur
oxidation provides sulfate and sulfuric acid to the system. Sulfuric acid in BSL appears to
be more dilute than other acidic habitats (34, 42, 117), suggesting that sulfur oxidation
may not be as prevalent, or the generated sulfate is quickly reduced by sulfate respiring
bacteria. Based on functional gene microarrays (102), there is a potential for acidophilic
sulfate reducers to be present in BSL.

109
Seasonal allochthonous carbon inputs carried by snow and rain runoff appear to
be significant contributers to the organic matter present in BSL (117).
Chemoorganotrophs such as Alicyclobacillus isolates can grow rapidly and reach high
densities in the presence of organic carbon (Fig. 11, 12 and Table 3). Based on functional
gene microarrays and uptake of radiolabeled C sources, the BSL carbon cycle appears to
be dominated by heterotrophic processes (102). Once the carbon is depleted in the
system, Alicyclobacillus can sporulate and remain dormant until another massive input of
carbon is received. Cells that do not sporulate might lyse and contribute an additional
input of organic molecules to the system.
Many organic molecules produced by autotrophic organisms are self-inhibitory
(i.e. pyruvic acid and glycolic acid). Glycolic acid produced as a metabolite by
autotrophic acidophiles has been recently shown to inhibit growth of Acidimicrobium
ferrooxidans in mixed community reactors (79). The ability of Firmicutes (mainly
Sulfobacillus spp.) to metabolize glycolic acid may explain why Sulfobacillus spp. are the
main iron-oxidizing bacteria in bioprocessing operations. Autotrophic bacteria may
benefit from interacting with heterotrophic and/or mixotrophic acidophiles whom
detoxify the environment by degrading the soluble organic wastes (e.g. glycolic acid)
produced through autotrophic metabolisms.
Summary
We obtained three Acidimicrobium isolates (Table 2) representative of an
abundant bacterial phylotype detected in multiple SSU rRNA gene clone libraries

110
prepared from BSL-derived DNA (11, 116, 117). Previous detection of RuBisCo I from
Acidimicrobium in BSL (102) suggests that this organism may also be important in
primary production. The pH and temperature optima of Acidimicrobium EAO isolates
correlate with the average summer temperature of BSL (~50˚C, pH 2) (Table 3),
suggesting that these organisms are capable of active growth in BSL. Possible dormancy
in the hotter >65˚C region of the lake (site D) and during the colder winter season needs
further investigation. Acidimicrobium isolates EAO2 and EAO4 as well as Sulfobacillus
isolates are able to oxidize iron autotrophically (Fig. 18), though only mixotrophic iron
oxidation is correlated with cell growth; this suggests the energy yields from iron
oxidation alone are insufficient to drive carbon fixation. However, energy generation
through autotrophic iron oxidation may permit the maintenance energy needed for these
acidophiles to survive in the absence of available DOC. It is possible that Acidimicrobium
sp. EAO isolates may represent a new species of Acidimicrobium or a new ecotype based
on the comparative characterization between EAO isolates and the type strain. However,
further work would be required to produce evidence to support a proposal for a new
species. It is likely that Acidimicrobium are important players in the carbon and iron
cycles of BSL.
This study also provided the first detailed ultrastructure descriptions for the
Acidimicrobium genus. The cellular envelope appears more complex than many other
Gram-positive bacteria. The cell wall is 30-60 nm thick and composed of multiple layers
(Fig. 7). In addition, presence of putative PHAs was observed in the presence of even low

111
concentrations (0.01%) of yeast extract. Further investigations of unidentified
nanoparticles will be required to verify that they are not biotic in origin.
In addition to Acidimicrobium, we isolated 16 strains closely related to
Sulfobacillus acidophilus and four isolates closely related to Alicyclobacillus sp. and A.
tolerans (Table 2). Temperature and pH ranges and optima of Sulfobacillus and
Alicyclobacillus isolates suggest that these members of the community are also active in
BSL with significant putative roles in the ecosystem. Sulfobacillus isolates are able to
oxidize iron and some are able to oxidize pyrite in the presence of yeast extract.
During inputs of allochthonous material from snow melts or rain runoff, it is
possible that Alicyclobacillus and other heterotrophs rapidly use the carbon and return the
system to an oligotrophic state. High concentrations of organic carbon can be inhibitory
to autotrophic acidophiles (79), and thus Alicyclobacillus or Sufobacillus may help
detoxify the environment for Acidimicrobium and others.
Overall, the significance of cultivating a potentially dominant primary producer
from BSL is paramount to understanding ecosystem processes. Rarely is the dominant
member of a community isolated since cultivation favors the rare and opportunistic
members (100). With access to Acidimicrobium in culture, and knowledge of its optimal
growth conditions, we can begin to verify its functions in the BSL community.
Future Work
Future studies are needed to verify autotrophic or mixotrophic growth for both
Acidimicrobium and Sulfobacillus isolates on iron substrates. Evidence of iron oxidation

112
coupled to growth in the presence (but not absence) of yeast, suggests mixotrophic (rather
than autotrophic) growth. However isolates may not be utilizing the organic carbon from
yeast extract, rather other components present like growth factors or vitamins. Further
studies of CO2 fixation via radioisotope uptake assays of 14C-bicarbonate would verify
autotrophy of isolates. Also, the utilization of real-time PCR for quantifying gene
expression of Acidimicrobium RuBisCo I (i.e. cbbL) can also be used to verify
autotrophy. Future studies are also needed to quantify sulfur loss and the gain of oxidized
forms of sulfur during growth to conclude whether the isolates obtained in this work are
capable of sulfur oxidation.
SSU rRNA gene clone libraries suggest that Acidimicrobium is an abundant
member of the BSL community. Further studies utilizing real-time qPCR or FISH can
also be used to quantify Acidimicrobium in BSL to verify its abundance. Previous studies
using FISH from environmental samples from BSL were difficult due to the background
fluorescence from metals. A real-time qPCR approach may prove to be more efficient
and has been utilized with great success in quantifying species-specific densities from
environmental water samples (23).
Continued isolation and characterization of Acidimicrobium-like organisms will
increase our understanding of the functional taxonomic groups involved in the BSL
ecosystem. Isolation methods should include enrichment of samples in 1% Pyrite,
Autotrophic medium adjusted to 10mM FeSO4, and Mixotrophic medium at 45 and 50˚C.
Subsequent isolation and purity might be established by serial dilutions in ½ increments
as well as sub-culturing onto FeSo and FeSo overlay at various iron concentrations

113
(25mM, 10mM, and 1mM), under aerobic and microaerobic conditions. Orange colonies
indicative of iron oxidation as well as orange smears should be screened with
Acidimicrobium-specific primers used in this study. All culturing work should correlate
with careful observation under 400 and 1000X phase contrast microscopy for thin rods of
variable length (lacking endospores). Multiple fields of view per sample will be
necessary to identify these slow growing bacteria at low cell densities (4 cells/field; 106
cells/ml).
By investigating the mechanisms for long-term survival of EAO, especially under
conditions that are not conducive for growth, we may better understand the seasonal role
of Acidimicrobium in BSL. Commonly used methods for detection of cells in the VBNC
state include direct microscopic examination for the presence of an intact cytoplasmic
membrane (using the BacLight® Live/Dead assay) or reverse transcriptase (RT)-PCR to
detect genes expressed by VBNC cells (Oliver 2009). In addition, in order to verify that
EAO isolates are not capable of growth during BSL winter temperatures, we will need to
monitor growth between the last observed minimum temperature of growth of 45°C and
the next temperature in succession were no growth was observed at 35°C (eg. 37, 39, 41,
43°C). It would also be interesting to examine iron oxidation by EAO isolates at these
lower temperatures to determine if they may still be able to maintain viability from the
energy acquired from iron oxidation.
The characterization studies performed in this work were focused on identifying
parameters that enable optimal growth. Further characterization studies can include metal
and metabolite toxicities that would focus on factors that inhibit growth. For example, a

114
metabolite toxicity study would begin by determining the composition of organic
exudates from autotrophic isolates (e.g. glycolic acid or pyruvic acid) which have been
shown to be self-inhibiting (79). In order to investigate sensitivities to organic exudates,
the isolates can be screened against glycolic acid by inoculating organisms in increasing
concentration of the exudate. Organisms that were positive for growth would be tested for
the ability to metabolize glycolic acid by comparing growth of isolates inoculated into
media amended with glycolic acid or without.
115
APPENDIX
Appendix A.
Freezing cultures. Freezer stocks of isolated strains were established for
Sulfobacillus and Alicyclobacillus isolates by streaking cultures for confluent growth onto
FeSo plates, and incubating at 50˚C for 2-5 days. Once growth was observed, cultures
were aseptically transferred by a metal loop to liquid medium 0.1X PTYG (pH 5.0)
containing 20% (v/v) glycerol. Three 533 μL aliquots of each strain were prepared in
2ml screw cap tubes and stored in the -80°C freezer. After one month of freezing, strains
were checked for viability by emptying the entire contents of a single frozen tube of each
strain onto FeSo or 1X PTYG (pH 2.9) plates and incubating for up to 5 days at 50˚C.
Acidmicrobium isolates were obtained from plates and each grown in two 50 ml
serum vials containing liquid heterotrophic medium (15-20ml each) at 45˚C until cell
densities reached at least 20 cells per field at 400X (phase contrast microscope). Cultures
were centrifuged at 9000X g (RC5C Sorvall Instruments DuPont fixed angle rotor SA-
600) for 10 minutes. Centrifuged cultures were immediately transferred to an ice bucket,
and supernatant was removed aseptically; pellets were resuspended in ~1.6ml
heterotrophic liquid medium (pH 5.0) containing 15% (v/v) glycerol. Both 1.6ml
suspensions of the same isolate were pooled, and 250µl increments were distributed to
sterile cryogenic vials. Vials were stored at -80˚C. Validation of viability of frozen
cultures occurred at 2 wks, followed by 1 year intervals after freezing by adding 100ul to

116
liquid heterotrophic medium and the rest of the tube contents (~150µl) onto FeSo plates,
incubated at 50˚C.
Appendix B.
Maintenance of cultures. Sulfobacillus and Alicyclobacillus isolates are sub-
cultured every 3-4 weeks onto either FeSo or 1X PTYG pH 2.9 plates, respectively, and
stored in the fridge. Plates are incubated at 50˚C for 2-5 days in sealed plastic containers.
Isolates JWO16m-JWO22m grow poorly aerobically, therefore they continue to be
incubated microaerophilically (BD* Diagnostic anaerobic jars and Mitsubishi
AnaeroPak*-Microaero, Mitsubishi Gas Chemical, Company, Inc.). Sulfobacillus isolates
are also capable of growing in 1X PTYG liquid and plates (pH 2.0-2.9). Colony
morphologies on 1X PTYG appear as white flat circles. Even though most
Alicyclobacillus strains were isolated from FeSo plates, recently thawed frozen stocks
were not capable of growing on FeSo plates.
Acidimicrobium isolates are maintained in Heterotrophic and Mixotrophic liquid
media as well as FeSo plates adjusted to 10mM FeSO4. Liquid cultures of 10 ml volumes
in sealed Hungate tubes are incubated at a slanted position at 50˚C and the headspace is
replenished with 0.2 µm filter-sterilized air every 1-2 weeks. Every 3-4 weeks, isolates
are sub-cultured from freshly grown (~3-5 days) FeSo plates and sub-cultured into fresh
liquid media. Plates of FeSo are sub-cultured every 3-4 weeks from Mixotrophic liquid
medium (100µl). After 2-3 days, inoculated Mixotrophic medium turns yellow indicating
active iron oxidation. Plates are incubated at 50˚C microaerophilically for 5 days, and

117
stored in the fridge. Acidimicrobium isolates are capable of growing aerobically, but
consistently grow better under microaerobic conditions. Growth on FeSo plates adjusted
to 1mM produce white flat colonies. However, EAO isolates were unable to grow in 1X
PTYG liquid or plates (pH 2.0-2.9).
Appendix C. Statistical equations used for linear regression modeling (5). To rank
models, we used Akaike Information Criterion (AICc) for small sample sizes as
Equation 2:
where K is the number of parameters included in the model. The log-likelihood of the
model given the data, log(L(θ)|data), reflects the overall fit of the model. Smaller values
indicate worse fit. AIC penalizes for the addition of parameters, thereby selecting a
model that fits well but has a minimum number of parameters. To correct for the bias
from too many estimated parameters in relation to the size of the sample, this second
order variant of AIC includes the effective sample size n. If n is large (asymptotic) with
respect to K, the second-order correction is neglible and AICc converges to AIC.
Therefore, the use of AICc is highly recommended in practice over AIC.
Equation 3:
Delta AIC (∆i) and Akaike weights (wi) can be used to compare models. The delta
AIC is a measure of each model relative to the best model and is calculated as
𝐴𝐴𝐴𝐴𝐴𝐴𝐴𝐴 = −2𝑙𝑙𝑙𝑙𝑙𝑙(L(𝜃𝜃)|𝑑𝑑𝑑𝑑𝑑𝑑𝑑𝑑) + 2𝐾𝐾 +2𝐾𝐾 (𝐾𝐾 + 1)𝑛𝑛 − 𝐾𝐾 − 1
𝐴𝐴𝐴𝐴𝐴𝐴𝐴𝐴 = −2𝑙𝑙𝑙𝑙𝑙𝑙(L(𝜃𝜃)|𝑑𝑑𝑑𝑑𝑑𝑑𝑑𝑑) + 2𝐾𝐾

118
Equation 4: ∆i = AICi – min AIC
Where AICi is the AIC value for model i, and min AIC is the AIC value for the best
model. A change < 2 suggests substantial evidence for that model; 3-7 suggests the
model has considerably less support; and > 10 indicates the model is very unlikely.
Akaike weights represents the ratio of the delta AIC of a given model relative to
the whole set of R candidate models, and is calculated as (p.88)
Equation 5:
Where ∆r represents delta AIC for the whole set of r models and ∆i represents delta AIC
of model i. This normalizes delta AIC to compare them on scale of zero to 1 (i.e. the sum
of the wi equals 1). Akaike weights indicate the probability that the model is the best
among the whole set of candidate models.
= exp �−1
2∆i�
∑ exp �−12∆r�𝑅𝑅
𝑟𝑟=1

119
REFERENCES
1. Albers, S-V.A., Vossenberg, J., Driessen, A., and Konings, W. 2001. Bioenergetics and solute uptake under extreme conditions. Extremophiles 5:285-294.
2. Allee, W., Emerson, A., Park, O., Park, T., and Schmidt, K. 1949. Principles
of animal ecology. Saunders, Philadelphia, PA. 3. Allewalt, J.P., Bateson, M.M., Revsbech, N.P., Slack, K., and Ward, D.M.
2006. Effect of temperature and light on growth of and photosynthesis by Synechococcus isolates typical of those predominating in the octopus spring microbial mat community of Yellowstone National Park. Appl. Environ. Microbiol. 72:544-550.
4. Altschul, S.F., Gish, W., Miller, W., Myers, E.W., and Lipman, D.J. 1990.
Basic local alignment search tool. J. Mol. Biol. 215:403-410. 5. Anderson, D.R. 2008. Model based inference in the life sciences: a primer on
evidence. Springer Science + Business Media, LLC, New York, NY. 6. Angelov, A. and Liebl, W. 2006. Insights into extreme thermoacidophily based
on genome analysis of Picrophilus torridus and other thermoacidophilic archaea. J. Biotechnol. 126:3-10.
7. Atkinson, T., Cairns, S., Cowan, D.A., Danson, M.J., Hough, D.W., Johnson,
D.B., Norris, P.R., Raven, N., Robinson, C., Robson, R., and Sharp, R.J. 2000. A microbiological survey of Montserrat Island hydrothermal biotopes. Extremophiles 4:305-313.
8. Atlas RM. 2004. Handbook of microbiological media, 3rd ed, CRC Press, Boca
Raton, FL. 9. Baker, B.J. and Banfield, J.F. 2003. Microbial communities in acid mine
drainage. FEMS Microbiol. Ecol. 44:139-152. 10. Baker-Austing, C. and Dopson, M. 2007. Life in acid: pH homeostasis in
acidophiles. TRENDS in Microbiology 15:165-171. 11. Bartles, A.N. 2007. M.S. thesis. Prokaryotic diversity of Boiling Springs Lake,
Lassen Volcanic National Park. Humboldt State University, Arcata.

120
12. Blank, C.E., Cady, S.L., and Pace, N.R. 2002. Microbial composition of near-boiling silica-depositing thermal springs throughout Yellowstone National Park. Appl. Environ. Microbiol. 68:5123-5135.
13. Blöchl, E., Rachel, R., Burggraf, S., Hafenbradl, D., Jannasch, H.W., and
Stetter, K.O. 1997. Pyrolobus fumarii, gen. and sp. nov., represents a novel group of archaea, extending the upper temperature limit for life to 113°C. Extremophiles 1:14-21.
14. Bogdanova, T.I., Tsaplina, I.A., Kondrat'eva, T.F., Duda, V.I., Suzina, N.E.,
Melamud, V.S., Tourova, T.P., and Karavaiko, G.I. 2006. Sulfobacillus thermotolerans sp. nov., a thermotolerant, chemolithotrophic bacterium. Int. J. Syst. Evol. Microbiol. 56:1039-1042.
15. Bradford, M.A., Davies, C.A., Frey, S.D., Maddox, T.R., Melillo, J.M.,
Mohan, J.E., Reynolds, J.F., Treseder, K.K., and Wallenstein, M.D. 2008. Thermal adaptation of soil microbial respiration to elevated temperature. Ecol. Lett. 11:1316-1327.
16. Brierley, J.A. 1978. Theremophilic iron-oxidizing bacteria found in copper
leaching dumps. Appl. Environ. Microbiol. 36:523-525. 17. Brierley, J.A. and LeRoux, N.W. 1977. A facultative thermophilic Thiobacillus-
like bacterium: oxidation of iron and pyrite. Gesellsch. Biotechnol. Forsch. Monogr. Ser. [in German] 4:55-66.
18. Brock, T.D. 1970. High temperature systems. Annu. Rev. Ecol. Syst. 1:191-220. 19. Caldwell, P.E., MacLean, M.R., and Norris, P.R. 2007. Ribulose bisphosphate
carboxylase activity and a Calvin cycle gene cluster in Sulfobacillus species. Microbiology 153:2231-2240.
20. Cambillau, C. and Claverie, J.M. 2000. Structural and genomic correlates of
hyperthermostability. J. Biol. Chem. 275:32383-32386. 21. Cerny, G., Hennlich, W., and Poralla, K. 1984. Spoilage of fruit juice by
bacilli: isolation and characterization of the spoiling microorganisms. Z Lebensm Unters Forsch. [in German] 3:224-227.
22. Cho, J.C. and Giovannoni, S.J. 2004. Cultivation and growth characteristics of a
diverse group of oligotrophic marine Gammaproteobacteria. Appl. Environ. Microbiol. 70:432-440.
121
23. Churro, C., Pereira, P., Vasconcelos, V., and Valério, E. 2012. Species-specific real-time PCR cell number quantification of the bloom-forming cyanobacterium Planktothrix agardhii. Arch. Microbiol. 194:749-757.
24. Clark, D.A. and Norris, P.R. 1996. Acidimicrobium ferrooxidans gen. nov., sp.
nov.: mixed-culture ferrous iron oxidation with Sulfobacillus species. Microbiology 142:785-790.
25. Cleaver, A.A., Burton, N.P., and Norris, P.R. 2007. A novel Acidimicrobium
Species in continuous cultures of moderately thermophilic, mineral-sulfide-oxidizing acidophiles. Appl. Environ. Microbiol. 73:4294-4299.
26. Clum, A., Nolan, M., Lang, E., Rio, T.G.D., Tice, H., Copeland, A., Cheng, J-
F., Lucas, S., Chen, F., Bruce, D., Goodwin, L., Pitluck, S., Ivanova, N., Mavrommatis, K., Mikhailova, N., Pati, A., Chen, A., Palaniappan, K., Göker, M., Spring, S., Land, M., Hauser, L., Chang, Y-J., Jeffries, C.D., Chain, P., Bristow, J., Eisen, J.A., Markowitz, V., Hugenholtz, P., Kyrpides, N.C., Klenk, H-P., and Lapidus, A. 2009. Complete genome sequence of Acidimicrobium ferrooxidans type strain (ICPT). Stand. Genomic Sci. 1:38-45.
27. Clynne, D.A., Janik, C.A., and Muffler, L.J.P. 2003. Hot water in Lassen
Volcanic National Park—fumaroles, steaming ground, and boiling mudpots. U.S.G.S. Fact Sheet 101-102. United States Geological Survey.
28. Colwell, R. 2009. Viable but not cultivable bacteria, p. 121-129. In Epstein, S.S.
(ed), Uncultivated microorganisms, Springer Berlin / Heidelberg. 29. Cook, K.L. and Bolster, C.H. 2007. Survival of Campylobacter jejuni and
Escherichia coli in groundwater during prolonged starvation at low temperatures. J. Appl. Microbiol. 103:573-583.
30. Costa, K., Bacher, G., Allmaier, G., Dominguez-Bello, M.G., Engstrand, L.,
Falk, P., de Pedro, M.A., and García-del Portillo, F. 1999. The morphological transition of Helicobacter pylori cells from spiral to coccoid is preceded by a substantial modification of the cell wall. J. Bacteriol. 181:3710-3715.
31. Crossman, L., Holden, M., Pain, A., and Parkhill, J. 2004. Genomes beyond
compare. Nat. Rev. Microbiol. 2:616-617. 32. da Costa, M.S., Rainey, F.A., and Albuquerque, L. 2009. Genus I.
Alicyclobacillus Wisotzkey, Jurtshuk, Fox, Deinhard and Poralla 1992, 267VP emend. Goto, Mochida, Ashara, Kasai and Yokota 2003, 1542 emend. Karavaiko, Bogdanova, Tourova, Kondrat'eva, Tsaplina, Egorova, Krasil'nikova and

122
Zakharchuk 2005, 946. In De Vos, P., Garrity, G.M., Jones, D., Krieg, N.R., Ludwig, W., Rainey, F.A., Schleifer, K-H., and Whitman, W.B. (ed), Bergey's manual of systemic Bacteriology, 2nd ed, vol. 3. Springer, New York, NY.
33. Darland, G and Brock, T.D. 1971. Bacillus acidocaldarius sp.nov., an
acidophilic thermophilic spore-forming bacterium. J. Gen. Microbiol. 67:9-15. 34. Druschel, G.K., Baker, B.J., Gihring, T.M., and Banfield, J.F. 2004. Acid
mine drainage biogeochemistry at Iron Mountain, California. Geochem. Trans. 5:13-32.
35. Dufresne, S., Bousquet, J., Boissinot, M., and Guay, R. 1996. Sulfobacillus
disulfidooxidans sp. nov., a new acidophilic, disulfide-oxidizing, Gram-positive, spore-forming bacterium. Int. J. Syst. Bacteriol. 46:1056-1064.
36. Ehrlich, H.L. and Newman, D.K. 2009. Geomicrobiology, 5th ed, CRC Press,
Boca Raton, FL. 37. Epstein, S.S. 2009. Microbial awakenings. Nature 457:1083-1083. 38. Evangelou, V.P. 1995. Pyrite oxidation and its control. CRC Press, New York,
NY. 39. Friedman, J.D. and Frank, D. 1978. Thermal surveillance of active volcanoes
using Landsat-1 data collection system. Part IV: Lassen volcanic region. Final Report 1972-1975. Geological Survey, Denver, CO. N. T. I. Services.
40. Golovacheva, R.S. and Karavaiko, G.I. 1978. Sulfobacillus, a new genus of
thermophilic sporeforming bacteria. Mikrobiologiia [in Russian] 47:815-822. 41. Golyshina, O.V., Pivovarova, T.A., Karavaiko. G.I., Kondratéva, T.F.,
Moore, E.R., Abraham, W.R., Lünsdorf, H., Timmis, K.N., Yakimov, M.M., Golyshin, P.N. 2000. Ferroplasma acidiphilum gen. nov., sp. nov., an acidophilic, autotrophic, ferrous-iron-oxidizing, cell-wall-lacking, mesophilic member of the Ferroplasmaceae fam. nov., comprising a distinct lineage of the Archaea. Int. J. Syst. Evol. Microbiol. 50:997-1006.
42. González-Toril, E., Llobet-Brossa, E., Casamayor, E.O., Amann, R., and
Amils, R. 2003. Microbial ecology of an extreme acidic environment, the Tinto River. Appl. Environ. Microbiol. 69:4853-4865.
43. Hallberg, K.B. and Johnson, D.B. 2007. Isolation, enumeration, growth, and
preservation of acidophilic prokaryotes, p. 1155-1165. In Hurst, C.J., Crawford,

123
R.L., Knudsen, G.R., McInerney, M.J., and Stetzenbach, L.D. (ed), Manual of environmental microbiology, 3rd ed, ASM Press, Washington, D.C.
44. Hansen, M.C., Tolker-Nielsen, T., Givskov, M., and Molin, S. 1998. Biased
16S rDNA PCR amplification caused by interference from DNA flanking the template region. FEMS Microbiol. Ecol. 26:141-149.
45. Hazeu, W., Schmedding, D.J., Goddijn, O., Bos, P., and Kuenen, J.G. 1987.
The importance of the sulphur-oxidizing capacity of Thiobacillus ferrooxidans during leaching of pyrite, p. 497-499. In Neijssel, O.M., van der, Meer, R.R., and Luyben, K. (ed), Proceedings of the 4th European Congress on Biotechnology. Elsevier, Amsterdam.
46. Hippchen, B., Röll, A., and Poralla, K. 1981. Occurrence in soil of thermo-
acidophilic bacilli possessing ω-cyclohexane fatty acids and hopanoids. Arch. Microbiol. 129:53-55.
47. Hudson, C. 2012. M.A. thesis. Determination of antibiotic resistance in the
bacterial community of Boiling Springs Lake in Lassen Volcanic National Park. Humboldt State University, Arcata, CA.
48. Hurst, C.J. 2007. Neighborhoods and community involvement: no microbe is an
island, p. 6-19. In Hurst, C.J., Crawford, R.L., Knudsen, G.R., McInerney, M.J., and Stetzenbach, L.D. (ed), Manual of environmental microbiology, 3rd ed, ASM Press, Washington, D.C.
49. Hurst, L.D. and Merchant, A.R. 2001. High guanine–cytosine content is not an
adaptation to high temperature: a comparative analysis amongst prokaryotes. Proc. R. Soc. Lond. B. Biol. Sci. 268:493-497.
50. Inskeep, W.P., Ackerman, G.G., Taylor, W.P., Kozubal, M., Korf, S., and
Macur, R.E. 2005. On the energetics of chemolithotrophy in nonequilibrium systems: case studies of geothermal springs in Yellowstone National Park. Geobiology 3:297-317.
51. Jerez, C.A., Chamorro, D., Peirano, I., Toledo, H., and Arredondo, R. 1988.
Studies of the stress response in chemolithotrophic acidophilic bacteria. Biochem. Int. 17:989-999.
52. Johnson, D.B. 2009. Carbon, iron and sulfur metabolism in acidophilic micro-
organisms. Advanc. Microb. Phys. 54:201-255.

124
53. Johnson, D.B. 2012. Geomicrobiology of extremely acidic subsurface environments. FEMS Microbiol. Ecol. 81:2-12.
54. Johnson, D.B. 2007. Physiology and ecology of acidiophilic microorganisms. In
Gerday, C. and Glansdorff, N. (ed), Physiology and biochemistry of extremophiles. ASM Press, Washington, D.C.
55. Johnson, D.B. 1995. Selective solid media for isolation and enumerating
acidophilic bacteria. J. Microbiol. Methods 23:205-218. 56. Johnson, D.B., Macvicar, J.H.M, and Rolfe, S. 1987. A new solid medium for
the isolation and enumeration of Thiobacillus ferrooxidans and acidophilic heterotrophic bacteria. J. Microb. Methods 7:9-18.
57. Johnson, D.B., Okibe, N., Roberto, F.F. 2003. Novel thermo-acidophilic
bacteria isolated from geothermal sites in Yellowstone National Park: physiological and phylogenetic characteristics. Arch. Microbiol. 180:60-68.
58. Kampmann, M. and Stock, D. 2004. Reverse gyrase has heat-protective DNA
chaperone activity independent of supercoiling. Nucleic Acids Res. 32:3537-3545.
59. Karavaiko, G.I., Bogdanova, T.I., Tourova, T.P., Kondrat'eva, T.F.,
Tsaplina, I.A., Egorova, M.A., Krasil'nikova, E.N., and Zakharchuk, L.M. 2005. Reclassification of ‘Sulfobacillus thermosulfidooxidans subsp. thermotolerans’ strain K1 as Alicyclobacillus tolerans sp. nov. and Sulfobacillus disulfidooxidans Dufresne et al. 1996 as Alicyclobacillus disulfidooxidans comb. nov., and emended description of the genus Alicyclobacillus. Int. J. Syst. Evol. Microbiol. 55:941-947.
60. Kawashima, T., Amano, N., Koike, H., Makino, S-i., Higuchi, S., Kawashima-
Ohya, Y., Watanabe, K., Yamazaki, M., Kanehori, K., Kawamoto, T., Nunoshiba, T., Yamamoto, Y., Aramaki, H., Makino, K., and Suzuki, M. 2000. Archaeal adaptation to higher temperatures revealed by genomic sequence of Thermoplasma volcanium. Proc. Nat. Acad. Sci. USA 97:14257-14262.
61. Khanna, S. and Srivastava, A.K. 2005. Recent advances in microbial
polyhydroxyalkanoates. Process Biochem. 40:607-619. 62. Kovalenko, E.V. and Malakhova, P.T. 1983. The spore-forming ironoxidizing
bacterium Sulfobacillus thermosulfidooxidans Mikrobiologiya [in Russian] 52:962–966.

125
63. Lane, D.J. 1991. 16S/23S rRNA sequencing, p. 115-175. In Stackerbrandt, E. and Goodfellow, M. (ed), Nucleic acid techniques in bacterial systematics. Wiley, Chichester, United Kingdom.
64. Lees ,H., Kwok, S.C., and Suxuki, I. 1969. The thermodynamics of iron
oxidation by the ferrobacilli. Can. J. Microbiol. 15:43-46. 65. Liu, Y. and Liu, Q-S. 2006. Causes and control of filamentous growth in aerobic
granular sludge sequencing batch reactors. Biotechnol. Adv 24:115-127. 66. Lovley, D.R. and Phillips, E.J.P. 1987. Rapid assay for microbially reducible
ferric iron in aquatic sediments. Appl. Environ. Microbiol. 53:1536-1540. 67. Macalady, J.L., Jones, D.S., and Lyon, E.H. 2007. Extremely acidic, pendulous
cave wall biofilms from the Frasassi cave system, Italy. Environ. Microbiol. 9:1402-1414.
68. Madigan, M. T., Martinko, J. M., Dunlap, P. V., and Clark, D. P. 2009. Cell
structure and function in Bacteria and Archaea, p. 78-82. In Brock biology of microorganisms, 12th ed, Pearson Education, Inc., San Franciscio, CA.
69. Madigan, M. T., Martinko, J. M., Dunlap, P. V., and Clark, D. P. 2009.
Microbial growth, p. 153-157. In Brock biology of microorganisms, 12th ed, Pearson Education, Inc., San Francisco, CA.
70. Marguet, E. and Forterre, P. 2001. Stability and manipulation of DNA at
extreme temperatures. Methods Enzymol. 334:205-215. 71. Matin, A. 2007. pH homeostasis in acidophiles, p. 152-166, Novartis Foundation
Symposium 221 - Bacterial responses to pH. John Wiley & Sons, Ltd. 72. Matzke, J., Schwermann, B., Bakker, E.P. 1997. Acidostable and acidophilic
proteins: the example of the α-amylase from Alicyclobacillus acidocaldarius. Comp. Biochem. Physiol. A Physiol. 118:475-479.
73. Mazerolle, M.J. 2006. Improving data analysis in herptology: using Akaike's
information criterion (AIC) to assess the strength of biological hypotheses. Amphib-reptil. 27:169-180.
74. McCollom, T.M. and Amend, J.P. 2005. A thermodynamic assessment of
energy requirements for biomass synthesis by chemolithoautotrophic micro-organisms in oxic and anoxic environments. Geobiology 3:135-144.
126
75. Melamud, V.S., Pivovarova, T.A., Tourova, T.P., Kolganova, T.V., Osipov, G.A., Lysenko, A.M., Kondrat'eva, T.F., and Karavaiko, G.I. 2003. Sulfobacillus sibiricus sp. nov., a new moderately thermophilic bacterium. Microbiology 72:605-612.
76. Mohagheghi, A., Grohmann, K., Himmel, M., Leighton, L., and Updegraff,
D.M. 1986. Isolation and characterization of Acidothermus cellulolyticus gen. nov., sp. nov., a new genus of thermophilic, acidophilic, cellulolytic bacteria. Int. J. Syst. Bacteriol. 36:435-443.
77. Murr, L. 2006. Biological issues in materials science and engineering:
interdisciplinarity and the bio-materials paradigm. JOM 58:23-33. 78. Nakagawa, S. and Takai, K. 2008. Deep-sea vent chemoautotrophs: diversity,
biochemistry and ecological significance. FEMS Microbiol. Ecol. 65:1-14. 79. Nancucheo, I. and Johnson, D.B. 2010. Production of glycolic acid by
chemolithotrophic iron- and sulfur-oxidizing bacteria and its role in delineating and sustaining acidophilic sulfide mineral-oxidizing consortia. Appl. Environ. Microbiol. 76:461-467.
80. Norris, P.R. and Barr, D.W. 1985. Growth and iron oxidation by acidophilic
moderate thermophiles. FEMS Microbiol. Lett. 28:221-224. 81. Norris, P.R., Clark, D.A., Owen, J.P., and Waterhouse, S. 1996.
Characteristics of Sulfobacillus acidophilus sp. nov. and other moderately thermophilic mineral-sulphide-oxidizing bacteria. Microbiology 142:775-783.
82. Norris, P.R. and Ingledew, W.J. 1992. Acidophilic bacteria: adaptations and
applications, Blackie, Glasglow. 83. Norris, P.R. and Owen, J.P. 1993. Mineral sulphide oxidation by enrichment
cultures of novel thermoacidophilic bacteria. FEMS Microbiol. Rev. 11:51-56. 84. Okibe, N., Gericke, M., Hallberg, K.B., and Johnson, D.B. 2003. Enumeration
and characterization of acidophilic microorganisms isolated from a pilot plant stirred-tank bioleaching operation. Appl. Environ. Microbiol. 69:1936-1943.
85. Oliver, J.D. 2010. Recent findings on the viable but nonculturable state in
pathogenic bacteria. FEMS Microbiol. Rev. 34:415-425.

127
86. Prado, A., Da Costa, M.S., and Madeira, V.M.C. 1988. Effect of growth temperature on the lipid composition of two strains of Thermus sp. J. Gen. Microbiol. 134:1653-1660.
87. Quatrini, R., Appia-Ayme, C., Denis, Y., Ratouchniak, J., Veloso, F., Valdes,
J., Lefimil, C., Silver, S., Roberto, F., Orellana, O., Denizot, F., Jedlicki, E., Holmes, D., and Bonnefoy, V. 2006. Insights into the iron and sulfur energetic metabolism of Acidithiobacillus ferrooxidans by microarray transcriptome profiling. Hydrometallurgy 83:263-272.
88. Ram, R.J., VerBerkmoes, N.C., Thelen, M.P., Tyson, G.W., Baker, B.J.,
Blake, R.C., Shah, M., Hettich, R.L., and Banfield, J.F. 2005. Community proteomics of a natural microbial biofilm. Science 308:1915-1920.
89. Rawlings, D. 2005. Characteristics and adaptability of iron- and sulfur-oxidizing
microorganisms used for the recovery of metals from minerals and their concentrates. Microb. Cell Fact. 4:13.
90. Reizer, J., Grossowicz, N., and Barenholz, Y. 1985. The effect of growth
temperature on the thermotropic behavior of the membranes of a thermophilic Bacillus. Composition-structure-function relationships. Biochim. Biophys. Acta 815:268-280.
91. Reynolds, E.S. 1963. The use of lead citrate at high pH as an electron-opaque
stain in electron microscopy. J. Cell Biol. 17:208-212. 92. Reysenbach, A.L. and Pace, N.R. 1995. Reliable amplification of
hyperthermophilic Archaeal 16S rRNA genes by the polymerase chain reaction, p. 101-106. In Robb, F.T. and Pace, A.R. (ed), Archaea-a Laboratory Manual (thermophiles). Cold Spring Harbor Laboratory Press, Cold Spring Harbor.
93. Rheims, H., Spröer, C., Rainey, F.A., and Stackebrandt, E. 1996. Molecular
biological evidence for the occurrence of uncultured members of the actinomycete line of descent in different environments and geographical locations. Microbiology 142:2863-2870.
94. Robb, F.T. and Laksanalamai, P. 2008. Thermophilic protein-folding systems,
p. 56-57. In Robb, F.T., Antranikian, G., Grogan, D.W., and Driessen, A.J.M. (ed), Thermophiles: biology and technology at high temperatures. CRC Press, Boca Raton, FL.

128
95. Rosa, M.D., Gambacorta, A., Nicolaus, B., Chappe, B., and Albrecht, P. 1983. Isoprenoid ethers; backbone of complex lipids of the archaebacterium Sulfolobus solfataricus. Biochim. Biophys. Acta 753:249-256.
96. Ruepp, A., Graml, W., Santos-Martinez, M-L., Koretke, K.K., Volker, C.,
Mewes, H.W., Frishman, D., Stocker, S., Lupas, A.N., and Baumeister, W. 2000. The genome sequence of the thermoacidophilic scavenger Thermoplasma acidophilum. Nature 407:508-513.
97. Sand, W., Gerke, T., Hallmann, R., and Schippers, A. 1995. Sulfur chemistry,
biofilm, and the (in) direct attack mechanism — a critical evaluation of bacterial leaching. Appl. Microbiol. Biotechnol. 43:961-966.
98. Schleper, C., Puehler, G., Holz, I., Gambacorta, A., Janekovic, D., Santarius,
U., Klenk, H.P., and Zillig, W. 1995. Picrophilus gen. nov., fam. nov.: a novel aerobic, heterotrophic, thermoacidophilic genus and family comprising archaea capable of growth around pH 0. J. Bacteriol. 177:7050-7059.
99. Segerer, A., Neuner, A., Kristjansson, J.K., and Stetter, K.O. 1986. Acidianus
infernus gen. nov., sp. nov., and Acidianus brierleyi comb. nov.: facultatively aerobic, extremely acidophilic thermophilic sulfur-metabolizing Archaebacteria. Int. J. Syst. Bacteriol. 36:559-564.
100. Shade, A., Hogan, C.S., Klimowicz, A.K., Linske, M., McManus, P.S., and
Handelsman, J. 2012. Culturing captures members of the soil rare biosphere. Environ. Microbiol. 14:2247-2252.
101. Shimada, H., Nemoto, N., Shida, Y., Oshima, T., and Yamagishi, A. 2008.
Effects of pH and temperature on the composition of polar lipids in Thermoplasma acidophilum HO-62. J. Bacteriol. 190:5404-5411.
102. Siering, P.L., Carey, C.M., Wardman, C.D., Yip, A.N., Wilson, M.S., Wolfe,
G.W., Stedman, K.M., Yuan, T., Van Nostrand, J.D., Zhili, H., and Zhou, J. 2012. In review. Microbial biogeochemistry of Boiling Springs Lake II: Geochip microarray profiling and substrate utilization reflect an oligotrophic, low pH, geothermal environment, Submitted to Geobiology.
103. Siering, P.L., Clarke, J.M., and Wilson, M.S. 2006. Geochemical and
biological diversity of acidic, hot springs in Lassen Volcanic National Park. Geomicrobiol. J. 23:129 - 141.
129
104. Signoretto, C., Lleò, Md.M., and Canepari, P. 2002. Modification of the peptidoglycan of Escherichia coli in the viable but nonculturable state. Curr. Microbiol. 44:125-131.
105. Silverman, M.P. and Lundgren, D.G. 1959. Studies on the chemoautotrophic
iron bacterium Ferrobacillus ferrooxidans II. J. Bacteriol. 78:326-331. 106. Stetter, K.O. 1996. Hyperthermophilic procaryotes. FEMS Microbiol. Rev.
18:149-158. 107. Svobodová, J. and Svoboda, P. 1988. Membrane fluidity in Bacillus subtilis.
Physical change and biological adaptation. Folia Microbiol. (Praha) 33:161-169. 108. Takai ,K., Nakamura, K., Toki, T., Tsunogai, U., Miyazaki, M., Miyazaki, J.,
Hirayama, H., Nakagawa, S., Nunoura, T., and Horikoshi, K. 2008. Cell proliferation at 122°C and isotopically heavy CH4 production by a hyperthermophilic methanogen under high-pressure cultivation. Proc. Nat. Acad. Sci. USA 105:10949-10954.
109. Thompson, J.D, Higgins, D.G., and Gibson, T.J. 1994. CLUSTAL W:
improving the sensitivity of progressive multiple sequence alignment through sequence weighting, position-specific gap penalties and weight matrix choice. Nucleic Acids Res. 22:4673-4680.
110. Trent, J.D., Gabrielsen, M., Jensen, B., Neugard, J., and Olsen, J. 1994.
Acquired thermotolerance and heat shock proteins in thermophiles from the three phylogenetic domains. J. Bacteriol. 176:6148-6152.
111. Trent, J.D., Nimmesgern, E., Wall, J.S., Hartl, F.U., and Horwich, A.L. 1991.
A molecular chaperone from a thermophilic archaebacterium is related to the eukaryotic protein t-complex polypeptide-1. Nature 354:490-493.
112. Vossenberg, V.D., Driessen, A., Zillig, W., and Konings, W. 1998.
Bioenergetics and cytoplasmic membrane stability of the extremely acidophilic, thermophilic archaeon Picrophilus oshimae. Extremophiles 2:67-74.
113. Walter, R.L., Ealick, S.E., Friedman, A.M., Blake, R.C., Proctor, P., and
Shoham, M. 1996. Multiple wavelength anomalous diffraction (MAD) crystal structure of rusticyanin: a highly oxidizing cupredoxin with extreme acid stability. J. Mol. Biol. 263:730-751.
114. Wiegel, J. 1990. Temperature spans for growth: hypothesis and discussion.
FEMS Microbiol. Lett. 75:155-169.
130
115. Wiegel, J., Braun, M., and Gottschalk, G. 1981. Clostridium
thermoautotrophicum species novum, a thermophile producing acetate from molecular hydrogen and carbon dioxide. Curr. Microbiol. 5:255-260.
116. Wilson, M., Siering, P., White, C., Hauser, M., and Bartles, A. 2008. Novel
Archaea and Bacteria dominate stable microbial communities in North America’s largest hot spring. Microb. Ecol. 56:292-305.
117. Wilson, M.S., Yip, A.N., Siering, P.L., Shapiro, R.S., Reeder IV, W.H.H.,
Stedman, K.M., Diemer, G.S., Kyle, J.E., and Wolfe, G.W. 2012. In review. Microbial biogeochemistry of Boiling Springs Lake I: physical characterization and microbial assemblage across a steep thermal gradient, Submitted to Geobiology.
118. Wong, H.C. and Wang, P. 2004. Induction of viable but nonculturable state in
Vibrio parahaemolyticus and its susceptibility to environmental stresses. J. Appl. Microbiol. 96:359-366.
119. Wood, A.P. and Kelly, D.P. 1983. Autotrophic and mixotrophic growth of three
thermoacidophilic iron-oxidizing bacteria. FEMS Microbiol. Lett. 20:107-112. 120. Yahya, A., Roberto, F.F., and Johnson, D.B. 1999. Novel mineral-oxidizing
bacteria from Montserrat (W.I.): physiological and phylogenetic characteristics p. 729–740. In Amils, R. (ed), Biohydrometallurgy and the environment: toward the mining of the 21st century, process metallurgy 9A. Elsevier, Amsterdam.
121. Zellmeier, S., Zuber, U., Schumann, W., and Wiegert, T. 2003. The absence of
FtsH metalloprotease activity causes overexpression of the σW-controlled pbpE gene, resulting in filamentous growth of Bacillus subtilis. J. Bacteriol. 185:973-982.