Isle of Procida -...
15
EUROSION Case Study 1 CIRQACCIO-CIRACCIELLO ISLE OF PROCIDA (ITALY) Contact : Leonardo DAMIANI Politectnico di Bari Via E. Orabona, 4 70125 Bari (Italia) Tel:+39 080 5963286 Fax:+39 080 5963414 e-mail: [email protected] 23
Transcript of Isle of Procida -...
EUROSION Case Study
1
CIRQACCIO-CIRACCIELLO ISLE OF PROCIDA
(ITALY)
Contact :
Leonardo DAMIANI
Politectnico di Bari
Via E. Orabona, 4 70125 Bari (Italia)
Tel:+39 080 5963286 Fax:+39 080 5963414
e-mail: [email protected]
23
EUROSION Case Study
2
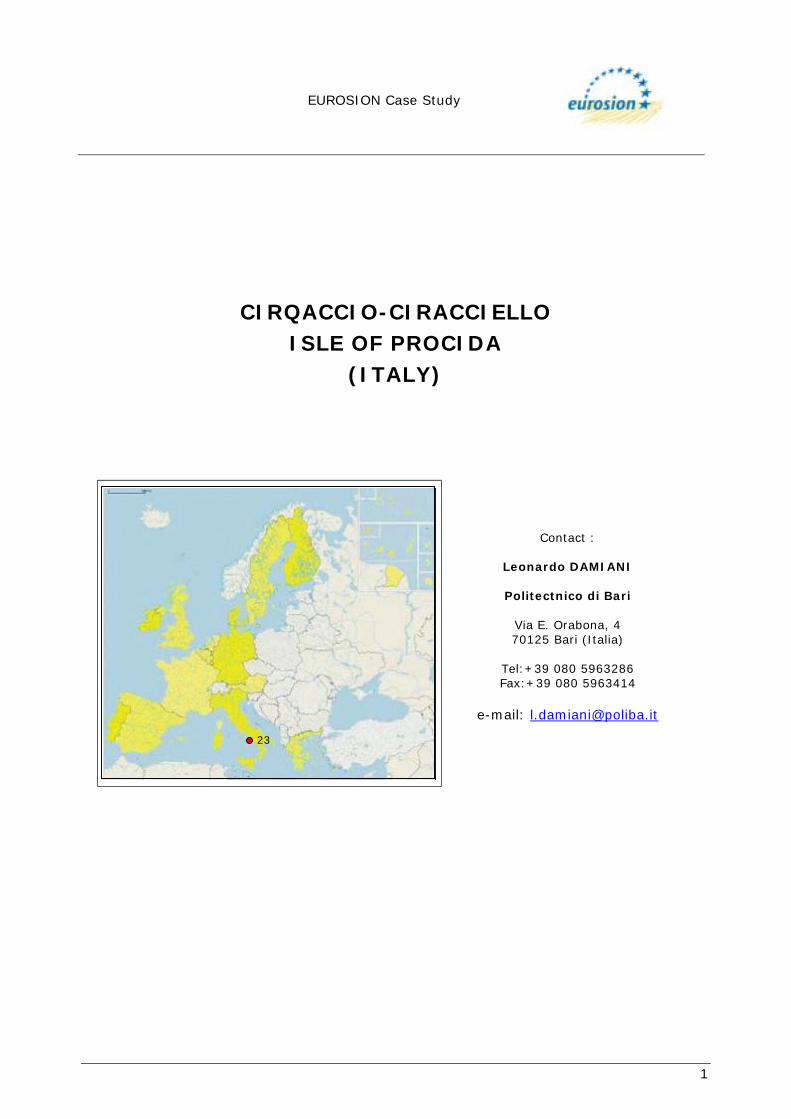
1. GENERAL DESCRIPTION OF THE AREA Procida Island lies to the far north of Golfo di Napoli, in the channel separating Pozzuoli promontory and Ischia Island. Chiaiolella beach extends for approx. 1,5 km toward North-West coast and borders Southwards with the channel between Procida and Vivara Islands and Northwards with Punta Serra promontory (Figure 1).
1.1 Physical process level
1.1.1 Classification Coastal band of the examined site is constituted by a sandy beach of reduced extension. From the land side the beach is bordered by a cliff.
Fig. 1: Chart of Procida Island.
EUROSION Case Study
3
1.1.2 Geology During the site inspection it was collected superficial sediment samples from the emerged beach and at two different depths 0,5 and 1,5 m respectively. The lab analysis shown that both the sample at 1,5 m and the one from the emerged beach are constituted by medium grained sand (d50 ~ 350 µm), well sorted, with low gravel content. Strangely the sample at 0,5 m shows a high gravel content (33%) and a rather wide granulometric curve (d50 ~ 730 µm). However, as the collecting points were too close, it seems to be due mainly to a local deposit than a not homogeneous seabottom composition.
1.1.3 Morphology As above mentioned Chiaiolella beach extends rectilinearly toward North-West coast of Procida Island between Punta Serra promontory and the sound separating Procida from Vivara Island. The shoreline appears like a thin strip of sand bordered by a cliff on the back-beach, whose height decrease slightly going from Punta Serra to the far South of the beach. The violent sea-storms provoked both the coastal erosion and cliff damages with consequent slides whose results are still evident on the beach. The sea depth of the shoreline facing the beach presents a rather steep slope of approx. 2% up to 10 m bathymetry, with bathymetrics running parallel to the shoreline.
1.1.4 Physical processes
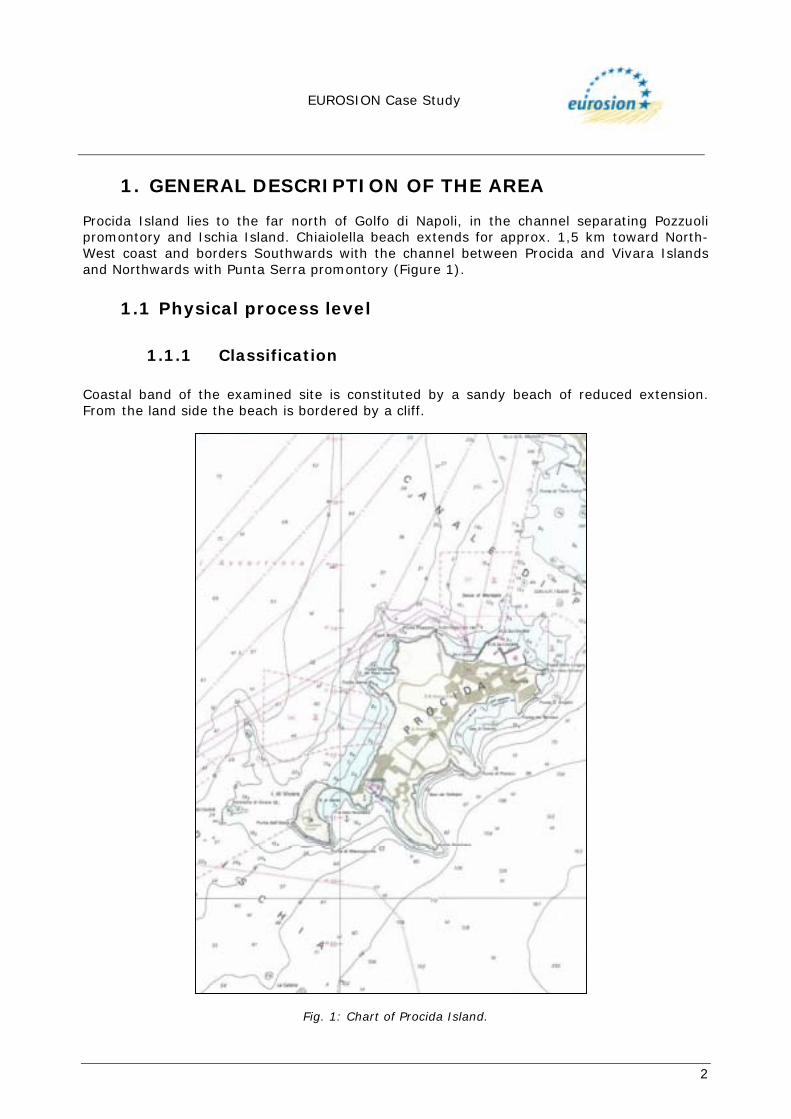
The coastal erosion has significantly cut down the beach and the sea attack has already reached the foot of the cliff, threatening its integrity. The rubbles of the cliff demolition are still visible (Figure 2).
Fig. 2: Chiaiolella beach.
EUROSION Case Study
4
In order to discover the physical process involved in the erosive phenomenon, it has been done a survey whose results will be briefly described as follows:
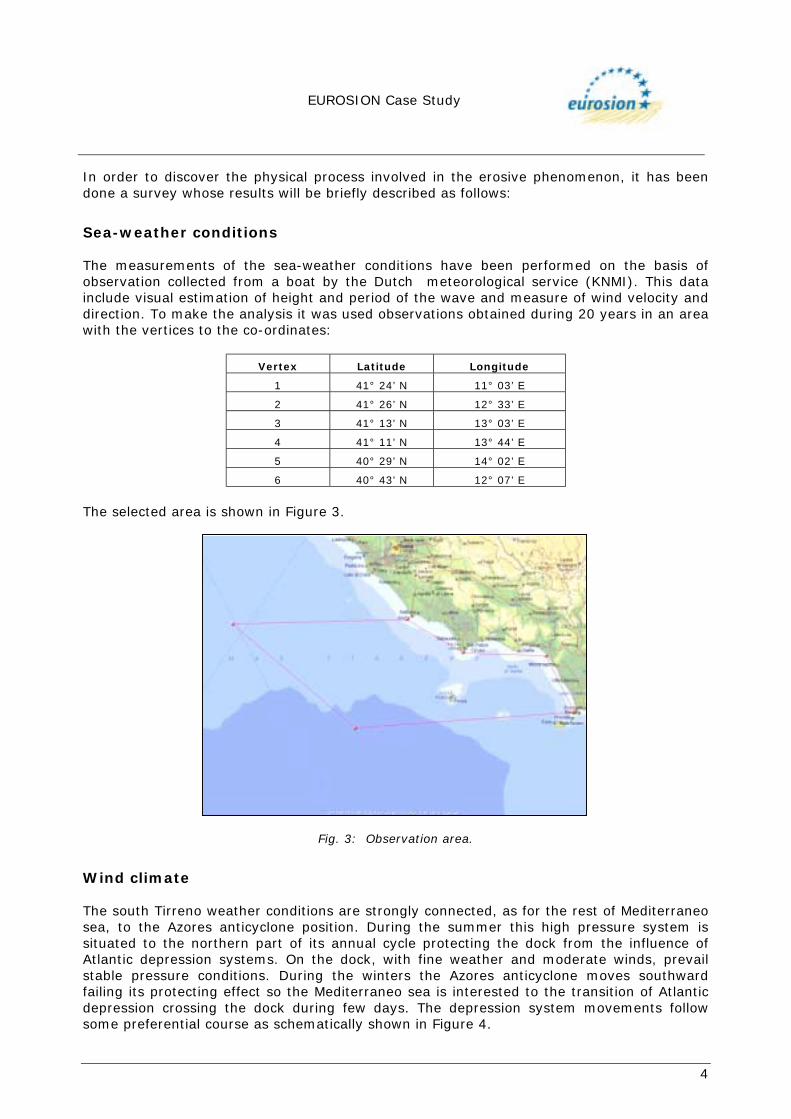
Sea-weather conditions The measurements of the sea-weather conditions have been performed on the basis of observation collected from a boat by the Dutch meteorological service (KNMI). This data include visual estimation of height and period of the wave and measure of wind velocity and direction. To make the analysis it was used observations obtained during 20 years in an area with the vertices to the co-ordinates:
Vertex Latitude Longitude
1 41° 24’ N 11° 03’ E
2 41° 26’ N 12° 33’ E
3 41° 13’ N 13° 03’ E
4 41° 11’ N 13° 44’ E
5 40° 29’ N 14° 02’ E
6 40° 43’ N 12° 07’ E
The selected area is shown in Figure 3.
Fig. 3: Observation area.
Wind climate The south Tirreno weather conditions are strongly connected, as for the rest of Mediterraneo sea, to the Azores anticyclone position. During the summer this high pressure system is situated to the northern part of its annual cycle protecting the dock from the influence of Atlantic depression systems. On the dock, with fine weather and moderate winds, prevail stable pressure conditions. During the winters the Azores anticyclone moves southward failing its protecting effect so the Mediterraneo sea is interested to the transition of Atlantic depression crossing the dock during few days. The depression system movements follow some preferential course as schematically shown in Figure 4.
EUROSION Case Study
5
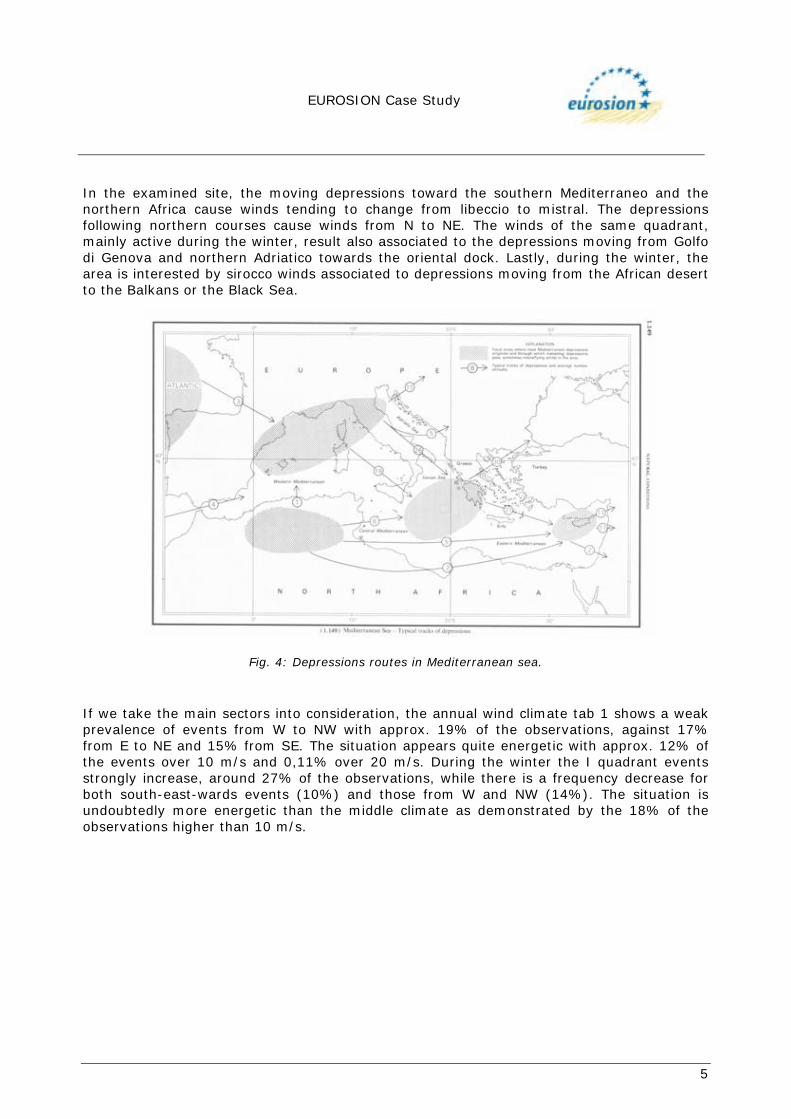
In the examined site, the moving depressions toward the southern Mediterraneo and the northern Africa cause winds tending to change from libeccio to mistral. The depressions following northern courses cause winds from N to NE. The winds of the same quadrant, mainly active during the winter, result also associated to the depressions moving from Golfo di Genova and northern Adriatico towards the oriental dock. Lastly, during the winter, the area is interested by sirocco winds associated to depressions moving from the African desert to the Balkans or the Black Sea.
Fig. 4: Depressions routes in Mediterranean sea.
If we take the main sectors into consideration, the annual wind climate tab 1 shows a weak prevalence of events from W to NW with approx. 19% of the observations, against 17% from E to NE and 15% from SE. The situation appears quite energetic with approx. 12% of the events over 10 m/s and 0,11% over 20 m/s. During the winter the I quadrant events strongly increase, around 27% of the observations, while there is a frequency decrease for both south-east-wards events (10%) and those from W and NW (14%). The situation is undoubtedly more energetic than the middle climate as demonstrated by the 18% of the observations higher than 10 m/s.
EUROSION Case Study
6
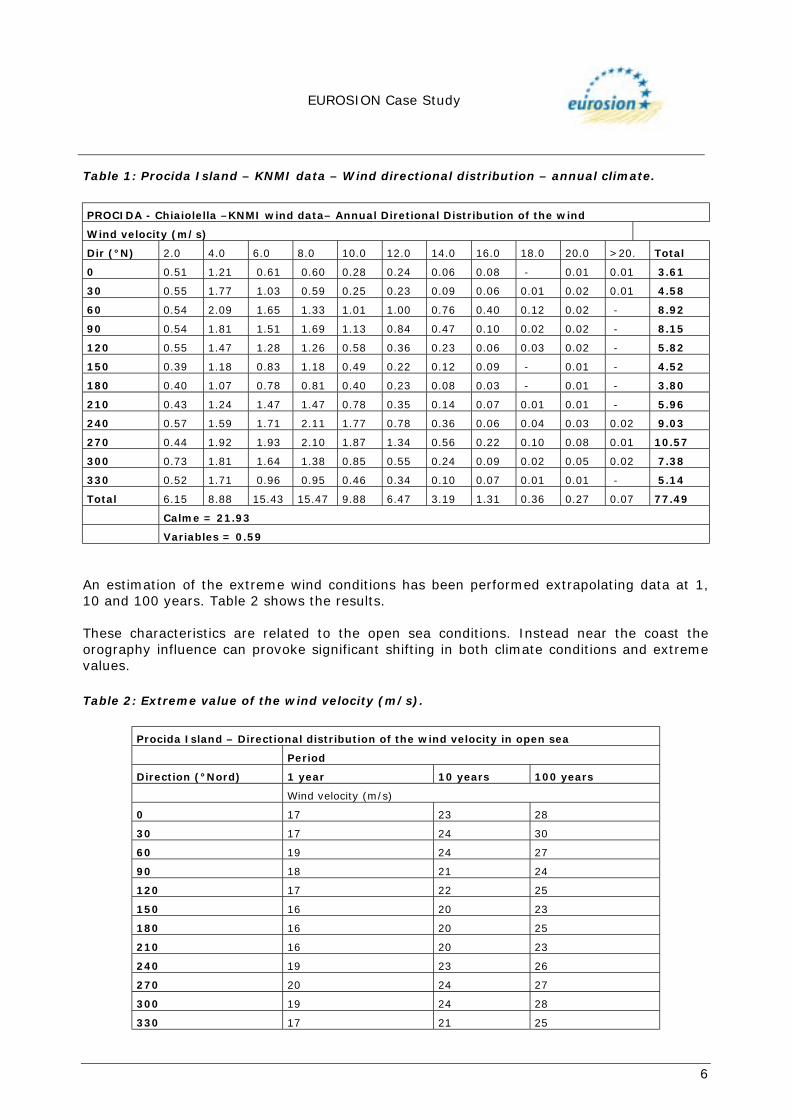
Table 1: Procida Island – KNMI data – Wind directional distribution – annual climate.
PROCIDA - Chiaiolella –KNMI wind data– Annual Diretional Distribution of the wind
Wind velocity (m/s)
Dir (°N) 2.0 4.0 6.0 8.0 10.0 12.0 14.0 16.0 18.0 20.0 >20. Total
0 0.51 1.21 0.61 0.60 0.28 0.24 0.06 0.08 - 0.01 0.01 3.61
30 0.55 1.77 1.03 0.59 0.25 0.23 0.09 0.06 0.01 0.02 0.01 4.58
60 0.54 2.09 1.65 1.33 1.01 1.00 0.76 0.40 0.12 0.02 - 8.92
90 0.54 1.81 1.51 1.69 1.13 0.84 0.47 0.10 0.02 0.02 - 8.15
120 0.55 1.47 1.28 1.26 0.58 0.36 0.23 0.06 0.03 0.02 - 5.82
150 0.39 1.18 0.83 1.18 0.49 0.22 0.12 0.09 - 0.01 - 4.52
180 0.40 1.07 0.78 0.81 0.40 0.23 0.08 0.03 - 0.01 - 3.80
210 0.43 1.24 1.47 1.47 0.78 0.35 0.14 0.07 0.01 0.01 - 5.96
240 0.57 1.59 1.71 2.11 1.77 0.78 0.36 0.06 0.04 0.03 0.02 9.03
270 0.44 1.92 1.93 2.10 1.87 1.34 0.56 0.22 0.10 0.08 0.01 10.57
300 0.73 1.81 1.64 1.38 0.85 0.55 0.24 0.09 0.02 0.05 0.02 7.38
330 0.52 1.71 0.96 0.95 0.46 0.34 0.10 0.07 0.01 0.01 - 5.14
Total 6.15 8.88 15.43 15.47 9.88 6.47 3.19 1.31 0.36 0.27 0.07 77.49
Calme = 21.93
Variables = 0.59
An estimation of the extreme wind conditions has been performed extrapolating data at 1, 10 and 100 years. Table 2 shows the results. These characteristics are related to the open sea conditions. Instead near the coast the orography influence can provoke significant shifting in both climate conditions and extreme values. Table 2: Extreme value of the wind velocity (m/s).
Procida Island – Directional distribution of the wind velocity in open sea
Period
Direction (°Nord) 1 year 10 years 100 years
Wind velocity (m/s)
0 17 23 28
30 17 24 30
60 19 24 27
90 18 21 24
120 17 22 25
150 16 20 23
180 16 20 25
210 16 20 23
240 19 23 26
270 20 24 27
300 19 24 28
330 17 21 25
EUROSION Case Study
7
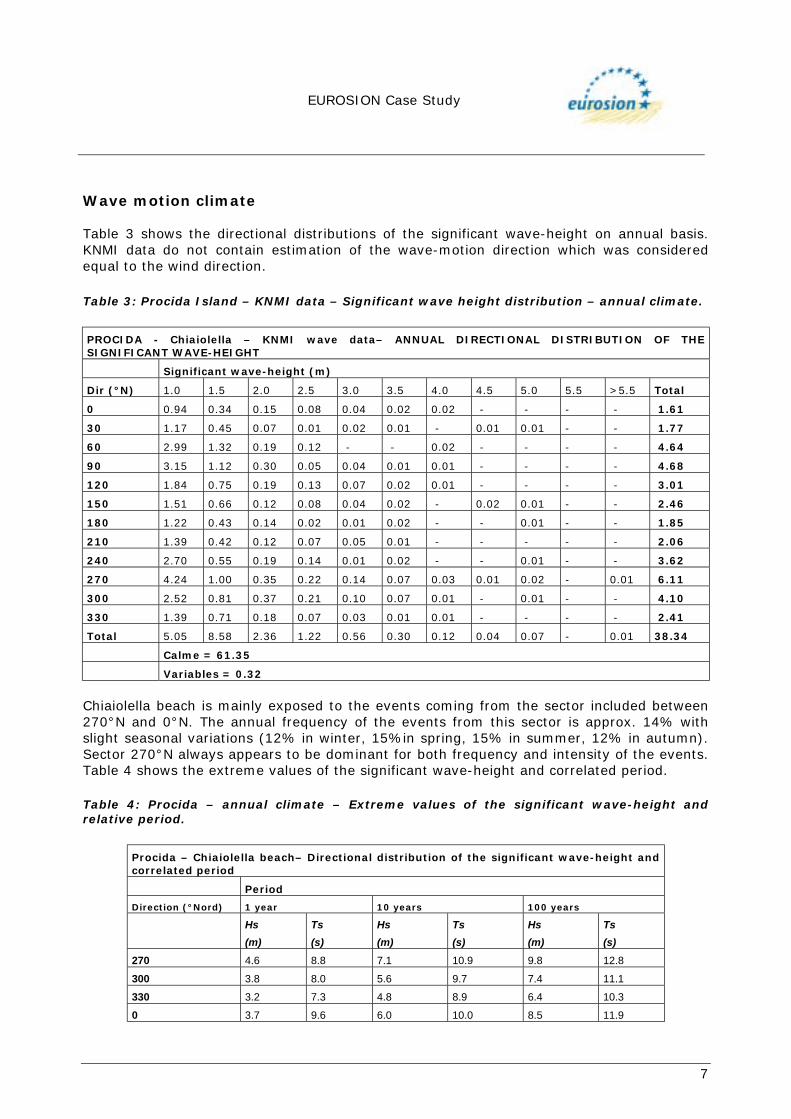
Wave motion climate Table 3 shows the directional distributions of the significant wave-height on annual basis. KNMI data do not contain estimation of the wave-motion direction which was considered equal to the wind direction. Table 3: Procida Island – KNMI data – Significant wave height distribution – annual climate.
PROCIDA - Chiaiolella – KNMI wave data– ANNUAL DIRECTIONAL DISTRIBUTION OF THE SIGNIFICANT WAVE-HEIGHT
Significant wave-height (m)
Dir (°N) 1.0 1.5 2.0 2.5 3.0 3.5 4.0 4.5 5.0 5.5 >5.5 Total
0 0.94 0.34 0.15 0.08 0.04 0.02 0.02 - - - - 1.61
30 1.17 0.45 0.07 0.01 0.02 0.01 - 0.01 0.01 - - 1.77
60 2.99 1.32 0.19 0.12 - - 0.02 - - - - 4.64
90 3.15 1.12 0.30 0.05 0.04 0.01 0.01 - - - - 4.68
120 1.84 0.75 0.19 0.13 0.07 0.02 0.01 - - - - 3.01
150 1.51 0.66 0.12 0.08 0.04 0.02 - 0.02 0.01 - - 2.46
180 1.22 0.43 0.14 0.02 0.01 0.02 - - 0.01 - - 1.85
210 1.39 0.42 0.12 0.07 0.05 0.01 - - - - - 2.06
240 2.70 0.55 0.19 0.14 0.01 0.02 - - 0.01 - - 3.62
270 4.24 1.00 0.35 0.22 0.14 0.07 0.03 0.01 0.02 - 0.01 6.11
300 2.52 0.81 0.37 0.21 0.10 0.07 0.01 - 0.01 - - 4.10
330 1.39 0.71 0.18 0.07 0.03 0.01 0.01 - - - - 2.41
Total 5.05 8.58 2.36 1.22 0.56 0.30 0.12 0.04 0.07 - 0.01 38.34
Calme = 61.35
Variables = 0.32
Chiaiolella beach is mainly exposed to the events coming from the sector included between 270°N and 0°N. The annual frequency of the events from this sector is approx. 14% with slight seasonal variations (12% in winter, 15%in spring, 15% in summer, 12% in autumn). Sector 270°N always appears to be dominant for both frequency and intensity of the events. Table 4 shows the extreme values of the significant wave-height and correlated period. Table 4: Procida – annual climate – Extreme values of the significant wave-height and relative period.
Procida – Chiaiolella beach– Directional distribution of the significant wave-height and correlated period
Period
Direction (°Nord) 1 year 10 years 100 years
Hs (m)
Ts (s)
Hs (m)
Ts (s)
Hs (m)
Ts (s)
270 4.6 8.8 7.1 10.9 9.8 12.8
300 3.8 8.0 5.6 9.7 7.4 11.1
330 3.2 7.3 4.8 8.9 6.4 10.3
0 3.7 9.6 6.0 10.0 8.5 11.9
EUROSION Case Study
8
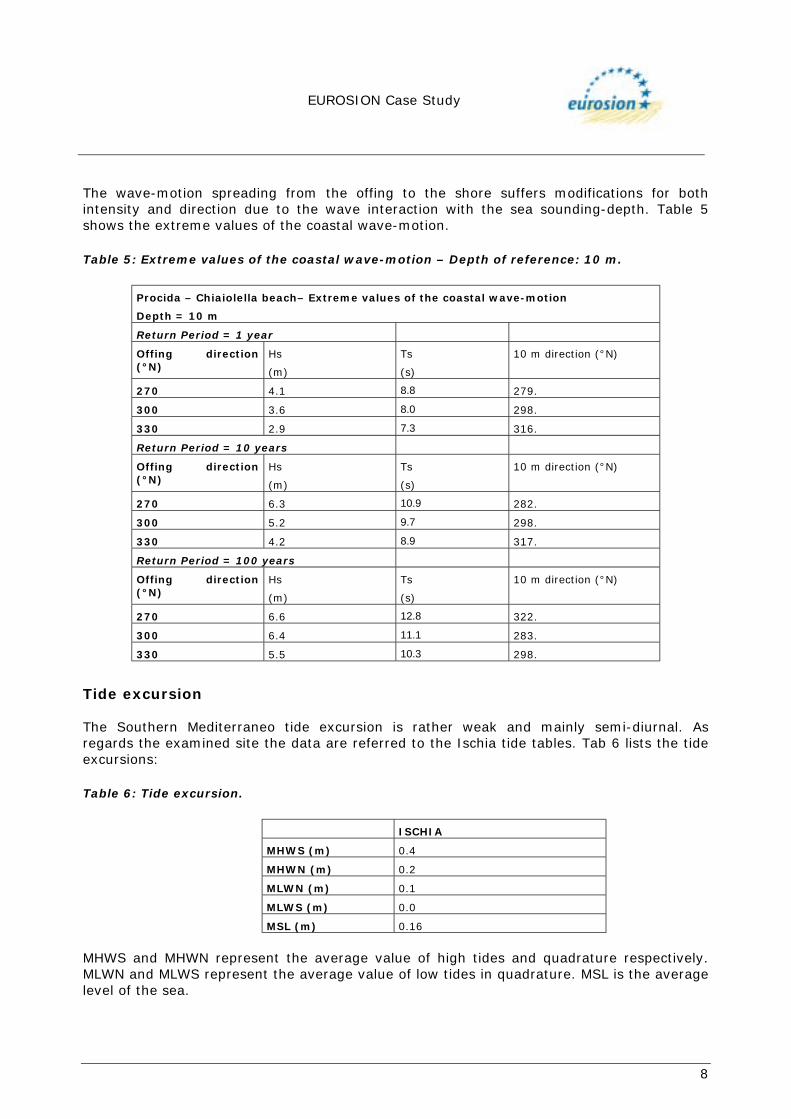
The wave-motion spreading from the offing to the shore suffers modifications for both intensity and direction due to the wave interaction with the sea sounding-depth. Table 5 shows the extreme values of the coastal wave-motion. Table 5: Extreme values of the coastal wave-motion – Depth of reference: 10 m.
Procida – Chiaiolella beach– Extreme values of the coastal wave-motion
Depth = 10 m
Return Period = 1 year
Offing direction (°N)
Hs
(m)
Ts
(s)
10 m direction (°N)
270 4.1 8.8 279.
300 3.6 8.0 298.
330 2.9 7.3 316.
Return Period = 10 years
Offing direction (°N)
Hs
(m)
Ts
(s)
10 m direction (°N)
270 6.3 10.9 282.
300 5.2 9.7 298.
330 4.2 8.9 317.
Return Period = 100 years
Offing direction (°N)
Hs
(m)
Ts
(s)
10 m direction (°N)
270 6.6 12.8 322.
300 6.4 11.1 283.
330 5.5 10.3 298.
Tide excursion The Southern Mediterraneo tide excursion is rather weak and mainly semi-diurnal. As regards the examined site the data are referred to the Ischia tide tables. Tab 6 lists the tide excursions: Table 6: Tide excursion.
ISCHIA
MHWS (m) 0.4
MHWN (m) 0.2
MLWN (m) 0.1
MLWS (m) 0.0
MSL (m) 0.16
MHWS and MHWN represent the average value of high tides and quadrature respectively. MLWN and MLWS represent the average value of low tides in quadrature. MSL is the average level of the sea.
EUROSION Case Study
9
Sea currents regime There are three aspects characterizing the sea currents:
! Density gradient due to the distribution of water masses on a vast scale. ! Astronomic tide. ! Wind action on the sea surface.
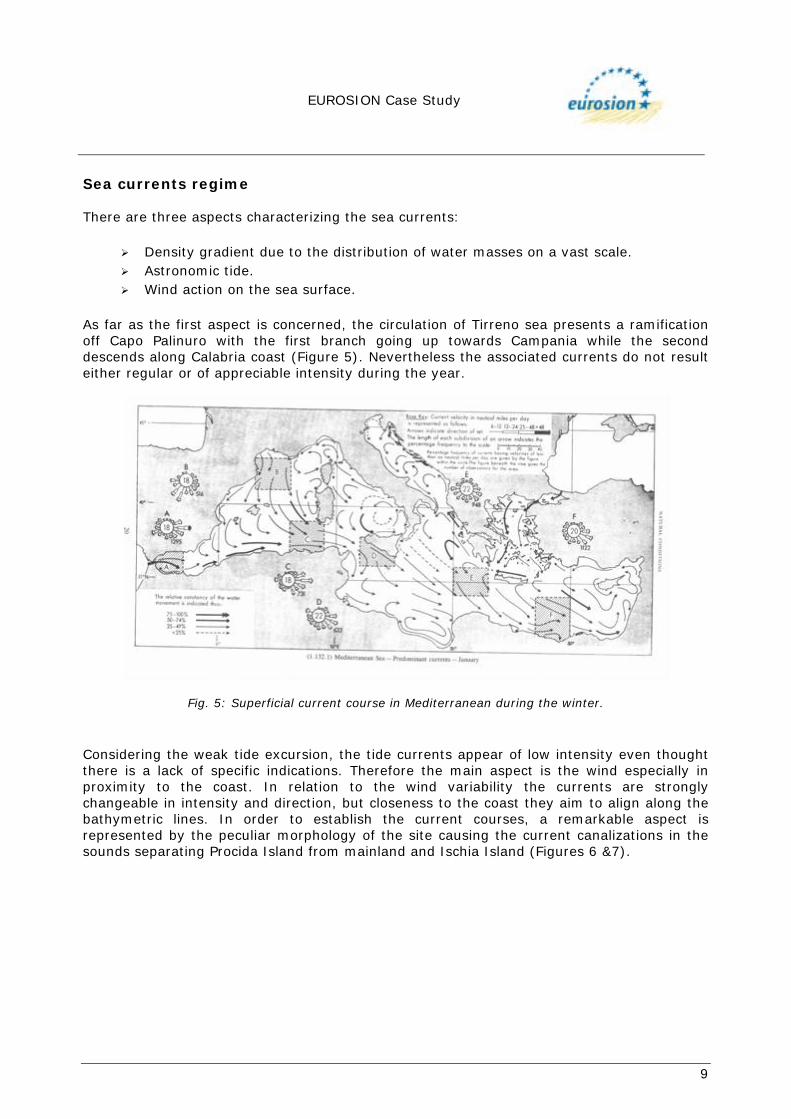
As far as the first aspect is concerned, the circulation of Tirreno sea presents a ramification off Capo Palinuro with the first branch going up towards Campania while the second descends along Calabria coast (Figure 5). Nevertheless the associated currents do not result either regular or of appreciable intensity during the year.
Fig. 5: Superficial current course in Mediterranean during the winter.
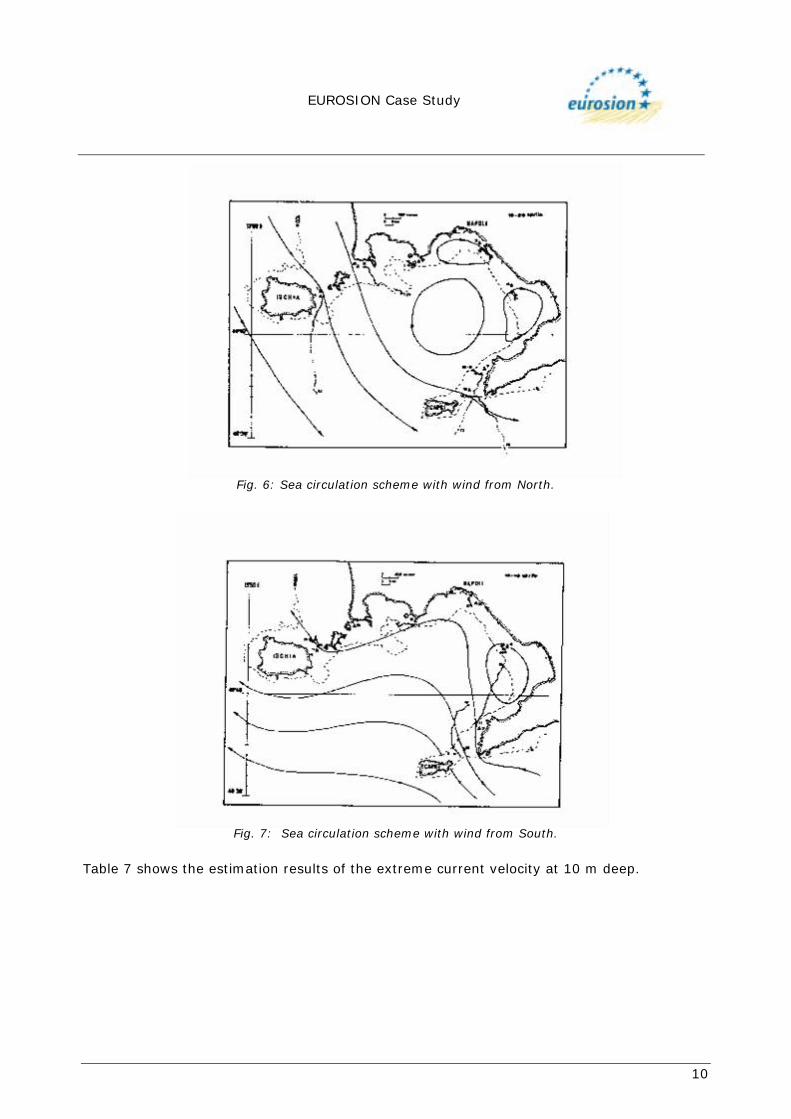
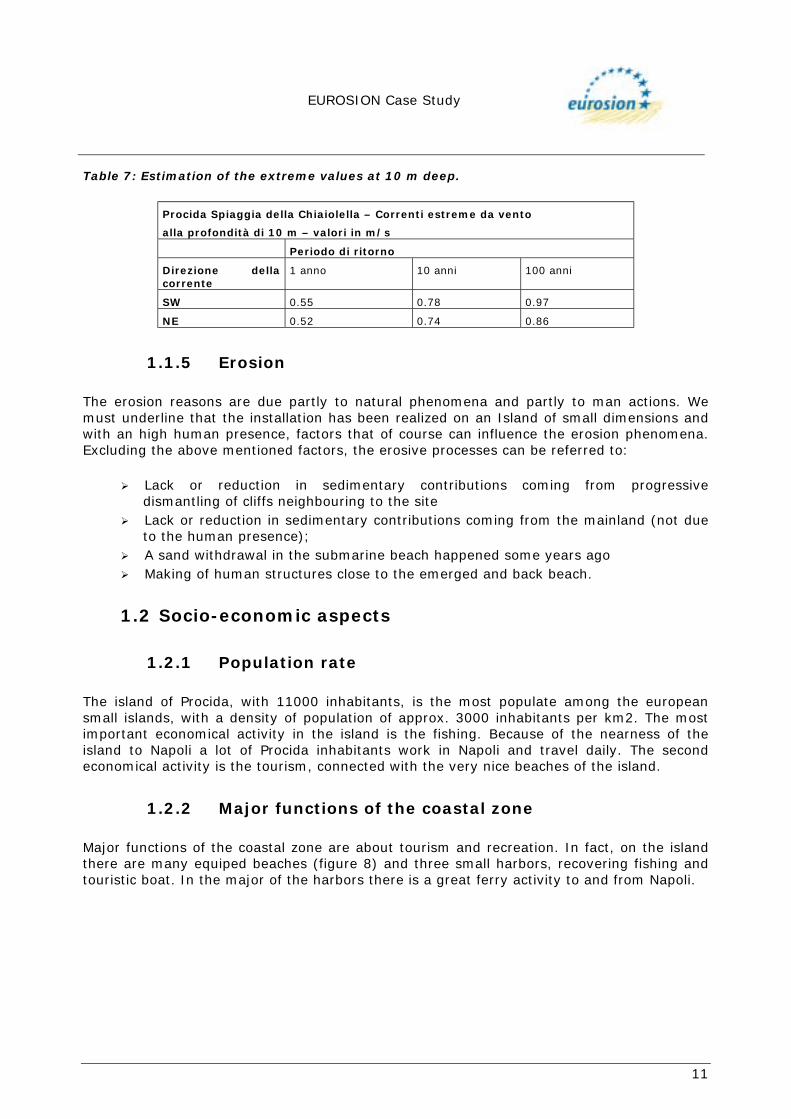
Considering the weak tide excursion, the tide currents appear of low intensity even thought there is a lack of specific indications. Therefore the main aspect is the wind especially in proximity to the coast. In relation to the wind variability the currents are strongly changeable in intensity and direction, but closeness to the coast they aim to align along the bathymetric lines. In order to establish the current courses, a remarkable aspect is represented by the peculiar morphology of the site causing the current canalizations in the sounds separating Procida Island from mainland and Ischia Island (Figures 6 &7).
EUROSION Case Study
10
Fig. 6: Sea circulation scheme with wind from North.
Fig. 7: Sea circulation scheme with wind from South.
Table 7 shows the estimation results of the extreme current velocity at 10 m deep.
EUROSION Case Study
11
Table 7: Estimation of the extreme values at 10 m deep.
Procida Spiaggia della Chiaiolella – Correnti estreme da vento
alla profondità di 10 m – valori in m/s
Periodo di ritorno
Direzione della corrente
1 anno 10 anni 100 anni
SW 0.55 0.78 0.97
NE 0.52 0.74 0.86
1.1.5 Erosion The erosion reasons are due partly to natural phenomena and partly to man actions. We must underline that the installation has been realized on an Island of small dimensions and with an high human presence, factors that of course can influence the erosion phenomena. Excluding the above mentioned factors, the erosive processes can be referred to:
! Lack or reduction in sedimentary contributions coming from progressive dismantling of cliffs neighbouring to the site
! Lack or reduction in sedimentary contributions coming from the mainland (not due to the human presence);
! A sand withdrawal in the submarine beach happened some years ago ! Making of human structures close to the emerged and back beach.
1.2 Socio-economic aspects
1.2.1 Population rate The island of Procida, with 11000 inhabitants, is the most populate among the european small islands, with a density of population of approx. 3000 inhabitants per km2. The most important economical activity in the island is the fishing. Because of the nearness of the island to Napoli a lot of Procida inhabitants work in Napoli and travel daily. The second economical activity is the tourism, connected with the very nice beaches of the island.
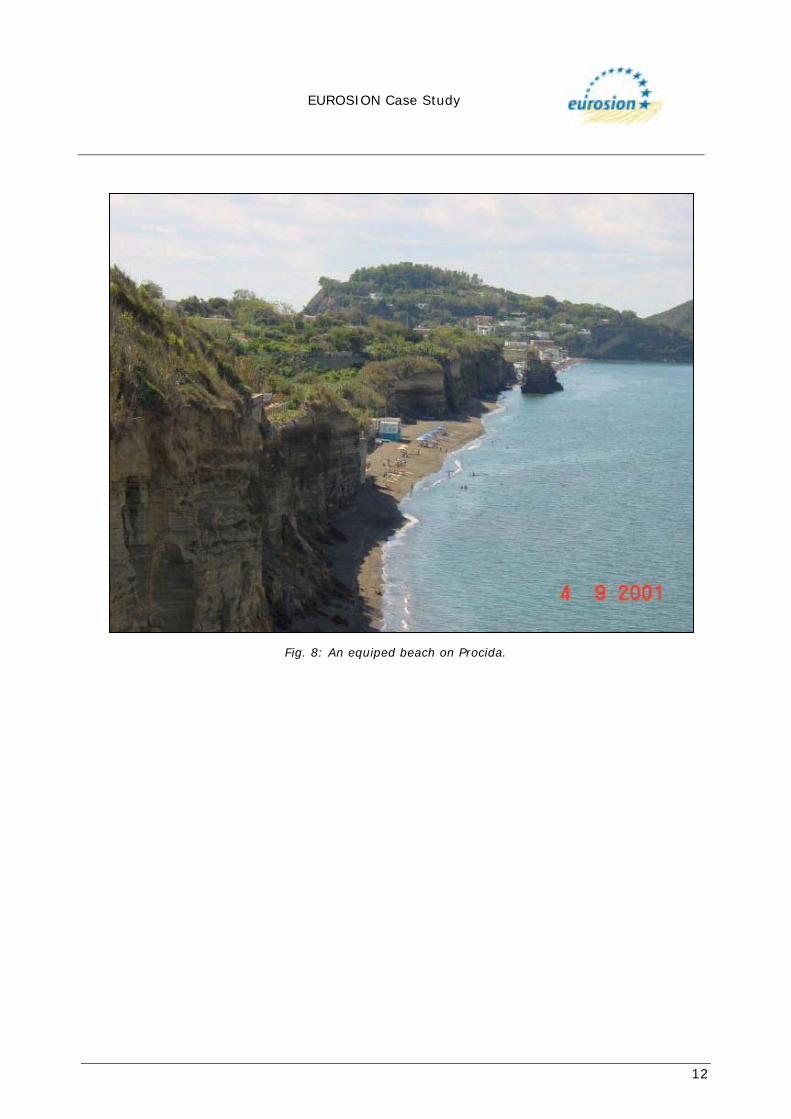
1.2.2 Major functions of the coastal zone Major functions of the coastal zone are about tourism and recreation. In fact, on the island there are many equiped beaches (figure 8) and three small harbors, recovering fishing and touristic boat. In the major of the harbors there is a great ferry activity to and from Napoli.
EUROSION Case Study
12
Fig. 8: An equiped beach on Procida.
EUROSION Case Study
13
2. SOLUTIONS/MEASURES Due to the abundance of beaches, until some years ago the erosion problem was completely neglected. In the last years, in the islands close to Procida (i.e. Ischia), the administration started to deal with this problem by using breakwaters and, above all, artificial nourishment. This last solution did not give good results for the lack of good sand deposit. In Procida island, except for few breakwater, there is not a beach protection policy, but the public administration wants to avoid the use of severe protection works and for this reason they are testing the beach drainage system solution.
EUROSION Case Study
14
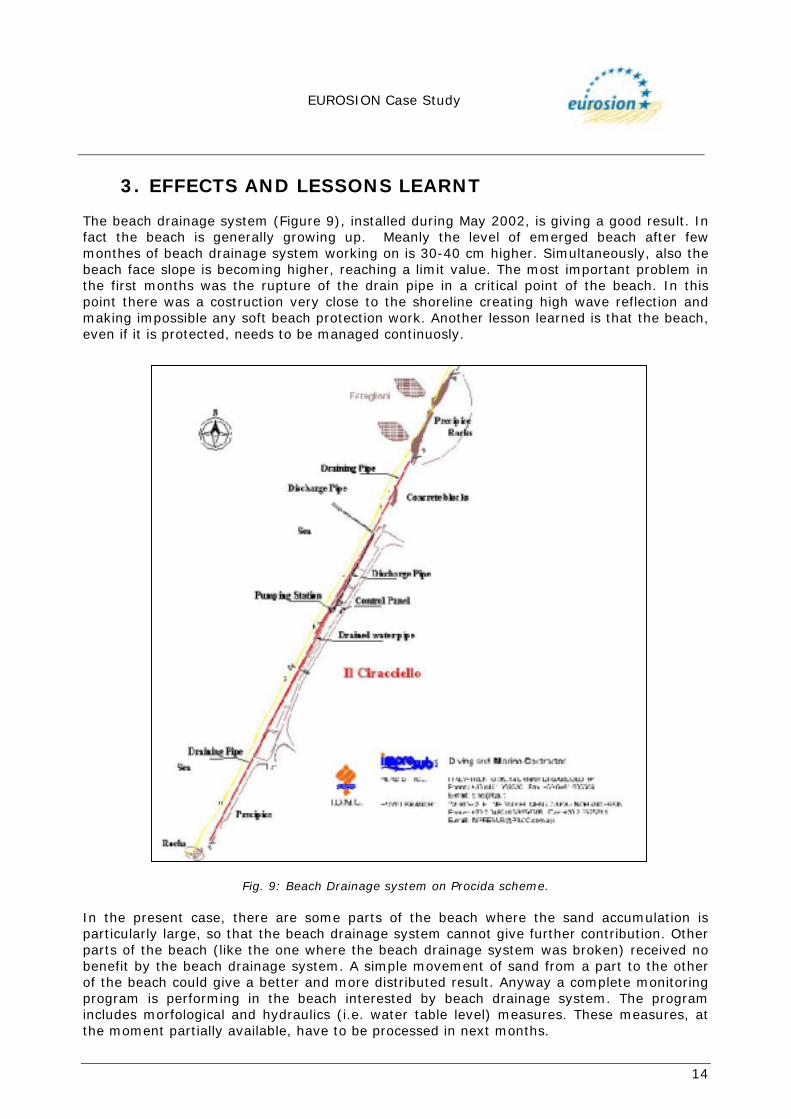
3. EFFECTS AND LESSONS LEARNT The beach drainage system (Figure 9), installed during May 2002, is giving a good result. In fact the beach is generally growing up. Meanly the level of emerged beach after few monthes of beach drainage system working on is 30-40 cm higher. Simultaneously, also the beach face slope is becoming higher, reaching a limit value. The most important problem in the first months was the rupture of the drain pipe in a critical point of the beach. In this point there was a costruction very close to the shoreline creating high wave reflection and making impossible any soft beach protection work. Another lesson learned is that the beach, even if it is protected, needs to be managed continuosly.
Fig. 9: Beach Drainage system on Procida scheme.
In the present case, there are some parts of the beach where the sand accumulation is particularly large, so that the beach drainage system cannot give further contribution. Other parts of the beach (like the one where the beach drainage system was broken) received no benefit by the beach drainage system. A simple movement of sand from a part to the other of the beach could give a better and more distributed result. Anyway a complete monitoring program is performing in the beach interested by beach drainage system. The program includes morfological and hydraulics (i.e. water table level) measures. These measures, at the moment partially available, have to be processed in next months.
EUROSION Case Study
15
4. REFERENCES