Isle of Man Labour Market Report - Isle of Man Government · 3 Historic Isle of Man Registered...
9
Isle of Man Labour Market Report November 2016 Economic Affairs Cabinet Office December 2016
Transcript of Isle of Man Labour Market Report - Isle of Man Government · 3 Historic Isle of Man Registered...

Isle of Man Labour Market Report
November 2016
Economic Affairs
Cabinet Office
December 2016
REGISTERED UNEMPLOYED
MOVEMENTS ONTO/ OFF REGISTER
UNEMPLOYMENT
RATE
VACANCIES
•
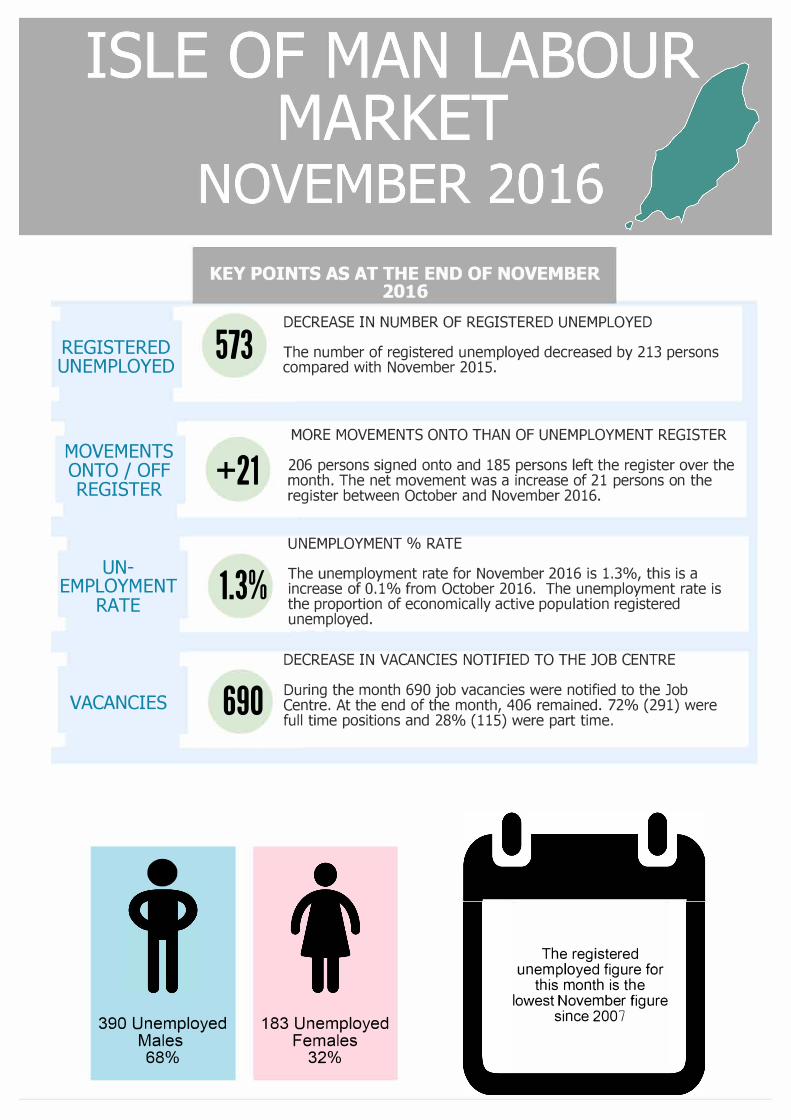
KEY POINTS AS AT THE END OF NOVEMBER
2016
573
+21
1.3%
690
DECREASE IN NUMBER OF REGISTERED UNEMPLOYED
The number of registered unemployed decreased by 213 persons compared with November 2015.
MORE MOVEMENTS ONTO THAN OF UNEMPLOYMENT REGISTER
206 persons signed onto and 185 persons left the register over the month. The net movement was a increase of 21 persons on the register between October and November 2016.
UNEMPLOYMENT % RATE
The unemployment rate for November 2016 is 1.3%, this is a increase of 0.1 % from October 2016. The unemployment rate is the proportion of economically active population registered unemployed.
DECREASE IN VACANCIES NOTIFIED TO THE JOB CENTRE
During the month 690 job vacancies were notified to the Job Centre. At the end of the month, 406 remained. 72% (291) were full time positions and 28% (115) were part time .
390 Unemployed Males
183 Unemployed Females
32%
The registered unemployed figure for
this month is the lowest November figure
since 2007
68%
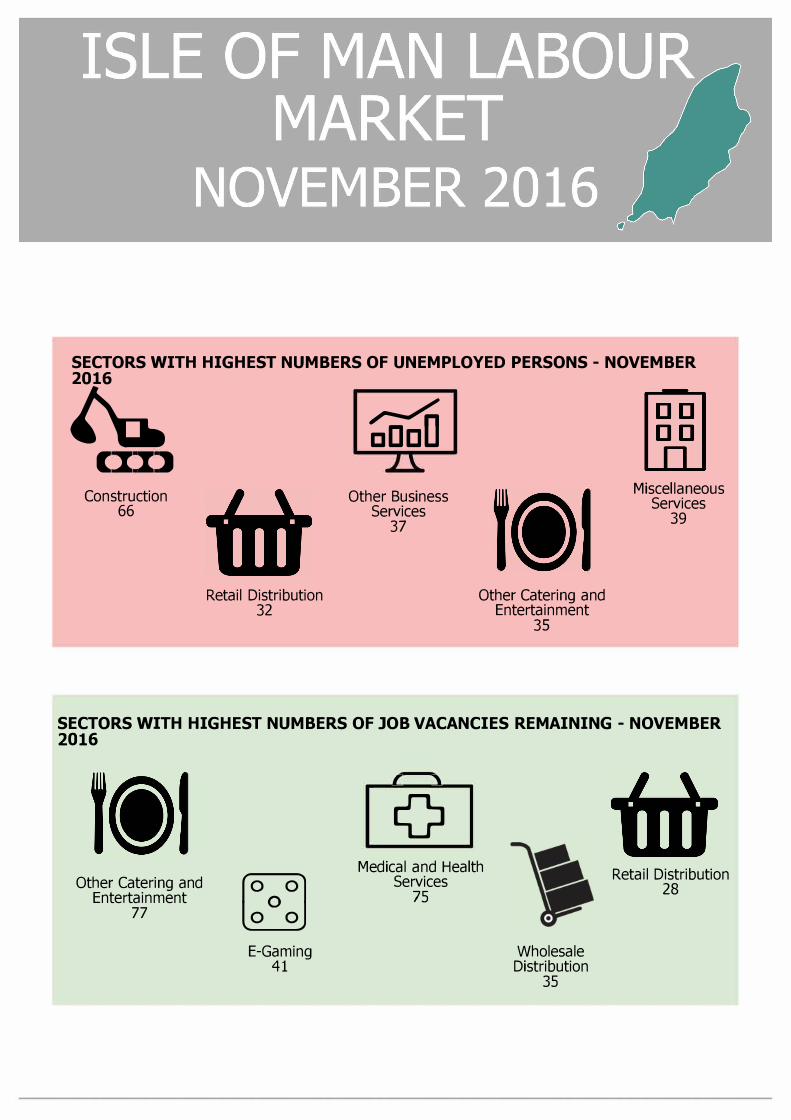
SECTORS WITH HIGHEST NUMBERS OF UNEMPLOYED PERSONS - NOVEMBER
�
CXXJ
Construction 66
Retail Distribution 32
� aaaa
Other Business Services
37
Other Catering and Entertainment
35
Miscellaneous Services
39
SECTORS WITH HIGHEST NUMBERS OF JOB VACANCIES REMAINING - NOVEMBER
2016
Other Catering and Entertainment
77 1'051 �
E-Gaming41
r '
0 Medical and Health
Services 75
Wholesale Distribution
35
Retail Distribution 28
2
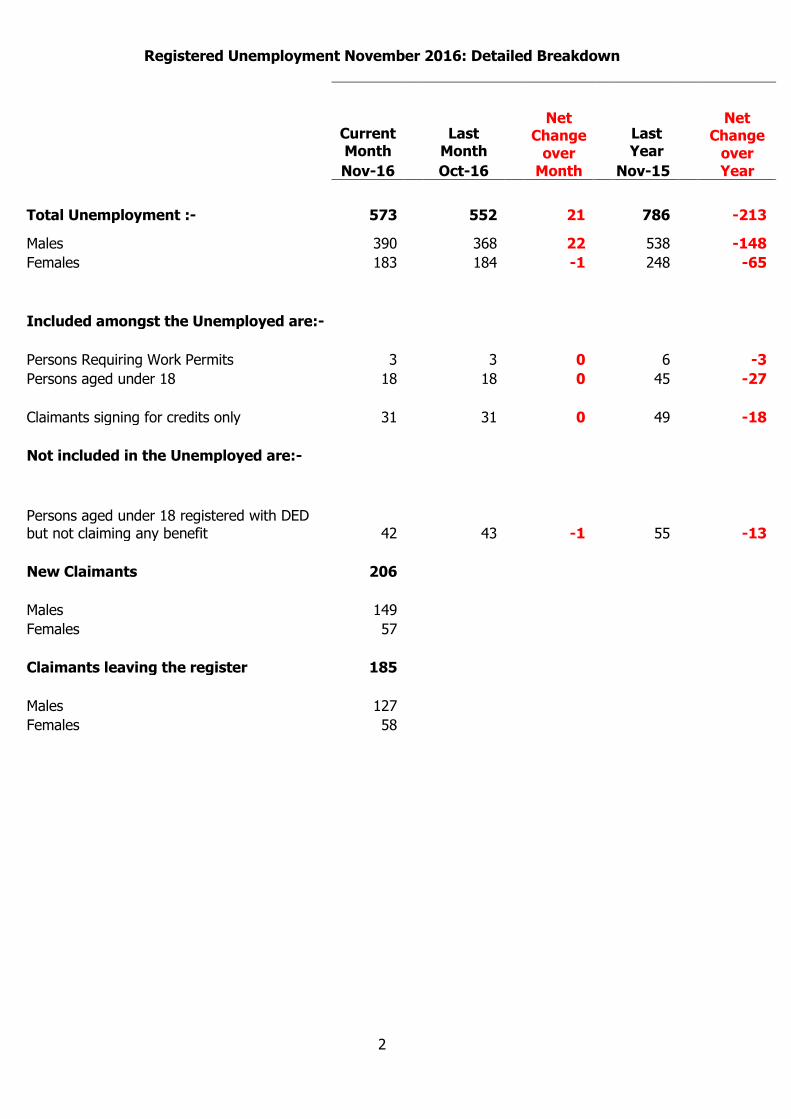
Registered Unemployment November 2016: Detailed Breakdown
Current Month
Last Month
Net Change
over Month
Last Year
Net Change
over Year Nov-16 Oct-16 Nov-15
Total Unemployment :- 573 552 21 786 -213
Males 390 368 22 538 -148
Females 183 184 -1 248 -65
Included amongst the Unemployed are:-
Persons Requiring Work Permits 3 3 0 6 -3
Persons aged under 18 18 18 0 45 -27
Claimants signing for credits only 31 31 0 49 -18
Not included in the Unemployed are:-
Persons aged under 18 registered with DED but not claiming any benefit 42 43 -1 55 -13
New Claimants 206
Males 149
Females 57
Claimants leaving the register 185
Males 127
Females 58
3
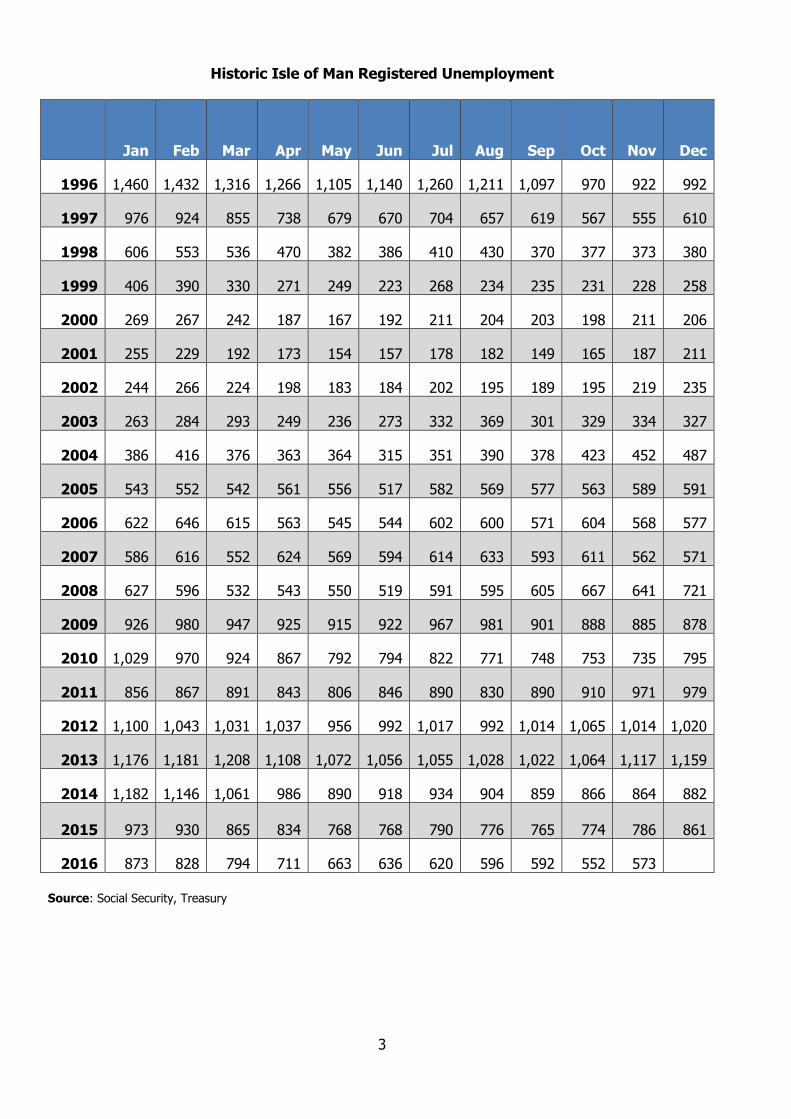
Historic Isle of Man Registered Unemployment
Jan Feb Mar Apr May Jun Jul Aug Sep Oct Nov Dec
1996 1,460 1,432 1,316 1,266 1,105 1,140 1,260 1,211 1,097 970 922 992
1997 976 924 855 738 679 670 704 657 619 567 555 610
1998 606 553 536 470 382 386 410 430 370 377 373 380
1999 406 390 330 271 249 223 268 234 235 231 228 258
2000 269 267 242 187 167 192 211 204 203 198 211 206
2001 255 229 192 173 154 157 178 182 149 165 187 211
2002 244 266 224 198 183 184 202 195 189 195 219 235
2003 263 284 293 249 236 273 332 369 301 329 334 327
2004 386 416 376 363 364 315 351 390 378 423 452 487
2005 543 552 542 561 556 517 582 569 577 563 589 591
2006 622 646 615 563 545 544 602 600 571 604 568 577
2007 586 616 552 624 569 594 614 633 593 611 562 571
2008 627 596 532 543 550 519 591 595 605 667 641 721
2009 926 980 947 925 915 922 967 981 901 888 885 878
2010 1,029 970 924 867 792 794 822 771 748 753 735 795
2011 856 867 891 843 806 846 890 830 890 910 971 979
2012 1,100 1,043 1,031 1,037 956 992 1,017 992 1,014 1,065 1,014 1,020
2013 1,176 1,181 1,208 1,108 1,072 1,056 1,055 1,028 1,022 1,064 1,117 1,159
2014 1,182 1,146 1,061 986 890 918 934 904 859 866 864 882
2015 973 930 865 834 768 768 790 776 765 774 786 861
2016 873 828 794 711 663 636 620 596 592 552 573
Source: Social Security, Treasury

4
Number of Registered Unemployed – November 2013 to November 2016
Source: Social Security, Treasury
Number of Vacancies Received During the Month – November 2013 to November 2016
Note: 12 month moving average
Source: Job Centre, Department of Economic Development
550
650
750
850
950
1050
1150
1250No of Registered Unemployed
12 month moving average
300
350
400
450
500
550
600
650
700
750
800

5
Unemployment and Vacancies by Industrial Sector
Industrial Sector
Unemployed Persons Vacancies Remaining Nov 2016 Nov 2016 Oct 2016 Nov 2015
Agriculture, Forestry & Fishing 7 10 23 5
Manufacturing 14 15 26 11
Construction 66 53 103 4
Utilities 4 4 4 7
Transport & Communication 15 9 12 12
Wholesale Distribution 7 7 4 35
Retail Distribution 32 35 59 28
Insurance 6 5 3 4
Banking 10 6 18 9
Other Financial Institutions 12 16 21 9
Property Owning & Managing 0 0 0 0
Other Business Services 37 33 62 12
Information Communication Technology 2 3 7 5
Legal and Accountancy Services 1 1 0 3
Education / Teaching 15 15 10 21
Medical & Health Services 14 10 15 75
Tourist Accommodation 18 10 31 13
Other Professional or Technical Services 2 3 1 14
Other Catering & Entertainment 35 40 33 77
E-Gaming 0 0 3 41
Miscellaneous Services 39 38 19 17
Public Administration 13 8 15 4
Leaving From Or Arriving On Island 17 18 15 0
Other Benefits, Training Centre, Prison 150 155 214 0
School Leavers, Students etc. 35 36 62 0
Not identified 22 22 26 0
Total 573 552 786 406
Note: Vacancies relate to those open at the end of the month. Sources: Job Centre, Department of Economic Development and Social Security, Treasury

6
Unemployment by Duration and Age of Claimant
Under 20 20 - 29 30 - 39 40 - 49 50 - 59 60 and
Over
Total
Less than 1 month 24 49 28 23 26 11 161 Over 1 and up to 3 months 20 40 23 26 24 6 139 Over 3 and up to 6 months 5 18 14 16 18 13 84 Over 6 and up to 1 year 7 9 10 11 12 9 58 Over 1 year and up to 2 years 7 10 11 22 17 7 74 Over 2 years and up to 4
years * 10 * * 7 10 31 Over 4 years * 5 * 5 10 * 26Total 63 141 91 105 114 59 573
Note: The symbol * has been used to represent figures of less than 5
Long Term Unemployed by Duration
Source: Social Security, Treasury
28%
24% 15%
10%
13%
5% 5%
Less than 1 month
Over 1 and up to 3 months
Over 3 and up to 6 months
Over 6 and up to 1 year
Over 1 year and up to 2 years
Over 2 years and up to 4
years
Over 4 years