ISIS 2d flood modelling of Wicker Riverside/file/URSULA... · 1 ISIS 2D flood modelling of Wicker...
30
ISIS 2D FLOOD MODELLING OF WICKER RIVERSIDE Ed Shaw, Tom Wild and David Lerner Project report no 8 March 2011 ISBN 978-0-9561379-6-8 University of Sheffield, ICOSS Building, 219 Portobello, Sheffield S1 4DP
-
Upload
nguyenphuc -
Category
Documents
-
view
216 -
download
0
Transcript of ISIS 2d flood modelling of Wicker Riverside/file/URSULA... · 1 ISIS 2D flood modelling of Wicker...

ISIS 2D FLOOD MODELLING OF WICKER RIVERSIDE
Ed Shaw, Tom Wild and David Lerner
Project report no 8 March 2011ISBN 978-0-9561379-6-8
University of Sheffield, ICOSS Building, 219 Portobello, Sheffield S1 4DP

1
ISIS 2D flood modelling of Wicker Riverside
Ed Shaw, Tom Wild and David Lerner, URSULA Project, University of Sheffield
Introduction
The URSULA project (www.ursula.ac.uk) is a multidisciplinary research consortium which is using the River Don in Sheffield as a case study to investigate the hypothesis that there are significant social, economic and environmental gains to be made by integrated and innovative interventions in urban river corridors. A number of interventions have been identified, and four alternative scenarios developed for the Wicker Riverside area in Sheffield incorporating different types of intervention. The sustainability of the four scenarios will be assessed, and this information will be used to inform the development of a fifth ‘best go’ scenario that draws on the best elements of the four scenarios.
URSULA reports, of which this is one, fall into two categories. Some account work that is of interest or value to the wider public but not publishable as research. The other kind, as in this case, make transparent unpublished work upon which further URSULA research is built. This URSULA report documents ISIS 2D flood modelling completed by Ed Shaw in the autumn of 2010 as a continuation of initial work undertaken by Tom Wild during the summer of 2010. The objective of the modelling was to compare how extensive flooding would be for the four URSULA Wicker Riverside scenarios under different flood extremes. The completion produced flood maps that were used in the URSULA Information Pack1. The flood maps were presented in the Information Pack to give the viewer a feel for the sustainability of the four URSULA scenarios. The pack was shown to experts of sustainability so that they could judge different aspects of the sustainability of the four Wicker Riverside scenarios.
The initial ISIS 2D flood modelling compared the four URSULA scenarios2 under a 1 in 100 year+cc3 flood return period. The results were viewed as preliminary for several reasons. They did not include all aspects of the completed design of the flood channel option. The degree the unknown variable of debris blocking Lady’s Bridge influenced the results of the modelling had not been tested. The efficacy of the flood channel in S3b in reducing flooding had not been explored, and the ISIS 2D model had not been checked for mistakes. The work was written up as an internal URSULA report ‘Interim results of ISIS 1D-2D linked modelling of flood risk in URSULA Scenarios for Wicker Riverside’ (Wild et al. 2010).
This work was continued by Ed Shaw in the autumn of 2010, to which there were several objectives: • To update the S3b model as certain design aspects needed to be included in this model:
(i) The parts of the design that provided flood defence (ii) An updated path for the flood channel that avoided the new Smithfield Bridge
• To incorporate an improved LIDAR created by Ed Morgan into the models • To examine the influence of constricting the orifice of Lady’s Bridge to simulate blockage by
debris during flooding • To test whether the flood channel reduced the extent of flooding at Wicker Riverside • To compare the extent of flooding at Wicker Riverside for each scenario to create a summary
of performance for the URSULA Information Pack
1 Published as URSULA Project Report No. 7, and will be uploaded on the outputs section of the URSULA website (http://www.ursula.ac.uk/Outputs/Reports). 2 See page 2. 3 ‘+cc’ denotes that this flood return period has had the impact of climate change factored in.
2
The purpose of this document is to inform the reader of the details of the modelling process through which the Information Pack flood maps were constructed. Decisions and assumptions made are explicitly presented so that the reader may understand the process and its caveats.
Model details
The upstream boundary for 1D modelling is at Kelham Weir. The downstream boundary is at Burton Weir (also known as Norfolk Weir). The extent used in the 2D analysis (Figure 1), is roughly the same as that used in the rest of the URSULA project. 2D flood modelling focussed on the Wicker area (left bank, looking downstream) from Corporation Bridge down to the Wicker Viaduct. Return periods of 1 in 5, 10, 25, 50, 100, 200, and 1000 year floods were used in the modelling. In the 2D model, a time-step of 2 seconds and a grid size of 4 LIDAR units (0.25m2) were used. The difference between the scenarios modelled are summarised below:
Scenario 1 (S1): ‘As Is’
Channels modelled to exclude EA clearances of shoal islands and vegetation carried out in late 2009 / early 2010. No changes to Wicker Weir (also known as Lady’s Bridge Weir).
• No flood defences included in 2D models or 1D models.
Scenario 2 (S2): ‘Near Future’ - Sheffield City Council - Environment Agency scheme
• Channels modelled to include EA clearances of shoal islands and vegetation. Lariniar fish pass installed on Wicker Weir.
• Flood defences included in 2D models and/or 1D models, based on data and images supplied by SCC in feasibility study and subsequent engineering drawings. These are composed of walls that run parallel to the river.
Scenario 3a (S3a): ‘URSULA Streets’ – Retrofit / Hard Landscape
• Channels modelled to exclude EA clearances of shoal islands and vegetation. Rock ramp fish pass included at Wicker Weir.
• Flood defences included in 2D models and/or 1D models, based on data and images supplied by SCC in feasibility study and subsequent engineering drawings. These are composed of walls that run parallel to the river, and are the same as in S2.
Scenario 3b (S3b): ‘URSULA Park’ – Making Space for Water
• Channels modelled to exclude EA clearances of shoal islands and vegetation. Wicker Weir completely removed.
• Flood defences included in 2D models designed as part of the ‘URSULA Park’ scenario. These are composed of either walls, deployable barriers or buildings designed to be flood proof, which provide contiguous defences along the flood channel, as well as along parts of the river channel.
• ‘Flood alleviation channel’ included for conveyance (and only minor storage), and to bypass Wicker Weir, Lady’s Bridge and Blonk Bridge, which are known bottlenecks.

3
Figure 1. The red square denotes the boundary of the LIDAR used in the ISIS 2d analysis.
Changes to Scenario 3b (S3b): ‘URSULA Park’ and the new LIDAR
As the work to design the landscape and layout of S3b was completed following the initial modelling, it became apparent that the ISIS 2D model of S3b needed updating with new information. The path of the flood channel was found to run through the new Smithfield Bridge that reaches over the Don connecting Wicker Riverside to the east bank. As a consequence, the LIDAR was altered by Ed Morgan using Simmetry 3D so that the flood channel passed north of the bridge.
More significantly, the results of the modelling showed that the completed S3b design contained structures that would defend the site from flooding. These flood defences were composed of walls, deployable barriers, and flood resilient buildings that formed contiguous barriers along either side of the flood channel and parts of the river channel (See Figure 2). To capture the spatial layout of these defences in the ISIS model, the design of S3b was imported into GIS, and a polyline was created by tracing the line of the defences. This polyline could then be imported directly into ISIS Mapper and assigned a height to which it blocks the flow of water, which was approximately 1m above the height of the LIDAR.

4
Figure 2. Red lines mark location of flood defences in S3b. The original LIDAR which was used in the initial modelling was improved and cut to a smaller area to trim unnecessary coverage reducing file size. As the extent of the new LIDAR no longer totally encompassed the ISIS 2D ‘active area’ and ‘computational area’ files, then new versions had to be created, as well as all derived files (e.g. the link files). These files were then used in the subsequent models built for the other three scenarios to avoid the confounding effect of mixing different model setup conditions. As a consequence, all files used in the ISIS 2D modelling by Ed Shaw differ from those used in the initial modelling, with the exception of the polyline files that represent flood defences in S2 and S3a (See Figure 3).
Figure 3. Red lines mark location of flood defences in S2 and S3b. These are unchanged from the initial modelling by Tom Wild.

5
The same LIDAR minus the flood channel was also used in S1, S2 and S3a. This meant that differences between scenarios in terms of buildings were not represented in the terrain of the LIDAR. Given the large area taken up by the flood channel in the S3b design, many buildings are missing from their respective LIDARs. While not ideal, this is an accepted issue with overland flood modelling. Regardless of whether a building is present or absent in the LIDAR, both alternatives are not representative of reality. Where buildings are present, they pose impermeable barriers to the flow of water, whereas in reality water often flows through buildings. Where buildings are absent, the influence they have on the flow of water through the site is missed. To date, ISIS 2D does not adequately deal with the influence of buildings on overland flooding. The confounding effect of building absence or presence on the results of the ISIS 2D modelling is likely to be relatively small or equal to uncertainty from other accepted sources, such as the crude resolution of the data in the ISIS 1D models. Consequently it is suggested the LIDAR used is satisfactory.
Influence of debris blocking Lady’s Bridge on overland flooding in S3b
During the flooding of 2007 in South Yorkshire, it was widely reported that debris accumulated upstream of bridges, blocking their orifices, and potentially exacerbating flooding. To investigate the influence of debris blocking Lady’s Bridge (See Figure 4) on the results of the ISIS modelling, the results of the scenario 3b model were compared with model versions that had the orifice of Lady’s Bridge constrained to 80% and 60% its normal size (See Figure 5). The water depth of point (a) in the flood channel (See Figure 4) was recorded under peak flood for the 1 in 5, 10, 25, 50, 75, 100, and 200 hydrographs and is recorded in Figure 6.
Figure 4. Point (a) in flood channel from which water depth was measured. LB denotes Lady’s Bridge.

6
Figure 5. Cross section of Lady’s Bridge with orifice size at 100% (a), constrained to 80% normal size (b), and constrained to 60% normal size (c).
Figure 6 shows that by constraining the orifice of Lady’s Bridge to 60% usual size (believed to be an extreme scenario), an additional depth of 20 - 40 cm of depth can be expected to occur in the flood channel. However, it is not known which of the bridge constriction scenarios is most realistic. For this reason, all the results produced for the Information Pack were based on models with no constriction of the orifice of Lady’s Bridge (this is also the case for the Halcrow model of the Don from which the 1D model was adapted). Therefore, the effect of debris blocking Lady’s Bridge must be borne in mind as a source of uncertainty in the results of the ISIS 2D modelling.

7
Figure 6. Water depth at point (a) under 1 in 5 to 1 in 200 year flood return periods for versions of Scenario 3b where the orifice of Lady’s Bridge is 100% open, constrained to 80% and constrained to 60%.
Does the flood channel reduce overland flooding in S3b?
The flood channel was proposed in an URSULA workshop as a possible intervention at Wicker Riverside to mitigate flooding at the site. It was hypothesised that Lady’s Bridge and Lady’s Bridge Weir create a bottle neck that causes increased water levels upstream and therefore more severe flooding at Wicker Riverside. By creating a bypass of this bottle neck, there should be reduced flooding in the flood channel. To test this hypothesis, the results of two versions of the scenario 3b model with the orifice of Lady’s Bridge constrained to 60% were compared with and without the flood channel in the LIDAR terrain. Water level was measured at point (a) (Figure 4) and results are shown in Figure 7.
Figure 7. Water level at point (a) under 1 in 5 to 1 in 200 year flood return periods for versions of Scenario 3b (orifice of Lady’s Bridge constrained to 60%) with the flood channel present and absent.

8
Figure 7 shows that if the flood channel is not present, then the water levels at point (a) are typically between 30-50cm higher. In conclusion, the evidence produced by the model suggests that the flood channel has a large impact on the water level of water flowing onto Wicker Riverside under scenario 3b. Model correction by Peter Wells of ISIS support
In the initial modelling by Tom Wild and that immediately following by Ed Shaw, model instability was a major issue, with crashes occurring frequently. Certain combinations of flood return periods and design scenarios were almost impossible to run. As this was causing a great delay in time, and raised concerns about the validity of the model, ISIS support were consulted to check the model.
ISIS support found the link file was in an unstable set up. The Halcrow guidance used to initially construct the model implicitly suggested that the link line was one line by referring to it as singular and describing it as running the length of the boundary of the active area and river. This led to it being set up as a single line. Instead, ISIS support clarified that one link line was needed for each pair of ISIS 1d river nodes, meaning there should be 15 in total. On correcting the model, stability increased substantially and crashes became infrequent. By having an ISIS 2d expert look over the model checking for problems, we can have more confidence that the model has been set up correctly.
The Information Pack
It is important that the information provided by the Information Pack should be easy to digest by its intended readers: those experts in a discipline with potentially no prior knowledge of Wicker Riverside and little about the URSULA project. Consequently, information must be presented clearly, succinctly, and be limited to the most pertinent facts relevant to the reader. Therefore, information presented in the Information Pack on the results of the flood modelling for each scenario are restricted to flood maps for the 1 in 100 year flood return period, a small amount of text for each scenario on their attributes, and where and when flooding occurs. This document is available in Appendix A. All additional flood maps and other information deemed potentially relevant are available as an appendix to the Information Pack, and as Appendix B to this document. The 1 in 100 year flood return period is an appropriate return period on which to base the flood maps in the Information Pack for several reasons: it is severe enough to cause flooding in most of the scenarios; it is a flood event that is not unlikely to occur in the lifetime of the developments proposed for Wicker Riverside; and it is a return period over which decision makers often make decisions based on the predicted severity of floods. The 1in 100 year+cc flood return period was n’ot used, as unlike the 1 in 100 year flood return period it was not part of a sequence of hydrographs of increasing severity, and so was less useful for comparisons.

9
Appendix A
Comparison of flood extents for the four URSULA scenarios modelled using ISIS 2D
Scenario 1 (S1): ‘As Is’
Figure 1. Maximum extent of a 1 in 100 return period flood for scenario 1.
Scenario details
• Channels modelled to exclude EA clearances of shoal islands and vegetation carried out in late 2009 / early 2010. No changes to weirs.
• No new flood defences included in 2D models or 1D models.
Results (See Appendix for more details)
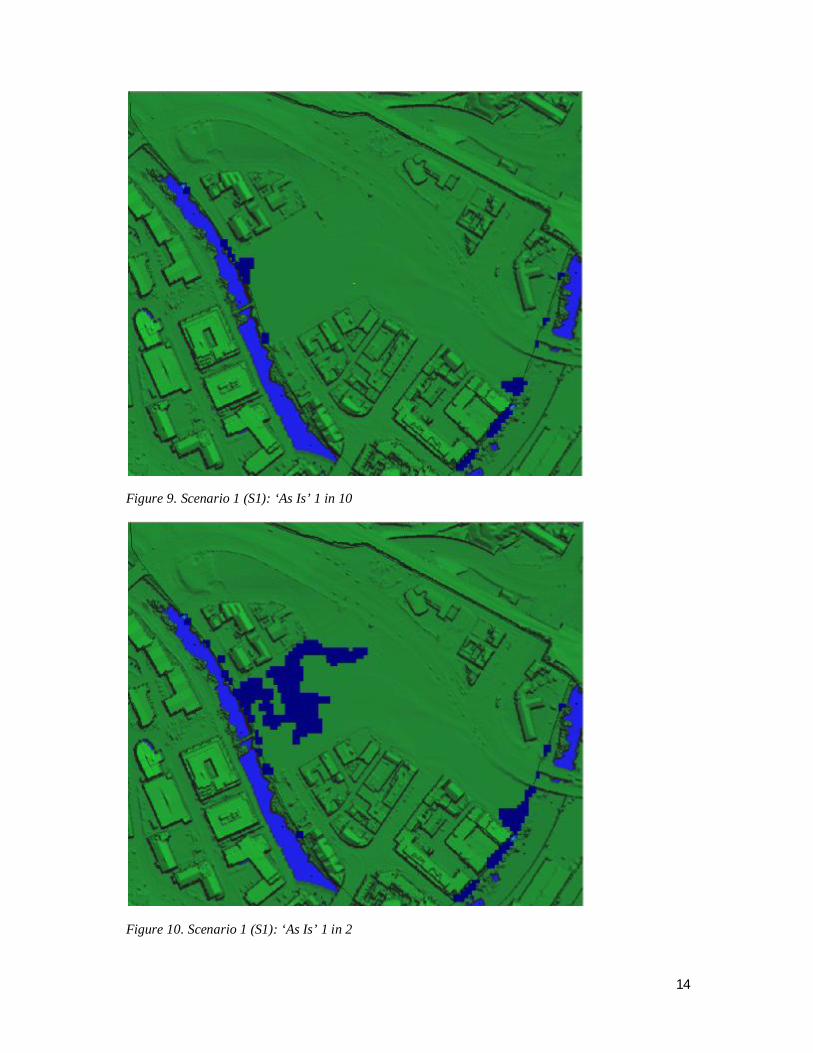
• Minor flooding occurs on the western side of the site at between a 1 in 10 and 1 in 25 flood return period.
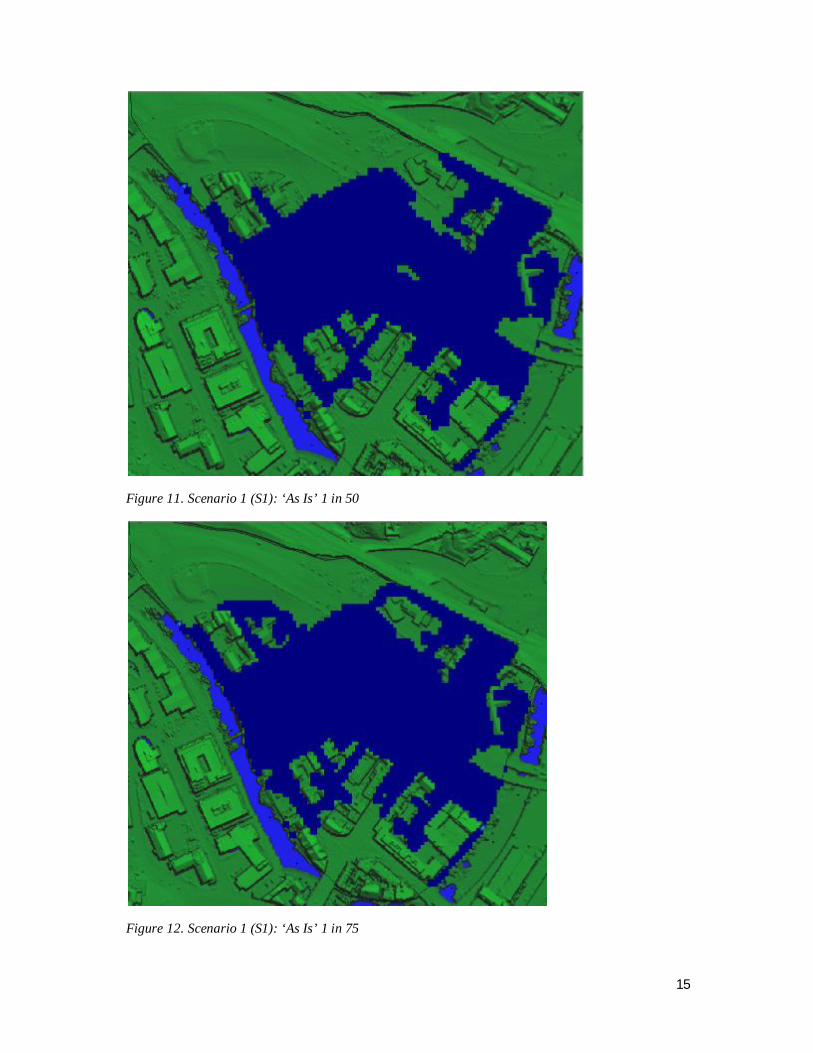
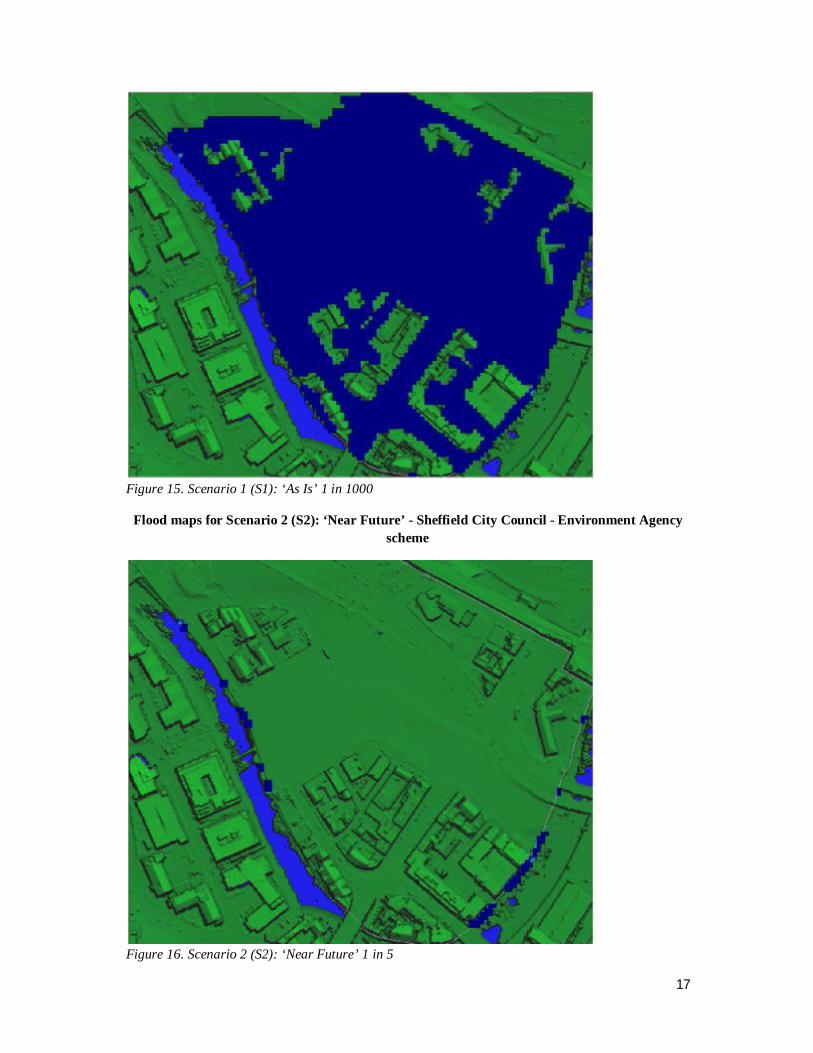
• From a 1 in 50 flood return period and beyond flooding is extensive.
10
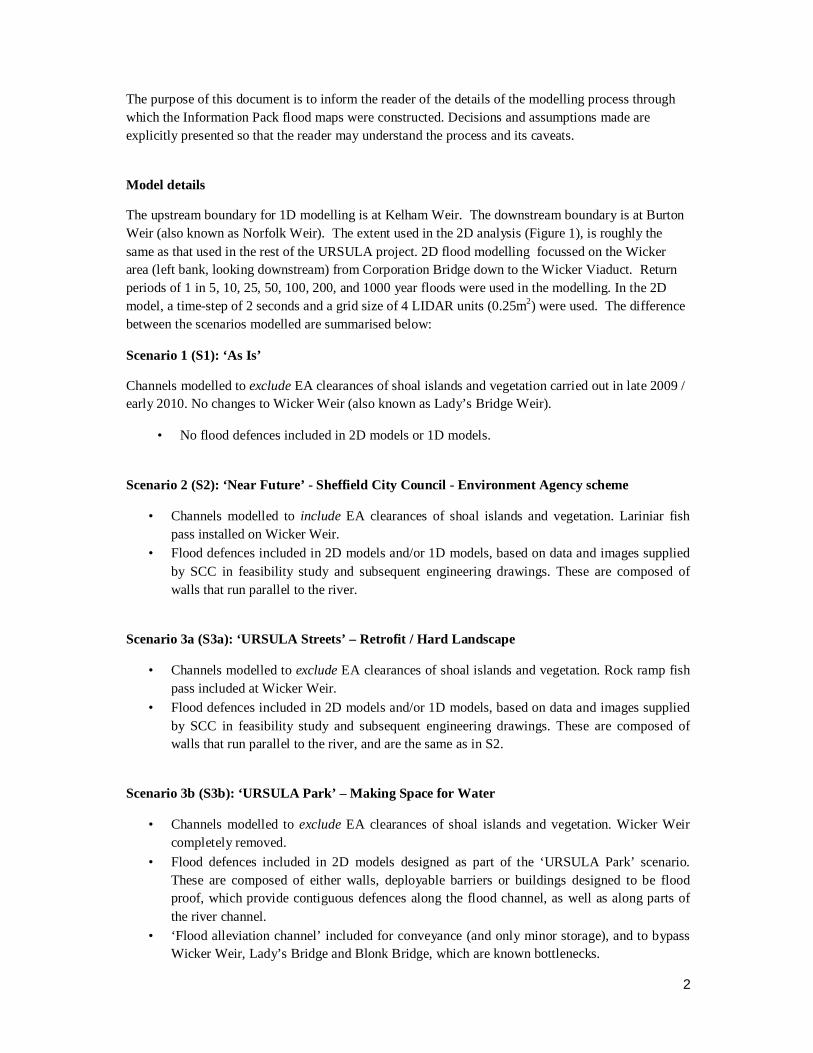
Scenario 2 (S2): ‘Near Future’ - Sheffield City Council - Environment Agency scheme
Figure 2. Maximum extent of a 1 in 100 return period flood for scenario 2.
Scenario details
• Channels modelled to include EA clearances of shoal islands and vegetation. Lariniar fish pass installed on Wicker Weir.
• Flood defences included in 2D models and/or 1D models, based on data and images supplied by SCC in feasibility study and subsequent engineering drawings. These are composed of walls that run parallel to the river.
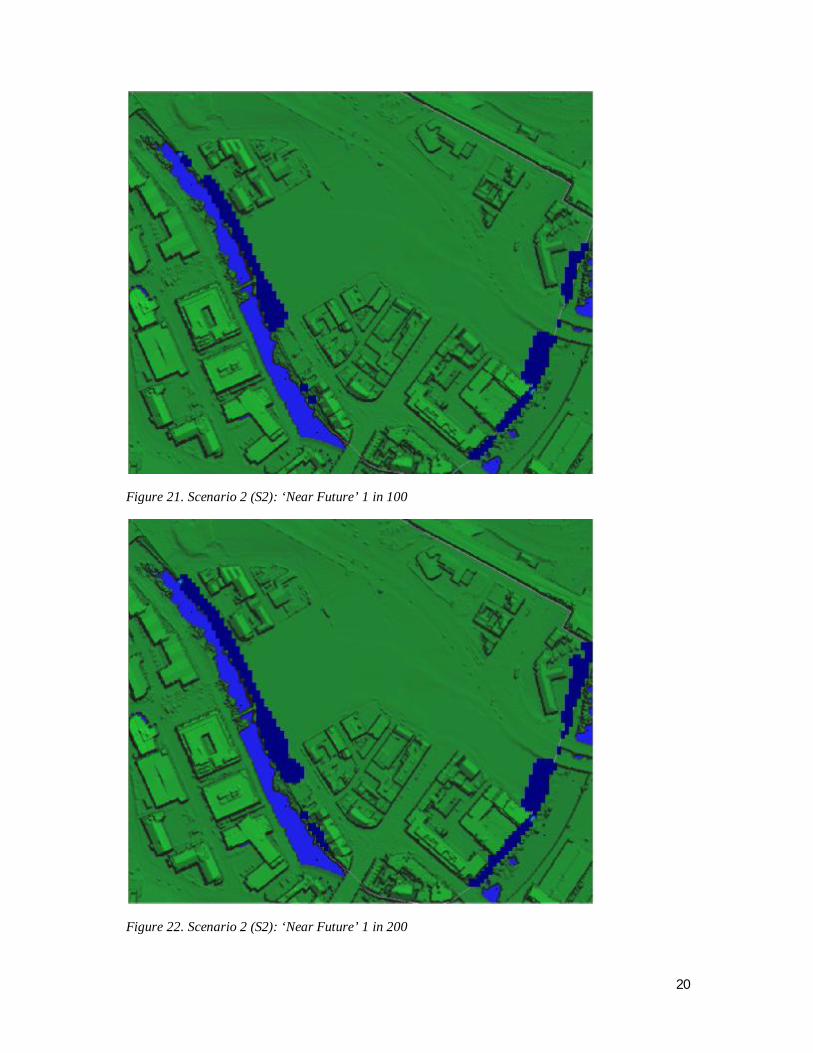
Results (See Appendix for more details) • Site protected to a 1 in 1000 flood return period
11
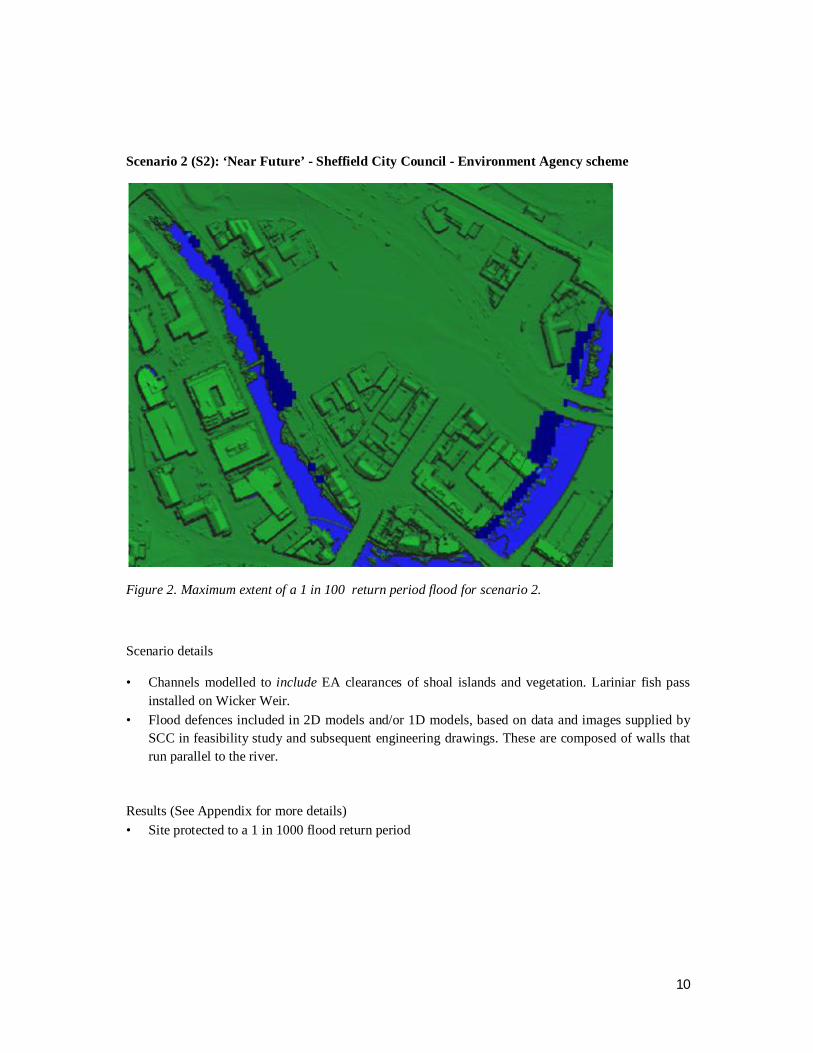
Scenario 3a (S3a): ‘URSULA Streets’ – Retrofit / Hard Landscape
Figure 3. Maximum extent of a 1 in 100 return period flood for scenario 3a.
Scenario details
• Channels modelled to exclude EA clearances of shoal islands and vegetation. Rock ramp fish pass included at Wicker Weir.
• Flood defences included in 2D models and/or 1D models, based on data and images supplied by SCC in feasibility study and subsequent engineering drawings. These are composed of walls that run parallel to the river, and are the same as in Option 2.
Results (See Appendix for more details) • Site protected to a 1 in 200 flood return period • Site extensively flooded at a 1 in 1000 flood return period
12
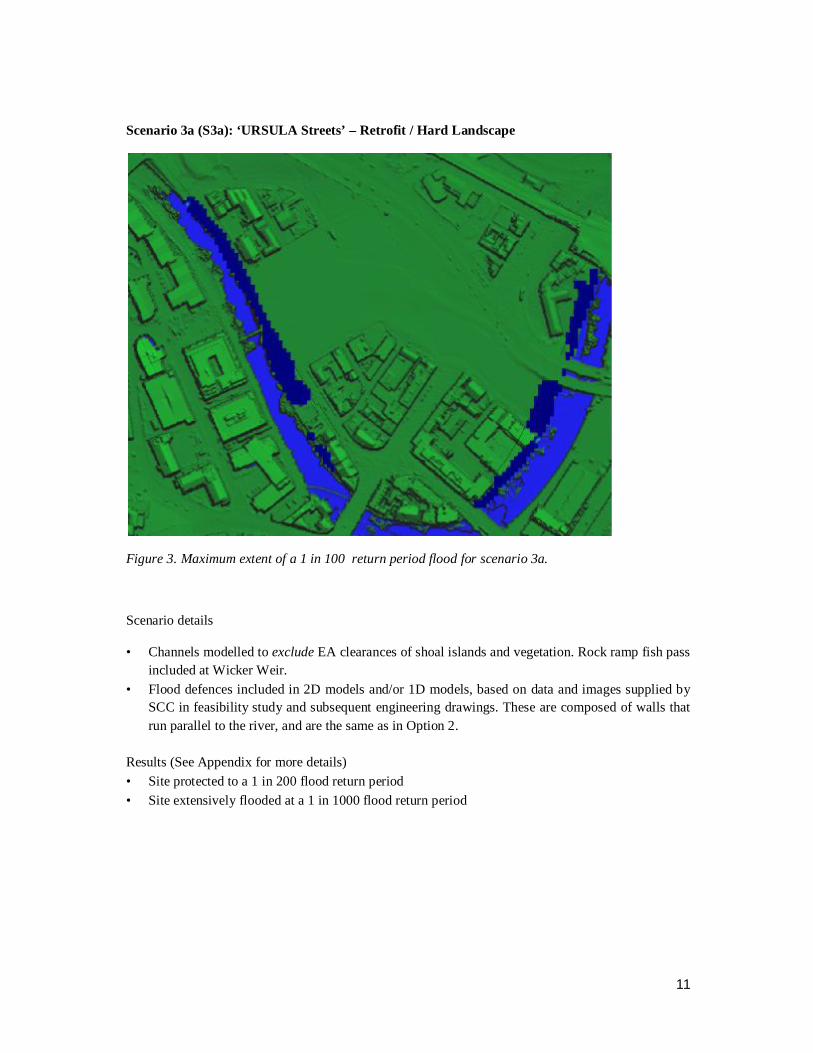
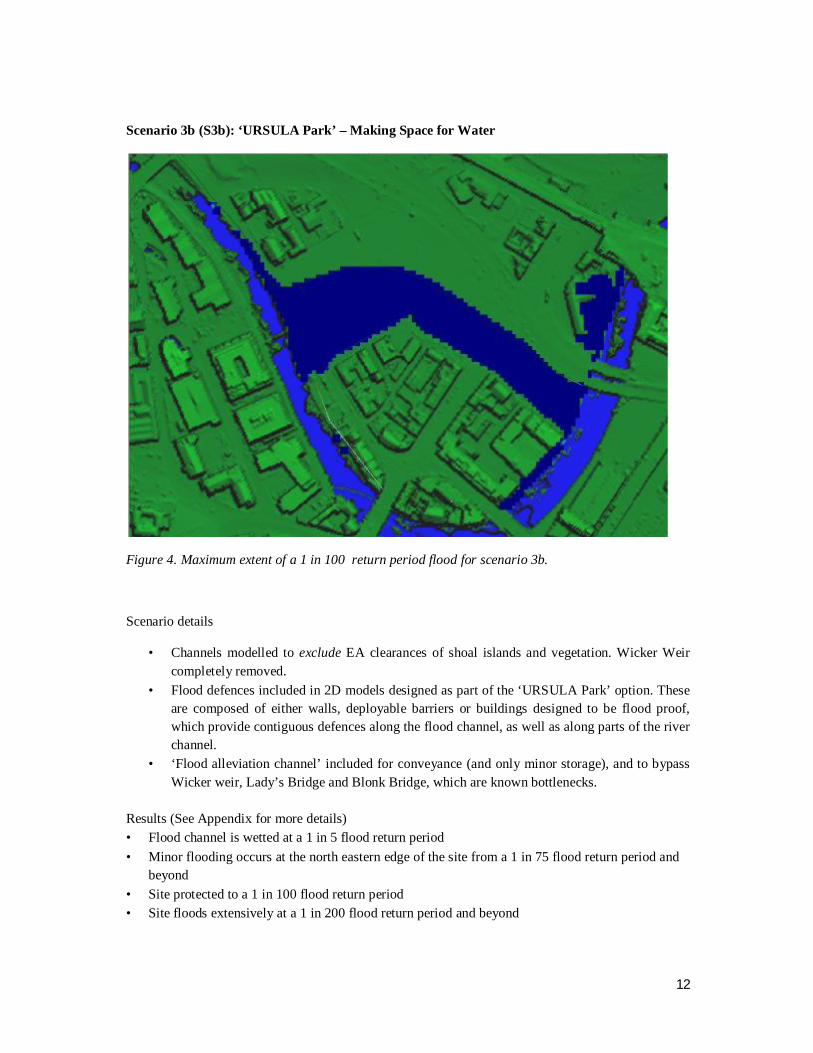
Scenario 3b (S3b): ‘URSULA Park’ – Making Space for Water
Figure 4. Maximum extent of a 1 in 100 return period flood for scenario 3b.
Scenario details
• Channels modelled to exclude EA clearances of shoal islands and vegetation. Wicker Weir completely removed.
• Flood defences included in 2D models designed as part of the ‘URSULA Park’ option. These are composed of either walls, deployable barriers or buildings designed to be flood proof, which provide contiguous defences along the flood channel, as well as along parts of the river channel.
• ‘Flood alleviation channel’ included for conveyance (and only minor storage), and to bypass Wicker weir, Lady’s Bridge and Blonk Bridge, which are known bottlenecks.
Results (See Appendix for more details) • Flood channel is wetted at a 1 in 5 flood return period • Minor flooding occurs at the north eastern edge of the site from a 1 in 75 flood return period and
beyond • Site protected to a 1 in 100 flood return period • Site floods extensively at a 1 in 200 flood return period and beyond

13
Appendix B
1. Flood maps for the 1 in 5, 10, 25, 50, 75, 100, 200, 1000 flood return periods for all scenarios
Flood maps for Scenario 1 (S1): ‘As Is’
Figure 8. Scenario 1 (S1): ‘As Is’ 1 in 5
14
Figure 9. Scenario 1 (S1): ‘As Is’ 1 in 10
Figure 10. Scenario 1 (S1): ‘As Is’ 1 in 2
15
Figure 11. Scenario 1 (S1): ‘As Is’ 1 in 50
Figure 12. Scenario 1 (S1): ‘As Is’ 1 in 75

16
Figure 13. Scenario 1 (S1): ‘As Is’ 1 in 100
Figure 14. Scenario 1 (S1): ‘As Is’ 1 in 200
17
Figure 15. Scenario 1 (S1): ‘As Is’ 1 in 1000
Flood maps for Scenario 2 (S2): ‘Near Future’ - Sheffield City Council - Environment Agency scheme
Figure 16. Scenario 2 (S2): ‘Near Future’ 1 in 5

18
Figure 17. Scenario 2 (S2): ‘Near Future’ 1 in 10
Figure 18. Scenario 2 (S2): ‘Near Future’ 1 in 25

19
Figure 19. Scenario 2 (S2): ‘Near Future’ 1 in 50
Figure 20. Scenario 2 (S2): ‘Near Future’ 1 in 75
20
Figure 21. Scenario 2 (S2): ‘Near Future’ 1 in 100
Figure 22. Scenario 2 (S2): ‘Near Future’ 1 in 200
21
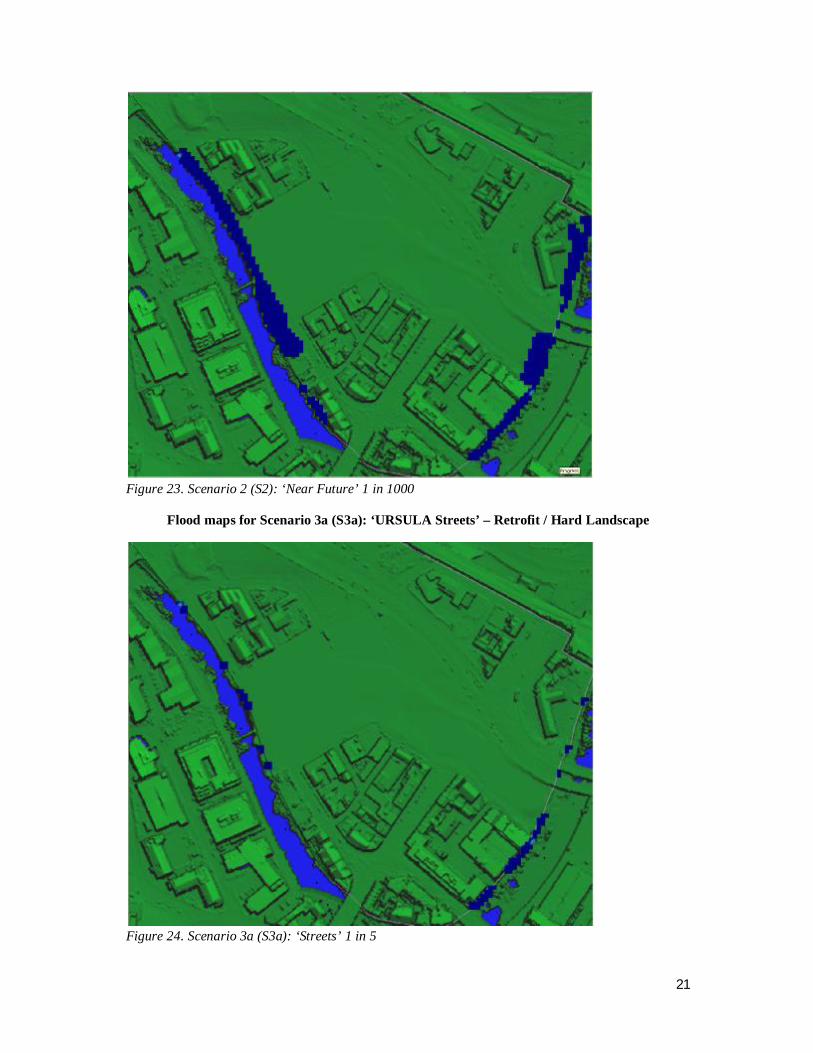
Figure 23. Scenario 2 (S2): ‘Near Future’ 1 in 1000
Flood maps for Scenario 3a (S3a): ‘URSULA Streets’ – Retrofit / Hard Landscape
Figure 24. Scenario 3a (S3a): ‘Streets’ 1 in 5
22
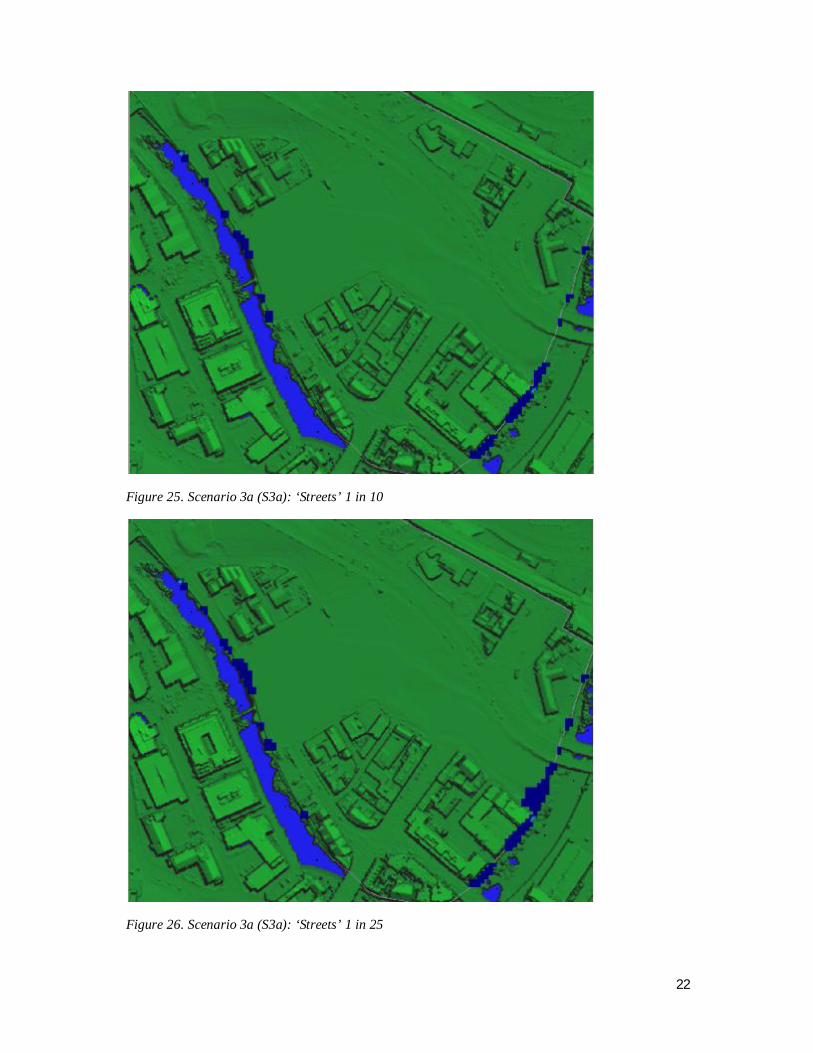
Figure 25. Scenario 3a (S3a): ‘Streets’ 1 in 10
Figure 26. Scenario 3a (S3a): ‘Streets’ 1 in 25
23
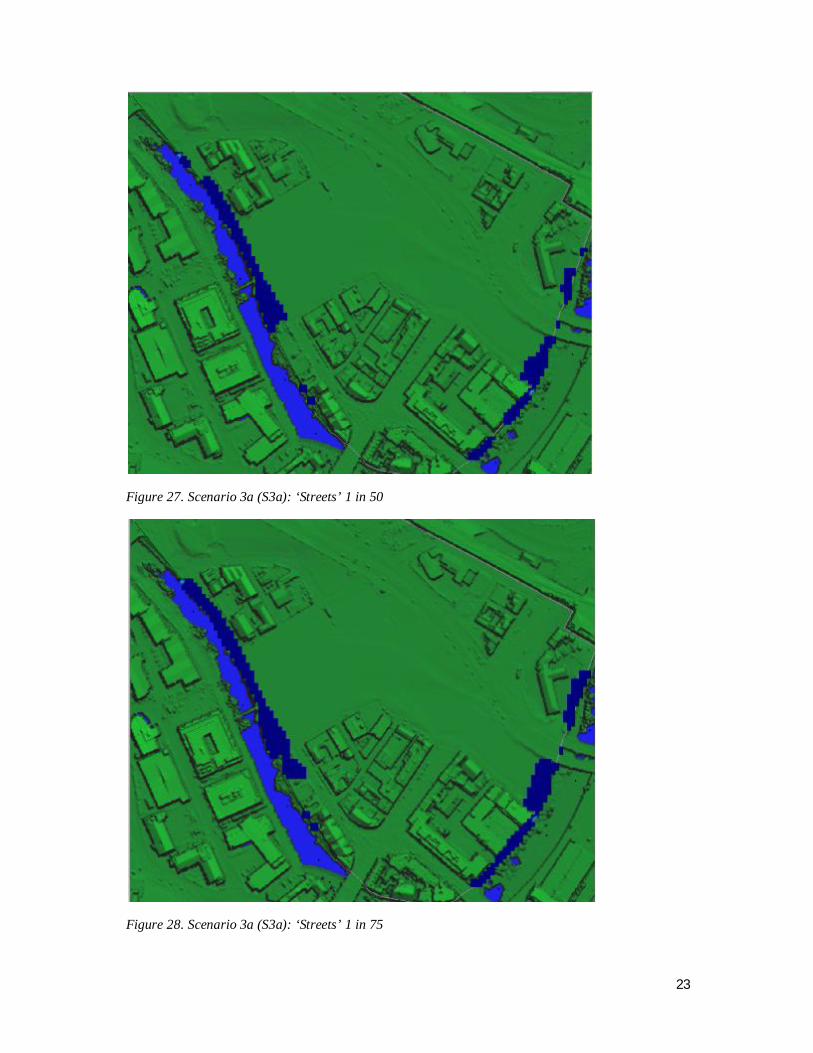
Figure 27. Scenario 3a (S3a): ‘Streets’ 1 in 50
Figure 28. Scenario 3a (S3a): ‘Streets’ 1 in 75

24
Figure 29. Scenario 3a (S3a): ‘Streets’ 1 in 100
Figure 30. Scenario 3a (S3a): ‘Streets’ 1 in 200

25
Figure 31. Scenario 3a (S3a): ‘Streets’ 1 in 1000
Flood maps for Scenario 3b (S3b): ‘URSULA Park’ – Making Space for Water
Figure 32. Scenario 3b (S3b): ‘Park’ 1 in 5

26
Figure 33. Scenario 3b (S3b): ‘Park’ 1 in 10
Figure 34. Scenario 3b (S3b): ‘Park’ 1 in 25

27
Figure 35. Scenario 3b (S3b): ‘Park’ 1 in 50
Figure 36. Scenario 3b (S3b): ‘Park’ 1 in 75

28
Figure 37. Scenario 3b (S3b): ‘Park’ 1 in 100
Figure 38. Scenario 3b (S3b): ‘Park’ 1 in 200
29
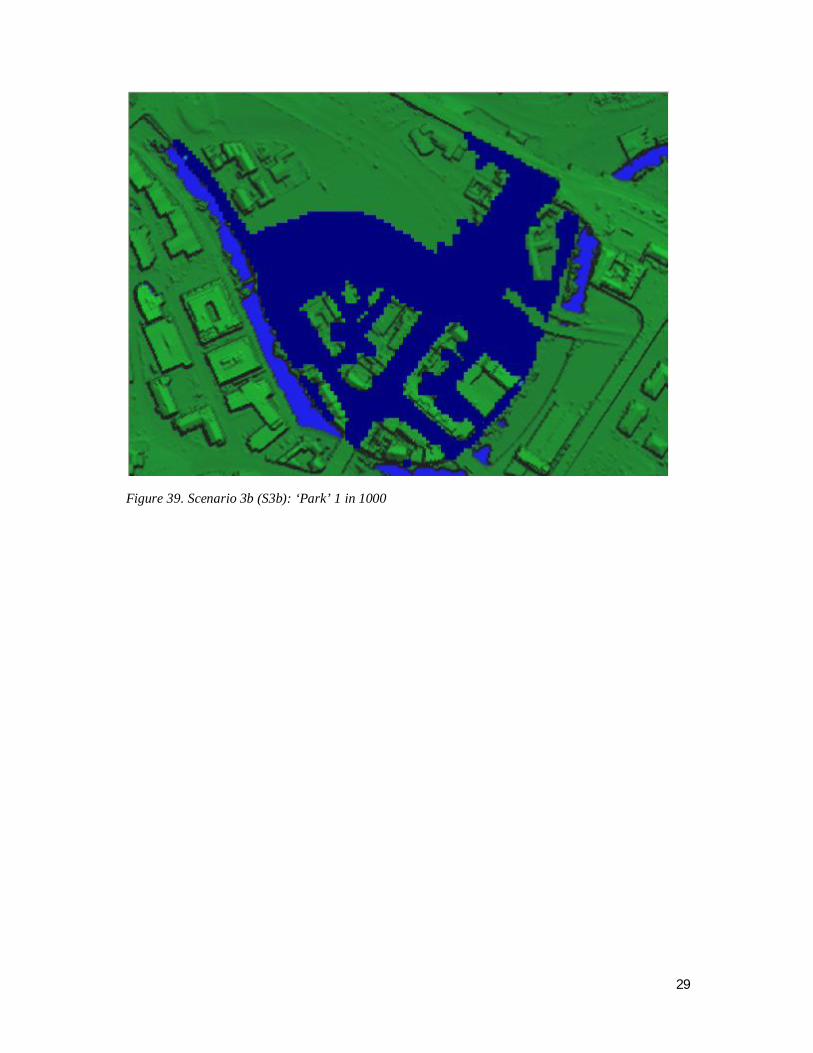
Figure 39. Scenario 3b (S3b): ‘Park’ 1 in 1000