Isiolo Nutrition Survey Final Report- May 2012 HEALTH AND NUTRITION SMART SURVEY FINAL REPORT ......
39
1 INTEGRATED HEALTH AND NUTRITION SMART SURVEY FINAL REPORT ISIOLO DISTRICT MAY 2012. Anastacia Maluki International Medical Corps Monitoring and Evaluation officer.
Transcript of Isiolo Nutrition Survey Final Report- May 2012 HEALTH AND NUTRITION SMART SURVEY FINAL REPORT ......

1
INTEGRATED HEALTH AND NUTRITION SMART SURVEY
FINAL REPORT
ISIOLO DISTRICT
MAY 2012.
Anastacia Maluki
International Medical Corps
Monitoring and Evaluation officer.

2
ACKNOWLEDGEMENTS
I take this opportunity to thank UNICEF for the financial support they provided to conduct this survey.
Special thanks are expressed to: MOH, the Survey co-ordinators (DNO), Team leaders, team members, data entry clerks, International
Medical Corps staff members and drivers for their tireless efforts to ensure that the survey was a success.
I am also indebted to the district administrators, local leaders and community members who willingly participated in the survey and
provided the information needed.

3
TABLE OF CONTENTS
LIST OF TABLES ......................................................................................................................................................................................... 4
LIST OF FIGURES ........................................................................................................................................................................................ 5
LIST OF APPENDICES ................................................................................................................................................................................... 5
ACRONYMS AND ABBREVIATIONS ..................................................................................................................................................................... 6
EXECUTIVE SUMMARY .................................................................................................................................................................................. 8
1. INTRODUCTION ...................................................................................................................................................................................... 10
1.1 Background Information ..................................................................................................................................................................... 10
1.2Rationale for conducting a survey ......................................................................................................................................................... 10
1.3 Objectives: ..................................................................................................................................................................................... 11
1.4 Timing of the survey ......................................................................................................................................................................... 11
1.5 Area to be surveyed ......................................................................................................................................................................... 11
2.0 METHODOLOGY ................................................................................................................................................................................... 12
2.1 Description of sampling frame (including source of population data) .............................................................................................................. 13
2.2Description of sampling methods .......................................................................................................................................................... 13
2.3Data to be collected, and data collection methods and tools ......................................................................................................................... 14
2.4 Data collection Tools and Variables Measured ......................................................................................................................................... 14
2.5 Training and Supervision ................................................................................................................................................................... 15
2.6 Data Entry and Analysis .................................................................................................................................................................... 16
2.7 Nutritional Status Cut-off Points .......................................................................................................................................................... 16
2.8 Survey data validation process ........................................................................................................................................................... 17
2.9 Survey Limitations .......................................................................................................................................................................... 18
2.10 Good Practice ............................................................................................................................................................................... 18
3. RESULTS ............................................................................................................................................................................................ 19
3.1 TARGET POPULATION DEMOGRAPHIC CHARACTERISTICS ............................................................................................................................... 19
3.2 ANTHROPOMETRIC RESULTS (BASED ON WHO STANDARDS 2006) ................................................................................................................... 20
3.3 PREVALENCE OF ACUTE MALNUTRITION BY MUAC ....................................................................................................................................... 24
3.4 CHILDREN’S MORBIDITY ..................................................................................................................................................................... 24
3.5 CHILD FEEDING, CARE AND HEALTH ........................................................................................................................................................ 25
3.6 MATERNAL HEALTH ........................................................................................................................................................................... 28
3.7 INSECTICIDE TREATED MOSQUITO NETS (ITN) HOLDING RATES AND UTILIZATION ................................................................................................... 29
3.8 WATER, SANITATION AND HYGIENE PRACTICES .......................................................................................................................................... 30
3.9 HOUSEHOLD FOOD SECURITY............................................................................................................................................................... 32
3.10 Mortality results (retrospective over x months/days prior to interview) ....................................................................................................... 35
4. Conclusion .......................................................................................................................................................................................... 36
5. Recommendation .................................................................................................................................................................................. 36
Appendices ............................................................................................................................................................................................ 37
4
LIST OF TABLES
No table of figures entries found.
Table 1: summary of findings
Table 2: seasonal calendar
Table 3: Anthropometric and mortality sample size calculation
Table 4: Definition of boundaries for exclusion
Table 5: Demographic information of target population
Table 6: Distribution of age and sex of 6-59 months.
Table 7: Prevalence of acute malnutrition based on weight-for-height z-scores (and/or oedema) and by sex Table 8: Prevalence of acute malnutrition by age, based on weight-for-height z-scores and/or oedema Table 9: Distribution of acute malnutrition and oedema based on weight-for-height z-scores Table 10: Prevalence of underweight based on weight-for-age z-scores by sex Table 11: Prevalence of underweight by age, based on weight-for-age z-scores Table 12: Prevalence of stunting based on height-for-age z-scores and by sex Table 13: Prevalence of stunting by age based on height-for-age z-scores Table 14: Mean z-scores, Design Effects and excluded subjects Table 15: Prevalence of acute malnutrition based on MUAC cut off's and/or oedema
Table 16: Zinc supplementation during last Diarrhoea episodes
Table 17: Vitamin A supplementation
Table 18: Vaccination coverage: OPV 1 & 3 for 6-59 months and measles at 9 months and
deworming for 12-59 months
Table 19: Household Dietary Diversity Scores
Table 20: Main Sources of food consumed in 24 hr recall
Table 21: top five coping strategies
Table 22: Mortality rates
5
LIST OF FIGURES
Figure 1: Symptom breakdown in the children in the two weeks prior to interview (n=428) Figure 2: food groups taken by children 6-23 months in the previous 24 hrs
Figure 3: Ante-natal care visits for women aged 15-49years who ever got pregnant.
Figure 4 : Mosquito net utilization a day prior to the survey.
Figure 5 : sources of water for general household usage and drinking
Figure 6: Main methods of water treatment
Figure 7: Types of toilet facility used
Figure 8 : Sources of Income
Figure 9 Frequency of meals taken in household
Figure 10 Ratio of foods groups consumed in 24-hour recall
LIST OF APPENDICES
Appendix 1: IYCN calculator
Appendix 2:Household Questionnaire
Appendix 3:Anthropometric Questionnaire
Appendix 4:IYCN Questionnaire
Appendix 5:Mortality Questionnaire
Appendix 6:Focu Group Discussion guide
Appendix 7: Assignment of Clusters.
Appendix 8: Plausibility checks
Appendix 9: Map

6
ACRONYMS AND ABBREVIATIONS
ACF - Action Contre la Faim (Action Against Hunger)
ARI - Acute Respiratory Infection
CED - Chronic Energy Deficiency
CHNE - Community-based Health/Nutrition Education
CI - Confidence Interval
CMAM - Community-based management of Acute Malnutrition
CMR - Crude Mortality Rate
CSB - Corn Soya Blend
DDS - Dietary Diversity Score
ENA - Emergency Nutrition Assessment
FANTA - Food and Nutrition Technical Assistance
FGD - Focus Group Discussion
GCM - Global Chronic Malnutrition
GFD - General Food Distribution
GAM - Global Acute Malnutrition
GS - Growth Standards
HFA - Height-for-Age
IMAM - Integrated management of Acute Malnutrition
IMC - International Medical Corps
ITN - Insecticide Treated Nets
IYCF - Infant and Young Child Feeding
KEPI - Kenya Expanded Programme on Immunization
MoMS - Ministry of Medical Services
MoPHS -Ministry of Public Health and Sanitation

7
MUAC - Mid-Upper Arm Circumference
NCHS - National Centre for Health Statistics
NGO - Non-Governmental Organization
OPV - Oral Polio Vaccine
PPS - Probability Proportional to Population Size
PRRO - Protracted Relief and Recovery Operation
SAM - Severe Acute Malnutrition
SCM - Severe Chronic Malnutrition
SD - Standard Deviation
SFP - Supplementary Feeding Programme
SMART - Standardized Monitoring and Assessment of Relief and Transitions
SPSS - Statistical Package for Social Scientists
TBA - Traditional Birth Attendant
U5MR - Underfive Mortality Rate
UK - United Kingdom
UNICEF - United Nations Children’s Fund
USAID - United States of America International Aid
WFA - Weight-for-Age
WFH - Weight-for-Height
WHO - World Health Organization

8
EXECUTIVE SUMMARY
The survey area covered the 5 administrative divisions of Isiolo District namely: Isiolo East, Central and Ol donyiro, Merti and Cherab.
The district has a total population of 104, 223 inhabitants1, with an annual growth rate of 3.6% p.a. The estimated Under-5 target
population of the survey was 15.4% of the total population.2
The major economic activities for the people in the district are livestock-based, subsistence farming, and petty trade. Pastoralists are
very vulnerable to drought, which can be traced back to the shifta wars and to the subsequent insecurity that lead to further loss of
livestock. Livestock and agriculture-based activities contribute over 70% of the household income in the district and employ over 75% of
the labour. The main livelihood zone in the district is pastoral – keeping cattle, shoats, camel and donkeys. There are also semi-urban or
urban settlements, many of who have previously dropped out of the pastoralist lifestyle following recurrent shocks. Other significant
livelihood zones include; agro-pastoral, waged labor, and firewood/charcoal.
In order to gauge the performance of the HINI package and inform future programming in the district, International Medical Corps in
collaboration with MOMS/MOPHS carried out a nutritional survey in Isiolo district between 14th May and 28th May 2012, to evaluate the
extent and severity of malnutrition among children aged 6-59 months and analyze the possible factors contributing to malnutrition and
recommend appropriate interventions. The survey utilized the Standardized Monitoring of Relief and Transitions (SMART) methodology and
also in accordance with both the National Guidelines for Nutrition and Mortality assessments in Kenya and the UNICEF-recommended
nutritional survey key indicators. Both anthropometric and mortality data were collected simultaneously during the survey. A two-stage
cluster sampling with probability proportional to size (PPS) design was employed for the integrated nutrition survey. Sample size was
determined on the basis of estimated prevalence rates of malnutrition (GAM), desired precision and design effect) using the ENA for
SMART software. IYCF multi survey sampling calculator was used to calculate IYCF and Qualitative data was collected through: focus group
discussions (FGDs), key informant interviews and general observations.
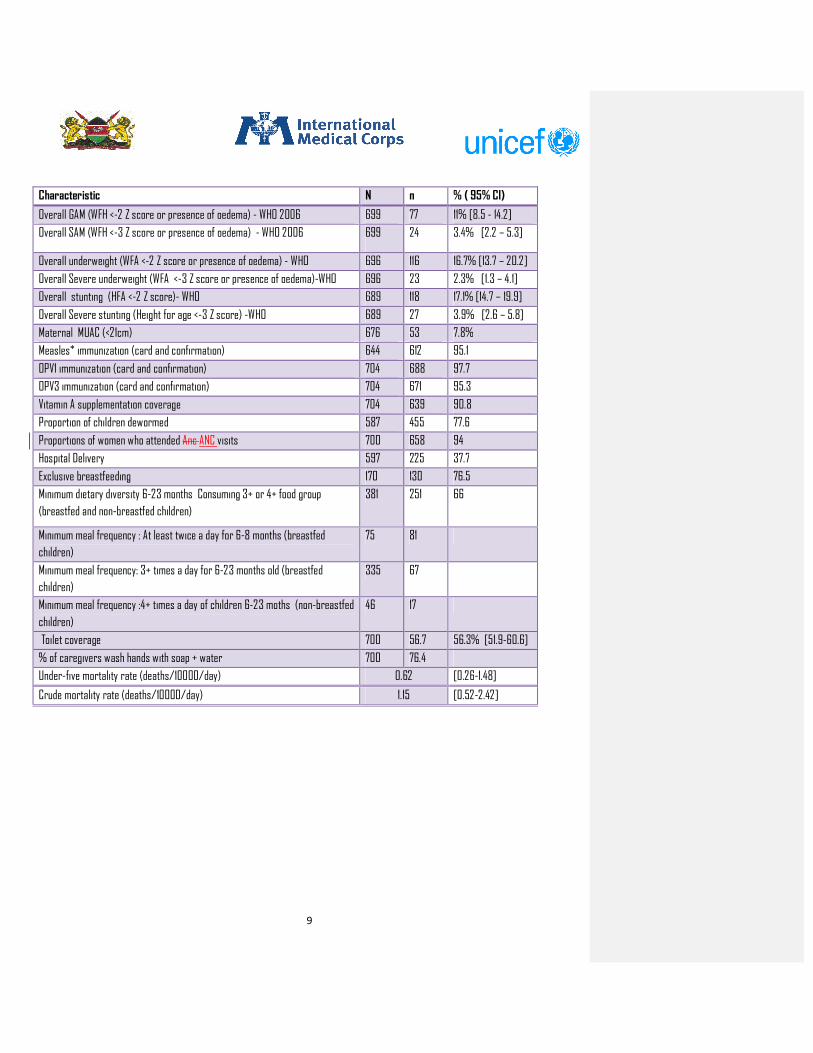
Table 1: Summary of findings:
1 Current Population estimates from DSO Office- Isiolo 2 Current Population estimates from DSO Office- Isiolo
DEMOGRAPHY Number
Number of HH surveyed 700
Number of children 6-59 months surveyed 704
Number of children 0-23 months surveyed for IYCN 554
Number of children 0-5 months surveyed for IYCN 170
Average number of persons per HH 5.9 S.D = 2.5
Average number of children (0-5 months ) per HH 0.2 S.D=0.4
Average number of children (6-59 months ) per HH 1.2 S.D = 0.8
9
Characteristic N n % ( 95% CI)
Overall GAM (WFH <-2 Z score or presence of oedema) - WHO 2006 699 77 11% [8.5 - 14.2]
Overall SAM (WFH <-3 Z score or presence of oedema) - WHO 2006 699 24 3.4% [2.2 – 5.3]
Overall underweight (WFA <-2 Z score or presence of oedema) - WHO 696 116 16.7% [13.7 – 20.2]
Overall Severe underweight (WFA <-3 Z score or presence of oedema)-WHO 696 23 2.3% [1.3 – 4.1]
Overall stunting (HFA <-2 Z score)- WHO 689 118 17.1% [14.7 – 19.9]
Overall Severe stunting (Height for age <-3 Z score) -WHO 689 27 3.9% [2.6 – 5.8]
Maternal MUAC (<21cm) 676 53 7.8%
Measles* immunization (card and confirmation) 644 612 95.1
OPV1 immunization (card and confirmation) 704 688 97.7
OPV3 immunization (card and confirmation) 704 671 95.3
Vitamin A supplementation coverage 704 639 90.8
Proportion of children dewormed 587 455 77.6
Proportions of women who attended Anc ANC visits 700 658 94
Hospital Delivery 597 225 37.7
Exclusive breastfeeding 170 130 76.5
Minimum dietary diversity 6-23 months Consuming 3+ or 4+ food group
(breastfed and non-breastfed children)
381 251 66
Minimum meal frequency : At least twice a day for 6-8 months (breastfed
children)
75 81
Minimum meal frequency: 3+ times a day for 6-23 months old (breastfed
children)
335 67
Minimum meal frequency :4+ times a day of children 6-23 moths (non-breastfed
children)
46 17
Toilet coverage 700 56.7 56.3% [51.9-60.6]
% of caregivers wash hands with soap + water 700 76.4
Under-five mortality rate (deaths/10000/day) 0.62 [0.26-1.48]
Crude mortality rate (deaths/10000/day) 1.15 [0.52-2.42]

10
1. INTRODUCTION
1.1 Background Information
Isiolo district is in Eastern Province of Kenya and covers an area of 25,000 square kilometers with an estimated population of 143,294
(73,694 Male and 69,600 Female) persons (KNBS 2009). The district borders Marsabit district to the north, Wajir and Garissa districts to
the east, Tana River and Meru districts to the south, and Samburu and Laikipia districts to the west. In November 2007 the larger Isiolo
district was divided into two districts namely; Isiolo and Garbatulla. In December 2010, Merti District was curved out of Isiolo to form
another District. Currently, Isiolo district has three administrative divisions namely; Isiolo East, Central and Ol donyiro, Merti District has
two administrative divisions namely; Merti and Cherab while Garbatulla district has three administrative divisions namely Kinna, Garbatulla
and Sericho. Isiolo is inhabited by among other groups the Borana, the Somali, Turkana, the Samburu and the Meru.
According to the KENYA Food Security Outlook February to June 2012, the gradual improvement in the pastoral food security situation
after significantly above-average October-December 2011 short rains is starting to slow down. Pastoral households are accessing 1-3
liters of milk per day, mainly from shoats and camels. However, available milk is only about half of what is normal at this time of the year
as nearly 80 percent of livestock are in conception. Livestock prices have increased significantly by up to 60 percent since October 2011,
for example, Cattle prices are above the five-year average for January by 30-60 percent and, goat prices are above average in by 30-55
percent;
The current pastoral food security situation is expected to remain stable during the current short dry season. According to
IGAD Climate Prediction and Application Center consensus forecast for the Greater Horn of Africa, below normal and poorly distributed
2012 March-May long rains were forecast for most pastoral areas. The long rains season is expected to be shorter than usual, between
mid-March and mid-April, instead of mid-March to the end of May, and rains are expected to be 75 percent of long-term mean. Overall
food insecurity for the majority of pastoralists is expected to remain at Stressed or Crisis levels through the scenario period.3Isiolo
district has been under Emergency Operations, now Protracted Relief and Recovery Operation (PRRO) since 2004. The food aid
beneficiary caseload during the various phases of the emergency operation varied from phase to phase owing to the changing food
security situation in the district.
International Medical Corps–Kenya (IMC-Kenya), under the supervision of IMC UK has been undertaking Community Management of Acute
Malnutrition (CMAM) project in Isiolo since January 2011. Funded by UNICEF, this project is part of the three (3) High Impact Nutrition
Intervention pilot districts4 in the country. IMC partners with MoH by supporting the scaling up of high impact nutrition interventions (HINI)
and strengthening the health system, in a 18 month project (1st January 2011 - 30th June 2012). This will complement the support that
UNICEF and WFP are giving to the government to ensure the scale up of high impact interventions. In order to build the capacity to manage
acute malnutrition at the health facility and community levels, IMC has facilitated trainings for health workers on management of acute
malnutrition and Integrated Management of Childhood Illnesses (IMCI) through on the job training (OJT). Community Health Workers
(CHWs) have also been trained on community mobilization and sensitization, case finding, follow-up and mentorship of pregnant and
lactating women to promote better nutritional practices and effect positive behavioural change.
1.2Rationale for conducting a survey
In order to gauge the performance of the HINI package and inform future programming in the district, International Medical Corps in
collaboration with MOMS/MOPHS carried out a nutritional survey in Isiolo district between 14th May and 28th May 2012, to evaluate the
3 KENYA Food Security Outlook February to June 2012
4 Other districts include Samburu, and Marsabit.
11
extent and severity of malnutrition among children aged 6-59 months and analyze the possible factors contributing to malnutrition as well
as recommend appropriate interventions.
1.3 Objectives:
The aim of the survey was to determine the current nutritional status in the district and to analyse the possible factors contributing to
malnutrition and recommend appropriate interventions that will inform future programming.
The specific objectives of this survey were:
1. To estimate the level of acute malnutrition among children aged 6-59 months
2. To estimate the level of malnutrition among pregnant and lactating and care taker women aged 15-49 years
3. To identify factors likely to have influenced malnutrition in young children
4. To estimate the prevalence of some common diseases (measles, diarrhoea, malaria, and ARI)
5. To estimate measles, polio vaccination and Vitamin A supplementation coverage amongst children 9-59 months and 6-59 months
respectively.
6. To estimate crude death rate and under-five mortality rates.
7. To assess child and infant care and feeding practices among caretakers with children 0-23 months. 8. To assess the current food security situation of the surveyed population. 9. To establish the situation of water and sanitation, appropriate hygiene practices including hand washing among caretakers.
1.4 Timing of the survey
Table 2: seasonal calendar
JAN FEB MAR APRIL MAY JUNE JULY AUG SEPT OCT NO
V
DEC
Short Dry period (Bon agaya) Long Dry period (Atholes) Short Rains (Agaya)
SR
harvesting
LR start
Kidding/lambing
Milk Increases
SR
starts
Milk
increase
Key: SR: short Rain LR: long Rain
1.5 Area to be surveyed
The greater Isiolo district covers an area of 25,605 Square Km, and is located between longitude 36°50' East and latitude 0°05' North
and 2°North. Isiolo is classified as 100% ASAL5. The survey area covered the 5 administrative divisions of Isiolo District namely: Isiolo
East, Central and Ol donyiro, Merti and Cherab. Within these are 19 locations and 31 sub-locations. The district has a total population of
104, 223 inhabitants6, with an annual growth rate of 3.6% p.a. The estimated Under-5 target population of the survey is 15.4% of the total
population.7
The district is predominantly flat with low lying plains that rise gradually from an altitude of 200m above sea level at Lorian Swamp in the
north to about 300m above sea level at Merti Plateau. To the west, are volcanic hills, and foothill slopes of the Mount Kenya and Nyambene
5 Draft National ASAL Policy, 2004 6 Current Population estimates from DSO Office- Isiolo 7 Current Population estimates from DSO Office- Isiolo

12
hills. There are four perennial rivers in the district namely Ewaso Nyiro which originate from Mt. Kenya and Aberdare ranges. The average
rainfall is 580mm and is erratic and unreliable and cannot support perennial agricultural crops. The district receives a bimodal rainfall
pattern. The short rains, which are most reliable, are experienced in mid-October to December while the long rains are received in mid-
March to June. The annual mean rainfall ranges between 450 mm to 650 mm. High temperatures are recorded in the district throughout
the year, with a mean annual temperature of 27°C.
The major economic activities for the people in the district are livestock-based, subsistence farming, and petty trade. Pastoralists are
very vulnerable to drought, which can be traced back to the shifta wars and to the subsequent insecurity that lead to further loss of
livestock. Livestock and agriculture-based activities contribute over 70% of the household income in the district and employ over 75% of
the labour. The main livelihood zone in the district is pastoral – keeping cattle, shoats, camel and donkeys. There are also semi-urban or
urban settlements, many of who have previously dropped out of the pastoralist lifestyle following recurrent shocks. Other significant
livelihood zones include; agro-pastoral, waged labor, and firewood/charcoal.
2.0 METHODOLOGY
Three different sampling methodologies were applied. IYCF multi survey sampling calculator was used to calculate IYCF sample while
Emergency Nutrition Assessment (ENA) for Standardised Monitoring of Relief and Transition (SMART) was used to calculate
anthropometric and mortality data. This was guided both by the National Guidelines for Nutrition and Mortality assessments in Kenya and
the recommended UNICEF nutritional survey key indicators. Qualitative data was collected through: focus group discussions (FGDs), key
informant interviews and general observations
In calculating anthropometric sample size, a GAM prevalence of 15.7% [12.0 - 20.2]8 , desired precision of 4%, a design effect of 1.5 , an
estimated household size of 5.59 persons, 15.4% < 5 years and non-response rate of 3% gave a sample size of 519 children (6-59 months)
and a household sample of 702 households. The second sampling stage comprises of village and household selection. In order to select
survey clusters, the names of villages/sub-locations, their respective population sizes and the required number of clusters was entered
into the SMART software, which generated the actual list of the villages to survey (including reserve clusters). At the field level, the EPI
method was employed to select the first household to be enumerated. This was because it was not possible to get the list of households to
use random sampling and the villages were not arranged in a systematic manner to employ random sampling. A household was defined as
a group of people who lived together and shared a common cooking pot. In polygamous families with several structures within the same
compound but with different wives having their own cooking pots, the structures were considered as separate households and assessed
separately. In cases where there was no eligible child, a household was still considered part of the sample, where only household and
mortality data were collected. If a respondent was absent during the time of household visit, the teams left a message and re-visited later
to collect data for the missing person, with no substitution of households allowed. The teams visited the nearest adjacent village (not
among those sampled) to make up for the required number of households if the selected village yielded a number below 20 households,
following the methodology described above.
IYCF multi survey sampling calculator was used to obtain sample size for Infants and young children (0-23 months). Indicators calculated
were: Timely initiation of breastfeeding (children 0-23 months), Exclusive breastfeeding under 6 months, Timely complementary feeding,
Minimum dietary diversity, Minimum acceptable diet, Minimum meal frequency and continued breastfeeding at 1 year. Using information
obtained from Isiolo survey conducted in April, 2011, the sample size for children between 0-23 months was 546 (annex 1) .The numbers of
children aged 0-23 months reached per cluster was given by dividing 546 by 36 giving 16 children per cluster.
8INTEGRATED HEALTH AND NUTRITION SMART SURVEY ISIOLO DISTRICT, April 2011
9 INTEGRATED HEALTH AND NUTRITION SMART SURVEY ISIOLO DISTRICT, April 201
13
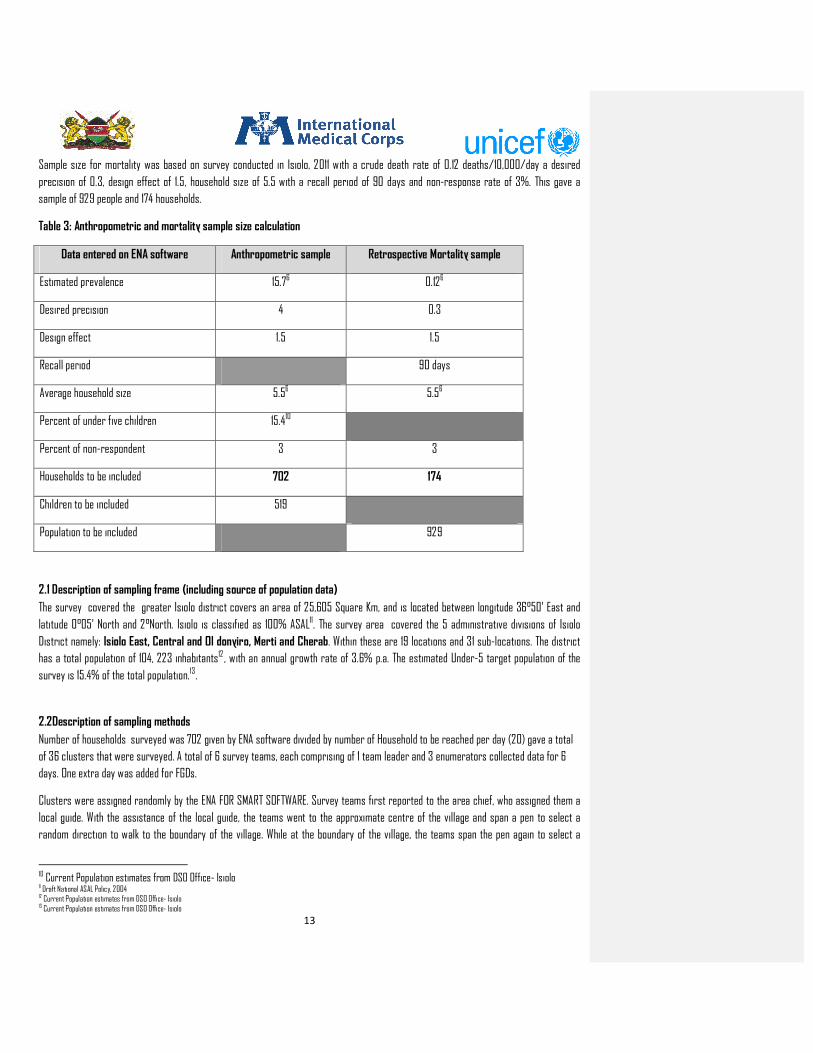
Sample size for mortality was based on survey conducted in Isiolo, 2011 with a crude death rate of 0.12 deaths/10,000/day a desired
precision of 0.3, design effect of 1.5, household size of 5.5 with a recall period of 90 days and non-response rate of 3%. This gave a
sample of 929 people and 174 households.
Table 3: Anthropometric and mortality sample size calculation
Data entered on ENA software Anthropometric sample Retrospective Mortality sample
Estimated prevalence 15.76 0.126
Desired precision 4 0.3
Design effect 1.5 1.5
Recall period 90 days
Average household size 5.56 5.56
Percent of under five children 15.410
Percent of non-respondent 3 3
Households to be included 702 174
Children to be included 519
Population to be included 929
2.1 Description of sampling frame (including source of population data)
The survey covered the greater Isiolo district covers an area of 25,605 Square Km, and is located between longitude 36°50' East and
latitude 0°05' North and 2°North. Isiolo is classified as 100% ASAL11. The survey area covered the 5 administrative divisions of Isiolo
District namely: Isiolo East, Central and Ol donyiro, Merti and Cherab. Within these are 19 locations and 31 sub-locations. The district
has a total population of 104, 223 inhabitants12 , with an annual growth rate of 3.6% p.a. The estimated Under-5 target population of the
survey is 15.4% of the total population.13.
2.2Description of sampling methods
Number of households surveyed was 702 given by ENA software divided by number of Household to be reached per day (20) gave a total
of 36 clusters that were surveyed. A total of 6 survey teams, each comprising of 1 team leader and 3 enumerators collected data for 6
days. One extra day was added for FGDs.
Clusters were assigned randomly by the ENA FOR SMART SOFTWARE. Survey teams first reported to the area chief, who assigned them a
local guide. With the assistance of the local guide, the teams went to the approximate centre of the village and span a pen to select a
random direction to walk to the boundary of the village. While at the boundary of the village, the teams span the pen again to select a
10 Current Population estimates from DSO Office- Isiolo 11 Draft National ASAL Policy, 2004 12 Current Population estimates from DSO Office- Isiolo 13 Current Population estimates from DSO Office- Isiolo

14
second direction. The first household visited were randomly selected by drawing a random number list between one and the number of
households counted when walking to the periphery. The subsequent households were selected by proximity always selecting households to
the right. In villages with more than one cluster, the village were subdivided and the centre of each subdivision was determined and
households were selected as described above. In a cluster that was sparsely populated, all the households in the cluster were visited. All
children aged 6-59 in every household visited were included in the anthropometric survey and 0-23 month category was included in IYCF.
2.3Data to be collected, and data collection methods and tools
To estimate malnutrition prevalence, mortality rates and IYCF the following information was collected:
• Anthropometry (weight, height, oedema, MUAC, age, sex) for children aged 6-59 months and MUAC for caretakers • Vaccination information (measles, BCG, and Vitamin A supplementation) • Incidences of childhood illnesses in the last 2 weeks prior to the survey • Crude and Under 5 mortality rates over a recall period of the last 3 months • Other child care, food security and hygiene data at household level • For children aged below 23 months, IYCF data were equally be collected • HINI indicators were as well captured. • total number (of all ages) currently in the household • number who were in the household at the start of the recall period • number of deaths • number of births • number who left the household during the recall period • number who joined the household during the recall period
2.4 Data collection Tools and Variables Measured
A total of 6 survey teams, each comprising of 1 team leader and 3 enumerators collected the data. 4 sets of questionnaires were used for
data collection. These included 4 sets of structured questionnaires Questionnaire A (household)- all HH members; Questionnaire
B(anthropometry and maternal)- 6-59 months, caregivers; Questionnaire C(IYCF)- 0-23months and Questionnaire D(mortality)-all HH
members as well as a focus group discussion (FGD) guide to collect qualitative data.
2.4.1 The household questionnaire
This was used to elicit general household information (demographic data, household water sources and consumption, household food
consumption, maternal health care information, maternal dietary diversity, sanitation, food aid, food insecurity mitigation strategies,
possession and utilization of insecticide-treated mosquito nets (ITNs), livestock condition and household socio-economic status indicators.
(appendix 2)
2.4.2 Child (6-59 months old) questionnaire (Anthropometry)
Using this questionnaire, the following data were collected: (Appendix 3).
Child age: the age of the child was recorded based on a combination of information collected from the child health cards, the
mothers’/caretakers’ knowledge of the birth date and use of a calendar of events for the district developed in collaboration with the
survey team
Child sex: was recorded whether a child was male or female.
Bilateral oedema: normal thumb pressure was applied on the top part of both feet for 3 seconds. If pitting occurred on both feet upon
release of the fingers, nutritional oedema was indicated.
15
Child weight: the weights of children were taken with minimal light clothing on, using UNICEF Salter Scales with a threshold of 25kgs .The
teams were trained to use the Salter scale .The scales were always first set at zero, with the weighing pants, before weighing the child.
Child length/height: children were measured bareheaded and barefooted using wooden UNICEF height boards with a precision of 0.1cm.
Children under the age of two years were measured while lying down (length) and those over two years while standing upright (height). If
child age could not be accurately determined, proxy heights were used to determine cases where height would be taken in a supine
position (between 65cm-<85cm) or in an upright position (heights greater ≥85cm). Height rods with a marking at 85cm were used to
assist in determining measuring position.
Child MUAC: the MUAC of children were taken using child tapes, respectively, and recorded to the nearest 0.1cm.
Morbidity: a 2-week morbidity recall was conducted for all index children (6-59 months) to assess the prevalence of common diseases
(e.g. malaria, acute respiratory infections (ARI), diarrhoea, measles, stomach-ache, eye and skin infections).
Child immunization and Vitamin A supplementation: data on vitamin A supplementation, deworming, and immunization for polio and
measles were collected to estimate their coverage. The coverage for measles immunization was only done for eligible children (≥ 9
months).
Feeding programme enrolment: it was established if children 6-59 months old were enrolled in SFP or OTP and the duration in the feeding
programme.
2.4.3 Under 6 months old child questionnaire
This was used to collect infant and young child feeding (IYCF) practices data in the households visited. Information on breastfeeding,
weaning and child feeding were collected. Dietary diversity information based on a 24-hour food intake recall was collected for the
children to assess the number of food groups taken the previous day.
2.4.4 Mortality questionnaire
This elicited 3-month (90-day) retrospective recall information on whether there had been any deaths in households and the probable
causes of death through verbal autopsy.
2.4.5 Focus group discussion (FGD) guide
A FGD guide was used to collect qualitative data to complement quantitative data. Each team implemented 2 FGDs, one for men and
another for women in one of the assigned clusters. The FGD clusters were selected from the targeted villages in a manner that ensured
adequate representation of socio-economic, ecological and livelihood differentials
2.5 Training and Supervision
The survey was coordinated and supervised by International Medical Corps staffs and Isiolo and Merti district Nutrition Officers (DNO) as
the Survey Supervisors. For data collection, a total of 6 teams were recruited and trained for the survey. Each team comprised of a team
leader and three enumerators. The local events calendar was developed jointly with the survey team and how to ask the questions in the
questionnaires practiced.
The anthropometric standardization exercise14, as recommended by the SMART methodology, was used as an assessment of the team
members’ anthropometry techniques. Each team member was given a score of competence based on performing measurements with
accuracy and precision. The results of the training exercise were analyzed by entering the data in the ENA computer package and training
report generated.
14
SMART Regional Training Kit for Capacity-Building and Methodology (ACF Canada) 2010

16
After the class room training, a pPractical field experience was conducted on the last day of training, in one of the unselected clusters to
take anthropometric measurements of children and caretakers, conduct interviews and fill questionnaires. The pre-testing exercise was
performed on 5 households.
Each team was supervised at least once a day throughout the data collection by either International Medical Corps staffs or DNO. At the
end of each day at base, there was a de-briefing session and review of questionnaires. The survey, including the training, lasted for a
period of 11 days.
The following topics were covered during training:
survey objectives, types and causes of malnutrition ,SMART survey and sampling methodologies verbal interpretation of the questions
into the local languages during training for uniform contextual understanding by all the teams ,household, child and mortality
questionnaire interviewing techniques, anthropometric measurement procedures ,practical on conducting interviews and anthropometric
measurements ,interview techniques ,duties and responsibilities ,research ethics ,community entry behaviour and survey logistics.
2.6 Data Entry and Analysis
Anthropometric and mortality data entry and processing was done using the SMART/ENA software where the World Health Organization
Growth Standards (WHO-GS) data cleaning and flagging procedures were used to identify outliers which enabled data cleaning as well as
exclusion of discordant measurements from anthropometric analysis. The SMART/ENA software generated weight-for-height, height-for-
age and weight-for-age Z scores to classify them into various nutritional status categories using WHO9 standards and cut-off points and
exported back to SPSS for further analysis. IYCF and all the other quantitative data were entered and analysed in the SPSS Statistics 15.
2.7 Nutritional Status Cut-off Points
The following nutritional indices and cut-off points were used in this survey:
Weight-for-height (WFH) and MUAC – Wasting among Children
The prevalence of wasting (a reflection of the current health/nutritional status of an individual) are presented as global acute
malnutrition (GAM) and severe acute malnutrition (SAM) using weight-for-height (WFH) z-scores, WFH percentage of median and MUAC
indices. The results on wasting are presented as global acute malnutrition (GAM) and severe acute malnutrition (SAM):
Children whose WFH z-scores fell below -2 standard deviations from the median of the WHO standards (WHO-GS) or had bilateral oedema
were classified as wasted (to reflect GAM)
Children whose WFH z-scores fell below -3 standard deviations from the median of the WHO-GS or had bilateral oedema were classified as
severely wasted (to reflect SAM)
A cut-off point of <12.5cm MUAC was used to denote GAM among the under-fives.
Weight-for-age (WFA) – Underweight
The measure of underweight gives a mixed reflection of both the current and past nutritional experience by a population and is a very
useful tool in growth monitoring.
Children whose WFA z-scores fell below -2 standard deviations from the median of the WHO-GS or had bilateral oedema were classified as
underweight
9 WHO 2006

17
Children whose WFA z-scores fell below -3 standard deviations from the median of the WHO-GS or had bilateral oedema were classified as
severely underweight.
Height-for-age (HFA) – Stunting
Height-for-age is a measure of linear growth and therefore an unequivocal reflection of the cumulative effects of past nutritional
inadequacy and/or illness episodes.
Children whose HFA z-scores fell below -2 standard deviations from the median of the WHO-GS were classified as stunted (to reflect
Global Stunting)
Children whose HFA z-scores fell below -3 standard deviations from the median of the WHO-GS were classified as severely stunted.
To determine the nutritional status the following variables were considered for analysis: sex, age, weight, height or length and oedema.
The cluster number was also included for segregation purposes and to allow for smooth merging up of data with the other household
variables in EPI and the SPSS software. During the z-score calculations the following facts were taken into consideration:
Table 3: Definition of boundaries for exclusion
1. If Sex is missing the observation is excluded from analysis.
2. If Weight is missing, no WHZ and WAZ are calculated, and the programme derives only HAZ.
3. If Height is missing, no WHZ and HAZ are calculated, and the programme derives only WAZ.
5. For any child records with missing age (age in months) only WHZ will be calculated.
6. If a child has oedema only his/her HAZ is calculated.
Additional analyses for frequencies, descriptive, correlations, cross–tabulations and regressions were conducted using SPSS and excel.
Indices were expressed both in terms of z scores that represent the difference between observed weight and median weight of the
reference population expressed in standard deviation. The result of this survey was compared to WHO standard cut-off points. The IYCF
data was analysed to yield data for key indicators in SPSS and excel.
2.8 Survey data validation process
Data quality was ensured through:
• Approval of the methodology by Nutrition Working Group • Thorough training of all team members for four days (the majority of the enumerators and team leaders had prior experience in
carrying out nutrition surveys) • standardization of interviewing procedures through verbal translation of questions by survey team members into the local
languages spoken in the district during training • standardization of anthropometric measurement procedures • practical sessions on interviewing and anthropometric measurements taking • daily supervision of the teams by IMC staff and Nutrition Coordinator • review of questionnaires on a daily basis for completeness and consistency • plausibility checks from SMART/ENA software specific to each team during daily data entry • on-the-spot correction/feedback of any mistakes noted during data collection to avoid mistake carry-overs • review of questionnaires by teams before leaving the household to ensure questionnaire completeness and consistency • frequencies for all variables were first run and the data cleaned by cross-checking any aberrant values observed on the
respective questionnaire before analysis

18
• triangulation of quantitative data using qualitative information-KIIs, secondary data and observation • Age of children verified by EPI health cards- in the absence of cards, use of height sticks and the local calendar of events
formulated was used to give estimates of the birth month and year.
2.9 Survey Limitations
There were inherent difficulties in determining the exact age of some children (even with use of the local calendar of events), as some
health cards had erroneous information. This may have led to inaccuracies when analysing chronic malnutrition. Although verification of
age was done by use of health cards, in some cases no exact date of birth was recorded on the card other than the date a child first seen
at the health facility or just the month of birth. Recall bias may link to wrong age which then leads to wrong weight for age and height for
age indices.
There was poor recording of vitamin A and de-worming in the health cards. Some of the mothers indicated that their children had
received Vitamin A and de-worming while it was not recorded in the health cards.
2.10 Good Practice
Proper and intensive training of identifying oedema and taking anthropometric measures result in quality data.
Working closely with a cluster guide that was respected by community members, yielded better quality data especially on sensitive topics
e.g. infant mortality data.
Crosschecking the date of birth with both health card and calendar of local events enhanced the age verification process

19
3. RESULTS
3.1 TARGET POPULATION DEMOGRAPHIC CHARACTERISTICS
Overall, the surveyed households had, on average, 5.9 (SD 2.5) members (with a range of 1-17 persons). The mean number of children
below 6 months in the households was 0.2 (SD 0.4), those aged 6-59 months 1.2 (SD 0.8). Polygamy was practised in 14.7% of the
households while 13% households were single parents the rest 72.3 % practised monogamy. Majority (81.4%) of the households were
being male-headed, 16.3% female-headed and 1.3% of the respondents reporting that their parents were heading the household.
Table 5: Demographic information of target population
Table 6: Distribution of age and sex of 6-59 months.
Boys Girls Total Ratio
AGE (Months) no. % no. % no. % Boy:girl
6-17 100 42.0 138 58.0 238 33.8 0.7
18-29 97 63.0 57 37.0 154 21.9 1.7
30-41 69 44.8 85 55.2 154 21.9 0.8
42-53 67 58.3 48 41.7 115 16.3 1.4
54-59 24 55.8 19 44.2 43 6.1 1.3
Total 357 50.7 347 49.3 704 100.0 1.0
DEMOGRAPHY Number
Number of HH surveyed 700
Number of children 6-59 months surveyed 704
Number of children 0-23 months surveyed for IYCN 554
Number of children 0-5 months surveyed for IYCN 170
Average number of persons per HH 5.9 S.D = 2.5
Average number of children (0-5 months ) per HH 0.2 S.D=0.4
Average number of children (6-59 months ) per HH 1.2 S.D = 0.8

20
The distribution of index children (6-59 months old) by age group and sex was as shown in Table 6 where both the age group and overall male: female ratios were within the expected range of 0.8 – 1.215 which is demonstrative of an unbiased under five survey sample. Of the children measured, 50.7% were boys and 49.3% were girls. 21% of children aged 0-23 were purposively sampled for IYCN indicators this explains why there are more children in the age category 6-17 months.
3.2 ANTHROPOMETRIC RESULTS (BASED ON WHO STANDARDS 2006)
There are three different systems by which a child or a group of children can be compared to the reference population: Z-scores
(standard deviation scores), percentiles, and percent of median. For population-based assessment—including surveys and nutritional
surveillance—the Z-score is widely recognized as the best system for analysis and presentation of anthropometric data because of its
advantages compared to the other methods16 .
3.2.1 Overall Prevalence of Global Acute Malnutrition by WFH Z-scores (WHO Standards)
The WHO Global Database on Child Growth and Malnutrition uses a Z-score cut-off point of <-2 SD to classify low weight-for-age, low
height-for-age and low weight-for-height as moderate and severe under nutrition, and <-3 SD to define severe under nutrition. The cut-off
point of >+2 SD classifies high weight-for-height as overweight in children. The information presented below is based on the analyzable
sample of 704 eligible children whose plausible anthropometric data were collected. 0.7% of the children were flagged off the WFH
analysis according to the SMART flagging procedures due to aberrant values which are with -3 and +3 z-scores.
The prevalence of global acute malnutrition i.e. GAM (z-scores <-2 standard deviations and/or oedema) by WHO-GS (Table 7) was 11% (8.5-
14.2 CI) while the prevalence of severe acute malnutrition (SAM) was 3.4% (2.2 -5.3 CI). The GAM prevalence for boys was higher than
girls, the differences, however, were not significant as indicated by the p.value of 0.842.
According to age distribution, SAM and MAM were highest (9.3 % and 14% respectively) among age group 54-59 months, (table 8). The
overall prevalence of GAM in Isiolo County reveals serious situation with in the community according to WHO benchmarks17. The major
causes of malnutrition reported from FGD were: poverty, lack of proper nutrition and food shortage.
Table 7: Prevalence of acute malnutrition based on weight-for-height z-scores (and/or oedema) and by sex
All
n = 699
Boys
n = 353
Girls
n = 346
Prevalence of global malnutrition
(<-2 z-score and/or oedema)
(77) 11.0 %
(8.5 - 14.2 95% C.I.)
(46) 13.0 %
(9.6 - 17.5 95% C.I.)
(31) 9.0 %
(5.9 - 13.4 95% C.I.)
Prevalence of moderate malnutrition
(<-2 z-score and >=-3 z-score, no
oedema)
(53) 7.6 %
(5.7 - 10.0 95% C.I.)
(29) 8.2 %
(5.4 - 12.3 95% C.I.)
(24) 6.9 %
(4.7 - 10.1 95% C.I.)
Prevalence of severe malnutrition
(<-3 z-score and/or oedema)
(24) 3.4 %
(2.2 - 5.3 95% C.I.)
(17) 4.8 %
(2.9 - 7.8 95% C.I.)
(7) 2.0 %
(0.9 - 4.7 95% C.I.)
The prevalence of oedema is 0.4 %
15
Assessment and Treatment of Malnutrition in Emergency Situations, Claudine Prudhon, Action Contre la Faim (Action Against Hunger), 2002. 16
WHO Technical Report Series No. 854. Geneva: World Health Organization, 1995 17
WHO, 2003, “The Management of Nutrition in Major Emergencies”

21
Table 8: Prevalence of acute malnutrition by age, based on weight-for-height z-scores and/or oedema
Severe wasting
(<-3 z-score)
Moderate wasting
(>= -3 and <-2 z-
score )
Normal
(> = -2 z score)
Oedema
Age
(Months)
Total
no.
No. % No. % No. % No. %
6-17 236 8 3.4 14 5.9 212 89.8 2 0.8
18-29 154 5 3.2 13 8.4 135 87.7 1 0.6
30-41 152 2 1.3 15 9.9 135 88.8 0 0.0
42-53 114 2 1.8 5 4.4 107 93.9 0 0.0
54-59 43 4 9.3 6 14.0 33 76.7 0 0.0
Total 699 21 3.0 53 7.6 622 89.0 3 0.4
Table 9: Distribution of acute malnutrition and oedema based on weight-for-height z-scores
<-3 z-score >=-3 z-score
Oedema present Marasmic kwashiorkor
No. 0 (0.0 %)
Kwashiorkor
No. 3 (0.4 %)
Oedema absent Marasmic
No. 21 (3.0 %)
Not severely malnourished
No. 675 (96.6 %)
Protein-energy malnutrition is a nutritional deficiency resulting from either inadequate energy (caloric) or protein intake and manifesting
in either marasmus or kwashiokor. Marasmus is characterised by wasting of body tissues, particularly muscles and subcutaneous fat, and
is usually a result of severe restrictions in energy intake. Kwashiokor affects mainly children, is characterised by oedema (particularly
ascites), and is usually the result of severe restrictions in protein intake. However, both types can be present simultaneously (marasmic
kwashiokor) and mask malnutrition due to the presence of oedema. Table 9 shows that 3% of the children had marasmus without oedema
and 0.4% presented with kwashiorkor (with oedema).

22
Table 10: Prevalence of underweight based on weight-for-age z-scores by sex
All
n = 696
Boys
n = 351
Girls
n = 345
Prevalence of underweight
(<-2 z-score)
(116) 16.7 %
(13.7 - 20.2 95% C.I.)
(73) 20.8 %
(17.1 - 25.1 95% C.I.)
(43) 12.5 %
(8.8 - 17.4 95% C.I.)
Prevalence of moderate underweight
(<-2 z-score and >=-3 z-score)
(100) 14.4 %
(11.7 - 17.5 95% C.I.)
(61) 17.4 %
(14.1 - 21.2 95% C.I.)
(39) 11.3 %
(7.8 - 16.1 95% C.I.)
Prevalence of severe underweight
(<-3 z-score)
(16) 2.3 %
(1.3 - 4.1 95% C.I.)
(12) 3.4 %
(1.8 - 6.3 95% C.I.)
(4) 1.2 %
(0.4 - 3.1 95% C.I.)
Weight-for-age is a composite index of height-for-age and weight-for-height. It takes into account both acute and chronic malnutrition.
Children whose weight-for-age is below minus two standard deviations are classified as underweight. Children whose weight-for-age is
below minus three standard deviations (-3 SD) are considered severely underweight18. Underweight and stunting are age-dependent
indices and thus accurate age measurement is necessary for their determination. These findings therefore, need to be interpreted with
caution because of the inherent bias in the determination of the age of the children as many of them were based on recall. Table 10 shows
overall , 16.7% of children 6-59 months were underweight and 2.3% were severely underweight. Boys (20.8%) were more underweight
compared to girls (12.5%) this showed a statistical difference that is significant with a P. value of 0.0126. According to KDHS 2008, the
overall national average of underweight was 16% and among boys was 21% and 18.4% in girls. Table 11 shows that children in the Age age
group 54-59 months were highly underweight according to the survey.
Table 11: Prevalence of underweight by age, based on weight-for-age z-scores
Severe
underweight
(<-3 z-score)
Moderate underweight
(>= -3 and <-2 z-score )
Normal
(> = -2 z score)
Oedema
Age
(months)
Total no. No. % No. % No. % No. %
6-17 234 5 2.1 19 8.1 210 89.7 2 0.9
18-29 153 3 2.0 31 20.3 119 77.8 1 0.7
30-41 151 3 2.0 22 14.6 126 83.4 0 0.0
42-53 115 3 2.6 19 16.5 93 80.9 0 0.0
18
Kenya Demographic and Health Survey, 2003

23
54-59 43 2 4.7 9 20.9 32 74.4 0 0.0
Total 696 16 2.3 100 14.4 580 83.3 3 0.4
Table 12: Prevalence of stunting based on height-for-age z-scores and by sex
All
n = 689
Boys
n = 348
Girls
n = 341
Prevalence of stunting
(<-2 z-score)
(118) 17.1 %
(14.7 - 19.9 95% C.I.)
(71) 20.4 %
(16.3 - 25.3 95% C.I.)
(47) 13.8 %
(10.4 - 18.0 95% C.I.)
Prevalence of moderate stunting
(<-2 z-score and >=-3 z-score)
(91) 13.2 %
(10.9 - 15.9 95% C.I.)
(50) 14.4 %
(10.9 - 18.7 95% C.I.)
(41) 12.0 %
(8.7 - 16.5 95% C.I.)
Prevalence of severe stunting
(<-3 z-score)
(27) 3.9 %
(2.6 - 5.8 95% C.I.)
(21) 6.0 %
(3.8 - 9.4 95% C.I.)
(6) 1.8 %
(0.8 - 3.6 95% C.I.)
Stunting is an indicator of chronic malnutrition due to long-term food deprivation and is usually a sign of poverty. The findings e (Table 12)
indicated an overall global chronic malnutrition (GCM) rate of 17.1 % (14.7-19.9 CI) and a severe chronic malnutrition (SCM) rate of 3.9 %
(2.6-5.8 CI). The results showed that the differences between boys and girls were not statistically significant (p. value 0.281). Children in
the age group 42-53 were more stunted than the rest. According to KDHS, 2008, nationally, 35 percent of children under five are stunted,
while the proportion severely stunted is 14 percent.
Table 13: Prevalence of stunting by age based on height-for-age z-scores
Severe stunting
(<-3 z-score)
Moderate stunting
(>= -3 and <-2 z-score )
Normal
(> = -2 z score)
Age
(months)
Total
no.
No. % No. % No. %
6-17 230 6 2.6 16 7.0 208 90.4
18-29 149 10 6.7 25 16.8 114 76.5
30-41 153 5 3.3 22 14.4 126 82.4
42-53 114 6 5.3 21 18.4 87 76.3
54-59 43 0 0.0 7 16.3 36 83.7
Total 689 27 3.9 91 13.2 571 82.9
24
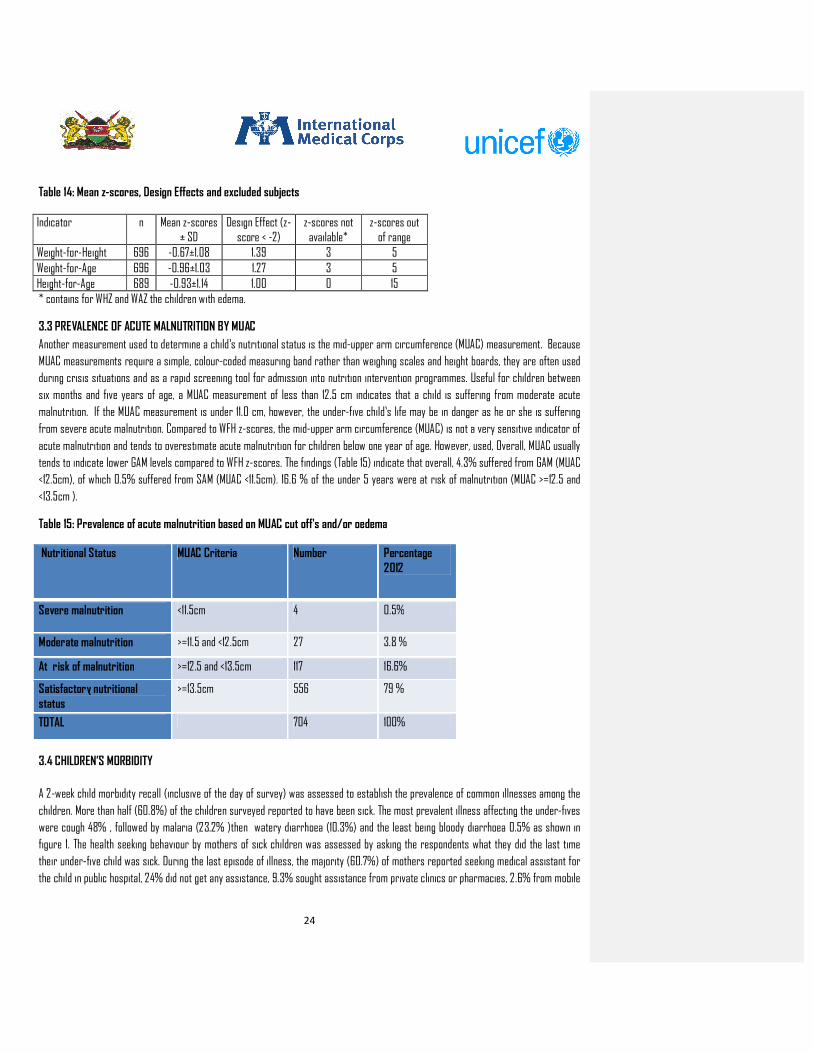
Table 14: Mean z-scores, Design Effects and excluded subjects
Indicator n Mean z-scores ± SD
Design Effect (z-score < -2)
z-scores not available*
z-scores out of range
Weight-for-Height 696 -0.67±1.08 1.39 3 5
Weight-for-Age 696 -0.96±1.03 1.27 3 5
Height-for-Age 689 -0.93±1.14 1.00 0 15
* contains for WHZ and WAZ the children with edema.
3.3 PREVALENCE OF ACUTE MALNUTRITION BY MUAC
Another measurement used to determine a child’s nutritional status is the mid-upper arm circumference (MUAC) measurement. Because
MUAC measurements require a simple, colour-coded measuring band rather than weighing scales and height boards, they are often used
during crisis situations and as a rapid screening tool for admission into nutrition intervention programmes. Useful for children between
six months and five years of age, a MUAC measurement of less than 12.5 cm indicates that a child is suffering from moderate acute
malnutrition. If the MUAC measurement is under 11.0 cm, however, the under-five child’s life may be in danger as he or she is suffering
from severe acute malnutrition. Compared to WFH z-scores, the mid-upper arm circumference (MUAC) is not a very sensitive indicator of
acute malnutrition and tends to overestimate acute malnutrition for children below one year of age. However, used, Overall, MUAC usually
tends to indicate lower GAM levels compared to WFH z-scores. The findings (Table 15) indicate that overall, 4.3% suffered from GAM (MUAC
<12.5cm), of which 0.5% suffered from SAM (MUAC <11.5cm). 16.6 % of the under 5 years were at risk of malnutrition (MUAC >=12.5 and
<13.5cm ).
Table 15: Prevalence of acute malnutrition based on MUAC cut off's and/or oedema
Nutritional Status MUAC Criteria Number Percentage 2012
Severe malnutrition <11.5cm 4 0.5%
Moderate malnutrition >=11.5 and <12.5cm 27 3.8 %
At risk of malnutrition >=12.5 and <13.5cm 117 16.6%
Satisfactory nutritional status
>=13.5cm 556 79 %
TOTAL 704 100%
3.4 CHILDREN’S MORBIDITY
A 2-week child morbidity recall (inclusive of the day of survey) was assessed to establish the prevalence of common illnesses among the
children. More than half (60.8%) of the children surveyed reported to have been sick. The most prevalent illness affecting the under-fives
were cough 48% , followed by malaria (23.2% )then watery diarrhoea (10.3%) and the least being bloody diarrhoea 0.5% as shown in
figure 1. The health seeking behaviour by mothers of sick children was assessed by asking the respondents what they did the last time
their under-five child was sick. During the last episode of illness, the majority (60.7%) of mothers reported seeking medical assistant for
the child in public hospital, 24% did not get any assistance, 9.3% sought assistance from private clinics or pharmacies, 2.6% from mobile

25
outreach, 2.3% from traditional healers and finally 1.1% from shops. Of the children who had diarrhoea, 10.7% were given Oralite &zinc,
6.7% home- made salt/sugar and 82.6 % did nothing to the child as shown in table 16
Figure 1: Symptom breakdown in the children in the two weeks prior to interview (n=428)
Table 16: Zinc supplementation during last Diarrhoea episodes
Management of last DD Episode (N=46) %
Oralite/ORS /Zinc 10.7
Home-made salt/sugar solution 6.5
Nothing 82.6
3.5 CHILD FEEDING, CARE AND HEALTH
3.5.1 Infant and Young Child Feeding Practices
The findings indicate that practically all children (98.5%) were reported to have breastfed. The main reason for children who were not
breastfed was that there was no milk from the mother’s breast. Early initiation of breastfeeding is encouraged for a number of reasons.
Mothers benefit from early suckling because it stimulates breast milk production and facilitates the release of oxytocin, which helps the
contraction of the uterus and reduces postpartum blood loss. The first breast milk contains colostrum, which is highly nutritious and has
antibodies that protect the new-born from diseases. Early initiation of breastfeeding also fosters bonding between mother and child. The
proportion of infants reportedly put on the breast within the first hour of birth was 78.1 %. Of the children who reported to have ever
breastfed 98.2% received colostrum during the first 3 days of birth. 12.9% of the infants were reportedly given pre-lacteals. Giving pre-
lacteals interferes with optimal establishment of breastfeeding and may also give rise to infections such as diarrhoea in infants. Among
infants given pre-lacteals, the most frequently given item was plain water (46 %), sugar/glucose water or honey 46%, and finally by
animal milk and its products (8%).
48.8%
23.2%
10.3%
6.6%
3.8%2.8%
0.9% 0.5% 3.1%
Cough
Malaria
Water Diarreah
Stomache
Eye Infection
Skin infections
Measles
Blood Diarrohea
Others

26
Practically all (97.6%) of the children less than 6 months were reported to have been breastfeeding during the survey. However, the
frequency of breastfeeding fell short of the ‘on-demand’ rule only 36.9% were breastfed more than 12 times during the preceding day. The
WHO recommends that infants should be breastfed at least twice every 2 hours, which translates to 12 times a day. Exclusive
breastfeeding was computed among infants who had not received pre-lacteals and were not on other foods. The findings revealed that
77.3% were exclusively breastfed compared to a national average of 32%16 according to the Kenya Demographic and Health Survey
(KDHS) report. Out of those who were not exclusively breastfed, the average age when complememntary feeding was started was 136day
(SD 69 days).. The findings of the FGDs revealed that the main type of food babies are introduces to is porridge; boiled potatoes and
animal milk because they make the baby strong and will satisfy the baby faster.
Exclusive breastfeeding is recommended because breast milk is uncontaminated and contains all the nutrients necessary for children in
the first few months of life. In addition, the mother’s antibodies in breast milk provide immunity to disease. Early supplementation is
discouraged for several reasons. First, it exposes infants to pathogens and increases their risk of infection, especially disease. Second, it
decreases infants’ intake of breast milk and therefore suckling, which reduces breast milk production. Third, in low-resource settings,
supplementary food is often nutritionally inferior.
After 6 months children should receive other foods in addition to breast milk since the nutrients from breast milk alone cannot meet all
the needs for accelerated growth and development. In the transition to eating the family diet, children from the age of 6 months should be
fed small quantities of solid and semisolid foods throughout the day. During this transition period (ages 6-23 months), the prevalence of
malnutrition increases substantially in many countries because of increased infections and poor feeding practices.
The findings indicated that 88.3% of children maintained breast feeding up to 2 years. The foodstuffs given to children between the ages
of 6-24 months are referred to as complementary foods. Assessment of complementary feeding was therefore computed for children
above 6 months. Dietary diversity is a qualitative measure of food consumption that reflects household access to a wide variety of foods,
and is also a proxy of the nutrient intake adequacy of the diet for individuals. Dietary diversity scores (DDS), were created by summing up
the number of food groups consumed the previous day to aid in understanding if and how the diets are diversified. According to the Food
and Agricultural Organization (FAO), dietary diversity scores are meant to reflect, in a snap shot, the economic ability of a household to
consume a variety of foods17. A score of 1 was allocated to each of the 8 food groups that were consumed by the child and a score of 0 for
each of the food groups not consumed and thus the highest possible score was 8. Children who had consumed less than four food groups
were classified as the low dietary diversity group and those with a score of 4 or more as high dietary diversity group. The dietary
diversity questionnaire tool was based on the 24-hour food intake recall.
On average the mean food diversity was 3.4 (SD 1.9) given to children > 6 months. The findings showed that overall, 54.9 % of the children
samples consumed low dietary diversity of less than four groups, a threat to optimal child growth and development while only 45.1% of
the households had children >6 months who consumed 4 or more of the food group. 66% of children > 6 month who were still
breastfeeding at the time of the survey consumed 3 or more food groups while 48 % of non-breastfeeding children consumed 4 or more
food groups. The mean frequency of feeding children between age 6-23 months was 3.1 (SD 1.4).67% of breast feeding children between
age 6-23 months were taking more than three meals a day according to the survey. For the non-breastfeeding children (6-23 months )
only 17% were having more than four meals a day. An analysis of the food groups taken by children (Figure 2) indicates that relatively low
proportions took meat, poultry and sea foods. The food group taken by the highest proportion of children was Dairy products (22%,) and
carbohydrates (20%).The reason given from FGD for low intake of meat products was that households lacked enough money to buy meat
and fish products due to high prices in the market.
16 Kenya National Bureau of Statistics (June 2010): Kenya Demographic and Health Survey. 17 Guidelines for measuring household and individual dietary diversity. Version 2, June 2007. Prepared by FAO Nutrition and Consumer
Protection Division with the support from EC/FAO Food Security Information for Action Programme and the Food and Nutrition Technical
Assistance (FANTA) Project. Rome, Italy

27
Figure 2: food groups taken by children 6-23 months in the previous 24 hrs
3.5.2 Child Immunization, Vitamin A Supplementation and Deworming
A serious contributor to childhood morbidity and mortality is micronutrient deficiency. Children can receive micronutrients from foods,
food fortification, and direct supplementation. Vitamin A is an essential micronutrient for the immune system and plays an important role
in maintaining the epithelial tissue in the body. Severe vitamin A deficiency (VAD) can cause eye damage. VAD can also increase severity of
infections such as measles and diarrhoeal diseases in children and slow recovery from illness. Vitamin A is found in breast milk, other
milks, liver, eggs, fish, butter, red palm oil, mangoes, papayas, carrots, pumpkins, and dark green leafy vegetables. The liver can store an
adequate amount of the vitamin for four to six months. Periodic dosing (usually every six months) of vitamin A supplements is one method
of ensuring that children at risk do not develop VAD. Vitamin A supplementation is carried out as part of routine disease treatment in
health facilities in Kenya. From the survey, an overall 90.8% of the under 5 years were reported to have received vitamin A
supplementation. 58.5 % of those who received Vitamin A were aged 6-11 months while 41.9 % where in the age group 12-59 months as
shown in the table below.
Table 17: Vitamin A supplementation
22%
20%
18%
11%
10%
10%
5%4%
Food groups
Dairy products
Grains roots or tubers
Fats and Oils
VitaminA rich plant foods
Pulses Legumes Nuts and
Seeds
Fruits and other
vegetables
Eggs
Meat poultry fish sea food
Vitamin A
6-59 months
N=704
Vitamin A
6-11 months
N=117
Vitamin A
12-59 months ( received twice in the last 1
year) N=587
90.8% 92.3% 41.9 %

28
Child immunization is crucial as it prevents and/or reduces the severity of certain diseases in young children .The immunization coverage
rates for polio 1 was (97.1%), polio 3 (95.3%) and measles (95.1 %) were commendably high and above the Kenya Expanded Programme on
Immunization (KEPI) recommendation of 80%. Deworming is crucial in warding off the debilitating effects that helminthic infections cause
among growing children.77.6 % of children reported to have been dewormed (table 18). Inadequate amounts of iodine in the diet are
related to serious health risks for young children. The survey results show that nearly all children (98.7%) live in households with
adequately iodized salt.
Table 18: Vaccination coverage: OPV 1 & 3 for 6-59 months and measles at 9 months and deworming for 12-59 months
3.6 MATERNAL HEALTH
The health care that a mother receives during pregnancy, at the time of delivery, and soon after delivery is important for the survival and well-being of both the mother and her child. It is during an antenatal care visit that screening for complications occurs and advice is given on a range of issues, including place of delivery and referral of mothers. Overall, 94 % (figure 3) of mothers reported having attended MCH clinics and received the necessary care and advice including iron
folate supplementation during their last pregnancy with a mean frequency of 3.6 (SD 1.4) clinic visits. Despite the high ANC uptake only
37.7 % of the women delivered in the hospital, 46.1% delivered at home with assistance from traditional birth attendants (TBAs), 3.9%
delivered at home without assistance, and 1 % delivered at home with assistance from nurse. Some of the Major reason as to why they did
not attend ANC clinics were : they were not aware of the importance of ANC (9.1%),TBA services are adequate (9.1%) ,cultural barriers
(3%) ,health facility was too far ( 63.6%).
The participation of TBAs in child deliveries is currently discouraged by WHO because the services they offer fall short of the minimum
care that delivering mothers should receive. However, in many remote areas where there is limited access to conventional health care,
they might be the only practical care that delivering mothers have access to. It is, therefore, recommended that children who are born
outside a health facility setup should be taken to a health facility within 2 weeks of birth to allow for optimal health check-up and
administration of the zero dose polio antigens. On the whole, only (36%) of the children delivered at home were taken for medical
attention within the recommended 2-week period. Of the mothers who delivered at home 71.8% took the child to the clinic within first 2
weeks, 14.8% between 2 weeks and 1 month. 10.6% after 1 month and 0.6% doesn’t intend to take child to clinic.
Measles
n=644
OPV 1
n=704
OPV 3
n=704
Deworming (12-
59 Months)
N=587
YES
with
card
n=279
With
Recall
from
mother
n=275
with
card
n=360
With Recall
from
mother
n=322
with card
n=347
With Recall
from
mother
n=321
with
card
n=91
With
Recall
from
mother
n=229
% 72.7 22.4 75.3 22.4 72.3 23 45.3 32.3
Overall
%
95.1 97.7 95.3 77.6

29
Maternal vitamin A supplementation within 2 weeks after birth is crucial and recommended by WHO as a means to boost its content in
breast milk as well as promote maternal recovery following delivery. 76.4 % of mothers reported having received vitamin A
supplementation following their last delivery. 63.5% and 65.8% of the mothers were given de-wormers and iron/folate tablets
respectively during their last pregnancy.
On average most health facilities are located 73 (SD 79) minutes’ walk away. The amount of time spent outside the home by mothers has a
direct influence on both the quality and quantity of care that mothers are able to give to their children, which influences child health,
growth and development. It also influences willingness and ability to access and utilize medical care services.
Figure 3: Ante-natal care visits for women aged 15-49years who ever got pregnant.
3.7 INSECTICIDE TREATED MOSQUITO NETS (ITN) HOLDING RATES AND UTILIZATION
Malaria is the leading cause of morbidity and mortality in Kenya, with close to 70 percent (24 million) of the population at risk of
infection19 .Although malaria affects people of all age groups, children under five years of age and pregnant women living in malaria
endemic regions are most vulnerable. The human toll that malaria exacts and the economic and social impacts are devastating: sick
children miss school, working days are lost, Malaria disproportionately affects the rural poor who can neither afford insecticide-treated
bed nets for prevention nor access appropriate treatment when they fall sick.
In order to achieve the Kenya Vision 2030 goal for the health sector which is to provide equitable, affordable, quality health services to
all Kenyans , division of malaria control provides free insecticide treated mosquito nets (ITNs) to expectant mothers attending MCH
clinics. 73.6 % of the households reported having mosquito nets, most (79.6%) of which had been sourced from the MoMS or Mission
hospitals, while 15.0 % and 6.4 % had obtained the nets from shops and non-governmental organizations (NGOs), respectively. The nets
obtained from hospitals and NGOs are treated with long-term insect-repelling chemicals while the ones obtained from shops or vendors
may not be treated, which makes it necessary to wash them in the chemicals to repel mosquitoes and other insects. The proportion of
households that reported treating nets they had obtained from shops was 43.3%. The reported utilization of the nets during the night
preceding the survey was highest (26.8%) among the under-fives followed by non-pregnant mothers (26.3%), children above five years
(22%), fathers of children (21.6%), and pregnant women (3.3%).
19
Ministry of Health, 2004
0%
20%
40%
60%
80%
100%
yes no Mother never
delivered
94%
5%0%
Ante-Natal visits

30
Figure 4 : Mosquito net utilization a day prior to the survey.
3.8 WATER, SANITATION AND HYGIENE PRACTICES
There were several sources of water for household use reported by the survey respondents. 56% of the households got water from tap
for general use and drinking respectively. Other sources of water reported for general use and drinking were; Rivers, lagga boreholes,
protected wells and unprotected well. The findings show very minimal treatment of drinking water at the household level with 66% did not
treat water before drinking, 23% used chemicals to treat their water while 10 % boiled drinking water.On average, it takes a caregiver
about 41.4 minutes (SD 45) to access their main source of water and use 80 (SD 55.5) litres of water per day (which translates to about
four 20-litre jerricans). Households buying water in jerricans paid on average Kshs 7.49 (SD 14.2) per 20-litre jerrican. Communities
should be encouraged to boil their drinking water at the household level, being the most viable and cheap method.
Figure 5 : sources of water for general household usage and drinking
26.8 26.3
22.0 21.6
3.3
0.0
5.0
10.0
15.0
20.0
25.0
30.0
Children<5years Nonpregnant
woman
Children >5years Father Pregnant
woman
P
e
r
c
e
n
t
a
g
e
Category who slept under mosquito net
Mosquito net utilization
0%
10%
20%
30%
40%
50%
60%56%
20%
13%
4% 3% 2% 1% 0% 0%
General and Domestic House hold water sources
n=700
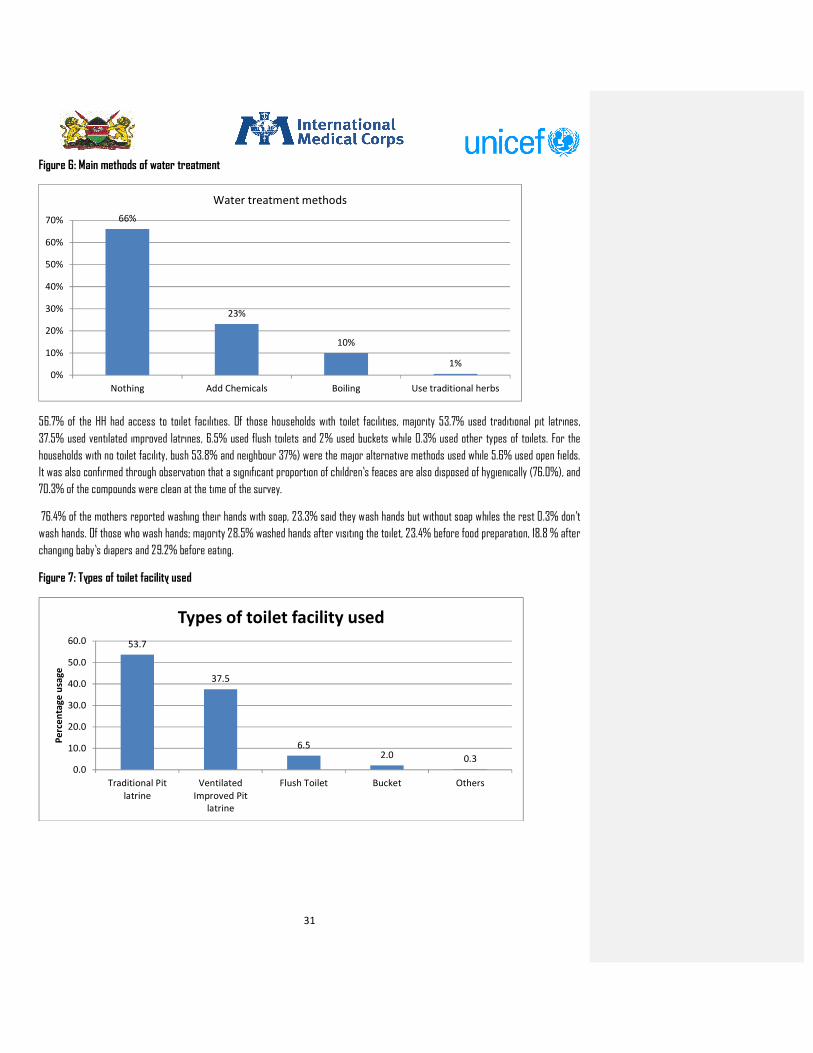
31
Figure 6: Main methods of water treatment
56.7% of the HH had access to toilet facilities. Of those households with toilet facilities, majority 53.7% used traditional pit latrines,
37.5% used ventilated improved latrines, 6.5% used flush toilets and 2% used buckets while 0.3% used other types of toilets. For the
households with no toilet facility, bush 53.8% and neighbour 37%) were the major alternative methods used while 5.6% used open fields.
It was also confirmed through observation that a significant proportion of children’s feaces are also disposed of hygienically (76.0%), and
70.3% of the compounds were clean at the time of the survey.
76.4% of the mothers reported washing their hands with soap, 23.3% said they wash hands but without soap whiles the rest 0.3% don’t
wash hands. Of those who wash hands; majority 28.5% washed hands after visiting the toilet, 23.4% before food preparation, 18.8 % after
changing baby’s diapers and 29.2% before eating.
Figure 7: Types of toilet facility used
66%
23%
10%
1%
0%
10%
20%
30%
40%
50%
60%
70%
Nothing Add Chemicals Boiling Use traditional herbs
Water treatment methods
53.7
37.5
6.52.0 0.3
0.0
10.0
20.0
30.0
40.0
50.0
60.0
Traditional Pit
latrine
Ventilated
Improved Pit
latrine
Flush Toilet Bucket Others
Pe
rce
nta
ge
usa
ge
Types of toilet facility used
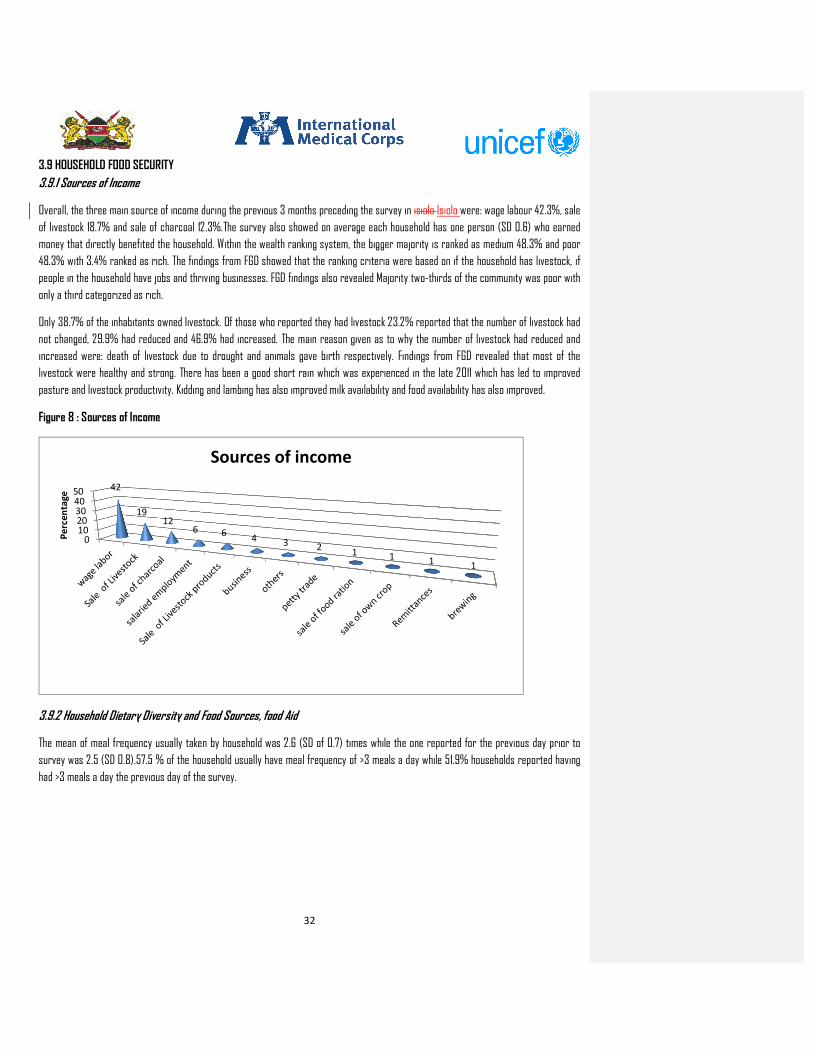
32
3.9 HOUSEHOLD FOOD SECURITY
3.9.1 Sources of Income
Overall, the three main source of income during the previous 3 months preceding the survey in isiolo Isiolo were: wage labour 42.3%, sale
of livestock 18.7% and sale of charcoal 12.3%.The survey also showed on average each household has one person (SD 0.6) who earned
money that directly benefited the household. Within the wealth ranking system, the bigger majority is ranked as medium 48.3% and poor
48.3% with 3.4% ranked as rich. The findings from FGD showed that the ranking criteria were based on if the household has livestock, if
people in the household have jobs and thriving businesses. FGD findings also revealed Majority two-thirds of the community was poor with
only a third categorized as rich.
Only 38.7% of the inhabitants owned livestock. Of those who reported they had livestock 23.2% reported that the number of livestock had
not changed, 29.9% had reduced and 46.9% had increased. The main reason given as to why the number of livestock had reduced and
increased were: death of livestock due to drought and animals gave birth respectively. Findings from FGD revealed that most of the
livestock were healthy and strong. There has been a good short rain which was experienced in the late 2011 which has led to improved
pasture and livestock productivity. Kidding and lambing has also improved milk availability and food availability has also improved.
Figure 8 : Sources of Income
3.9.2 Household Dietary Diversity and Food Sources, food Aid
The mean of meal frequency usually taken by household was 2.6 (SD of 0.7) times while the one reported for the previous day prior to
survey was 2.5 (SD 0.8).57.5 % of the household usually have meal frequency of >3 meals a day while 51.9% households reported having
had >3 meals a day the previous day of the survey.
01020304050 42
1912
6 64 3 2
1 11
1
Pe
rce
nta
ge
Sources of income

33
Figure 9 Frequency of meals taken in household
At the household level, the dietary diversity score (DDS) is indicative of the ability to acquire a variety of foods, including foods that may
not have high nutrient value such as beverages and condiments. The previous 24-hours’ food intake by mothers was used as a proxy to
assess household dietary diversity in this survey. Food intake by caretakers is a good estimation of the variety of what other members of
the households took (excluding the U5s). The 12 major food groups inquired about are cereals, fish and sea food, roots and tubers,
vegetables, fruits, meat and poultry , eggs, legumes, milk and milk products, fats and oils, sugar and sweets, condiments and
miscellaneous(spices, sweets, unsweetened beverages). A diverse diet was indicated by consumption of four or more food groups
On average the mean Individual Diet Diversity Score was 4.1 (SD 1.6) for the number of food groups consumed. Overall, majority (64.9%) of
the caregivers consumed at least four food groups in the previous 24 hours (above the threshold for a diverse diet) as shown in table 18.
A high proportion (92.1%) of households reported that all members took the meals prepared the previous day, with the main reason given
for those who did not take meals at home being that the food was not enough. Figure 10 shows that the most common foods consumed by
the households were Cereals and cereal products, sugar, honey and commercial juices and Fats and oils. The least consumed foods
groups were fruits, eggs and fish. The uncharacteristic low consumption of meat, Vegetables and fruits was explained in FGDs by the fact
that they were inaccessible because of increased prices from the market.
Table 19: Household Dietary Diversity Scores
Diet Diversity Groups May 2012 %
Low Diversity Groups (<=3 food groups) 35.4
Medium Diversity Groups (4-5 food groups) 48
High Diversity Groups (>6 food groups) 16.5
8
35
53
41
12
36
48
3 1
0
10
20
30
40
50
60
1 2 3 4 5
pe
rce
nta
ge
of
case
s
number of meals taken
Meal Frequency
Usual
yesterday

34
Figure 10 Ratio of foods groups consumed in 24-hour recall
Table 19 shows that majority of the households (73.6%) purchased food while only 0.2% got wild food. Within the last three months 33.3%
of the households received general food aids which lasted them a mean of 23 (SD 23) days. Of those who had received food aids,
households reported receiving, on average, 10 kgs of maize, 7kgs of beans, 7litres of vegetable oil, 8kg of peas, 9kg of unimix, and 24kg of
rice .
Table 20: Main Sources of food consumed in 24 hr recall
15.7% of responded reported that they cultivated land, on average 1 acres was cultivated per household. According to the responses given
during FGD, there is low food at the household level due to poor rains experienced in March –May 2012 season. Food was available in the
market but the prices were high and therefore hindering them to purchase.
0 5 10 15 20 25
Cereals and cereal products
Sugars Honey and commercial juices
Fats and oils
Milk and milk products
Vegetables
Pulses legumes nuts seeds
Roots and tubers
Miscellaneous
Meats and poultry
Fruits
Eggs
Fish and sea foods
23
18
17
10
9
7
5
4
3
1
1
1
percentages
Variety of Food consumed
Food source percentage
Purchase 73.6
Food aid 17.7
Own production 4.1
Borrowed/credit 2.3
Gift from relatives 2
Wild food 0.2
Totals 100
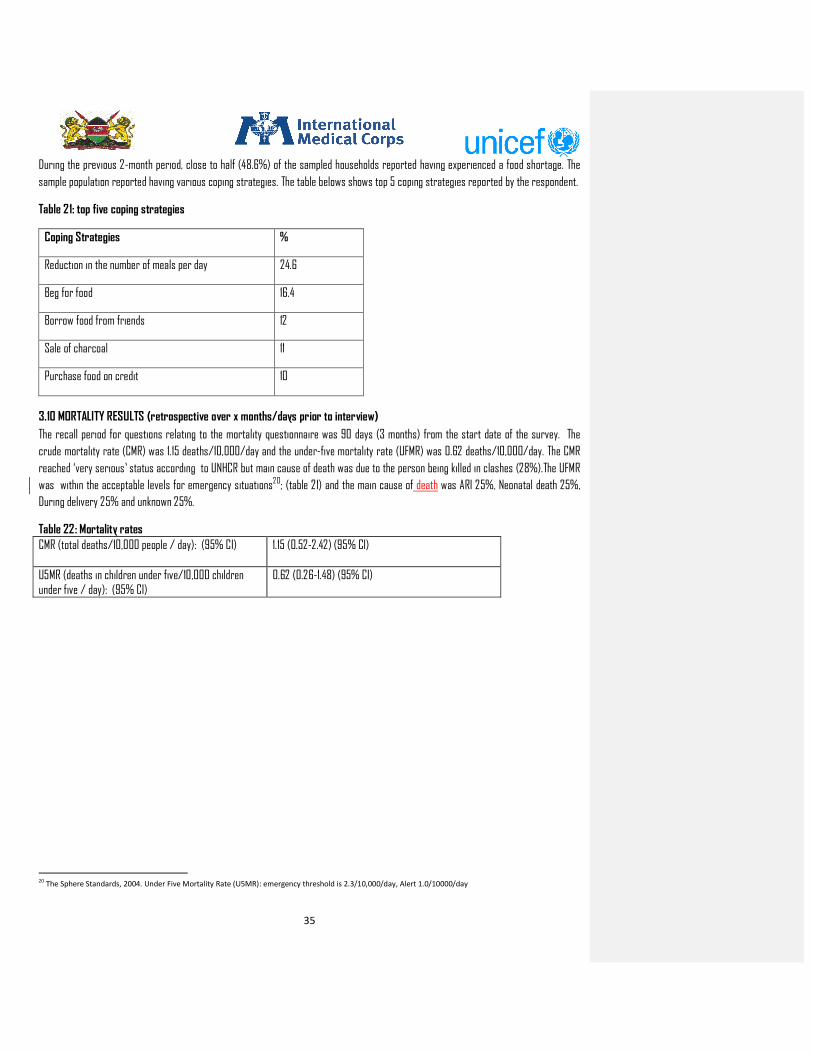
35
During the previous 2-month period, close to half (48.6%) of the sampled households reported having experienced a food shortage. The
sample population reported having various coping strategies. The table belows shows top 5 coping strategies reported by the respondent.
Table 21: top five coping strategies
Coping Strategies %
Reduction in the number of meals per day 24.6
Beg for food 16.4
Borrow food from friends 12
Sale of charcoal 11
Purchase food on credit 10
3.10 MORTALITY RESULTS (retrospective over x months/days prior to interview)
The recall period for questions relating to the mortality questionnaire was 90 days (3 months) from the start date of the survey. The
crude mortality rate (CMR) was 1.15 deaths/10,000/day and the under-five mortality rate (UFMR) was 0.62 deaths/10,000/day. The CMR
reached ‘very serious’ status according to UNHCR but main cause of death was due to the person being killed in clashes (28%).The UFMR
was within the acceptable levels for emergency situations20; (table 21) and the main cause of death was ARI 25%, Neonatal death 25%,
During delivery 25% and unknown 25%.
Table 22: Mortality rates
CMR (total deaths/10,000 people / day): (95% CI) 1.15 (0.52-2.42) (95% CI)
U5MR (deaths in children under five/10,000 children under five / day): (95% CI)
0.62 (0.26-1.48) (95% CI)
20
The Sphere Standards, 2004. Under Five Mortality Rate (U5MR): emergency threshold is 2.3/10,000/day, Alert 1.0/10000/day

36
4. CONCLUSION
• Decrease in GAM rates from 15.7% to 11.0% though not significant can be linked to good short rains which was experienced in the late 2011 which has led to improved pasture and livestock productivity. Kidding and lambing has also improved milk availability and food availability has also improved. This also followed BSFP interventions (Sept 2011-Feb 2012), out reaches have helped in reaching malnourished cases in far to reach areas. OJTs enhanced capacities of health workers and CHWs in active case finding.
• Formation of mother to mother support groups from 4 to 181 has increased IYCN components. This has greatly improved EBF from 58% in survey done in 2011 to 76.5% 2012 survey.
• Continuous OJT for health workers and community health worker has greatly improved HINI components especially for Vitamin A (56.3% 2011 to 90.8% 2012) supplementation and deworming (41% 2011 to 90.8% 2012).
• Decrease in food diversity was attributed to poor and damaged roads which lead to increase in market food prices and thus poor access to food.
5. RECOMMENDATION • Strengthen Community Led Total Sanitation and community awareness to increase toilet usage cover. 56.7% of households have
access to toilet. • Emphasis on the usefulness of hospital deliveries through mother to mother support group. • Facilitate supply of zinc supplementation in the government hospitals. • Improve coverage and reporting in deworming • Treatment of drinking water through boiling. 66% of household reported that they do not treat water. • Training of the community on appropriate hand washing. Only 76.4% of responded reported to wash hands with soap and water. • Constitution of balanced diets using locally available foodstuffs (with continued agricultural diversification). 54.9 % of the
children samples consumed low dietary diversity of less than four groups • Infrastructural improvement to improve access to markets and facilitate general development in all areas of the County • Further research is need to find out why malnutrition is highest in the older age group 42-59 months

37
6. APPENDICES
Appendix 1
Sample Size IYCF Isiolo District.xls
Appendix 2
Final Household Questionnaire.doc
Appendix 3
Final 6-59 months Questionnaire.doc
Appendix 4
Final IYCF Questionnaire.doc
Appendix 5
Final Mortality Questionnaire.doc
Appendix 6
Final FGD Questionnaire.doc
Appendix 7
selected clusters -Isolo county.xlsx
Comment [I1]: I would recommend that we
insert the document as a whole rather than icons
since it will be shared in PDF.

38
Appendix 8
Indicator Survey value Acceptable value/range Interpretations/ Comments
Digit preference score - weight 5 <10 Excellent
Digit preference - height 5 <10 Excellent
WHZ ( Standard Deviation) 1.08 0.8-1.2 Good
WHZ (Skewness) -0.21 -1 to +1 Excellent
WHZ (Kurtosis) -0.06 -1 to +1 Excellent
Percent of flags WFH 0.7 % <3% Excellent
Overall Survey Score 11%
Age distribution (%)
Group1 6-17 mo 33.8 % 20%-25%
Group 2 18-29 mo 21.9 % 20%-25%
Group 3 30-41 mo 21.9 % 20%-25%
Group 4 42-53 mo 16.3 % 20%-25%
Group 5 54-59 mo 6.1 % Ard 10%
Age Ratio : G1+G2/G3+G4+G5 1.26 Ard 1.0
Overall Sex Ratio 1.03 0.8-1.2 Excellent

39
Appendix 9