Benefits Of Working With Apa Aesthetic Dental & Cosmetic Centre

1
ISAPS International Survey on Aesthetic/Cosmetic Procedures Performed in 2013 Methodology: Survey participants completed a two-page questionnaire that focused on the number of surgical and non-surgical procedures they performed in 2013. The International Society of Aesthetic Plastic Surgery (ISAPS) issued an invitation to participate in the study to approximately 35,000 Plastic Surgeons whose contact information is housed in its proprietary database. In addition, a request was made that all National Societies encourage their members/constituents to take part in the survey. Data from a total of 1,567 plastic surgeons were compiled for this survey. Final figures have been projected to reflect international statistics and are exclusively based on the estimated number of Plastic Surgeons in each country and the respondent sample. This International Survey is focused on physicians who are board certified (or national equivalent) Plastic Surgeons. To aid in tallying the world-wide estimate of plastic surgeons, representatives from National Societies provided the counts for over 96% of the 40,000 total estimated plastic surgeons. For those cases in which the National Society did not provide its country’s total, a simple regression equation was used to estimate the number of plastic surgeons in the country based on its population size and Gross Domestic Product. Studies such as this must often address outlying responses. Though the outlying values may be legitimate, their presence can distort the averages, which provide the basis of the estimated projections. Significant outliers in this survey were adjusted in order to protect the accuracy of the extrapolated values. Additional standard data editing procedures were followed to ensure responses met survey guidelines. The survey methodology followed for this year’s survey was adjusted from previous years. Country-specific data are only shown for those countries that provided a sufficient survey response for the figures to be considered valid. No adjustments other than standard data editing procedures were applied to country-specific results. The International Survey on Aesthetic/Cosmetic Procedures Performed in 2013 was compiled, tabulated, and analyzed by Industry Insights, Inc. (www.industryinsights.com), an independent research firm based in Columbus, OH. The survey leader was Scott Hackworth, a CPA and research analyst who along with his firm has conducted various forms of research on trends in Aesthetic Plastic Surgery for over 15 years.

2
International Study on Aesthetic/Cosmetic Procedures Performed in 2013
World-Wide Total
USA Brazil Mexico Germany Spain Colombia Italy Venezuela Argentina Iran
Estimated Number of Plastic Surgeons in Country 40,277 6,133 5,473 1,550 1,101 942 950 800 503 347 238 TOTAL PROCEDURES
Face and Head Eyelid Surgery 1,379,263 124,684 116,849 44,454 48,675 21,242 24,396 27,952 21,322 9,667 7,571
Nose Surgery 954,423 45,998 77,224 50,437 30,872 10,946 24,919 15,200 14,919 9,549 37,423 Facelift 581,193 83,102 78,045 27,900 16,867 8,666 11,305 8,472 8,853 7,346 3,032 Threadlifts 165,201 15,333 31,743 4,697 958 13,386 722 2,592 1,006 1,006 293 Facial Implants 190,940 23,673 17,623 14,787 2,103 3,523 3,002 496 1,278 3,192 4,622 Ear Surgery 391,508 16,988 50,352 12,028 10,041 9,891 8,417 6,968 6,358 4,629 3,277 Hair Transplantation 108,019 3,189 8,319 3,441 4,052 735 3,572 1,224 322 3,123 726 Total Face & Head Procedures 3,770,546 312,967 380,155 157,744 113,568 68,389 76,333 62,904 54,057 38,514 56,944 Breast
Breast Augmentation 1,773,584 313,703 226,090 57,691 55,160 38,820 44,403 26,520 38,500 19,678 8,630 Breastlift 775,462 108,002 139,835 28,582 18,255 12,849 19,618 10,352 27,972 7,735 6,569 Breast Reduction 641,189 77,644 115,097 18,631 19,642 9,863 14,003 6,656 13,048 4,750 9,396 Gynecomastia 263,179 17,663 34,754 8,727 10,548 6,396 4,114 6,496 5,367 3,369 2,137 Total Breast Procedures 3,453,414 517,012 515,776 113,631 103,604 67,928 82,137 50,024 84,886 35,533 26,732 Body & Extremities
Tummy Tuck 838,864 119,961 129,601 47,120 19,554 13,141 28,215 9,760 20,668 11,118 7,954 Post Bariatric 292,442 53,786 50,461 7,735 8,213 4,964 5,976 7,104 5,930 1,381 1,140 Upper Armlift - Brachioplasty 126,642 14,351 13,573 9,037 5,813 1,413 2,375 2,424 3,093 1,568 1,595 Liposuction 1,614,031 235,814 227,896 62,713 53,134 37,256 50,559 16,328 32,786 17,766 10,546 Vaginal Rejuvination - Labiaplasty 114,135 6,072 13,683 3,519 9,711 2,487 3,145 1,176 2,424 1,360 317 Penile Enlargement 15,414 61 219 295 2,786 471 266 256 473 73 12 Gluteoplasty, Buttock
Augmentation 319,960 11,959 63,925 37,743 1,894 3,994 21,546 1,552 10,090 4,126 697 Total Body & Extremities 3,321,486 442,005 499,357 168,160 101,105 63,726 112,081 38,600 75,465 37,393 22,260 Miscellaneous
Lipostructure - Lipofilling - Stem Enhanced Lipofilling 1,053,890 180,372 96,434 46,965 25,202 13,254 21,404 31,152 17,333 9,213 12,143
Total Miscellaneous Procedures 1,053,890 180,372 96,434 46,965 25,202 13,254 21,404 31,152 17,333 9,213 12,143
Total Surgical Procedures 11,599,336 1,452,356 1,491,721 486,499 343,479 213,297 291,954 182,680 231,742 120,652 118,079
3
International Study on Aesthetic/Cosmetic Procedures Performed in 2013
World-Wide Total
USA Brazil Mexico Germany Spain Colombia Italy Venezuela Argentina Iran
Non-Surgical Procedures Laser hair Removal 1,440,252 167,676 71,149 63,597 5,802 16,325 16,397 6,584 1,232 42,102 7,604
Facial Rejuvenation, non-invasive 1,307,300 287,883 61,188 50,220 2,653 28,326 16,369 8,280 6,876 24,911 2,385 Sclerotherapy 119,067 19,994 14,722 4,464 1,167 6,142 1,026 3,856 0 3,491 12 Fillers, Resorbable 3,089,686 614,772 140,984 75,082 129,279 69,209 29,327 89,576 5,241 30,640 10,781 Chemical Peel, CO2 Resurfacing,
Dermabrasion 773,442 182,211 53,307 26,629 9,678 20,300 5,121 7,808 7,138 17,569 1,854 Botulinum Toxin 5,145,189 1,271,739 308,185 177,863 162,056 93,578 60,762 76,472 39,159 48,459 34,063 Total Non-Surgical Procedures 11,874,937 2,544,275 649,536 397,854 310,636 233,880 129,001 192,576 59,646 167,171 56,699 Total Procedures 23,474,273 3,996,631 2,141,257 884,353 654,115 447,177 420,955 375,256 291,388 287,823 174,778

4
Total Face & Head Procedures Rank * Country: % of World-Wide Total
1 Brazil 380,155 10.1% 2 USA 312,967 8.3% 3 Mexico 157,744 4.2% 4 Germany 113,568 3.0% 5 Colombia 76,333 2.0% 6 Spain 68,389 1.8% 7 Italy 62,904 1.7% 8 Iran 56,944 1.5% 9 Venezuela 54,057 1.4%
10 Argentina 38,514 1.0%
Total Breast Procedures Rank * Country: % of World-Wide Total
1 USA 517,012 15.0% 2 Brazil 515,776 14.9% 3 Mexico 113,631 3.3% 4 Germany 103,604 3.0% 5 Venezuela 84,886 2.5% 6 Colombia 82,137 2.4% 7 Spain 67,928 2.0% 8 Italy 50,024 1.4% 9 Argentina 35,533 1.0%
10 Iran 26,732 0.8%
Total Body & Extremities Rank * Country: % of World-Wide Total
1 Brazil 499,357 15.0% 2 USA 442,005 13.3% 3 Mexico 168,160 5.1% 4 Colombia 112,081 3.4% 5 Germany 101,105 3.0% 6 Venezuela 75,465 2.3% 7 Spain 63,726 1.9% 8 Italy 38,600 1.2% 9 Argentina 37,393 1.1%
10 Iran 22,260 0.7%
Total Surgical Procedures Rank * Country: % of World-Wide Total
1 Brazil 1,491,721 12.9% 2 USA 1,452,356 12.5% 3 Mexico 486,499 4.2% 4 Germany 343,479 3.0% 5 Colombia 291,954 2.5% 6 Venezuela 231,742 2.0% 7 Spain 213,297 1.8% 8 Italy 182,680 1.6% 9 Argentina 120,652 1.0%
10 Iran 118,079 1.0%
* Rankings are based solely on those countries from which a sufficient survey response was received and data were considered to be representative.
5
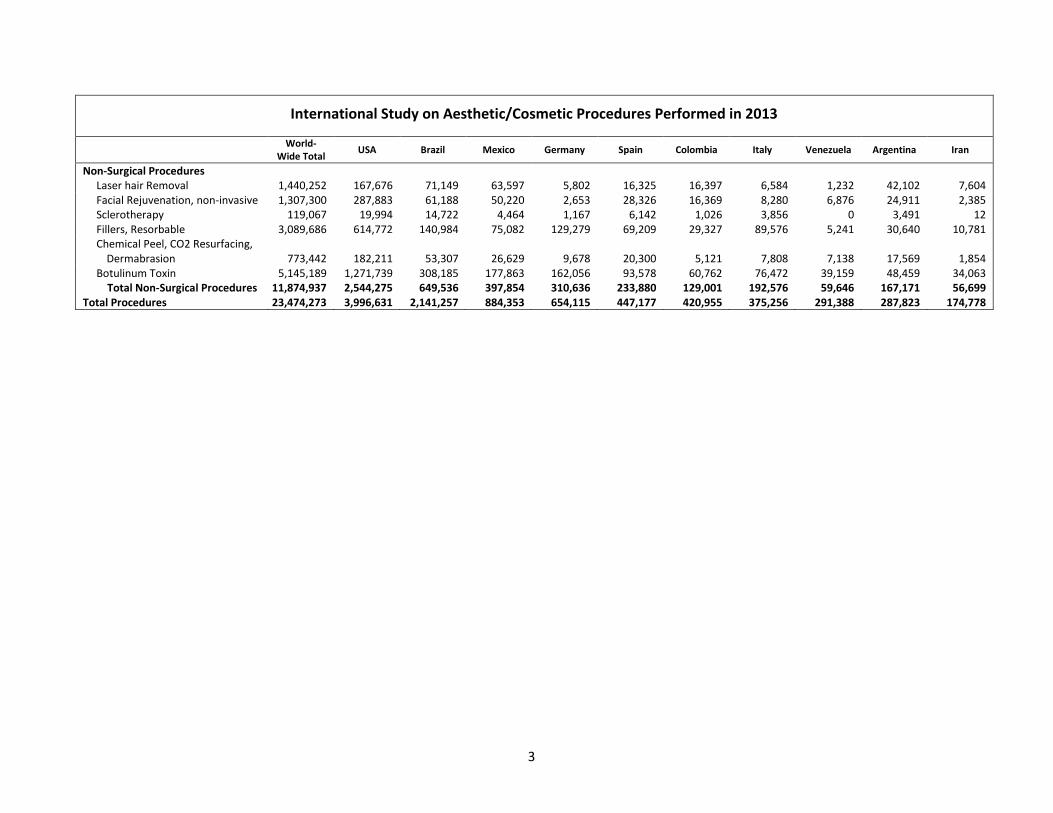
Total Non-Surgical Procedures Rank * Country: % of World-Wide Total
1 USA 2,544,275 21.4% 2 Brazil 649,536 5.5% 3 Mexico 397,854 3.4% 4 Germany 310,636 2.6% 5 Spain 233,880 2.0% 6 Italy 192,576 1.6% 7 Argentina 167,171 1.4% 8 Colombia 129,001 1.1% 9 Venezuela 59,646 0.5%
10 Iran 56,699 0.5%
Total Procedures Rank * Country: % of World-Wide Total
1 USA 3,996,631 17.0% 2 Brazil 2,141,257 9.1% 3 Mexico 884,353 3.8% 4 Germany 654,115 2.8% 5 Spain 447,177 1.9% 6 Colombia 420,955 1.8% 7 Italy 375,256 1.6% 8 Venezuela 291,388 1.2% 9 Argentina 287,823 1.2%
10 Iran 174,778 0.7%
* Rankings are based solely on those countries from which a sufficient survey response was received and data were considered to be representative.
6
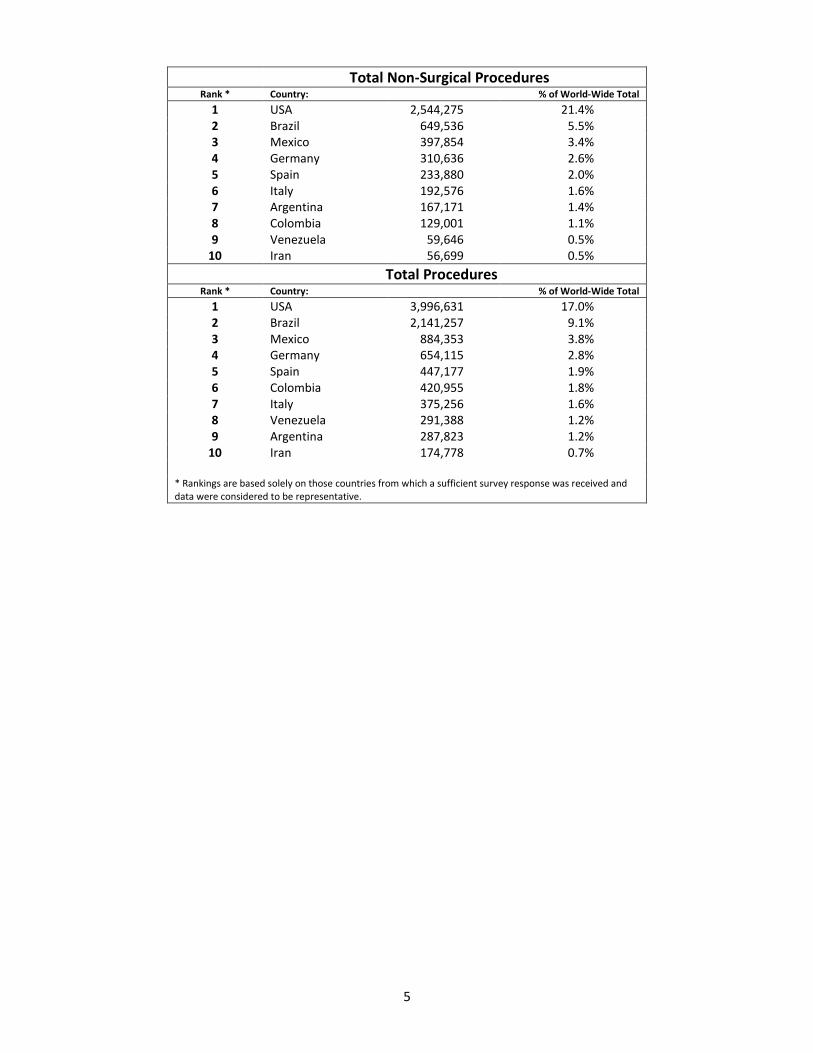
Countries by Estimated Number of Plastic Surgeons (Top 30) Rank Country Plastic Surgeons Percent of Total Plastic Surgeons
1 USA 6,133 15.2%
2 Brazil 5,473 13.6%
3 China 2,800 7.0%
4 Japan 2,302 5.7%
5 India 2,150 5.3%
6 South Korea 2,054 5.1%
7 Russia 2,000 5.0%
8 Mexico 1,550 3.8%
9 Turkey 1,200 3.0%
10 Germany 1,101 2.7%
11 Colombia 950 2.4%
12 France 950 2.4%
13 Spain 942 2.3%
14 United Kingdom 865 2.1%
15 Italy 800 2.0%
16 Chinese Taipei 600 1.5%
17 Canada 568 1.4%
18 Venezuela 503 1.2%
19 Egypt 400 1.0%
20 Peru 380 0.9%
21 Argentina 347 0.9%
22 Australia 317 0.8%
23 Thailand 300 0.7%
24 Greece 271 0.7%
25 Netherlands 270 0.7%
26 Belgium 265 0.7%
27 Iran 238 0.6%
28 Saudi Arabia 226 0.6%
29 Portugal 176 0.4%
30 Israel 170 0.4%
7
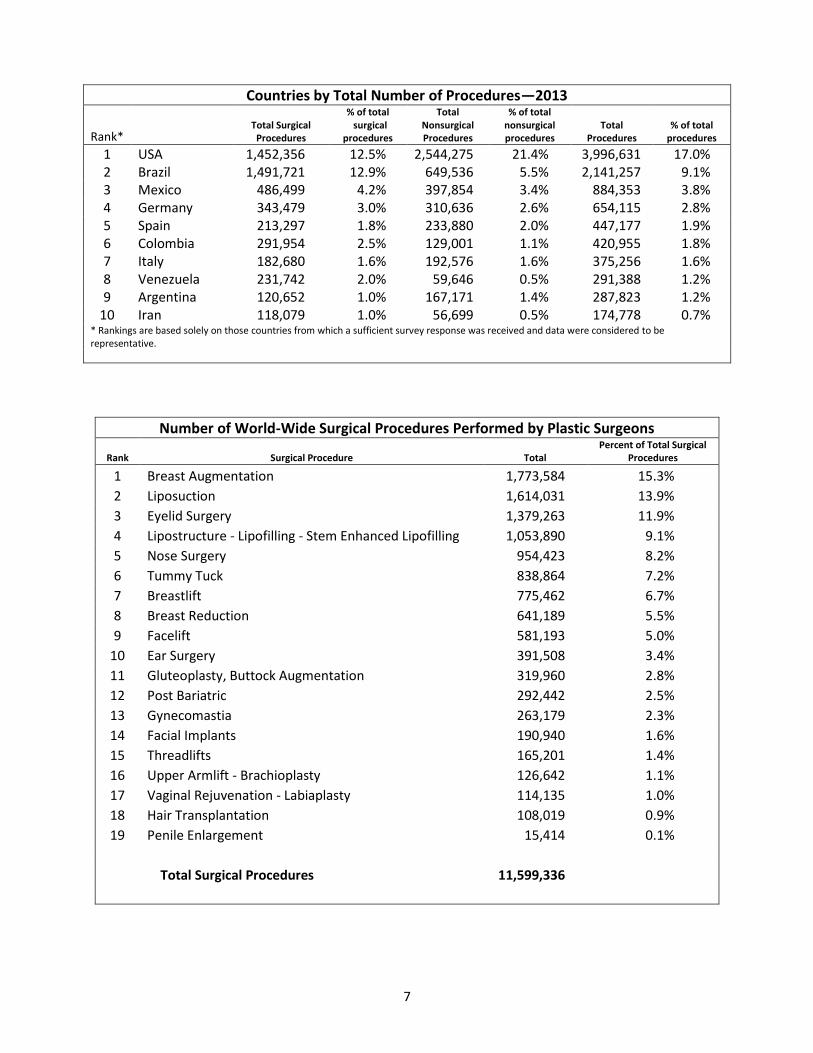
Countries by Total Number of Procedures—2013
Rank* Total Surgical
Procedures
% of total surgical
procedures
Total Nonsurgical Procedures
% of total nonsurgical procedures
Total Procedures
% of total procedures
1 USA 1,452,356 12.5% 2,544,275 21.4% 3,996,631 17.0% 2 Brazil 1,491,721 12.9% 649,536 5.5% 2,141,257 9.1% 3 Mexico 486,499 4.2% 397,854 3.4% 884,353 3.8% 4 Germany 343,479 3.0% 310,636 2.6% 654,115 2.8% 5 Spain 213,297 1.8% 233,880 2.0% 447,177 1.9% 6 Colombia 291,954 2.5% 129,001 1.1% 420,955 1.8% 7 Italy 182,680 1.6% 192,576 1.6% 375,256 1.6% 8 Venezuela 231,742 2.0% 59,646 0.5% 291,388 1.2% 9 Argentina 120,652 1.0% 167,171 1.4% 287,823 1.2%
10 Iran 118,079 1.0% 56,699 0.5% 174,778 0.7% * Rankings are based solely on those countries from which a sufficient survey response was received and data were considered to be representative.
Number of World-Wide Surgical Procedures Performed by Plastic Surgeons
Rank Surgical Procedure Total Percent of Total Surgical
Procedures
1 Breast Augmentation 1,773,584 15.3%
2 Liposuction 1,614,031 13.9%
3 Eyelid Surgery 1,379,263 11.9%
4 Lipostructure - Lipofilling - Stem Enhanced Lipofilling 1,053,890 9.1%
5 Nose Surgery 954,423 8.2%
6 Tummy Tuck 838,864 7.2%
7 Breastlift 775,462 6.7%
8 Breast Reduction 641,189 5.5%
9 Facelift 581,193 5.0%
10 Ear Surgery 391,508 3.4%
11 Gluteoplasty, Buttock Augmentation 319,960 2.8%
12 Post Bariatric 292,442 2.5%
13 Gynecomastia 263,179 2.3%
14 Facial Implants 190,940 1.6%
15 Threadlifts 165,201 1.4%
16 Upper Armlift - Brachioplasty 126,642 1.1%
17 Vaginal Rejuvenation - Labiaplasty 114,135 1.0%
18 Hair Transplantation 108,019 0.9%
19 Penile Enlargement 15,414 0.1%
Total Surgical Procedures 11,599,336

8
Number of World-Wide Nonsurgical Procedures Performed by Plastic Surgeons
Rank Nonsurgical Procedure Total
Percent of Total Nonsurgical Procedures
1 Botulinum Toxin 5,145,189 43.3%
2 Fillers, Resorbable 3,089,686 26.0%
3 Laser hair Removal 1,440,252 12.1%
4 Facial Rejuvenation, non-invasive 1,307,300 11.0%
5 Chemical Peel, CO2 Resurfacing, Dermabrasion 773,442 6.5%
Total Non-Surgical Procedures 11,874,937
Countries Performing Most Popular Surgical Procedures Rank * Country Number of Procedures Percentage of Total
Breast Augmentation 1 USA 313,703 17.7% 2 Brazil 226,090 12.7% 3 Mexico 57,691 3.3% 4 Germany 55,160 3.1% 5 Colombia 44,403 2.5% 6 Spain 38,820 2.2% 7 Venezuela 38,500 2.2% 8 Italy 26,520 1.5% 9 Argentina 19,678 1.1%
10 Iran 8,630 0.5%
Liposuction 1 USA 235,814 14.6% 2 Brazil 227,896 14.1% 3 Mexico 62,713 3.9% 4 Germany 53,134 3.3% 5 Colombia 50,559 3.1% 6 Spain 37,256 2.3% 7 Venezuela 32,786 2.0% 8 Argentina 17,766 1.1% 9 Italy 16,328 1.0%
10 Iran 10,546 0.7%
Eyelid Surgery 1 USA 124,684 9.0% 2 Brazil 116,849 8.5% 3 Germany 48,675 3.5% 4 Mexico 44,454 3.2% 5 Italy 27,952 2.0% 6 Colombia 24,396 1.8% 7 Venezuela 21,322 1.5% 8 Spain 21,242 1.5% 9 Argentina 9,667 0.7%
10 Iran 7,571 0.5%

9
Countries Performing Most Popular Surgical Procedures Rank * Country Number of Procedures Percentage of Total
Lipostructure - Lipofilling-Stem Enhanced Lipofilling
1 USA 180,372 17.1% 2 Brazil 96,434 9.2% 3 Mexico 46,965 4.5% 4 Italy 31,152 3.0% 5 Germany 25,202 2.4% 6 Colombia 21,404 2.0% 7 Venezuela 17,333 1.6% 8 Spain 13,254 1.3% 9 Iran 12,143 1.2%
10 Argentina 9,213 0.9%
Nose Surgery 1 Brazil 77,224 8.1% 2 Mexico 50,437 5.3% 3 USA 45,998 4.8% 4 Iran 37,423 3.9% 5 Germany 30,872 3.2% 6 Colombia 24,919 2.6% 7 Italy 15,200 1.6% 8 Venezuela 14,919 1.6% 9 Spain 10,946 1.1%
10 Argentina 9,549 1.0%
Tummy Tuck 1 Brazil 129,601 15.4% 2 USA 119,961 14.3% 3 Mexico 47,120 5.6% 4 Colombia 28,215 3.4% 5 Venezuela 20,668 2.5% 6 Germany 19,554 2.3% 7 Spain 13,141 1.6% 8 Argentina 11,118 1.3% 9 Italy 9,760 1.2%
10 Iran 7,954 0.9%
* Rankings are based solely on those countries from which a sufficient survey response was received and data were considered to be representative.

10
2013 Gender Distribution for Cosmetic Procedures
The following list includes both surgical and nonsurgical cosmetic procedures.
Procedure
FEMALE (Number of Procedures)
Percent of Total
Rank within Category (Surgical/
Nonsurgical)
MALE (Number of Procedures)
Percent of Total
Rank within Category (Surgical/
Nonsurgical)
Breast Augmentation 1,766,959 99.6% 1 6,625 0.4% 16
Breast Reduction 637,023 99.4% 8 4,166 0.6% 17
Breastlift 773,344 99.7% 5 2,118 0.3% 18
Ear Surgery 240,220 61.4% 11 151,288 38.6% 5
Eyelid Surgery 1,144,199 83.0% 3 235,064 17.0% 3
Facelift 521,880 89.8% 9 59,313 10.2% 10
Facial Implants 152,797 80.0% 13 38,143 20.0% 11
Gluteoplasty, Buttock Augmentation 309,574 96.8% 10 10,386 3.2% 14
Gynecomastia dna dna dna 263,179 100.0% 2
Hair Transplantation 20,955 19.4% 17 87,063 80.6% 7
Lipostructure - Lipofilling - Stem Enhanced Lipofilling 928,027 88.1% 4 125,863 11.9% 6
Liposuction 1,385,883 85.9% 2 228,148 14.1% 4
Nose Surgery 687,761 72.1% 7 266,662 27.9% 1
Penile Enlargement dna dna dna 15,414 100.0% 13
Post Bariatric 224,237 76.7% 12 68,205 23.3% 8
Threadlifts 145,633 88.2% 14 19,568 11.8% 12
Tummy Tuck 771,784 92.0% 6 67,080 8.0% 9
Upper Armlift - Brachioplasty 118,801 93.8% 15 7,840 6.2% 15
Vaginal Rejuvination - Labiaplasty 114,135 100.0% 16 dna dna dna
Totals - Surgical Procedures 9,943,211 85.7% 1,656,125 14.3%
Non-Surgical Procedures:
Botulinum Toxin 4,501,514 87.5% 1 643,675 12.5% 1
Chemical Peel, CO2 Resurfacing, Dermabrasion 682,647 88.3% 5 90,795 11.7% 4
Facial Rejuvenation, non-invasive 1,223,520 93.6% 3 83,780 6.4% 5
Fillers, Resorbable 2,787,799 90.2% 2 301,887 9.8% 2
Laser hair Removal 1,222,720 84.9% 4 217,533 15.1% 3
Sclerotherapy 109,771 92.2% 6 9,296 7.8% 6
Totals - Non-Surgical Procedure 10,527,971 88.7% 1,346,966 11.3%
TOTALS ALL PROCEDURES 20,471,182 87.2% 3,003,091 12.8%
dna = Does not apply
11
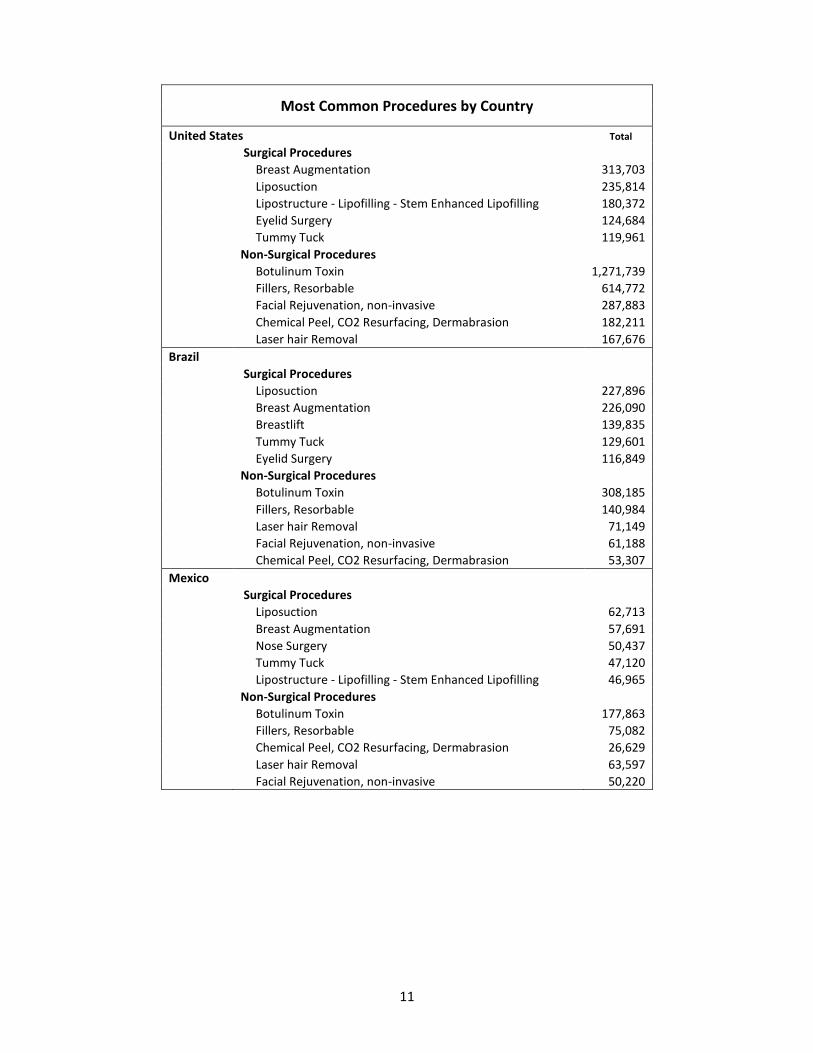
Most Common Procedures by Country
United States Total
Surgical Procedures
Breast Augmentation 313,703
Liposuction 235,814
Lipostructure - Lipofilling - Stem Enhanced Lipofilling 180,372
Eyelid Surgery 124,684
Tummy Tuck 119,961
Non-Surgical Procedures
Botulinum Toxin 1,271,739
Fillers, Resorbable 614,772
Facial Rejuvenation, non-invasive 287,883
Chemical Peel, CO2 Resurfacing, Dermabrasion 182,211
Laser hair Removal 167,676
Brazil
Surgical Procedures
Liposuction 227,896
Breast Augmentation 226,090
Breastlift 139,835
Tummy Tuck 129,601
Eyelid Surgery 116,849
Non-Surgical Procedures
Botulinum Toxin 308,185
Fillers, Resorbable 140,984
Laser hair Removal 71,149
Facial Rejuvenation, non-invasive 61,188
Chemical Peel, CO2 Resurfacing, Dermabrasion 53,307
Mexico
Surgical Procedures
Liposuction 62,713
Breast Augmentation 57,691
Nose Surgery 50,437
Tummy Tuck 47,120
Lipostructure - Lipofilling - Stem Enhanced Lipofilling 46,965
Non-Surgical Procedures
Botulinum Toxin 177,863
Fillers, Resorbable 75,082
Chemical Peel, CO2 Resurfacing, Dermabrasion 26,629
Laser hair Removal 63,597
Facial Rejuvenation, non-invasive 50,220

12
Most Common Procedures by Country
Germany
Surgical Procedures
Breast Augmentation 55,160
Liposuction 53,134
Eyelid Surgery 48,675
Nose Surgery 30,872
Lipostructure - Lipofilling - Stem Enhanced Lipofilling 25,202
Non-Surgical Procedures
Botulinum Toxin 162,056
Fillers, Resorbable 129,279
Chemical Peel, CO2 Resurfacing, Dermabrasion 9,678
Laser hair Removal 5,802
Facial Rejuvenation, non-invasive 2,653
Spain
Surgical Procedures
Breast Augmentation 38,820
Liposuction 37,256
Eyelid Surgery 21,242
Threadlifts 13,386
Lipostructure - Lipofilling - Stem Enhanced Lipofilling 13,254
Non-Surgical Procedures
Botulinum Toxin 93,578
Fillers, Resorbable 69,209
Facial Rejuvenation, non-invasive 28,326
Chemical Peel, CO2 Resurfacing, Dermabrasion 20,300
Laser hair Removal 16,325
Columbia
Surgical Procedures
Liposuction 50,559
Breast Augmentation 44,403
Tummy Tuck 28,215
Nose Surgery 24,919
Eyelid Surgery 24,396
Non-Surgical Procedures
Botulinum Toxin 60,762
Fillers, Resorbable 29,327
Laser hair Removal 16,397
Facial Rejuvenation, non-invasive 16,369
Chemical Peel, CO2 Resurfacing, Dermabrasion 5,121
13
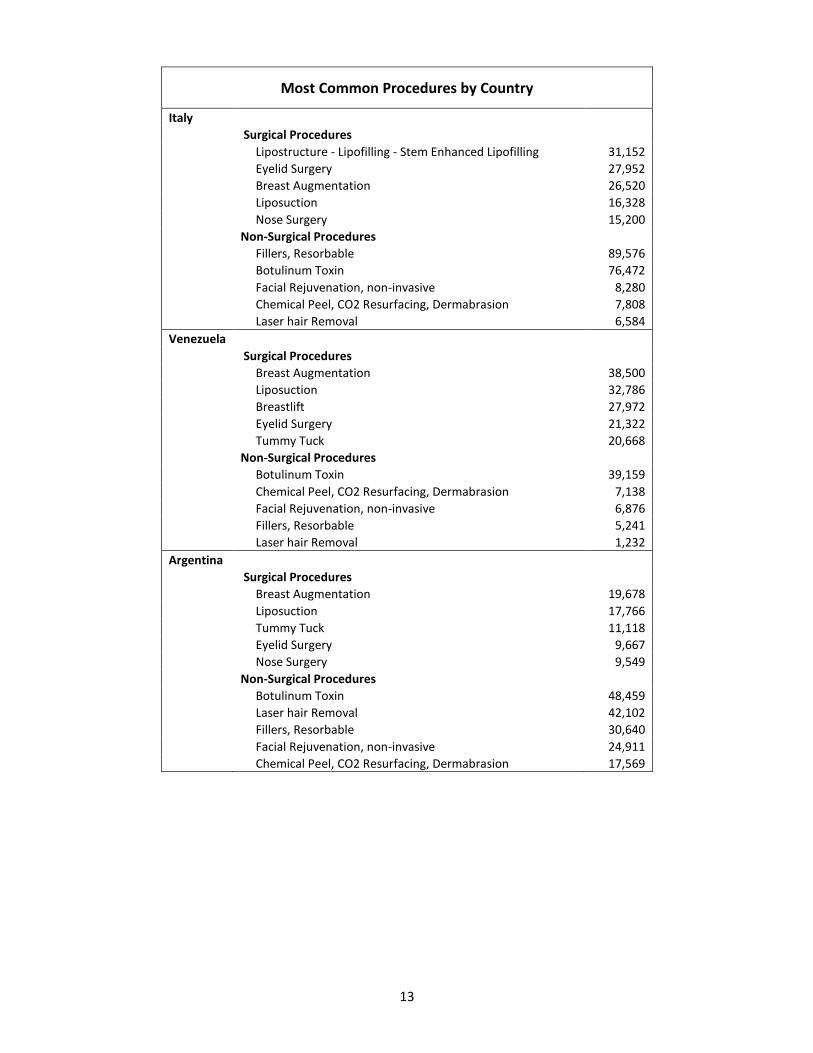
Most Common Procedures by Country
Italy
Surgical Procedures
Lipostructure - Lipofilling - Stem Enhanced Lipofilling 31,152
Eyelid Surgery 27,952
Breast Augmentation 26,520
Liposuction 16,328
Nose Surgery 15,200
Non-Surgical Procedures
Fillers, Resorbable 89,576
Botulinum Toxin 76,472
Facial Rejuvenation, non-invasive 8,280
Chemical Peel, CO2 Resurfacing, Dermabrasion 7,808
Laser hair Removal 6,584
Venezuela
Surgical Procedures
Breast Augmentation 38,500
Liposuction 32,786
Breastlift 27,972
Eyelid Surgery 21,322
Tummy Tuck 20,668
Non-Surgical Procedures
Botulinum Toxin 39,159
Chemical Peel, CO2 Resurfacing, Dermabrasion 7,138
Facial Rejuvenation, non-invasive 6,876
Fillers, Resorbable 5,241
Laser hair Removal 1,232
Argentina
Surgical Procedures
Breast Augmentation 19,678
Liposuction 17,766
Tummy Tuck 11,118
Eyelid Surgery 9,667
Nose Surgery 9,549
Non-Surgical Procedures
Botulinum Toxin 48,459
Laser hair Removal 42,102
Fillers, Resorbable 30,640
Facial Rejuvenation, non-invasive 24,911
Chemical Peel, CO2 Resurfacing, Dermabrasion 17,569
14
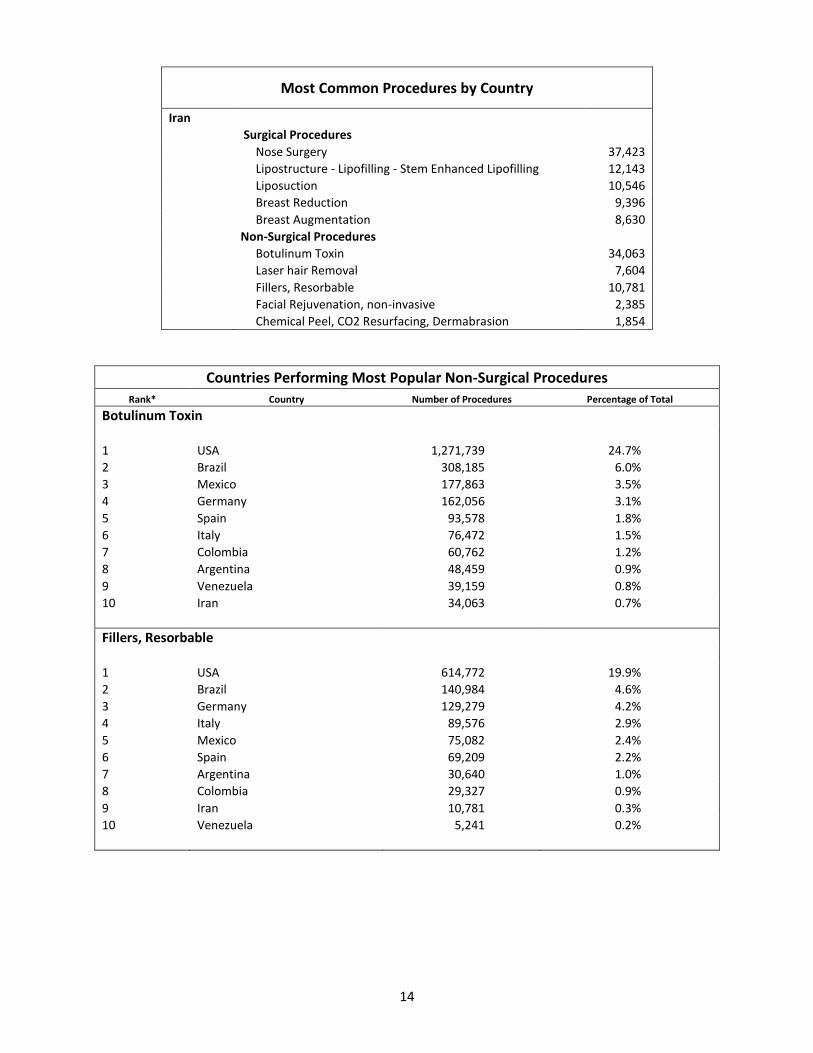
Most Common Procedures by Country
Iran
Surgical Procedures
Nose Surgery 37,423
Lipostructure - Lipofilling - Stem Enhanced Lipofilling 12,143
Liposuction 10,546
Breast Reduction 9,396
Breast Augmentation 8,630
Non-Surgical Procedures
Botulinum Toxin 34,063
Laser hair Removal 7,604
Fillers, Resorbable 10,781
Facial Rejuvenation, non-invasive 2,385
Chemical Peel, CO2 Resurfacing, Dermabrasion 1,854
Countries Performing Most Popular Non-Surgical Procedures
Rank* Country Number of Procedures Percentage of Total
Botulinum Toxin
1 USA 1,271,739 24.7%
2 Brazil 308,185 6.0%
3 Mexico 177,863 3.5%
4 Germany 162,056 3.1%
5 Spain 93,578 1.8%
6 Italy 76,472 1.5%
7 Colombia 60,762 1.2%
8 Argentina 48,459 0.9%
9 Venezuela 39,159 0.8%
10 Iran 34,063 0.7%
Fillers, Resorbable
1 USA 614,772 19.9%
2 Brazil 140,984 4.6%
3 Germany 129,279 4.2%
4 Italy 89,576 2.9%
5 Mexico 75,082 2.4%
6 Spain 69,209 2.2%
7 Argentina 30,640 1.0%
8 Colombia 29,327 0.9%
9 Iran 10,781 0.3%
10 Venezuela 5,241 0.2%

15
Countries Performing Most Popular Non-Surgical Procedures
Rank* Country Number of Procedures Percentage of Total
Laser hair Removal
1 USA 167,676 11.6%
2 Brazil 71,149 4.9%
3 Mexico 63,597 4.4%
4 Argentina 42,102 2.9%
5 Colombia 16,397 1.1%
6 Spain 16,325 1.1%
7 Iran 7,604 0.5%
8 Italy 6,584 0.5%
9 Germany 5,802 0.4%
10 Venezuela 1,232 0.1%
Facial Rejuvenation, non-invasive
1 USA 287,883 22.0%
2 Brazil 61,188 4.7%
3 Mexico 50,220 3.8%
4 Spain 28,326 2.2%
5 Argentina 24,911 1.9%
6 Colombia 16,369 1.3%
7 Italy 8,280 0.6%
8 Venezuela 6,876 0.5%
9 Germany 2,653 0.2%
10 Iran 2,385 0.2%
Chemical Peel, CO2 Resurfacing, Dermabrasion
1 USA 182,211 23.6%
2 Brazil 53,307 6.9%
3 Mexico 26,629 3.4%
4 Spain 20,300 2.6%
5 Argentina 17,569 2.3%
6 Germany 9,678 1.3%
7 Italy 7,808 1.0%
8 Venezuela 7,138 0.9%
9 Colombia 5,121 0.7%
10 Iran 1,854 0.2%
* Rankings are based solely on those countries from which a sufficient survey response was received and data were considered to be representative.

16
Surgical Procedure Group Ranking by Country
Rank Country Total % of Total
USA
1 Total Breast Procedures 517,012 15.0%
2 Total Body & Extremities 442,005 13.3%
3 Total Face & Head Procedures 312,967 8.3%
Brazil
1 Total Breast Procedures 515,776 14.9%
2 Total Body & Extremities 499,357 15.0%
3 Total Face & Head Procedures 380,155 10.1%
Mexico
1 Total Body & Extremities 168,160 5.1%
2 Total Face & Head Procedures 157,744 4.2%
3 Total Breast Procedures 113,631 3.3%
Germany
1 Total Face & Head Procedures 113,568 3.0%
2 Total Breast Procedures 103,604 3.0%
3 Total Body & Extremities 101,105 3.0%
Spain
1 Total Face & Head Procedures 68,389 1.8%
2 Total Breast Procedures 67,928 2.0%
3 Total Body & Extremities 63,726 1.9%
Colombia
1 Total Body & Extremities 112,081 3.4%
2 Total Breast Procedures 82,137 2.4%
3 Total Face & Head Procedures 76,333 2.0%
Italy
1 Total Face & Head Procedures 62,904 1.7%
2 Total Breast Procedures 50,024 1.4%
3 Total Body & Extremities 38,600 1.2%
Venezuela
1 Total Breast Procedures 84,886 2.5%
2 Total Body & Extremities 75,465 2.3%
3 Total Face & Head Procedures 54,057 1.4%
Argentina
1 Total Face & Head Procedures 38,514 1.0%
2 Total Body & Extremities 37,393 1.1%
3 Total Breast Procedures 35,533 1.0%
Iran
1 Total Face & Head Procedures 56,944 1.5%
2 Total Breast Procedures 26,732 0.8%
3 Total Body & Extremities 22,260 0.7%