ISAAC REGION
39
Norling Consulting Business & Property Economics Pty Ltd Norling Consulting Pty Ltd Level 5, 320 Adelaide Street GPO Box 5061 Brisbane Qld 4001 ABN: 92 082 232 540 [email protected] www.norling.com.au Company Director Jon Norling Economic & Population Review ISAAC REGION Economic & Population Review Prepared for Isaac Regional Council October 2016
Transcript of ISAAC REGION

Norling Consulting Business & Property Economics
Pty Ltd Norling Consulting Pty Ltd
Level 5, 320 Adelaide Street
GPO Box 5061
Brisbane Qld 4001
ABN: 92 082 232 540
www.norling.com.au
Company Director
Jon Norling
Economic & Population Review
ISAAC REGION
Economic & Population Review
Prepared for Isaac Regional Council
October 2016

Prepared by: Jon Norling, Director
Hannah Seymour, Consultant
Norling Consulting Business & Property Economics
Pty Ltd
Warranty:
This report has been based upon the most up to date readily available information at this point in time, as documented in this
report. Norling Consulting Pty Ltd has applied due professional care and diligence in accordance with generally accepted standards
of professional practice in undertaking the analysis contained in this report from these information sources. Norling Consulting
Pty Ltd shall not be liable for damages arising from any errors or omissions which may be contained within these information
sources.
As this report involves future market projections which can be affected by a number of unforeseen variables, they represent our best
possible estimates at this point in time and no warranty is given that this particular set of projections will in fact eventuate.

Business & Property Economics Norling Consulting
Pty Ltd 16025 – October 2016
i
CONTENTS

Norling Consulting Pty Ltd
07 3236 0811 | www.norling.com.au | [email protected]
Business & Property Economics Norling Consulting
Pty Ltd 16025 –October 2016 2
1 INTRODUCTION
1.1 Background
Norling Consulting has been commissioned by Isaac Regional Council to prepare an Economic
and Population Review for the Region.
Isaac Regional Council is seeking to develop a new Planning Scheme for the amalgamated
Region which includes the former Shires of Belyando, Broadsound and Nebo. As part of this
process, and particularly in response to the recent downturn in Queensland coal mining,
Council is seeking input as to the future economic, employment and population prospects of
the Region. This will form an important basis for the direction of planning and infrastructure
services for the Region.
Norling Consulting is a specialised economic and market research consultancy for the
property industry and has considerable experience in undertaking assessments of population
reviews and economic analyses for local governments and the private sector across
Queensland.
1.2 Study Objectives
The Study objectives are to:
a) Provide Council with a sound understanding of the factors likely to influence economic
growth of the Region in the short, medium and long terms;
b) Identify the key opportunities and risks to economic growth and establish a robust
strategy for managing and responding to the various growth scenarios the Region may
face;
c) Define specific implementation measures to support the preferred economic growth
scenario; and
d) Develop a population and employment model that allows Council to understand the
composition of its future community and their needs in terms of housing and
infrastructure.

Norling Consulting Pty Ltd
07 3236 0811 | www.norling.com.au | [email protected]
Business & Property Economics Norling Consulting
Pty Ltd 16025 –October 2016 3
1.3 Report Structure
This report is structured as follows:
Chapter 1: Introduction - This Chapter outlines the background, objectives and
structure of this Economic and Population Review;
Chapter 2: Economic Profile – This Chapter describes the Isaac Region, its economic
performance and key industries contributing to the Gross Regional Product. The
Region’s population and employment profile is also outlined;
Chapter 3: Key Factors Influencing Population Growth - This Chapter explores the key
factors that are likely to influence population growth within the Isaac Region paying
particular attention to the key industries that contribute to the economy and other
factors that may affect future growth;
Chapter 4: Sub Region Analysis – This Chapter divides the Isaac Region into eleven
smaller sub-regions that represent discrete communities. The historic population of
each sub region is detailed and population projections are made based upon four
different scenarios.
Chapter 5: Conclusion - This Chapter summarises the key findings of this Economic
and Population Review and discusses the outlook for the Region.

Norling Consulting Pty Ltd
07 3236 0811 | www.norling.com.au | [email protected]
Business & Property Economics Norling Consulting
Pty Ltd
16025 –October 2016 4
2 ECONOMIC PROFILE
2.1 Overview
The Isaac Region is located in central Queensland and covers an area of 58,862 square
kilometres extending from the western coalfields of the Bowen Basin to the coastline and
islands in the Coral Sea. Moranbah is the major administrative and service centre of the
Region and is geographically central within the Region. Other key centres include the mining
towns of Middlemount, Dysart and Glenden as well as the historic communities of Nebo,
Clermont and St Lawrence.
In an economic sense, the Isaac Region lies within Mackay Region’s sphere of influence, with
most of Isaac’s population living within 250km of the large city of Mackay, which is also the
major service centre for the coal mines located in the Isaac Region.
Figure 2.1: Isaac Region
Source: Google Maps

Norling Consulting Pty Ltd
07 3236 0811 | www.norling.com.au | [email protected]
Business & Property Economics Norling Consulting
Pty Ltd
16025 –October 2016 5
Gross Regional Product (GRP) is considered to be the most appropriate measure of the
Region’s economic performance. The estimated GRP for the 2011/12 year was $11.8 billion
as shown in TABLE 2.1.
TABLE 2.1 Gross Regional Product, Isaac LGA 2011-12
# Industry Level ($ million) % of total
1 Mining 9,106.8 77.4%
2 Construction 212.0 1.8%
3 Agriculture, Forestry and Fishing 97.2 0.8%
4 Transport, Postal and Warehousing 68.8 0.6%
5 Wholesale Trade 62.4 0.5%
6 Manufacturing 59.4 0.5%
7 Accommodation and Food Services 50.5 0.4%
8 Education and Training 45.2 0.4%
9 Public Administration and Safety 44.8 0.4%
10 Retail Trade 43.6 0.4%
11 Administrative and Support Services 39.0 0.3%
12 Professional, Scientific and Technical Services 37.1 0.3%
13 Health Care and Social Assistance 31.2 0.3%
14 Other Services 29.4 0.2%
15 Financial and Insurance Services 24.5 0.2%
16 Rental, Hiring and Real Estate Services 27.0 0.2%
17 Electricity, Gas, Water and Waste Services 21.7 0.2%
18 Non Classifiable Industry 16.7 0.1%
19 Information Media and Telecommunications 7.1 0.1%
20 Arts and Recreation Services 1.6 0.0%
Total Industry Value Added 10,026.0 85.2%
Ownership of dwellings 1,009.1 8.6%
GRP at Factor Cost / Total Factor Income 11,035.1 93.8%
Taxes less subsidies on production and imports 736.8 6.3%
Statistical Discrepancy -8.7 -0.1%
Gross Regional Product 11,763.2 100.0%
Source: Lawrence Consulting, Norling Consulting
The Isaac Region generated approximately 4.1% of Queensland’s Gross State Product in
2011/12. The major industry in the Region by a significant margin was mining, which
accounted for 77.4% of GRP. The next closest industry in terms of its contribution to GDP
was construction with only 1.8% (the construction sector includes elements of mining, tourism
and population growth).

Norling Consulting Pty Ltd
07 3236 0811 | www.norling.com.au | [email protected]
Business & Property Economics Norling Consulting
Pty Ltd
16025 –October 2016 6
2.2 Population
The resident population of the Isaac Region has waxed and waned with the fortunes of the
coal industry. Between 1991 and 2001, the Isaac Region population fell from 22,400
persons to 18,169 persons. The resident population then grew to 23,188 persons in 2011
and increased again in 2015 to reach a population of 24,267. These fluctuations make
planning for the future a challenge, particularly for infrastructure expenditure. Table 2.2
below sets out the historic population for the Region between 1991 and 2015.
TABLE 2.2: Isaac Region Historical Population
1991
1996
2001
2006
2011
2015
% p.a.
1991-2015
ERP 22,400 20,397 18,169 20,372 23,188 24,267 0.3%
Households 7,344 6,800 6,485 7,165 8,124 7,889 -
Persons per household 3.05 3.00 2.80 2.84 2.85 3.08 - Source: ABS and Norling Consulting’s estimates
FIGURE 2.2: Isaac Region Historical Population
Source: ABS and Norling Consulting’s estimates
2.3 Employment Profile
The following Table 2.3 provides a historic breakdown of Isaac residents who were employed
at the time of the 2001, 2006 and 2011 Cehnsuses.
TABLE 2.3: Resident Worker Growth Isaac Region 2001 to 2011 2001 p.a. growth 2006 p.a. growth 2011
Isaac Region 9,633 4.2% 11,845 3.3% 13,962
Source: 2001, 2006 and 2011 ABS Household and Population Censuses, based on place of usual residence
-
5,000
10,000
15,000
20,000
25,000
30,000
1991 1996 2001 2006 2011 2015
ERP
(N
o.)

Norling Consulting Pty Ltd
07 3236 0811 | www.norling.com.au | [email protected]
Business & Property Economics Norling Consulting
Pty Ltd
16025 –October 2016 7
As illustrated above, the number of resident workers within the Isaac Region has increased
significantly during the 2001 and 2011 period, even through the Global Financial Crisis.
Labour force participation rates have improved over the 2001 – 2011 decade, increasing
from 79.3% in 2001 to 84.4% in 2006 and to 87.0% in 2011. Unemployment rates within
the Isaac Region have also improved between 2001 and 2006 reducing from 3.6% to 2.1%
and remained at the similar low level of 2.0% to 2011. Since the 2011 Census, the
unemployment rate has remained at 3% or below, with the latest March Quarter 2016 rate
being 2.7%.
With the population fluctuating during the 2001 – 2011 period, such positive employment
growth is the result of increased jobs available within the mining industry with new and
expanding coal mines.
The following FIGURE 2.3 illustrates how the industries of the Isaac Region workforce have
trended since 2001.
FIGURE 2.3: Industry of the Resident Workforce, Isaac Region- 2001, 2006 and 2011
Source: 2001, 2006 and 2011 ABS Household and Population Censuses
- 1,000 2,000 3,000 4,000 5,000 6,000
Agriculture, Forestry and Fishing
Mining
Manufacturing
Electricity, Gas and Water Supply
Construction
Wholesale Trade
Retail Trade
Accommodation, Cafes and Restaurants
Transport and Storage
Communication Services
Finance and Insurance
Property and Business Services
Government Administration and Defence
Education
Health and Community Services
Cultural and Recreational Services
Personal and Other Services
Resident Workers (No.)
Ind
ust
ry o
f Em
plo
yme
nt
2011
2006
2001
Norling Consulting Pty Ltd
07 3236 0811 | www.norling.com.au | [email protected]
Business & Property Economics Norling Consulting
Pty Ltd
16025 –October 2016 8
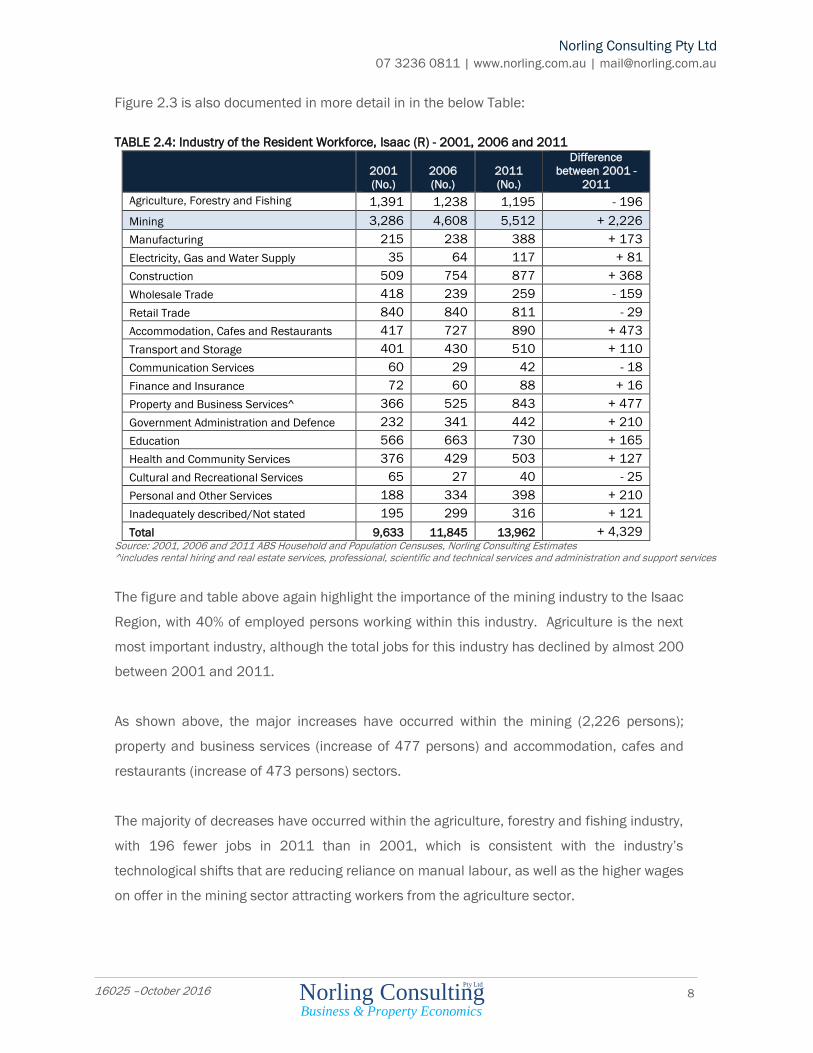
Figure 2.3 is also documented in more detail in in the below Table:
TABLE 2.4: Industry of the Resident Workforce, Isaac (R) - 2001, 2006 and 2011
2001
(No.)
2006
(No.)
2011
(No.)
Difference
between 2001 -
2011
Agriculture, Forestry and Fishing 1,391 1,238 1,195 - 196
Mining 3,286 4,608 5,512 + 2,226
Manufacturing 215 238 388 + 173
Electricity, Gas and Water Supply 35 64 117 + 81
Construction 509 754 877 + 368
Wholesale Trade 418 239 259 - 159
Retail Trade 840 840 811 - 29
Accommodation, Cafes and Restaurants 417 727 890 + 473
Transport and Storage 401 430 510 + 110
Communication Services 60 29 42 - 18
Finance and Insurance 72 60 88 + 16
Property and Business Services^ 366 525 843 + 477
Government Administration and Defence 232 341 442 + 210
Education 566 663 730 + 165
Health and Community Services 376 429 503 + 127
Cultural and Recreational Services 65 27 40 - 25
Personal and Other Services 188 334 398 + 210
Inadequately described/Not stated 195 299 316 + 121
Total 9,633 11,845 13,962 + 4,329 Source: 2001, 2006 and 2011 ABS Household and Population Censuses, Norling Consulting Estimates ^includes rental hiring and real estate services, professional, scientific and technical services and administration and support services
The figure and table above again highlight the importance of the mining industry to the Isaac
Region, with 40% of employed persons working within this industry. Agriculture is the next
most important industry, although the total jobs for this industry has declined by almost 200
between 2001 and 2011.
As shown above, the major increases have occurred within the mining (2,226 persons);
property and business services (increase of 477 persons) and accommodation, cafes and
restaurants (increase of 473 persons) sectors.
The majority of decreases have occurred within the agriculture, forestry and fishing industry,
with 196 fewer jobs in 2011 than in 2001, which is consistent with the industry’s
technological shifts that are reducing reliance on manual labour, as well as the higher wages
on offer in the mining sector attracting workers from the agriculture sector.

Norling Consulting Pty Ltd
07 3236 0811 | www.norling.com.au | [email protected]
Business & Property Economics Norling Consulting
Pty Ltd
16025 –October 2016 9
While the above analysis was based upon the Isaac Region resident workforce only, another
important indicator is the number of jobs within an area, irrespective of where the workers
lived. An estimated 24,049 jobs were provided within the Isaac Region in 2011. The following
TABLE 2.5 illustrates the historical workforce between 2001 and 2011, based on the results
of the ABS Household and Population Censuses.
TABLE 2.5: Jobs within Isaac Region 2001 to 2011
2001 p.a. growth 2006 p.a. growth 2011
Isaac Region 11,183 8.4% 16,749 7.5% 24,049
Source: 2001, 2006 and 2011 ABS Household and Population Censuses, Norling Consulting estimates
Within the Isaac Region, the rate of jobs growth throughout the entire 2001 - 2011 period
significantly exceeded the population and resident worker growth rate, driven by a rapid
expansion of the coal mining sector and an increasing propensity of workers to live remotely
from their place of work (resulting in the concepts of FIFO [fly-in-fly-out] and DIDO [drive-in-
drive-out]).
A comparison of TABLES 2.3 and 2.5 reveals the net jobs balance for the Region, which
measures the proportion of jobs supplied in the Region to the number of workers residing in
the Region. A net jobs balance of less than 100% means that fewer jobs are supplied than
there are workers residing in the Region – implying a net export of workers to jobs located
outside the Region. A net jobs balance greater than 100% means that there are more jobs
within the Region than there are resident workers. The net jobs balance for the Isaac Region
is estimated below:
TABLE 2.6: Jobs within Isaac Region 2001 to 2011
Year
Jobs
Balance
2001 116.1%
2006 141.4%
2011 172.2% Source: 2001, 2006 and 2011 ABS Household and Population Censuses, Norling Consulting estimates
The above net jobs balance estimates shows a trend within the Region of increasingly
generating a greater amount of jobs than required to support the number of resident workers.
This is clearly influenced by the number of jobs within the Bowen Basin and workers living
outside the Region on a FIFO/DIDO basis.

Norling Consulting Pty Ltd
07 3236 0811 | www.norling.com.au | [email protected]
Business & Property Economics Norling Consulting
Pty Ltd
16025 –October 2016 10
As reflected in the net jobs balance, the Isaac Region hosts a large number of non-resident
workers (comprising a very significant two-thirds of all Bowen Basin non-resident workers).
These are the workers who live in the area temporarily while rostered on but have their usual
place of residence elsewhere. The following TABLE 2.6 highlights these estimates:
TABLE 2.7: Non-resident Workers On-shift*
LGA 2008 2009 2010 2011 2012 2013 2014 2015
Isaac (R) 9,380 8,570 9,905 13,590 17,125 14,950 11,085 10,400 *due to shift arrangements, not all members of the non-resident workforce are present in the local area at the one time. The figures therefore reflect the average number of non-resident workers on-shift, rather than total non-resident workforce numbers. Source: Queensland Government Statistician’s Office
FIGURE 2.4: Non-Resident Workers On-shift*
*due to shift arrangements, not all members of the non-resident workforce are present in the local area at one time. The figures therefore reflect the average number of non-resident workers on-shift, rather than total non-resident workforce numbers. Source: Queensland Government Statistician’s Office
Queensland Government Statistician’s Office estimated that in 2015 there were a total of
10,400 non-resident workers within the Isaac Region, a total that has fallen each year from
the 2012 peak of 17,125. Much of the decline in the non-resident population since 2012 is
due to the finalisation of the construction phase of new projects and the departure of those
temporary workforces. Softening coal prices and pressures to improve productivity have also
influenced reduced workforces with mine closures and restructuring taking place.
The breakdown of the industries of the workforce reveals similar results to the industries of
the resident workforce.
0
2,000
4,000
6,000
8,000
10,000
12,000
14,000
16,000
18,000
2008 2009 2010 2011 2012 2013 2014 2015

Norling Consulting Pty Ltd
07 3236 0811 | www.norling.com.au | [email protected]
Business & Property Economics Norling Consulting
Pty Ltd
16025 –October 2016 11
TABLE 2.7: Industry of the Jobs, Isaac Region - 2001, 2006 and 2011
2001
(No.)
2006
(No.)
2011
(No.)
Difference
between 2001 -
2011
Agriculture, Forestry and Fishing 1,312 1,362 1,112 -200
Mining 4,075 8,160 13,113 + 9,038
Manufacturing 355 292 570 + 215
Electricity, Gas and Water Supply 45 65 137 + 93
Construction 589 1,361 2,171 + 1,583
Wholesale Trade 491 240 317 - 173
Retail Trade 952 909 808 - 144
Accommodation, Cafes and Restaurants 476 898 1,297 + 821
Transport and Storage 487 507 606 + 118
Communication Services 74 17 44 - 31
Finance and Insurance 88 79 96 + 8
Property and Business Services^ 439 682 1,179 +740
Government Administration and Defence 354 382 506 + 152
Education 609 704 741 + 132
Health and Community Services 464 460 528 + 64
Cultural and Recreational Services 70 32 45 - 25
Personal and Other Services 229 431 605 + 376
Inadequately described/Not stated 74 168 174 + 100
Total 11,183 16,749 24,049 + 12,865 Source: 2001, 2006 and 2011 ABS Household and Population Censuses, Norling Consulting Estimates ^includes rental hiring and real estate services, professional, scientific and technical services and administration and support services
Whilst 55% of the total jobs provided within the Isaac Region were within the mining industry
(or 13,113 jobs), a significant 70% of the additional jobs provided between 2001 and 2011
were within the mining industry. The construction industry employed the next highest number
of workers (2,171 jobs), although this industry overlaps with many others, including mining.
The major increases in the workforce have occurred within the mining (9,038 persons),
construction (increase of 1,583 persons) and accommodation, cafes and restaurants
(increase of 821 persons) sectors.
The majority of decreases have occurred within the agriculture, forestry and fishing industry,
with 200 fewer jobs in 2011 than in 2001, which is consistent with the industry’s
technological shifts that are reducing reliance on manual labour as well as the higher wages
on offer in the mining sector attracting workers from the agriculture sector.

Norling Consulting Pty Ltd
07 3236 0811 | www.norling.com.au | [email protected]
Business & Property Economics Norling Consulting
Pty Ltd
16025 –October 2016 12
3. KEY FACTORS INFLUENCING
POPULATION GROWTH
This Chapter explores the key factors that are likely to influence population growth within the
Isaac Region paying particular attention to the key industries that contribute to the economy
and other factors that may affect future growth.
3.1. The Mining Industry
The Isaac Region is heavily dependent upon the mining of coal, with the Bowen Basin
extending through the middle of the Region in a north-south direction and the northern part
of the (as-yet) undeveloped Galilee Basin extending into the far west of the Region. There are
approximately 25 coal mines currently operating in the Region. As identified in the previous
Chapter, mining accounted for 55% of all workers working in the Region as at August 2011.
The Isaac Region has also recorded the highest levels of non-resident workers in Queensland,
with a peak of 17,125 workers recorded in June 2012. By June 2015, this figure had dropped
to 10,400, yet the Region’s proportion of the Bowen Basin’s non-resident workforce still
represented two-thirds of the total.
The mining industry contracted across most key indicators in 2014-15, as detailed by the
ABS. Industry value decreased 7.4% ($9.4billion) to $118.3b in 2014-15. The mining division
export price index fell 21% between 2013-14 and 2014-15, driven by falling prices for high
quality metallurgical coal, thermal coal and iron ore, and impacting on sales and service
income and industry value added. Employment and wage growth also decreased over this
period.
Despite the current downturn in the industry, proposals for other new coal mining projects are
continuing. However, it appears that the majority of the new projects are located outside the
Region, namely within the southern part of the Bowen Basin or in the Galilee Basin. Projects
within the Region that may increase the Region’s production, include the following:

Norling Consulting Pty Ltd
07 3236 0811 | www.norling.com.au | [email protected]
Business & Property Economics Norling Consulting
Pty Ltd
16025 –October 2016 13
(a) Eagle Downs, just south of Moranbah, is a new underground mine that has had its
construction suspended pending an improvement in the coal price. It was proposed to
produce an annual volume of 7Mt of coking coal.
(b) Byerwen, located just north of the Newlands mine and serviceable by Moranbah, is a
resource of coking and thermal coal of more than 500Mt that is proposed to be mined
by both open cut and underground methods and to average an annual production
volume of 10Mt. It is understood that construction of the stage 1 operations has just
commenced.
(c) Moranbah South is a proposed underground coal mine located near Moranbah with a
proposed annual capacity of 14Mt.
(d) Blair Athol, near Clermont, has recently been sold to a junior miner for $1, with plans
for it to reopen shortly with a workforce of 100 workers. This mine is understood to
have a short life, with the resource being nearly exhausted.
(e) Isaac Plains, near Moranbah, has just reopened following its purchase by Stanmore
Coal for $1. There are plans to move operations to the neighbouring Isaac Plains East
resource once Isaac Plains has been exhausted.
(f) Norwich Park, near Dysart, has been rumoured to be considered for reopening,
provided that low cost workers could be sourced.
(g) The Hillalong Coal Project is a proposed new coal mine located approximately 60km
northwest of Nebo. Two open cut pits and two underground longwall mines are
proposed that would produce 4.2Mt per annum and the life of the project is estimated
at 17 years.
(h) Broughton, 30km northwest of Nebo is a proposed single open cut pit. The mine is
projected to produce up to 3Mt per year for approximately 15 years.
(i) The New Lenton Project is an open-cut coal resource located 65km northwest of Nebo.
There is already an approval to mine 2Mt of run-of-mine coal due to start construction
in 2016. It is proposed that the production rate is increased to 8Mt by mining adjacent
land. With this expansion, the overall project is estimated to have a lifetime of 25 years.
(j) Ellensfield is a project 35km northeast of Moranbah involving the development of a
new underground coal mine producing up to 3Mt per year of semi-soft coking and
thermal coal for export.
(k) Red Hill, a new underground coking coal mine 20km north of Moranbah has been
approved along with an extension to the Broadmeadow underground mine and the
open cut Goonyella Riverside Mine.
Norling Consulting Pty Ltd
07 3236 0811 | www.norling.com.au | [email protected]
Business & Property Economics Norling Consulting
Pty Ltd
16025 –October 2016 14
(l) The Codrilla Project is a proposed open cut coal mine to be located 45km south west
of Nebo. An average annual production rate of 2.7Mt is expected with 16 years of
production expected. It is anticipated that ongoing exploration may identify additional
resources enabling the mine to extend its operating life beyond this.
In addition to these proposed new projects, it is expected that a number of the existing mines
would increase production levels once demand increases and the price increases. In
contrast, several mines are due for closure including Burton (late 2016), Newlands (mid-
2016), Moorvale (2016),
With coal prices recently plumbing to new lows, there is little optimism at present that the
previous boom times will return in the near or medium term. It is noted that there has been
a slight increase in the coal price during mid-2016. However, that rate of increase is not
expected to continue, with the projections prepared by various reputable authorities basically
indicating that the coal price will only increase marginally over the next five years or so.
In the longer term, climate change mitigation efforts will have a larger bearing on the future
of coal with the demise of the Queensland coal industry expected by about 2040 if the
industry cannot reduce carbon emissions from the burning of coal by at least 95% at an
economical price. Carbon capture and storage is a key technology in reducing greenhouse
gas emissions, although more research is required before this method is viable. However, if
the industry can meet this challenge, it is likely that coal will continue to be an important
source of energy for many more decades, cementing the future of the Bowen and Galilee
Basins for many more decades.
It is Norling Consulting’s view that the most likely scenario is for a continuation of existing
production levels in the short term, with a reasonable prospect for a small increase in
employment over the next decade. There is also a reasonable prospect that production and
employment levels would reduce post-2030.

Norling Consulting Pty Ltd
07 3236 0811 | www.norling.com.au | [email protected]
Business & Property Economics Norling Consulting
Pty Ltd
16025 –October 2016 15
3.1.1 Technology Advancements in the Mining Industry
Technological advancements in the mining industry are also likely to impact on the workforce.
Following the downturn, companies are increasingly looking for ways to minimise costs of
production and labour. According to ‘Tracking the Trends 2016’ by Deloitte, the following
technologies could significantly change the future of the mining industry:
- Networks: It is becoming more cost effective to use sensors connected to the internet and
each other to collect data on mining equipment. This could allow cloud-based, integrated
IT platforms to share operational data with suppliers and eliminate unplanned
maintenance and downtime.
- Machine learning: The growing ‘intelligence’ of robotic process automation and
autonomous vehicles will result in machines performing increasingly complex and
hazardous tasks. This is likely to reduce labour costs and improve safety and productivity.
Ultimately, it may be possible to operate mines completely autonomously, concentrating
workers in a central hub instead of at a remote region.
- Genomics: Surprisingly, medical gene research can have relevant applications in the
mining industry. While still a relatively new concept, bacteria capable of extracting
minerals is being researched and using natural enzymes for bio-remediation purposes to
clean contaminated sites has already been utilised.
- Wearables: Technologies that are incorporated into clothing and accessories can provide
significant advantages to the health and safety of workers and to overall production costs.
For example, wearable devices can track driver fatigue of truck-drivers to prevent
accidents and pin-point the location of underground workers allowing operators to heat
or cool only occupied areas of the mine, reducing energy costs. Signals from wearable
devices could also improve response time to workers in the event of an accident or injury.
- Hybrid Airships: Lockheed Martin has recently developed and commercialised hybrid
airships. With costs currently comparable to truck transport (and much cheaper than via
helicopter), the giant airships would enable the haulage of equipment and fuel to remote
regions lacking accessible roads.

Norling Consulting Pty Ltd
07 3236 0811 | www.norling.com.au | [email protected]
Business & Property Economics Norling Consulting
Pty Ltd
16025 –October 2016 16
3.2. The Agriculture Industry
In contrast to the dominance of the coal sector, the agricultural sector employed only 4.6% of
total workers working in the Region in 2011, a rate which has declined from 11.7% in 2001.
This industry comprises mainly beef cattle, with some sugar cane grown in the coastal part of
the Region. Livestock contributes approximately 70% of gross value of commodities, with
crops contributing the remainder.
The Isaac Region has two important agricultural areas, as identified by the Queensland
Agricultural Land Audit – East Coast (the coastal area of Ilbilbie and Carmilla forms part of
this broader area) and The Golden Mile (located around Dysart and Middlemount). The East
Coast is an important area for the growing of sugar cane, but is also recognised as being a
high pasture-growth area, with the potential for horticulture and plantation forestry. The
Golden Mile is an area of high-quality soils along the Isaac, Conners and Mackenzie Rivers
that provide very high quality grazing and dryland cropping. The Land Audit notes that this
area has the potential for further expansion into irrigated cropping and horticulture if water
and transport was made available.
Queensland cattle farmers have endured a long period of drought, with parts of the Isaac
Region remaining ‘drought declared.’ However, rains in parts of the state have increased
demand for cattle, resulting in strong cattle prices. Prices are likely to remain high until farms
achieve adequate stocking rates. The beef industry is viewed as a stable industry, with rainfall
being the key arbiter of fortune for this industry.
The Mackay Isaac Whitsunday Region grows around a quarter of Queensland’s sugarcane,
with the climatic conditions and good soils producing high sugarcane yields with high sugar
content. This wider Region provides an established sugarcane tramway network, five sugar
mills and port facilities for exporting. There is also a sugar refinery located at Mackay’s
Racecourse Mill that produces food-grade sugar and an ethanol plant that can produce up to
60ML of ethanol per year. Some mills are establishing facilities to produce bio-products such
as furfural and to use bagasse for the cogeneration of electricity.

Norling Consulting Pty Ltd
07 3236 0811 | www.norling.com.au | [email protected]
Business & Property Economics Norling Consulting
Pty Ltd
16025 –October 2016 17
The current mill infrastructure has the capacity to process additional sugarcane if there is an
expansion of sugarcane production. There are also opportunities for other by-products of
sugar cane processing such as the production of bio-plastics. The closest sugar mill to the
Isaac Region is Plane Creek Mill at Sarina.
Within the Isaac Region, sugar cane is grown at Ilbilbie and Carmilla. There appears to be an
opportunity for an expansion of sugar cane in this part of the Region, although other parts of
the Region appear unsuitable.
Within the Region, grain crops are grown mostly as feed stock for local cattle feedlots.
Extensive dryland cropping, primarily sorghum in summer and legumes and wheat in winter,
occurs in the western areas near Clermont and Dysart and surrounding the junction of the
Isaac and Connor’s River. Grain from these areas is transported via rail or road at the Mount
McLaren grain depot near Clermont.
A reliable water supply would significantly improve the value and production of agriculture
throughout the Region and create further opportunities for irrigated cropping and horticulture.
Aquaculture is also present within the Region with Australian Prawn Farms at Ilbilbie
harvesting 40 tonnes of tiger prawns from 33 hectares of ponds per week. St Lawrence is
also well known for its mud crabbing industry with stock transported directly to Sydney for
consumption. With much of the Isaac Region’s coastline undeveloped, there may be further
opportunities for the aquaculture industry to expand, particularly in the St Lawrence area,
however, environmental regulations related to the protection of water quality in Great Barrier
Reef waters may pose a significant challenge to realising such opportunities.

Norling Consulting Pty Ltd
07 3236 0811 | www.norling.com.au | [email protected]
Business & Property Economics Norling Consulting
Pty Ltd
16025 –October 2016 18
3.3. The Tourism Industry
The Isaac Region, in particular the coastal part of the Region, is identified as an emerging
tourism precinct in the Mackay Destination Tourism Plan 2014 - 2020.
Commercial fishing and aquaculture operations are located in the coastal areas and several
‘trails’ connect throughout the Region. ‘The Mining Trail’ extends from Mackay to Clermont
and ‘The Great Inland Way’ connects Clermont to Charters Towers, presenting visitors with
the opportunity to experience the rich culture of early European settlers in the area. ‘The
Copper Trail’ connects the inland town of Clermont to the coastal community of St Lawrence,
closely following the historical route used to transport copper and other commodities from
the hinterland to the then Port of St Lawrence.
Tourism data is available for the Isaac Region as average annual data from year ending
December 2009 to December 2012 (averaged over a four year period to increase the stability
of the data). The Isaac Region is included within the Mackay Tourism Region as defined by
Tourism and Events Queensland. While more recent data is available for the Mackay Tourism
Region, given the Isaac Region’s small portion of visitors, it is considered that the totals would
not be well representative of the Isaac Region. Therefore, this section outlines the average
annual data of the Isaac Tourism Profile for the December 2009 – 2012 period.
During this time there was an average of 166,000 domestic overnight visitors to the Isaac
Region staying for a total of 591,000 nights. The main purpose of their visit was for business
(69%), followed by visiting friends and relatives (13%) and holiday (11%). The major type of
transport used to access the Region was by motor vehicle (80%). 10% of visitors arrived via
air transport and only 2% by bus or coach. This data indicates that DIDO miners dominate
the domestic overnight visitor market rather than traditional tourists.
There was an average of 5,000 international overnight visitors to the Region staying for a total
of 104,000 nights and representing an average stay of nearly 20 nights.
It was estimated that 202,000 day trips were made to the Region during this period, of which
the main purpose of the trip was for business (42%). The main Regions of origin were the
Mackay Region (59%) and Central Queensland (25%).

Norling Consulting Pty Ltd
07 3236 0811 | www.norling.com.au | [email protected]
Business & Property Economics Norling Consulting
Pty Ltd
16025 –October 2016 19
Thus tourism (excluding DIDO workers and other business travellers) within the Isaac Region
is a very small market. Some growth is expected in this market from a small base, with the
Region’s share of this tourism market considered to be dependent upon travel to and from
other destinations, such as Mackay and Emerald.
3.4. The ‘Sea Change’ Phenomenon
The ‘sea change’ phenomenon is a term used to describe the increasing settlement of the
Australian coast, particularly those areas outside the primary urban metropolitan centres.
This migration to rural coastal settlements has been driven by the desire to seek a better
lifestyle and improved quality of life, particularly by middle-aged and older Australians.
While the Isaac Region has not experienced population growth resulting from the sea change
phenomenon so far, the nearby community of Sarina has been a beneficiary of modest
population growth, although it is difficult to separate the growth attributed to purely people
seeking a sea change or as a result of the mining boom. The Isaac Region’s coastal
settlements (Ilbilbie and Carmilla) may appeal to this market in the medium to longer term,
but do not currently have the critical population mass to support an appropriate range of
services. It is therefore not recommended that future population growth should be
encouraged unless a commensurate provision of services is planned and instigated.
3.5. The Rise of FIFO and DIDO
The resource sector requires employees to work in geographically isolated areas. In the past,
mining companies have sourced workers from a mixture of local residents and FIFO/DIDO
(non-resident workers). There is now, however, a movement away from this workforce
structure with an increased proportion of FIFO and DIDO workers. For example, BHP
Mitsubishi Alliance secured Queensland government approval for a 100% FIFO workforce for
its Caval Ridge and Daunia Mines, near Moranbah. Furthermore, it was specified that
employees would only be sourced from Cairns or Brisbane, excluding local workers and
permanent relocation as an option.

Norling Consulting Pty Ltd
07 3236 0811 | www.norling.com.au | [email protected]
Business & Property Economics Norling Consulting
Pty Ltd
16025 –October 2016 20
Increased FIFO and DIDO could have significant impact upon resource communities including
the following:
Fewer jobs available for local residents meaning residents may have to relocate to
find work.
Lack of integration between resident and non-resident workers creates a strong ‘us
vs them’ mentality, negatively impacting on the identity and sense of community of
resource towns.
The non-resident workforce is not included in the data used to assess critical
infrastructure and essential requirements. This can place additional pressure on
infrastructure and services including the road network, health and emergency
services.
There may also be negative impacts upon the FIFO/DIDO workers themselves, with this form
of work linked to increased divorce rates, increased prevalence of social and criminal issues
such as domestic violence, alcoholism, gambling and impaired physical and mental health.
Following a parliamentary enquiry into ‘FIFO and other long distance commuting work
practices in regional Queensland’, the State Government is currently undertaking work to
legislate a prohibition on a 100% FIFO operational workforce and discrimination against locals
during the recruitment of new workers. The Strong and Sustainable Resource Communities
Bill is understood to be introduced to parliament later this year. The Draft Bill introduces the
proposed Strong and Sustainable Resource Communities Act 2016 which would require the
owners of large resource projects to prepare social impact assessments for their projects, to
employ people from nearby communities and not to discriminate against residents from
nearby regional communities when employing for the projects. This would also include a
prohibition on 100% FIFO workers for large resource projects that have a nearby regional
community.
Whilst these belated state government initiatives may redress some of the negative
consequences of the FIFO and DIDO workforces, the underlying trend appears to remain
entrenched: employers prefer to maximise FIFO and DIDO employment in comparison to local
workforces.
Norling Consulting Pty Ltd
07 3236 0811 | www.norling.com.au | [email protected]
Business & Property Economics Norling Consulting
Pty Ltd
16025 –October 2016 21
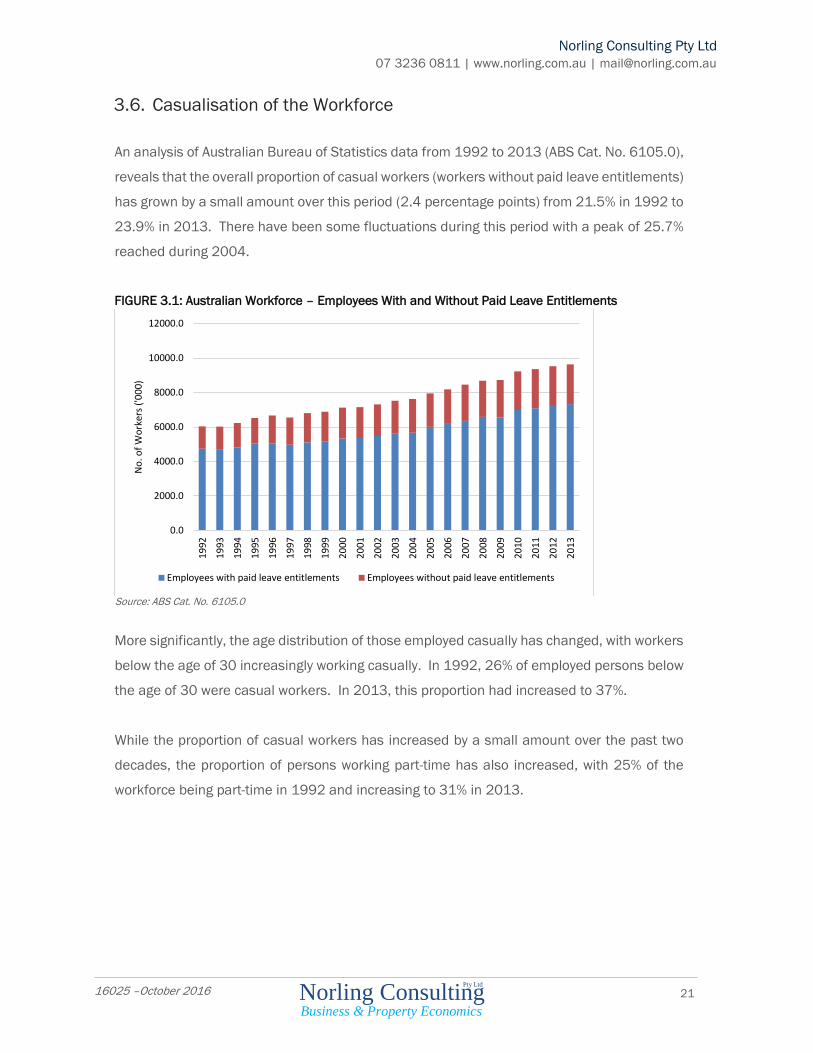
3.6. Casualisation of the Workforce
An analysis of Australian Bureau of Statistics data from 1992 to 2013 (ABS Cat. No. 6105.0),
reveals that the overall proportion of casual workers (workers without paid leave entitlements)
has grown by a small amount over this period (2.4 percentage points) from 21.5% in 1992 to
23.9% in 2013. There have been some fluctuations during this period with a peak of 25.7%
reached during 2004.
FIGURE 3.1: Australian Workforce – Employees With and Without Paid Leave Entitlements
Source: ABS Cat. No. 6105.0
More significantly, the age distribution of those employed casually has changed, with workers
below the age of 30 increasingly working casually. In 1992, 26% of employed persons below
the age of 30 were casual workers. In 2013, this proportion had increased to 37%.
While the proportion of casual workers has increased by a small amount over the past two
decades, the proportion of persons working part-time has also increased, with 25% of the
workforce being part-time in 1992 and increasing to 31% in 2013.
0.0
2000.0
4000.0
6000.0
8000.0
10000.0
12000.0
19
92
19
93
19
94
19
95
19
96
19
97
19
98
19
99
20
00
20
01
20
02
20
03
20
04
20
05
20
06
20
07
20
08
20
09
20
10
20
11
20
12
20
13
No
. of
Wo
rker
s ('
00
0)
Employees with paid leave entitlements Employees without paid leave entitlements

Norling Consulting Pty Ltd
07 3236 0811 | www.norling.com.au | [email protected]
Business & Property Economics Norling Consulting
Pty Ltd
16025 –October 2016 22
FIGURE 3.2: Australian Workforce – Full time and Part time
Source: ABS Cat. No. 6105.0
Another change relevant to the workforce is that there is no longer the ‘job for life’ or ‘career
for life’ mindset. While many older workers left school or university, found a job, and remained
there for the rest of their working life, younger people are more willing to change employers
and industry sectors. Such changes are the result of people seeking to enhance their career,
obtain increased remuneration or through a change in career. Such an outlook by workers
results in the preference to live somewhere that has a range of potential employers, i.e. cities
or major metropolitan areas.
This general move to a casualisation of the workforce is considered to favour population
growth in the major cities (that provide a wider range of employment opportunities) in
comparison to regional areas.
The resource sector may increasingly follow the global trend towards the casualisation of
workforces with a growing proportion of jobs filled by contractors instead of permanent
positions. Influenced by market volatility and the need for workforce flexibility, in the Pilbara,
Rio Tinto announced in July 2016 that it would only hire contract labour for its iron ore
operations. There are concerns that this will impact upon the town with contractors unwilling
to move to the town given the lack of job security.
0
2000
4000
6000
8000
10000
12000
14000
19
92
19
93
19
94
19
95
19
96
19
97
19
98
19
99
20
00
20
01
20
02
20
03
20
04
20
05
20
06
20
07
20
08
20
09
20
10
20
11
20
12
20
13
No
. of
Wo
rker
s ('
00
0)
Total full-time persons Total part-time persons

Norling Consulting Pty Ltd
07 3236 0811 | www.norling.com.au | [email protected]
Business & Property Economics Norling Consulting
Pty Ltd
16025 –October 2016 23
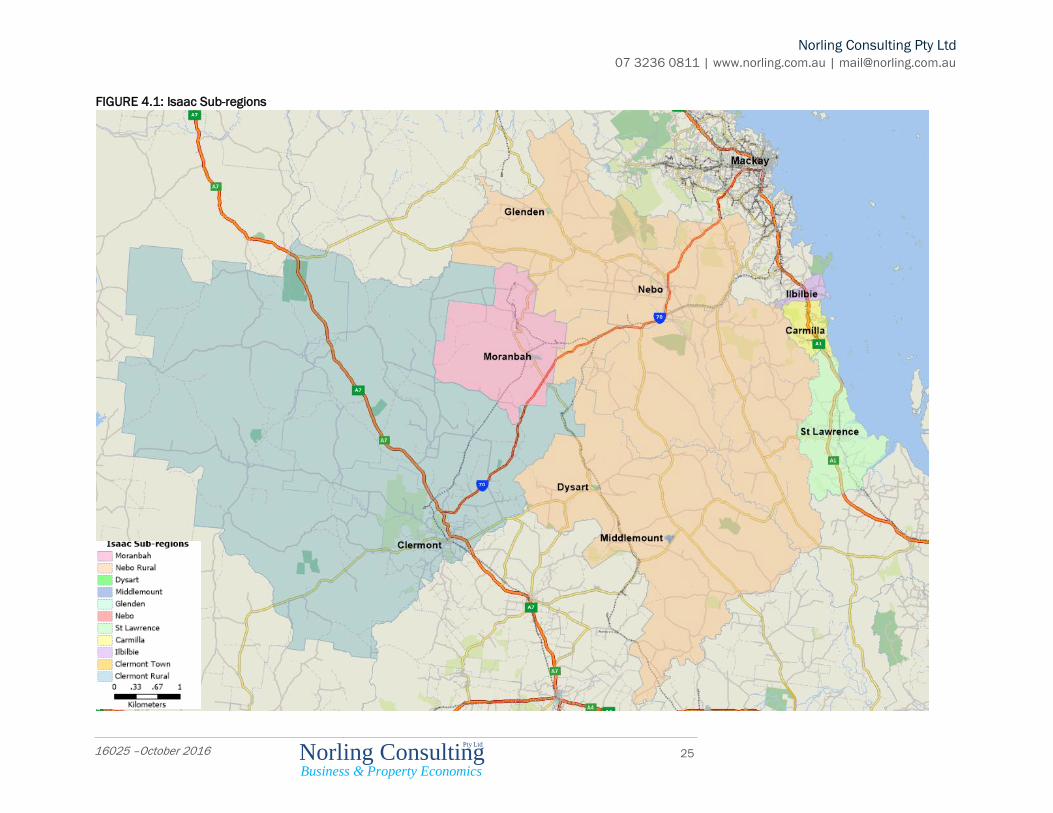
4. SUB-REGION ANALYSIS
For planning purposes, the Isaac Region has been divided into eleven smaller sub-regions
which represent discrete communities and have been defined based upon:
The ABS’s Statistical Area 2 (SA2) and Statistical Area 1 (SA1) boundaries;
Natural and engineering constraints;
Planning and infrastructure limitations; and
Discussions with Council staff.
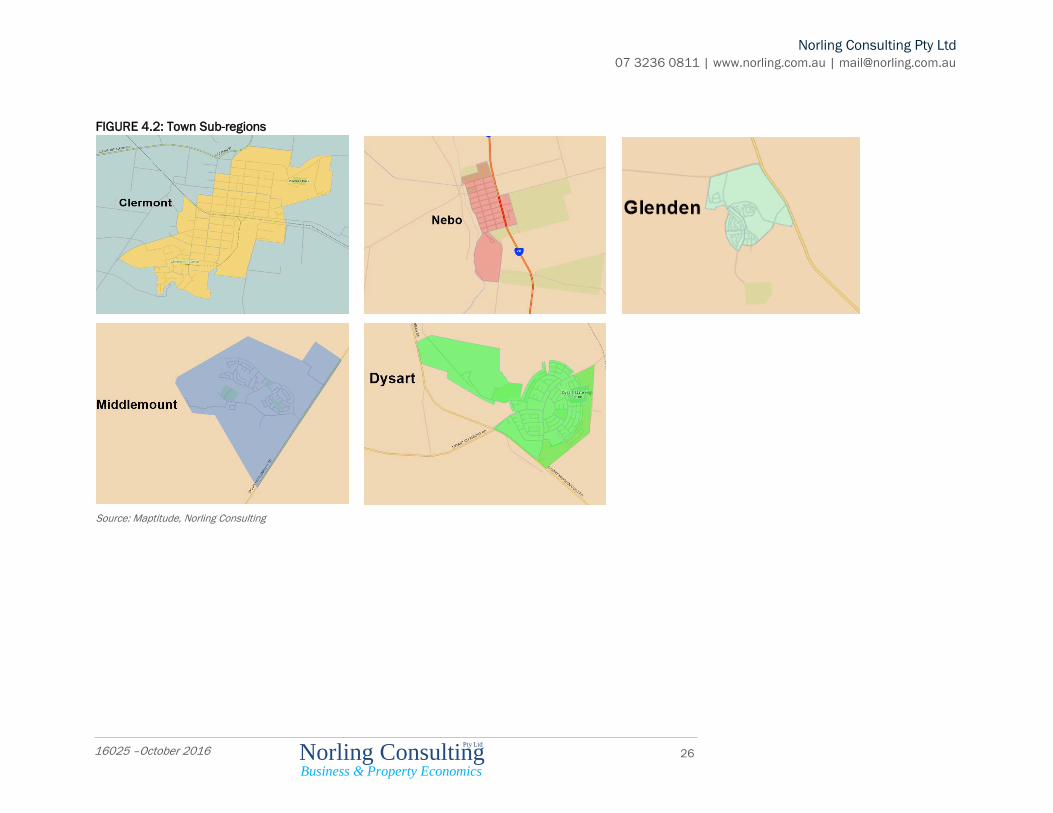
The eleven sub-regions are described below and are illustrated in Figures 4.1 and 4.2
following the below descriptions:
1. Moranbah
This area comprises the SA2 of Moranbah, which includes the town and the surrounding
rural area.
2. Clermont Town
This area comprises six SA1s (3133901, 3133902, 3133903, 3133904, 3133905,
3133906) to form the township of Clermont.
3. Clermont Rural
This area comprises three large rural SA1s (3133907, 3133908, 3133909) that
surround the township of Clermont. The combination of Clermont Town and Clermont
Rural equals the SA2 of Clermont.
4. Ilbilbie
Ilbilbie comprises a single SA1 (3133826) in which the Ilbilbie township and surrounding
rural area is contained.
5. Carmilla
Carmilla comprises a single SA1 (3133811) in which the Carmilla township and
surrounding rural area is contained.

Norling Consulting Pty Ltd
07 3236 0811 | www.norling.com.au | [email protected]
Business & Property Economics Norling Consulting
Pty Ltd
16025 –October 2016 24
6. St Lawrence
St Lawrence comprises a single SA1 (3133821) in which the St Lawrence township and
surrounding rural area is contained.
7. Nebo
The Nebo township comprises two SA1s (3133808, 3133828).
8. Glenden
The Glenden township comprises three SA1s (3133804, 3133805, 3133806).
9. Middlemount
The Middlemount township comprises six SA1s (3133802, 3133803, 3133822,
3133823, 3133824, 3133825).
10. Dysart
The Dysart township comprises eight SA1s (3133801, 3133813, 3133814, 3133815,
3133816, 3133817, 3133818, 3133819) plus a small encroachment into a large rural
SA1 (3133820).
11. Nebo Rural
Nebo Rural comprises the remaining five rural SA1s that are located in the SA2 of
Broadsound – Nebo (3133807, 3133809, 3133810, 3133812 and the remainder of
3133820). That is, Ilbilbie, Carmilla, St Lawrence, Nebo, Glenden, Middlemount, Dysart
and Nebo Rural comprise the SA2 of Broadsound – Nebo.
Norling Consulting Pty Ltd
07 3236 0811 | www.norling.com.au | [email protected]
Business & Property Economics Norling Consulting
Pty Ltd
16025 –October 2016 25
FIGURE 4.1: Isaac Sub-regions
Norling Consulting Pty Ltd
07 3236 0811 | www.norling.com.au | [email protected]
Business & Property Economics Norling Consulting
Pty Ltd
16025 –October 2016 26
FIGURE 4.2: Town Sub-regions
Source: Maptitude, Norling Consulting

Norling Consulting Pty Ltd
07 3236 0811 | www.norling.com.au | [email protected]
Business & Property Economics Norling Consulting
Pty Ltd
16025 –October 2016 27
4.1. Historic Population
The resident population of the Isaac Region has fluctuated alongside the fortunes of the coal
industry. The following Table shows the historic population of the eleven sub-regions from
2001 to 2015, according to the ABS population and household censuses and the ABS’s
Regional Population Publication (2015 population estimate).
The 2015 ABS estimates for the Region have been scrutinised to ensure it does not include
the significant amount of vacant dwellings throughout the region. An analysis of data from
the 2011 census of unoccupied dwellings in the region and based upon several sources of
information of vacant dwellings (water meter readings from Council and real estate website
of available rentals of vacant dwellings) we are confident that the ABS figures have
appropriately excluded the significant amount of unoccupied dwellings in the region.
TABLE 4.1: Population Growth 2001 - 2015
2001
(Act) Inc. p.a.
2006
(Act) Inc. p.a.
2011
(Act) Inc. p.a.
2015
(Est)
Moranbah 6,507 3.1% 7,567 4.0% 9,202 2.2% 10,020
Clermont Town 1,919 -0.9% 1,838 4.0% 2,237 2.3% 2,450
Clermont Rural 1,351 0.3% 1,374 3.3% 1,619 0.4% 1,646
Ilbilbie 265 4.7% 334 -0.7% 323 -0.7% 315
Carmilla 330 0.2% 334 4.2% 411 -0.1% 409
St Lawrence 357 -0.2% 354 2.8% 406 -0.8% 393
Nebo 202 7.4% 288 10.2% 467 -0.7% 454
Glenden 890 5.0% 1,137 3.4% 1,342 1.6% 1,432
Middlemount 2,094 1.2% 2,221 -2.5% 1,955 1.5% 2,077
Dysart 2,877 3.7% 3,447 -0.2% 3,415 -0.8% 3,290
Nebo Rural 1,378 1.4% 1,478 4.1% 1,811 -0.7% 1,783
Total Isaac Region 18,169 2.3% 20,372 2.6% 23,188 1.1% 24,269 Source: ABS, Norling Consulting Estimates
Moranbah has the largest population of the eleven sub-regions, with this area comprising
41% of the total Isaac population in 2015. Strong growth was evident in the 2001 – 2011
period, although growth has softened from 2011.
The mining towns of Dysart, Middlemount, Glenden, Nebo and to a lesser extent Clermont
have experienced fluctuating growth rates corresponding with the operations of mines being
serviced by each town.

Norling Consulting Pty Ltd
07 3236 0811 | www.norling.com.au | [email protected]
Business & Property Economics Norling Consulting
Pty Ltd
16025 –October 2016 28
The coastal communities of Ilbilbie, Carmilla and St Lawrence each have small populations
at and below 400 persons. There has been limited growth in these areas since 2001.
4.2. Population Scenarios
Following discussions with Council staff, Norling Consulting has prepared population
projections based upon four different scenarios. There are of course other factors influencing
population growth, such as those discussed in the previous Chapter, which may lead to a
different outcome.
The assumptions for each scenario are detailed below. It is noted that the population for
2001, 2006 and 2011 are based upon the ABS Censuses and so these figures remain the
same for all scenarios. The 2015 and 2016 estimates are based upon the ABS’s 2015 ERP
estimate. Therefore the 2015 and 2016 estimates also remain the same for all scenarios.
We recommend that the 2015 and 2016 estimates be revised following the release of data
from the 2016 Census.
Scenario 1 – Projections are based upon the Queensland Government Statistician’s Office
(QGSO) medium series projections, as adjusted by the more recent 2015 ERP estimates for
the Region.
Scenario 2 – Projections assume an increase in the proportion of FIFO and DIDO and the
corresponding consequence of using fewer resident workers. Table 4.2 details the total non-
resident worker projections for this Scenario revealing the gradual increase in non-resident
workers from 2016 - 2036.
Scenario 3 – Projections are based on the assumption that carbon capture storage
technologies are unviable and thermal coal production ceases by 2031. Levels of FIFO and
DIDO remain unchanged. The number of non-resident workers are projected to decline post
2026 as the production of thermal coal reduces.
Scenario 4 – Projections assume that carbon capture storage technologies are viable
ensuring the ongoing future operation of thermal coal production. Levels of FIFO and DIDO

Norling Consulting Pty Ltd
07 3236 0811 | www.norling.com.au | [email protected]
Business & Property Economics Norling Consulting
Pty Ltd
16025 –October 2016 29
remain unchanged. The number of resident and non-resident workers are assumed to both
increase under this Scenario.
It is noted that none of the assumption include assumptions relating to the advancements of
technology including increased mechanisation and the impact this may have on labour,
workforce and regional population.
As discussed under the scenarios, the quantum of non-resident workers in the Region will
influence the resident population. QGSO has prepared four projection series to 2022 (Series
A, B, C and D) for non-resident workers, revealing the high degree of uncertainty involved in
such projections. All four series project the region’s non-resident population to decline to
9,730 persons in 2016 due to workforce reductions and mine closures. Series A anticipates
that the number of non-resident workers will remain relatively stable to 2022. Series B, C
and D projections foresee overall growth in the non-resident workforce. Series B takes into
account five coal projects (including Carmichael Coal and Red Hill), three rail projects, and
the Galilee Basin Transmission Project, which have all been approved but yet to reach FID.
Series C projection takes into account all Series B projects, along with the influence of two
additional coal projects that have published an EIS but are yet to receive an approval. The
Series D projection includes a further three coal projects in early planning. It is noted that
none of the projection series include consideration of the Arrow Bowen Pipeline or Bowen Gas
Project.
As such, the QGSO non-resident worker projections have been analysed and Norling
Consulting has adopted a 2021 position as between Series B and C.
Projections of non-resident workers are detailed for each Scenario in the Table below:
TABLE 4.2: Non-Resident Worker* Projections for Isaac Region
2011 2016 2021 2026 2031 2036
Scenario 1 13,590 9,730 14,500 13,000 12,000 11,000
Scenario 2 13,590 9,730 14,650 15,150 16,100 17,500
Scenario 3 13,590 9,730 14,500 13,500 10,500 6,500
Scenario 4 13,590 9,730 14,500 13,000 14,500 17,400
*Non-resident workers on-shift Source: QGSO projections and Norling Consulting

Norling Consulting Pty Ltd
07 3236 0811 | www.norling.com.au | [email protected]
Business & Property Economics Norling Consulting
Pty Ltd
16025 –October 2016 30
Table 4.3 sets out the totals of each population scenario for the Isaac Region. The data is
illustrated in Figure 3.2 below.
TABLE 4.3: Isaac Region Population Projections for the Four Scenarios 2016 - 2036 2016 Inc. p.a. 2021 Inc. p.a. 2026 Inc. p.a. 2031 Inc. p.a. 2036
Scenario 1 24,620 1.3% 26,266 1.3% 27,964 1.3% 29,758 1.2% 31,646
Scenario 2 24,620 0.9% 25,763 0.7% 26,681 0.6% 27,432 0.5% 28,175
Scenario 3 24,620 1.1% 25,975 0.5% 26,628 -0.5% 26,017 0.1% 26,131
Scenario 4 24,620 1.3% 26,242 1.2% 27,924 2.4% 31,387 2.6% 35,762
Source: ABS, QGSO Population Projections, Norling Consulting
FIGURE 4.3: Isaac Region Population Projections for the Four Scenarios
Source: ABS, QGSO Population Projections, Norling Consulting
Scenario 4 (carbon capture technologies viable) results in the greatest population in 2036
due to the continued production of thermal coal. Such technologies are not expected to
become viable or commercially available until at least another decade, so stronger levels of
growth are projected to occur post 2026. A population of 35,800 is projected by June 2036.
Under Scenario 1, the Isaac Region is estimated to reach a population of 31,650 by 2036.
Steady growth rates in the order of 1.3% are projected to occur from 2016 to 2036 in
accordance with the medium series QGSO population projections.
Scenario 2, based upon the assumption that mines will increase their proportion of FIFO/DIDO
workers, results in a 2036 population of 28,200. Growth rates of below 1% are expected with
this Scenario beyond 2016.
0
5,000
10,000
15,000
20,000
25,000
30,000
35,000
40,000
2001 2006 2011 2016 2021 2026 2031 2036
Esti
mat
ed
Re
sid
en
t P
op
ula
tio
n (
No
.)
Scenario 1
Scenario 2
Scenario 3
Scenario 4

Norling Consulting Pty Ltd
07 3236 0811 | www.norling.com.au | [email protected]
Business & Property Economics Norling Consulting
Pty Ltd
16025 –October 2016 31
Scenario 3 is projected to result in the lowest 2036 population estimate of all scenarios.
Based on this Scenario, the Region is projected to reach a population of 26,100. The effects
of the reduced demand for thermal coal is likely to be evident from 2021 with growth rates
decreasing from this time onwards.
The following details the population projections for the smaller sub-regions for each scenario.
Scenario 1
TABLE 4.4: Population Projections Scenario 1
2016 inc. p.a. 2021 inc. p.a. 2026 inc. p.a. 2031 Inc. p.a. 2036
Moranbah 10,303 2.0% 11,360 1.8% 12,410 1.7% 13,480 1.7% 14,630
Clermont Town 2,458 0.9% 2,565 0.9% 2,681 1.0% 2,817 0.9% 2,950
Clermont Rural 1,652 0.6% 1,706 0.8% 1,773 1.2% 1,885 1.3% 2,011
Ilbilbie 319 0.0% 319 1.0% 335 1.0% 352 1.0% 369
Carmilla 411 0.7% 425 1.0% 446 1.0% 469 1.0% 492
St Lawrence 388 0.4% 395 0.7% 409 0.7% 422 0.2% 426
Nebo 469 2.1% 521 1.8% 569 1.8% 621 1.7% 677
Glenden 1,459 1.8% 1,594 1.8% 1,740 1.8% 1,899 1.3% 2,031
Middlemount 2,091 0.5% 2,142 0.1% 2,149 -0.2% 2,126 -0.2% 2,104
Dysart 3,305 0.8% 3,433 0.7% 3,558 0.7% 3,693 0.9% 3,864
Nebo Rural 1,768 0.4% 1,807 1.0% 1,896 1.0% 1,993 1.0% 2,092
Total Isaac Region 24,622 1.3% 26,266 1.3% 27,964 1.3% 29,758 1.2% 31,646
Source: ABS, QGSO Population Projections, Norling Consulting
Under Scenario 1, the largest centre of the Region, Moranbah, is projected to grow at modest
rates of 1.7 – 2.0% between 2016 and 2036 to reach a population of 14,630 by 2036. The
coastal areas of Ilbilbie, Carmilla and St Lawrence as well as the rural areas are expected to
experience slow continued growth to 2036. The mining towns of Nebo and Glenden are
projected to grow at modest growth rates at an average of around 1.8% per annum. Dysart,
the largest of the mining towns (outside of Moranbah) is projected to grow by 560 persons
between 2016 and 2036, representing an average annual growth rate of 0.8%. Very little
growth is projected to occur at Middlemount during the twenty year projection period.
Norling Consulting Pty Ltd
07 3236 0811 | www.norling.com.au | [email protected]
Business & Property Economics Norling Consulting
Pty Ltd
16025 –October 2016 32
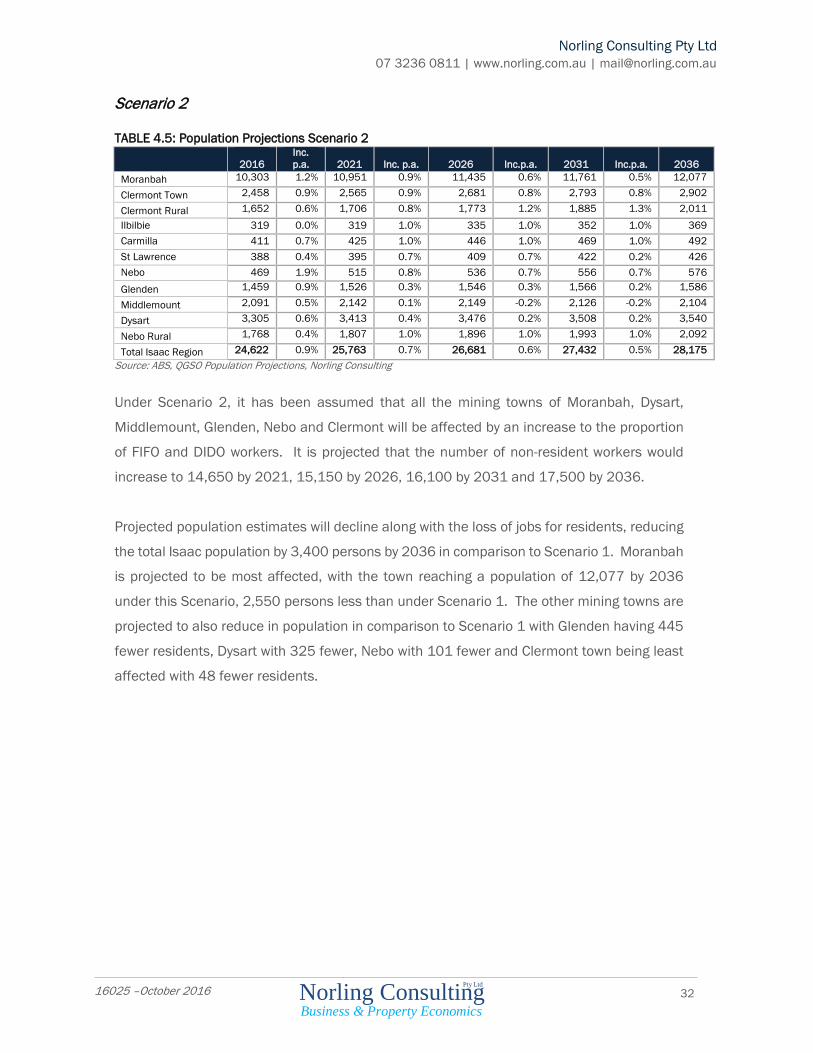
Scenario 2
TABLE 4.5: Population Projections Scenario 2
2016
Inc.
p.a. 2021 Inc. p.a. 2026 Inc.p.a. 2031 Inc.p.a. 2036
Moranbah 10,303 1.2% 10,951 0.9% 11,435 0.6% 11,761 0.5% 12,077
Clermont Town 2,458 0.9% 2,565 0.9% 2,681 0.8% 2,793 0.8% 2,902
Clermont Rural 1,652 0.6% 1,706 0.8% 1,773 1.2% 1,885 1.3% 2,011
Ilbilbie 319 0.0% 319 1.0% 335 1.0% 352 1.0% 369
Carmilla 411 0.7% 425 1.0% 446 1.0% 469 1.0% 492
St Lawrence 388 0.4% 395 0.7% 409 0.7% 422 0.2% 426
Nebo 469 1.9% 515 0.8% 536 0.7% 556 0.7% 576
Glenden 1,459 0.9% 1,526 0.3% 1,546 0.3% 1,566 0.2% 1,586
Middlemount 2,091 0.5% 2,142 0.1% 2,149 -0.2% 2,126 -0.2% 2,104
Dysart 3,305 0.6% 3,413 0.4% 3,476 0.2% 3,508 0.2% 3,540
Nebo Rural 1,768 0.4% 1,807 1.0% 1,896 1.0% 1,993 1.0% 2,092
Total Isaac Region 24,622 0.9% 25,763 0.7% 26,681 0.6% 27,432 0.5% 28,175
Source: ABS, QGSO Population Projections, Norling Consulting
Under Scenario 2, it has been assumed that all the mining towns of Moranbah, Dysart,
Middlemount, Glenden, Nebo and Clermont will be affected by an increase to the proportion
of FIFO and DIDO workers. It is projected that the number of non-resident workers would
increase to 14,650 by 2021, 15,150 by 2026, 16,100 by 2031 and 17,500 by 2036.
Projected population estimates will decline along with the loss of jobs for residents, reducing
the total Isaac population by 3,400 persons by 2036 in comparison to Scenario 1. Moranbah
is projected to be most affected, with the town reaching a population of 12,077 by 2036
under this Scenario, 2,550 persons less than under Scenario 1. The other mining towns are
projected to also reduce in population in comparison to Scenario 1 with Glenden having 445
fewer residents, Dysart with 325 fewer, Nebo with 101 fewer and Clermont town being least
affected with 48 fewer residents.

Norling Consulting Pty Ltd
07 3236 0811 | www.norling.com.au | [email protected]
Business & Property Economics Norling Consulting
Pty Ltd
16025 –October 2016 33
Scenario 3
TABLE 4.6: Population Projections Scenario 3
2016
Inc. p.a. 2021 Inc. p.a. 2026 Inc.p.a. 2031 Inc.p.a. 2036
Moranbah 10,303 1.6% 11,176 1.2% 11,881 0.8% 12,349 0.7% 12,805
Clermont Town 2,458 0.9% 2,565 0.7% 2,656 0.5% 2,721 0.5% 2,782
Clermont Rural 1,652 0.6% 1,706 0.8% 1,773 1.2% 1,885 1.3% 2,011
Ilbilbie 319 0.0% 319 1.0% 335 1.0% 352 1.0% 369
Carmilla 411 0.7% 425 1.0% 446 1.0% 469 1.0% 492
St Lawrence 388 0.3% 393 0.8% 409 0.7% 422 0.2% 426
Nebo 469 1.9% 515 -2.7% 449 -14.9% 201 -10.7% 114
Glenden 1,459 1.3% 1,556 -1.1% 1,470 -8.7% 932 -3.6% 776
Middlemount 2,091 0.9% 2,186 -0.9% 2,091 -3.1% 1,785 -4.0% 1,455
Dysart 3,305 0.1% 3,327 -0.6% 3,222 -2.0% 2,909 -0.7% 2,808
Nebo Rural 1,768 0.4% 1,807 1.0% 1,896 1.0% 1,993 1.0% 2,092
Total Isaac Region 24,622 1.1% 25,975 0.5% 26,628 -0.5% 26,017 0.1% 26,131
Source: ABS, QGSO Population Projections, Norling Consulting
Without viable carbon capture technologies, the future of thermal coal mining is uncertain.
Under this Scenario the non-resident workforce is projected to decline to 13,500 by 2026,
10,500 by 2031 and 6,500 by 2036. While all mining towns are likely to be somewhat
affected, the towns primarily servicing thermal coal mines like Glenden and Nebo would be
most affected. These towns are projected to halve in size, at least. Moranbah would be the
most resilient of the mining towns given the large proportion of coking coal that surrounds
this town. However, a reduction of 1,800 compared to Scenario 1 is projected for the town.
Overall, the 2036 population of the Region would be 5,500 persons less than the Scenario 1
estimate, representing a significant decline of 17%.

Norling Consulting Pty Ltd
07 3236 0811 | www.norling.com.au | [email protected]
Business & Property Economics Norling Consulting
Pty Ltd
16025 –October 2016 34
Scenario 4
Table 4.7: Population Projections Scenario 4
2016
Inc. p.a.
2021 Inc. p.a. 2026 Inc.p.a. 2031 Inc.p.a. 2036
Moranbah 10,303 2.0% 11,356 1.8% 12,401 1.8% 13,525 2.2% 15,104
Clermont Town 2,458 0.9% 2,565 0.9% 2,681 2.8% 3,071 3.5% 3,655
Clermont Rural 1,652 0.6% 1,706 0.8% 1,773 1.2% 1,885 1.3% 2,011
Ilbilbie 319 0.0% 319 1.0% 335 1.0% 352 1.0% 369
Carmilla 411 0.7% 425 1.0% 446 1.0% 469 1.0% 492
St Lawrence 388 0.3% 393 0.8% 409 0.7% 422 0.2% 426
Nebo 469 1.9% 515 1.7% 561 11.9% 985 8.8% 1,499
Glenden 1,459 1.7% 1,587 1.7% 1,728 5.4% 2,246 5.5% 2,936
Middlemount 2,091 0.5% 2,142 0.1% 2,149 4.3% 2,652 1.6% 2,865
Dysart 3,305 0.7% 3,427 0.7% 3,546 1.3% 3,787 2.6% 4,313
Nebo Rural 1,768 0.4% 1,807 1.0% 1,896 1.0% 1,993 1.0% 2,092
Total Isaac Region 24,622 1.3% 26,242 1.2% 27,924 2.4% 31,387 2.6% 35,762
Source: ABS, Norling Consulting Estimates
If carbon capture technologies prove to be successful at an economic level, the Region is
projected to experience stronger rates of growth within the mining towns than all other
Scenarios. Under this Scenario, a 2036 population of 35,760 is projected, which represents
4,100 more persons than under Scenario 1 or an increase of 13%. While the rural and coastal
townships are expected to grow at the same rate as under Scenario 1, additional growth is
expected within Moranbah, Nebo, Glenden and Middlemount and to a lesser extent Dysart
and Clermont Town.

Norling Consulting Pty Ltd
07 3236 0811 | www.norling.com.au | [email protected]
Business & Property Economics Norling Consulting
Pty Ltd
16025 –October 2016 35
5. CONCLUSION
The Isaac Region and its reliance on the resource sector means the Region is export
dependent and vulnerable to the volatility of global issues. The future population growth of
the Region will be highly dependent upon the mining industry and any changes that occur
within this industry, including changes in the proportion of FIFO/DIDO workers, introduction
of carbon capture schemes and the future of thermal coal. Global coal prices, fluctuating
demand, international investment and changing labour costs will also influence the future of
coal mining within the Region.
This Study has explored four different population scenarios based on different assumptions
relating to the mining industry. Projections for the number of non-resident workers in the
Region have also been undertaken for each Scenario. Scenario 1 is based on the medium
series QGSO projections. Scenario 2 is based upon an increase in the proportion of FIFO and
DIDO workers. Scenario 3 assumes that carbon capture technologies will not be
available/viable resulting in the cessation of thermal coal production by 2031. Scenario 4 is
based on the assumption that carbon capture technologies will be available and economic in
the next decade ensuring the ongoing production of thermal coal.
Scenario 4 results in the greatest population in 2036 due to the continued production of
thermal coal. Such technologies are not expected to become viable or commercially available
until at least another decade, so stronger levels of growth are projected to occur post 2026.
A population of 35,800 is projected by June 2036.
Under Scenario 1, the Isaac Region is estimated to reach a population of 31,650 by 2036.
Steady growth rates in the order of 1.3% are projected to occur from 2016 to 2036 in
accordance with the medium series QGSO population projections.
Scenario 2, based upon the assumption that mines will increase their proportion of FIFO/DIDO
workers, results in a 2036 population of 28,200. Growth rates of below 1% are expected with
this Scenario.

Norling Consulting Pty Ltd
07 3236 0811 | www.norling.com.au | [email protected]
Business & Property Economics Norling Consulting
Pty Ltd
16025 –October 2016 36
Scenario 3 is projected to result in the lowest 2036 population estimate of all scenarios.
Based on this Scenario, the Region is projected to reach a population of 26,100. The effects
of the reduced demand for thermal coal is likely to be evident from 2021 with growth rates
decreasing from this time onwards.

Norling Consulting Business & Property Economics
Pty Ltd
Economic & Population Review
October 2016


![Isaac Pitman s Short Isaac Pitman Black and White [Ebooksread.com]](https://static.fdocuments.us/doc/165x107/577cc2f71a28aba71194dba0/isaac-pitman-s-short-isaac-pitman-black-and-white-ebooksreadcom.jpg)