Is There Monopsony in the Labor Market? Evidence from …dstaiger/Papers/2010/staiger spetz...
26
211 [ Journal of Labor Economics, 2010, vol. 28, no. 2] 2010 by The University of Chicago. All rights reserved. 0734-306X/2010/2802-0008$10.00 Is There Monopsony in the Labor Market? Evidence from a Natural Experiment Douglas O. Staiger, Dartmouth College and National Bureau of Economic Research Joanne Spetz, University of California, San Francisco Ciaran S. Phibbs, VA Palo Alto Health Care System and Stanford University Recent theoretical and empirical advances have renewed interest in monopsonistic models of the labor market. However, there is little direct empirical support for these models. We use an exogenous change in wages at Department of Veterans Affairs (VA) hospitals as a natural experiment to investigate the extent of monopsony in the nurse labor market. We estimate that labor supply to individual hos- pitals is quite inelastic, with short-run elasticity around 0.1. We also find that non-VA hospitals responded to the VA wage change by changing their own wages. I. Introduction Standard competitive models assume that individual firms are price takers in the labor market. However, since Robinson (1933) first coined This project was supported by the Department of Veterans Affairs (VA), Vet- erans Health Administration, Health Services Research and Development Service, Investigator Initiated Research (IIR) Program (project 91-148). We thank Paul Cameron, Yvonne Moody, Rona Flanger, and Susan Wheeler for their help in
Transcript of Is There Monopsony in the Labor Market? Evidence from …dstaiger/Papers/2010/staiger spetz...

211
[ Journal of Labor Economics, 2010, vol. 28, no. 2]� 2010 by The University of Chicago. All rights reserved.0734-306X/2010/2802-0008$10.00
Is There Monopsony in the LaborMarket? Evidence from a Natural
Experiment
Douglas O. Staiger, Dartmouth College
and National Bureau of Economic Research
Joanne Spetz, University of California, San Francisco
Ciaran S. Phibbs, VA Palo Alto Health Care System
and Stanford University
Recent theoretical and empirical advances have renewed interest inmonopsonistic models of the labor market. However, there is littledirect empirical support for these models. We use an exogenouschange in wages at Department of Veterans Affairs (VA) hospitals asa natural experiment to investigate the extent of monopsony in thenurse labor market. We estimate that labor supply to individual hos-pitals is quite inelastic, with short-run elasticity around 0.1. We alsofind that non-VA hospitals responded to the VA wage change bychanging their own wages.
I. Introduction
Standard competitive models assume that individual firms are pricetakers in the labor market. However, since Robinson (1933) first coined
This project was supported by the Department of Veterans Affairs (VA), Vet-erans Health Administration, Health Services Research and Development Service,Investigator Initiated Research (IIR) Program (project 91-148). We thank PaulCameron, Yvonne Moody, Rona Flanger, and Susan Wheeler for their help in

212 Staiger et al.
the term “monopsony,” economists have considered the alternative casein which individual firms face upward-sloping labor supply curves andtherefore have market power that enables them to set wages. Originally,monopsony power was thought to exist primarily in fairly specializedlabor markets in which a single firm bought labor in an isolated labormarket (analogous to a monopolist in a product market). More recently,a variety of theoretical models have suggested that monopsonistic com-petition may be pervasive, with individual firms facing upward-slopinglabor supply curves because of the presence of oligopoly, differentiationbetween firms, variation in worker preferences, moving costs, a costly jobsearch, or efficiency wages (Boal and Ransom 1997; Bhaskar, Manning,and To 2002). Manning (2003) has argued that monopsony can help ex-plain a wide range of labor market features, including the effects of theminimum wage, firm-size wage effects, and gender and racial wage gaps.
Empirical evidence of monopsonistic competition is quite mixed (seeBoal and Ransom [1997], Bhaskar et al. [2002], and Manning [2003] forreviews). On the one hand, monopsonistic competition provides a possibleexplanation for a variety of facts that are difficult to explain in the com-petitive model. For example, monopsonistic competition has been usedto explain why an increase in the minimum wage led to an increase inemployment (Card and Krueger 1995; Bhaskar and To 1999), why thereis a positive relationship between firm size and wages (Green, Machin,and Manning 1996), and why there are persistent differences across firmsin wages and vacancy rates (Yett 1975; Card and Krueger 1995; Boal andRansom 1997; Bhaskar and To 1999). On the other hand, direct estimationof the elasticity of labor supply to individual firms has yielded mixedresults, suggesting that firms have very little market power over the wagesof nurses (Sullivan 1989; Hansen 1992; Matsudaira 2009) and coal miners(Boal 1995) but some market power over the wages of teachers (Falch2010, in this issue; Ransom and Sims 2010, in this issue).
This article investigates whether individual hospitals have monopsonypower in the labor market for registered nurses (RNs). Some have arguedthat the RN labor market is a likely example of monopsony because ofpersistent variations in wages across regions and across hospitals, alongwith nearly continuous reports of shortages since World War II (Yett1975; Aiken 1982; Roberts et al. 1989; Friss 1994; Greene and Nordhaus-Bike 1998). On the other hand, RNs have greater interemployer mobilitythan other occupations, which suggests that RNs are mobile and that
compiling and understanding data from the VA. We also thank seminar partici-pants at various universities and conferences and the editor and two thoughtfulreferees for helpful comments. A previous version of this article was publishedin the NBER Working Papers series. Contact the corresponding author, DouglasO. Staiger, at [email protected].

Monopsony in the Labor Market 213
firm-level monopsony power may be weak (Hirsch and Schumacher2005).
We analyze the effect of an exogenous, legislated change in RN wagesat Department of Veterans Affairs (VA) hospitals. Our analysis differs intwo important ways from the prior literature estimating monopsonypower at the firm level. First, previous studies have used measures ofoutput demand as instruments for wages in estimating the supply elas-ticity. In contrast, our source of identification comes from a legislatedchange in wages at certain hospitals. Arguably, this legislated change inwages provides the perfect “natural experiment” with which to answerthe key question: does an exogenous change in wages at one hospitalaffect employment at that hospital or at competing hospitals? A seconddifference from the prior literature is that our empirical analysis is ex-plicitly motivated by a model of geographic differentiation among firms,similar to Salop (1979), in which hospitals compete directly only withtheir nearest neighbors. In this model, geographic differentiation can begeneralized as the subjective disutility the worker suffers with each em-ployer (Bhaskar and To 1999), with transportation costs being one of thesources of disutility.1 This model suggests that other hospitals will changetheir wages in response to the VA wage change and that the response willbe largest at hospitals that are nearest to the VA hospital.
Our empirical results are consistent with the presence of monopsonypower in the RN labor market, in large part generated by geographicdifferentiation between hospitals. We find that wages at non-VA hospitalsresponded to the VA wage change and that this response was largestamong hospitals located within 15 miles of a VA hospital. In addition,we find that RN employment at individual hospitals responded very littlein the short run to the resulting changes in relative wages between hos-pitals. Our estimates of the short-run elasticity of labor supply to anindividual hospital average around 0.1, far lower than previous estimatesin the literature. Overall, this evidence suggests that hospitals are wagesetters in the RN labor market, with considerable market power.
II. Previous Studies of Monopsony in Nursing
Studies of monopsonistic competition in the nursing labor market havebeen motivated by two observations. First, in rural regions, there may beonly one hospital and few other employers for RNs, potentially providingRN employers with market power. Second, as stated above, there havebeen persistent reports of nursing shortages since the 1940s. Research on
1 Bhaskar and To (1999) suggest that disutility to the worker can arise fromdifferences between worker preferences and employer characteristics. Transpor-tation costs can underlie these differences.
214 Staiger et al.
nursing labor markets has provided conflicting evidence about the mo-nopsony hypothesis.
Studies of nursing monopsony generally have taken two approaches.One line of literature has examined whether there is a cross-sectionalrelationship between wage levels and either labor market concentrationor measures of worker mobility suggested by the “new monopsony”literature (Manning 2003). Several studies have found that RN wages arelower when there are fewer hospitals or when hospital markets are moreconcentrated (Hurd 1973; Link and Landon 1975; Bruggink et al. 1985;Robinson 1988). However, studies that more carefully adjust for otherregional factors, such as the cost of living, find no evidence that marketconcentration per se is associated with lower wages (Adamache and Sloan1982; Feldman and Scheffler 1982; Hirsch and Schumacher 1995). Hirschand Schumacher (2005) find some evidence among women that wages arelower in markets with lower worker mobility, but not for RNs.
A more recent approach has sought to explicitly estimate the elasticityor inverse elasticity of labor supply to an individual hospital. In a simplestatic model of monopsony, the inverse elasticity of labor supply is ameasure of “exploitation” analogous to the Lerner index and equals thepercentage amount that the wage lies below marginal revenue product(see Boal and Ransom 1997). Sullivan (1989) estimated a wage elasticityof supply to individual hospitals of 1.26 over a 1-year period and 3.85over a 3-year period, using a national sample of hospitals from 1980 to1985. In contrast, Hansen (1992), using an almost identical methodology,found that supply was very elastic in California from 1980 to 1987. Han-sen’s estimates of the labor supply elasticity ranged from 29 to 56.2 In adynamic model, these short-run elasticity estimates will overstate theamount of exploitation if labor supply is more elastic in the long run.Under reasonable assumptions, even Sullivan’s estimates suggest that mo-nopsony power is small in this market, with RN wages no more than10% below marginal revenue product (Boal and Ransom 1997).
There are two reasons to believe that these estimates may overstate theshort-run supply elasticity (and thereby understate the amount of mo-nopsony power). First, in both papers, hospital days are assumed to beexogenous demand shifters and serve as instruments in estimating thesupply curve by two-stage least squares (2SLS). Therefore, these papers’2SLS estimates of elasticities greater than 1 reflect the fact that for a givendecline in hospital days, we observed RN employment to fall by more(often much more) than RN wages. However, reimbursement of hospitals
2 Matsudaira (2009) finds a highly elastic labor supply of nurse aides, usingchanges in minimum staffing rules in California as an instrument for demand.Unfortunately, the staffing rules had little impact on higher-skilled nurses andcould not be used to accurately estimate labor supply elasticities for RNs.

Monopsony in the Labor Market 215
changed dramatically over this period with the introduction of Medicare’sProspective Payment System in 1984, and hospitals responded to thischange by reducing days spent in the hospital (Coulam and Gaumer 1991).This suggests that much of the observed variation in hospital days overthe early 1980s was endogenous. If hospital days were chosen endoge-nously, one would expect a positive association between the error in thesupply equation and hospital days. This would bias the 2SLS methodtoward overstating the positive relationship between hospital days andRN employment and would therefore bias upward the estimate of theelasticity of supply.
A second reason to believe that these estimates may overstate the short-run supply elasticity is that both studies measure the wage using theaverage RN wage in the hospital. If a wage increase results in dispro-portionate hiring at the entry level, and entry-level workers are paid less,then the change in the average wage will tend to understate the actualchange in the wage (because of the shift toward entry-level workers). Asa result, estimates of the labor supply elasticity will be biased upward(Boal and Ransom 1997, n. 25).
III. RN Wages and VA Policy
In 1991, the VA went from paying RN wages based on a national scaleto a system that set RN wages based on a local wage survey. This legislatedchange in RN wages at VA hospitals provides an ideal opportunity toexamine whether there is monopsonistic competition in the RN labormarket while avoiding many of the problems of the previous literature.A short panel of data is available for VA and non-VA hospitals withcomplete information on staffing levels, patient caseloads, wages (includ-ing starting wages), and other hospital characteristics. The data can befirst-differenced to control for variation in the cost of living and unmea-sured attributes of hospitals. Finally, no assumptions need to be madeabout exogenous demand shocks, since the legislation generates exogenouschanges in wages at VA hospitals, and these changes can in turn be usedto construct instruments for wage changes at competing non-VA hospitals.
Prior to 1991, the VA set RN wages in all of its hospitals according toa national pay scale, with only minor adjustments to wages in hospitalsin high-wage markets. This policy seriously affected the VA’s ability torecruit and retain RNs for two reasons. First, VA wages tended to lagbehind the market throughout the 1980s as real wages of RNs rose rapidly(Buerhaus and Staiger 1996). More important, this policy caused VA wagesto diverge from those of local labor markets, because nurse wages varywidely across regions. VA hospitals could respond somewhat to marketconditions by obtaining waivers for wage increases from the VA centraloffice. Although the waiver system improved the ability of VA hospitals

216 Staiger et al.
to match market wages, the waivers were constrained by VA budgets andwere often granted after local wages had risen further. For example, basedon data from 1990 (see Sec. V below), starting RN wages in Milwaukee—a relatively low-wage market—averaged $11.20 per hour at non-VA hos-pitals, while the VA starting wage was competitive at $11.65 per hour.However, in San Francisco—a relatively high-wage market—the VA wagelagged well behind the market, with non-VA hospitals paying an averagehourly wage of $16.30 and local VA hospitals paying only $14.00.
The VA sought to remedy this problem with the passage of the NursePay Act of 1990, which changed how the VA set wages for RNs, effectiveApril 7, 1991 (Department of Veterans Affairs 1991). This law tied RNwages at each VA hospital to those that prevailed in its local labor market,with market wages determined by an annual survey of other hospitals ineach VA hospital’s region.3 As a result, wage scales of RNs were im-mediately raised to match the market in the roughly two-thirds of VAhospitals that had been paying below the prevailing market wage.4 At theremaining VA hospitals that were paying above-market wages, wages wereheld constant in nominal terms until they came in line with the prevailingmarket wage. Thus the law generated an exogenous change in RN wagesat VA hospitals, with the magnitude of the wage change varying acrosshospitals.
The local wage surveys determined wages in four broad pay grades(defined by qualifications and experience), so that entry wages and wagesof more experienced RNs were affected differently. The VA reported thatwages increased more for entry-level RNs following the Nurse Pay Act,leading to pay compression within the VA (U.S. General AccountingOffice 1992). Our data were restricted to entry-level wages and thereforemay overstate the wage change at the VA (in contrast to the usual approachof using average wages, which tends to understate the wage change).
In addition to mandating wage changes, the Nurse Pay Act of 1990provided each VA hospital with additional funds in its budget to financeits increased wage bills (including any new hires to fill existing vacancies)without reducing other expenditures. As a result, individual VA hospitalsthat had their wages raised by the act were free to hire additional RNsup to previously determined staffing needs, with the costs being passedon to the central office. During the study period, staffing needs were well
3 The local market for each VA hospital was defined as the Consolidated Met-ropolitan Statistical Area (CMSA) or Metropolitan Statistical Area (MSA) in whichthe VA hospital was located. The 27 VA hospitals in rural areas were allowed todetermine their local competitors within reasonable limits. If there were 15 orfewer non-VA hospitals in the local market, all hospitals were surveyed. If therewere more than 15 other hospitals, the survey was based on a sample of the otherhospitals.
4 These figures are computed from the data discussed below.

Monopsony in the Labor Market 217
above pre–Nurse Pay Act staffing levels for nearly all VA hospitals. Staff-ing needs (and the associated budget) for each VA hospital were allocatedto units based on workload (inpatient plus outpatient visits, adjusted forthe types of visits), and there was limited ability within units to substitutelower-skilled personnel (e.g., aides) for RNs. Thus, each unit was allocateda fixed number of nursing full-time equivalents (FTEs), and there waslittle discretion. Because RN wages at the VA hospitals were below wagesat other hospitals (particularly in high-wage areas), the VA hospitals haddifficulty filling these positions, resulting in high vacancy rates prior tothe Nurse Pay Act (U.S. General Accounting Office 1992).
In summary, the Nurse Pay Act of 1990 provides a unique opportunityto examine the extent of monopsony power in the nurse labor market.We can estimate the elasticity of supply of RNs to individual hospitalsbased on a legislated change in the wage, unrelated to changes in supplyshocks, at VA hospitals in which labor demand was not binding. More-over, we can learn to what extent hospitals have wage-setting power byobserving whether non-VA hospitals adjusted their wages in response tothe change in VA wages.
IV. Theoretical Model
Consider a general model of monopsony in which firms face a laborsupply curve that is upward sloping in their own wage and downwardsloping in the wage of competitors:
�L �Li iL p f(w , w , … , w ), where 1 0, ! 0 for i ( j, i p 0, … , k.i 1 2 k�w �wi j
(1)
A profit-maximizing firm will set wages to maximize ,R(L ) � L # wi i i
where is the firm’s revenue function, is the firm’s employment,R(.) Li
and is the firm’s wage. The first-order condition for this problemwi
implies:
MRP � w�1p � , (2)
w
where MRP is the marginal revenue product of labor and is the own-e
wage elasticity of labor supply. Thus, the own-wage elasticity of laborsupply is the key to measuring monopsony power and summarizes theextent to which a firm may reduce wages below MRP.
To guide our empirical work, we consider a simplified version of equa-tion (1). Our model is an application of Salop’s (1979) model of com-petition around a circle. We assume RNs are distributed uniformly arounda circle, and they choose to work at one of N hospitals. Given our focus

218 Staiger et al.
on short-run labor supply, we ignore the issue of hospital entry and exitand treat N as fixed.5 Hospitals are located equidistantly around the circle,with the distance between hospitals (and the number of nurses locatedbetween hospitals) equal to a. A nurse located between two hospitals willchoose to work at the hospital at which the wage, net of travel costs, ishighest. Letting t represent the travel costs per unit distance, it is straight-forward to derive the labor supply facing a given hospital as a functionof its own wage and the wage of its nearest competitors:
1 w � wi�1 i�1L p a � w � , i p 1, … , N, (3)i i( )t 2
where and are wages at the two adjacent hospitals. Thus, thew wi�1 i�1
simple structure of competition along a circle yields a labor supply equa-tion that depends only on the gap between a hospital’s wage and theaverage wage of its two nearest competitors. Total labor supply to themarket is assumed fixed (e.g., a doubling of all wages does not affect thelabor supply to any individual hospital).
Wages at the VA are set exogenously by federal policy, but wages atall other hospitals are assumed to be set endogenously. If the marginalbenefit to a hospital of employing a nurse is b, we assume that hospitalsset wages to maximize the total net benefits derived from RNs; that is,they choose w to maximize . The first-order condition for thisL(b � w)maximization problem provides the wage-setting equation (i.e., labor de-mand) for the model:
w p b � tL . (4)i i
Thus, wages are set below MRP, and the size of the wage markdowndepends on the slope of the labor supply equation (3).
Equations (3) and (4) provide the structural equations for the model.The labor supply equation (3) cannot be estimated by ordinary leastsquares (OLS), since wages are set endogenously according to equation(4). Estimation of the labor supply equation requires valid instruments—that is, variables that are correlated with wages but not correlated withthe error in the labor supply equation (a). If one hospital in the market(the VA hospital) sets the wage independently of a, then that wage canserve as an instrument since it will affect the wages at all other hospitalsin the market.
It is relatively straightforward to solve this model of competition on acircle and derive the reduced-form equation for each hospital’s equilib-rium wage. Note that this reduced-form equation is important in that it
5 The 1992 American Hospital Association survey discussed below has about1% fewer observations than the 1990 data. Thus, the assumption that the numberof hospitals is constant does not seem overly restrictive.

Monopsony in the Labor Market 219
serves as the first-stage equation in estimating labor supply. In the standardmodel of competition on a circle, all hospitals would be identical, and thesolution would be a symmetric wage equilibrium with . Ourw* p b � at
model is not symmetric, since the VA hospital differs from all non-VAhospitals in that its wage is set exogenously. Therefore, the equilibriumis asymmetric with equilibrium wages at non-VA hospitals depending onthe distance between each hospital and the VA hospital. Distance (d) ismeasured by the number of hospitals located between a given hospitaland the VA hospital (e.g., for the two hospitals located adjacentd p 0to the VA hospital).
If there is only one VA hospital setting wages exogenously in eachmarket, then (after some algebra) equilibrium wages at non-VA hospitalscan be shown to be a weighted average of the VA wage ( ) and theVAwsymmetric equilibrium wage ( ):w*
VAw p (1 � v )w* � vw . (5)i i i
The weight placed on the VA wage ( ) captures the effect of the VA wagevi
on wages at non-VA hospitals and depends only on the number of hos-pitals (N) in the market and each hospital’s distance from the VA (d). Itis straightforward to derive three useful properties of in this model.vi
First, is between 0 and 1/2, which implies that non-VA hospitals willvi
respond partially to VA wage changes. Furthermore, decreases withvi
distance from the VA hospital ( ), as one would expect if hospitals�v /�d ! 0i
are differentiated by location. Finally, decreases with the number ofvi
competitors on the circle ( ), suggesting that non-VA hospitals�v /�N ! 0i
will respond less to VA wage changes when the VA has a smaller shareof the market.
This simple model of the RN labor market is useful for two reasons.First, the model has empirical implications. Structural labor supply to aparticular hospital depends only on the wage gap between a given hospitaland its nearest neighbors, increasing with the wage paid by that hospitaland decreasing with the wage paid by nearby hospitals. Furthermore,wages at non-VA hospitals are positively related to VA wage changes,with the strongest effect of VA wages at hospitals located near the VAand with few competitors. The second reason that the model is useful isthat it demonstrates how changes in VA wages can be used to identifythe labor supply equation. Changes in VA wages provide a natural in-strument for identifying the labor supply equation, since these changesare arguably exogenous and affect wages at all hospitals either directly(at VA hospitals) or indirectly (at non-VA hospitals through eq. [5]).
V. Data
The data used in this study are obtained from several publicly availablesources and from the VA’s records. The unit of observation for our anal-

220 Staiger et al.
ysis is a hospital. Our primary sources of information about nurse wagesand employment in non-VA hospitals are the American Hospital Asso-ciation (AHA) Nursing Personnel Surveys (NPS) of 1990 and 1992. Thus,we have 1 year of data prior to the Nurse Pay Act (1990) and 1 year ofdata that was entirely postimplementation (1992). Unfortunately, data arenot available from the NPS after 1992.
The 1990 NPS surveyed all hospitals in the United States, while the1992 data are limited to nonfederal facilities. This survey collects detailedinformation about RN employment and wages, along with a wide varietyof additional information such as budgeted positions, the mix of nursingstaff (RNs, licensed practical nurses, etc.), tenure, education, vacancy andturnover rates, work schedules, collective bargaining, and temporary andforeign nurse utilization. The NPS was used to obtain wages for non-VAhospitals, to calculate market wages faced by all hospitals, and to providebackground information about each hospital. In 1992, less than half ofthe hospitals surveyed responded to questions about wages and employ-ment levels, limiting our sample size significantly.
The AHA Annual Survey of Hospitals provides additional data onhospital characteristics for VA and non-VA facilities and is available in1990 and 1992 for most hospitals in the United States. These surveysinclude a wide range of information about general hospital characteristicsand provided us with information on hospital location. The AHA surveyalso includes some data about nurse staffing, which were used to checkthe validity of the NPS.
The VA Personnel and Accounting Integrated Data (PAID) system,salary surveys conducted for the locality pay system, and published VAdata on employment levels of nurses provide most of our information onVA hospitals, since federal hospitals did not respond to the NPS in 1992.The VA’s Centralized Accounting for Local Management (CALM) system830 file contains facility-level information on the aggregate number ofRNs on staff (FTE) and their average salary. The VA PAID system datafile is used to measure starting wages for RNs at VA hospitals. The per-sonnel office at the VA’s central office provided copies of the Nurse PayAct RN pay schedules for each VA medical center and copies of the wagesurveys. These provide additional data on the changes in RN wages atVA hospitals and wages at hospitals that compete with the VA hospitals.We also used these data to check the accuracy of the NPS data in 1990.
Cross-checks of the different data reveal little inconsistency in ourmeasures of wages, employment levels, and hospital characteristics. Thisalleviates any concern arising from the fact that the NPS and AHA dataare based on hospital responses to surveys. Similarly, the VA accountingdata should be of high quality, since they are from an internal accountingsystem instead of survey responses. While it is likely that some mea-

Monopsony in the Labor Market 221
surement error exists in our data, we do not believe that it is sufficientlylarge to bias the results of this study.
The employment of RNs is measured as the FTE employment of RNsin each hospital for which we have data. Wages are the lowest hourlywage reported by the hospital. We selected the lowest hourly wage forour wage measure for two reasons. First, the lowest wage will apply toentry-level nurses with basic education and no experience. Thus, changesin this wage measure will not be biased by differences across hospitals orover time in average RN characteristics such as tenure or experience.Second, one might argue that labor supply is particularly sensitive toentry-level wages, because hospitals often offer nonpecuniary benefits toretain more senior RNs, such as more choice of shifts.
Based on the latitude and longitude centroid for the zip code of eachhospital, we calculated the distance from each hospital to the nearest VAhospital. Our final sample is limited to hospitals that are within 60 milesof a VA hospital, and our empirical work distinguishes hospitals that aremore than 15 miles and more than 30 miles from a VA hospital.6 Similarly,for each hospital we calculated the number of other short-term generalhospitals (from the AHA Annual Survey of Hospitals) within a 15-mileradius. Finally, we used similar distance calculations to identify the twonearest competitors for each hospital. The wage at each hospital’s twonearest competitors is defined as the average log wage of the two hospitalsnearest to the hospital in question that report wages in both 1990 and1992.
To some extent, each VA may have had some influence over the wagechange it experienced between 1990 and 1992 through discretion overwhich hospitals to include in the wage survey. This would raise doubtabout the exogeneity of the VA wage changes. An alternative measure ofthe change imposed on VA hospitals by the Nurse Pay Act is the gapbetween market wages and VA wages in 1990, prior to the Nurse PayAct’s implementation. This 1990 wage gap is not influenced by the VA’sactions following the act, yet it will measure the impact that the NursePay Act should have had on a VA hospital’s wages.
For each VA hospital, we calculated the gap between the VA wage andits market’s wage in 1990 as the difference between the average log wagein each VA hospital’s market area (weighted by hospital beds) and theVA log wage. The VA market area is defined as either the ConsolidatedMetropolitan Statistical Area (CMSA) or the Metropolitan Statistical Area(MSA; if a CMSA does not exist); for rural hospitals, the market areaincludes all other rural hospitals in the state. As can be seen in figure 1,the difference between the market wage and the VA wage in 1990 was astrong predictor of the change in the VA wage from 1990 to 1992. Finally,
6 Our results are not sensitive to the 60-mile limit in our sample.

222 Staiger et al.
Fig. 1.—Difference between the market wage and the VA wage in 1990 and its associationwith the change in the VA wage from 1990 to 1992. Each point represents data for a singleVA hospital in our sample, with the simple regression line for these data also displayed.
to control for differences in the cost of living and local labor marketconditions, we construct dummy variables for the CMSA/MSA in whicheach hospital is located and, for rural hospitals, dummy variables for theremainder of the state.
Table 1 presents selected summary statistics for all hospitals, for VAhospitals, and for non-VA hospitals. In 1990, just under 60% of VAhospitals paid wages that were below market, with the average VA hospitalpaying 1.9% below market. There was considerable variation in the wagegap across VA hospitals. The Nurse Pay Act brought VA wages up tothe market level in 1992. As a result, VA wages increased more between1990 and 1992 (12.5%) than did wages at non-VA hospitals (9.9%), andthe variation in wage growth was larger at VA hospitals as well. Growthin employment also was more rapid at VA hospitals, with RN FTEsincreasing by 8.3% as compared to 5.6% in non-VA hospitals. Thus, VAwages increased by 2.6% more than non-VA wages following the NursePay Act, and VA employment increased by 2.7% more than non-VAemployment. These estimates suggest a labor supply elasticity of around1, although the standard error on this simple Wald estimate is over 0.7.
The remaining variables in table 1 describe the ownership and locationof the hospitals in our sample. Just over 10% of the sample is VA hospitals.Non-VA hospitals are, on average, 23 miles from the nearest VA, with

Monopsony in the Labor Market 223
Table 1Summary Statistics for RN Wages and Employment, 1990–92
All VA Non-VA
Wage gap at nearest VA in 1990 (log (market)wage) � log (VA wage) .013
(.081).019
(.079).012
(.081)Nearest VA wage below market in 1990? 53.0% 58.7% 50.0%Change in log wage (1990–92) .102
(.073).125
(.088).099
(.070)Change in log wage (1990–92) at nearest VA .122
(.093).125
(.088).122
(.094)Change in average log wage (1990–92) at two
nearest competitors .102(.056)
.101(.058)
.102(.056)
Change in RN full-time equivalents (1990–92) .059(.212)
.083(.088)
.056(.223)
VA hospital? 11.6% 100% 0%Distance to nearest VA (miles) 20.3
(18.2)0
(0)23.0
(17.7)More than 15 miles to nearest VA? 50.4% 0% 57.0%More than 30 miles to nearest VA? 30.4% 0% 34.4%No. of hospitals within 15 miles 11.6
(17.3)10.9
(15.6)11.7
(17.5)No. of observations in sample 1,334 155 1,179
Note.—Values are means, and standard deviations are in parentheses.
over half of the sample more than 15 miles from the nearest VA and aboutone-third more than 30 miles. On average, both VA and non-VA hospitalshave more than 10 competitors within a 15-mile radius, although thereis significant variation in the number of competitors.
VI. Empirical Analysis
A. Reduced-Form Wage Equations for Non-VA Hospitals
We examine the effect of the VA’s wage changes on wages at otherhospitals by estimating the reduced-form wage equation (5) in differencedform:
VA VAD(ln w ) p a � a D(ln w ) � a D15 D(ln w )i 0 1 i 2 i i
VA� a D30 D(ln w ) � � , (6)3 i i i
where is the wage at a non-VA hospital, is the wage at the nearestVAw wi i
VA hospital to hospital i, and and are dummy variables thatD15 D30i i
equal 1 if hospital i is more than 15 miles or more than 30 miles, re-spectively, from a VA hospital. We take the difference of each variablebetween 1990 and 1992 to control for hospital characteristics that areconstant over time. As discussed above, we expect and ;a 1 0 a , a ! 01 2 3
that is, the change in the VA wage should have a positive effect on thewage change in other hospitals, but this effect should decline in magnitudeas hospitals are farther from the VA hospital.
224 Staiger et al.
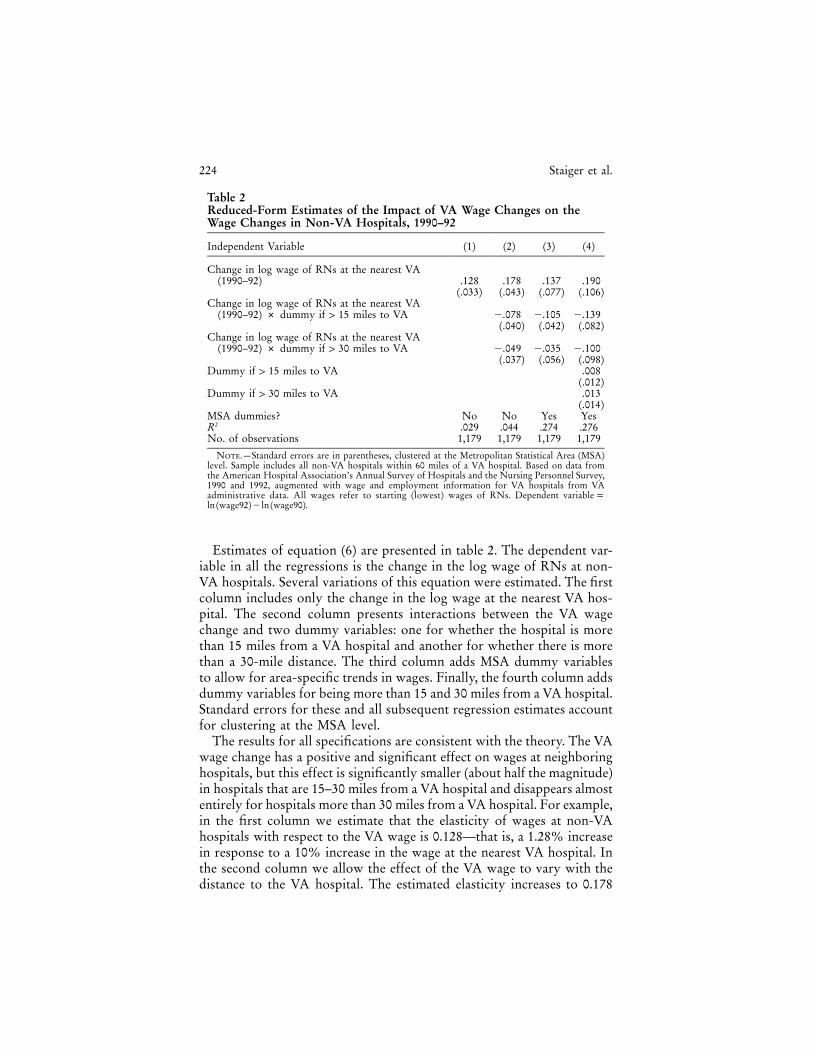
Table 2Reduced-Form Estimates of the Impact of VA Wage Changes on theWage Changes in Non-VA Hospitals, 1990–92
Independent Variable (1) (2) (3) (4)
Change in log wage of RNs at the nearest VA(1990–92) .128
(.033).178
(.043).137
(.077).190
(.106)Change in log wage of RNs at the nearest VA
(1990–92) # dummy if 1 15 miles to VA �.078(.040)
�.105(.042)
�.139(.082)
Change in log wage of RNs at the nearest VA(1990–92) # dummy if 1 30 miles to VA �.049
(.037)�.035(.056)
�.100(.098)
Dummy if 1 15 miles to VA .008(.012)
Dummy if 1 30 miles to VA .013(.014)
MSA dummies? No No Yes YesR2 .029 .044 .274 .276No. of observations 1,179 1,179 1,179 1,179
Note.—Standard errors are in parentheses, clustered at the Metropolitan Statistical Area (MSA)level. Sample includes all non-VA hospitals within 60 miles of a VA hospital. Based on data fromthe American Hospital Association’s Annual Survey of Hospitals and the Nursing Personnel Survey,1990 and 1992, augmented with wage and employment information for VA hospitals from VAadministrative data. All wages refer to starting (lowest) wages of RNs. Dependent variable p
.ln (wage92)� ln (wage90)
Estimates of equation (6) are presented in table 2. The dependent var-iable in all the regressions is the change in the log wage of RNs at non-VA hospitals. Several variations of this equation were estimated. The firstcolumn includes only the change in the log wage at the nearest VA hos-pital. The second column presents interactions between the VA wagechange and two dummy variables: one for whether the hospital is morethan 15 miles from a VA hospital and another for whether there is morethan a 30-mile distance. The third column adds MSA dummy variablesto allow for area-specific trends in wages. Finally, the fourth column addsdummy variables for being more than 15 and 30 miles from a VA hospital.Standard errors for these and all subsequent regression estimates accountfor clustering at the MSA level.
The results for all specifications are consistent with the theory. The VAwage change has a positive and significant effect on wages at neighboringhospitals, but this effect is significantly smaller (about half the magnitude)in hospitals that are 15–30 miles from a VA hospital and disappears almostentirely for hospitals more than 30 miles from a VA hospital. For example,in the first column we estimate that the elasticity of wages at non-VAhospitals with respect to the VA wage is 0.128—that is, a 1.28% increasein response to a 10% increase in the wage at the nearest VA hospital. Inthe second column we allow the effect of the VA wage to vary with thedistance to the VA hospital. The estimated elasticity increases to 0.178

Monopsony in the Labor Market 225
Table 3Reduced-Form Estimates of the Impact of the VA Wage Gap in 1990 onthe Wage Changes in VA and Non-VA Hospitals, 1990–92
Independent Variables
VAOnly
(1)
Non-VAOnly
(2)
Non-VAOnly
(3)
Non-VAOnly
(4)
Non-VAOnly
(5)
Wage gap at nearest VA in1990 (log (market wage) �
)log (VA wage) .830(.055)
.090(.034)
.161(.061)
.345(.067)
.344(.065)
Wage gap at nearest VA in1990 # dummy if 1 15miles to VA �.109
(.075)�.154
(.072)�.146(.071)
Wage gap at nearest VA in1990 # dummy if 1 30miles to VA �.033
(.064)�.112
(.091)�.120(.091)
Dummy if 1 15 miles to VA �.008(.006)
Dummy if 1 30 miles to VA .000(.008)
MSA dummies? No No No Yes YesR2 .559 .011 .017 .281 .282No. of observations 155 1,179 1,179 1,179 1,179
Note.—Standard errors are in parentheses, clustered at the Metropolitan Statistical Area (MSA)level. Sample includes all non-VA hospitals within 60 miles of a VA hospital. Based on data from theAmerican Hospital Association’s Annual Survey of Hospitals and the Nursing Personnel Survey, 1990and 1992, augmented with wage and employment information for VA hospitals from VA administrativedata. All wages refer to starting (lowest) wages of RNs. The market wage is calculated as the averagestarting wage in 1990 among hospitals in each VA hospital’s market. The market wage is a weightedaverage, using the number of hospital beds as weights. Markets are Consolidated Metropolitan StatisticalAreas (CMSAs), MSAs for hospitals not in a CMSA, and states for hospitals not in an MSA or CMSA.
.Dependent variable p ln (wage92)� ln (wage90)
for hospitals within 15 miles of a VA hospital (the reference group) butis significantly lower for hospitals 15–30 miles from the VA (0.100) andlower still for hospitals more than 30 miles from the VA (0.051).7 Resultsfor the remaining specifications are quite similar.
Changes in the VA wage were not entirely determined by the law sinceVA hospitals had some discretion in determining which hospitals to surveyin setting 1992 wages. Thus, some of the positive correlation between VAwage growth and wage growth at nearby hospitals may reflect the VA’sresponse to wages at other hospitals. The gap between the market wageand the VA wage in 1990 is used in table 3 as a proxy that predicts thewage growth that resulted from the Nurse Pay Act. This wage gap in1990 is not influenced by the VA’s later actions. The first column of table3 estimates the relationship between this proxy and actual wage growthbetween 1990 and 1992 at the VA hospitals. There is a very strong re-
7 Note that eq. (6) is specified so that the effects are cumulative; e.g., the effectof the VA wage on wages at hospitals more than 30 miles away is 0.178 �
.0.078 � 0.049 p 0.051
226 Staiger et al.
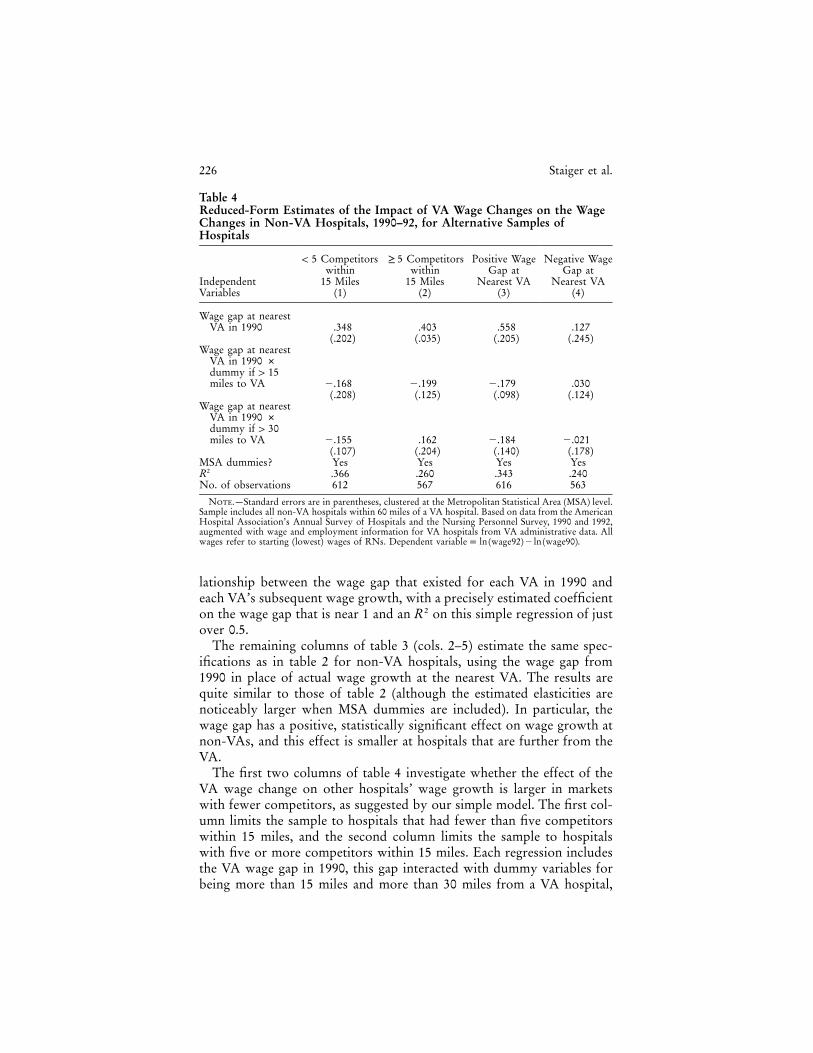
Table 4Reduced-Form Estimates of the Impact of VA Wage Changes on the WageChanges in Non-VA Hospitals, 1990–92, for Alternative Samples ofHospitals
IndependentVariables
! 5 Competitorswithin
15 Miles(1)
≥ 5 Competitorswithin
15 Miles(2)
Positive WageGap at
Nearest VA(3)
Negative WageGap at
Nearest VA(4)
Wage gap at nearestVA in 1990 .348
(.202).403
(.035).558
(.205).127
(.245)Wage gap at nearest
VA in 1990 #dummy if 1 15miles to VA �.168
(.208)�.199(.125)
�.179(.098)
.030(.124)
Wage gap at nearestVA in 1990 #dummy if 1 30miles to VA �.155
(.107).162
(.204)�.184(.140)
�.021(.178)
MSA dummies? Yes Yes Yes YesR2 .366 .260 .343 .240No. of observations 612 567 616 563
Note.—Standard errors are in parentheses, clustered at the Metropolitan Statistical Area (MSA) level.Sample includes all non-VA hospitals within 60 miles of a VA hospital. Based on data from the AmericanHospital Association’s Annual Survey of Hospitals and the Nursing Personnel Survey, 1990 and 1992,augmented with wage and employment information for VA hospitals from VA administrative data. Allwages refer to starting (lowest) wages of RNs. .Dependent variable p ln (wage92)� ln (wage90)
lationship between the wage gap that existed for each VA in 1990 andeach VA’s subsequent wage growth, with a precisely estimated coefficienton the wage gap that is near 1 and an on this simple regression of just2Rover 0.5.
The remaining columns of table 3 (cols. 2–5) estimate the same spec-ifications as in table 2 for non-VA hospitals, using the wage gap from1990 in place of actual wage growth at the nearest VA. The results arequite similar to those of table 2 (although the estimated elasticities arenoticeably larger when MSA dummies are included). In particular, thewage gap has a positive, statistically significant effect on wage growth atnon-VAs, and this effect is smaller at hospitals that are further from theVA.
The first two columns of table 4 investigate whether the effect of theVA wage change on other hospitals’ wage growth is larger in marketswith fewer competitors, as suggested by our simple model. The first col-umn limits the sample to hospitals that had fewer than five competitorswithin 15 miles, and the second column limits the sample to hospitalswith five or more competitors within 15 miles. Each regression includesthe VA wage gap in 1990, this gap interacted with dummy variables forbeing more than 15 miles and more than 30 miles from a VA hospital,

Monopsony in the Labor Market 227
and MSA dummy variables. The point estimates indicate that changes inthe VA wage has similar effects on hospitals in competitive markets tothose in less competitive markets. These results provide no evidence thata wage change at an individual hospital is less important when there aremore hospitals in the market. However, the standard errors on theseestimates are quite large, so the power of this test is obviously low.
When the VA implemented the Nurse Pay Act, it did not change nom-inal wages at hospitals that paid higher wages than the market. Thus, weshould not observe a response by non-VA hospitals to the 1990 VA wagegap if the gap is negative because the negative gap was not correlated withthe actual wage change at the VA. Columns 3 and 4 of table 4 examinethis possibility. Column 3 presents the coefficients of an equation fornon-VA hospitals with a positive wage gap at the nearest VA hospital(i.e., the VA wage is lower than the market wage). As expected, the VAwage change has a large, statistically significant effect on non-VA hos-pitals’ wages. Column 4 presents the same equation for hospitals for whichthe VA wage gap is negative. Where the VA medical center paid morethan the market and thus did not change its wages with the Nurse PayAct, the VA wage gap has no effect on the wages of other hospitals.
B. Labor Supply Equations for All Hospitals
We estimate the labor supply equation (3) in a first-difference form tomeasure the elasticity of supply of RNs:
D(ln L ) p v � v D(ln w � ln w ) � m , (7)i 0 1 i j i
where is the number of RN FTEs employed at hospital i (for VALi
hospitals and other hospitals), is the wage at hospital i, is thew ln wi j
average log wage at hospital i’s two nearest competitors, and is thev1
elasticity of supply of RNs to an individual hospital. We found evidenceof heteroskedasticity in the error and therefore weight all regressions bythe number of beds at the hospital in 1990.
As discussed earlier, OLS estimates of equation (7) are biased. We es-timate equation (7) using two-stage least squares. The VA wage changemandated by the Nurse Pay Act provides the instrument for the changein the log wage gap . We take care in specifying the first-D(ln w � ln w )i j
stage equation. According to theory, the impact of the VA wage changeon depends on whether the hospital and its nearest neigh-D(ln w � ln w )i j
bors are VA hospitals and, if not, which VA hospital the hospital is closestto and how far it is from that VA hospital. The estimates in tables 2–4

228 Staiger et al.
Table 5Two-Stage Least Squares Estimates of RN Labor Supply Elasticities
Independent Variables (1) (2) (3) (4) (5) (6)
Change in the log wage gapbetween hospital and its twonearest competitors .076
(.137).080
(.133).016
(.177).185
(.138).185
(.135).127
(.185)Dummy if VA hospital .023
(.014).019
(.014)MSA dummies? No No Yes No No Yes“FAR” instruments included? No Yes Yes No Yes Yes“GAP” instruments used? No No No Yes Yes Yesp-value for test of the over-
identifying restrictions .71 .45 .31 .20 .20 .12No. of observations 1,334 1,334 1,334 1,334 1,334 1,334
Note.—Standard errors are in parentheses, clustered at the Metropolitan Statistical Area (MSA)level. Sample includes all non-VA hospitals within 60 miles of a VA hospital. All regressions areweighted by the number of hospital beds in 1990. All wages refer to starting (lowest) wages of RNs.Change in the log wage gap between a hospital and its two nearest competitors is defined as
, where compwage90 and comp-[ln(wage92)� ln (wage90)]� [ln(compwage92)� ln (compwage90)]wage 92 are as defined in table A1. Specifications with “FAR” instruments use first-stage regres-sions given in cols. 2, 3, 5, and 6 of table A1. Specifications using “GAP” instruments use first-stageregressions given in cols. 4–6 of table A1. Dependent variable p ln (RN FTEs, 1992)� ln (RN
.FTEs, 1990)
suggest that the wage growth in any given hospital should be specifiedas:
VAD ln w p p � DVA (p � p D ln w ) � (1 � DVA )i 0 i 1 2 i i
VA VA VA# (p D ln w � p D15 � p D30 � p D15D ln w � p D30p ln w ),3 i 4 5 6 i 7 i
(8)
where DVA is an indicator for being a VA hospital. In the first-stageequation, we wish to estimate the difference in wage growth between ahospital and its two nearest neighbors. Therefore, the appropriate spec-ification for the first stage includes the differences between the hospitaland each of its two nearest neighbors. Table A1 in the appendix providesestimates of the first-stage equations for various specifications. The co-efficients are generally as expected, and F-tests indicate that the instru-ments are strongly correlated with the change in the wage gap.
Estimates of labor supply elasticities from two-stage least squares es-timates of equation (7) are given in table 5. The first three columns con-struct the instruments using the actual wage change at the VA. The firstspecification does not include the instruments that rely on distance froma VA hospital, while the second specification adds these instruments.Column 3 adds MSA dummies and a dummy for being a VA hospital tothe supply equation. The MSA dummies capture local factors (such asalternative wages) that may influence supply, while the VA dummy cap-tures any common change at the VA hospital that may have made em-

Monopsony in the Labor Market 229
Table 6Two-Stage Least Squares Estimates of RN Labor Supply ElasticitiesAllowing Separate Effects of Own Wage and Competitor’s Wage
Independent Variables (1) (2) (3) (4) (5) (6)
Change in own log wage .083(.128)
.120(.124)
.046(.182)
.199(.128)
.232(.127)
.183(.213)
Change in log wage at twonearest competitors �.006
(.261)�.048(.244)
.074(.453)
�.116(.292)
�.061(.281)
�.028(.393)
Dummy if VA hospital .023(.015)
.017(.014)
MSA dummies? No No Yes No No Yes“FAR” instruments included? No Yes Yes No Yes Yes“GAP” instruments used? No No No Yes Yes Yesp-value for test of the over-
identifying restrictions .80 .12 .25 .20 .26 .09No. of observations 1,334 1,334 1,334 1,334 1,334 1,334
Note.—Standard errors are in parentheses, clustered at the Metropolitan Statistical Area (MSA)level. Sample includes all non-VA hospitals within 60 miles of a VA hospital. All regressions areweighted by the number of hospital beds in 1990. All wages refer to starting (lowest) wages of RNs.Change in log wage at two nearest competitors is , where comp-[ln(compwage92)� ln (compwage90)]wage90 and compwage92 are as defined in table A1. Specifications with “FAR” instruments use thesame instruments as in cols. 2, 3, 5, and 6 of table A1, plus the analogous set of variables for thehospital (e.g., not differenced from the competitor). Specifications using “GAP” instruments use thesame instruments as in cols. 4–6 of table A1, plus the analogous set of variables for the hospital (e.g.,not differenced from the competitor). Dependent variable p ln (RN FTEs, 1992)� ln (RN FTEs,
.1990)
ployment more or less attractive at the VA hospital. The remaining threecolumns of table 5 repeat these specifications but construct the instru-ments using the wage gap at the VA hospital in 1990 as a proxy for theactual VA wage change (for reasons discussed earlier). For all specifica-tions, we tested and could not reject the overidentifying restrictions; there-fore, our instruments appear appropriate for our model.
The labor supply elasticities estimated in table 5 are reasonably con-sistent across specifications. The estimates range from 0 to 0.2, with stan-dard errors of about 0.13 to 0.18. Thus, for the specifications in table 5,we estimate an inelastic short-run labor supply curve facing hospitals.Even the high end of the 95% confidence intervals for the labor supplyelasticity does not go above 0.5. These estimates of labor supply elasticityare an order of magnitude smaller than those estimated by Sullivan (1989)and Hansen (1992).
Table 6 estimates specifications similar to those in table 5 but allowsthe change in the VA’s own wage and the change in the nearest com-petitor’s wage to have separate effects rather than constraining them toenter as a difference.8 If the specifications of table 5 are correct, own wage
8 For the specifications in table 6, we include own-wage growth and wagegrowth at the two nearest competitors separately and instrument for both. Inthose specifications, we add the undifferenced versions of the right-hand-sidevariables in eq. (6) to our instrument list. These added instruments can predict

230 Staiger et al.
Table 7Two-Stage Least Squares Estimates of RN Labor Supply Elasticities forAlternative Samples of Hospitals
IndependentVariables
VAOnly
(1)
Non-VAOnly
(2)
! 5 Hospitalswithin
15 Miles(3)
≥ 5 Hospitalswithin
15 Miles(4)
Positive WageGap at
Nearest VA(5)
Change in the logwage gap betweenhospital and itstwo nearestcompetitors .111
(.114)�.073(.267)
.590(.334)
�.019(.190)
.129(.270)
Dummy if VAhospital �.024
(.024).037
(.016).020
(.021)MSA dummies? No Yes Yes Yes Yes“FAR” instruments
included? Yes Yes Yes Yes Yes“GAP” instruments
used? Yes Yes Yes Yes Yesp-value for test of
the overidentify-ing restrictions .58 .35 .02 .75 .34
No. of observations 155 1,179 685 649 707
Note.—Standard errors are in parentheses, clustered at the Metropolitan Statistical Area (MSA) level.Sample includes all non-VA hospitals within 60 miles of a VA hospital. All regressions are weightedby the number of hospital beds in 1990. All wages refer to starting (lowest) wages of RNs. Change inthe log wage gap between a hospital and its two nearest competitors is defined as [ln(wage92)�
, where compwage90 and compwage92 are as definedln(wage90)]� [ln(compwage92)� ln (compwage90)]in table A1. Specifications with “FAR” instruments use first-stage regressions given in cols. 2, 3, 5, and6 of table A1. Specifications using “GAP” instruments use first-stage regressions given in cols. 4–6 oftable A1. .Dependent variable p ln (RN FTEs, 1992)� ln (RN FTEs, 1990)
and competitor’s wage should enter with opposite-signed coefficients ofthe same magnitude. The coefficients are generally opposite signed, andthe magnitudes are small, with elasticity estimates for these specificationsremaining in the 0–0.2 range. The only exception is for the specificationthat includes MSA dummies and the actual change in the VA wage: forthis specification, the effect of the change in log wage at the two nearestcompetitors is wrong signed and poorly identified.
Table 7 investigates the sensitivity of these estimates when the sampleis restricted to (1) VA hospitals, (2) non-VA hospitals, (3) hospitals withfewer than five competitors within 15 miles, (4) hospitals with five ormore competitors within 15 miles, and (5) hospitals for which the nearestVA had a positive wage gap. The basic conclusions are not particularlysensitive to these sample restrictions. All of the elasticity estimates remainsmall relative to the previous literature. There is more range in the elas-ticity estimates for these specifications (from �0.1 to 0.6), but this might
wage growth at a hospital, whereas the differenced versions can only predict thedifference in wage growth between a hospital and its neighbors.

Monopsony in the Labor Market 231
be expected given the relatively large standard errors for these specifi-cations relative to those reported in table 5.
VII. Discussion
Our analysis provides two pieces of evidence that suggest that hospitalshave market power in the nurse labor market and have monopsony powerin setting wages. First, we find that competing hospitals responded tolegislated wage changes at the VA: a 10% increase in wages at the VA isestimated to have increased wages by 2% at hospitals within 15 miles andby roughly 1% at hospitals 15–30 miles from the VA hospital. Second,we find that the labor supply curve facing an individual hospital is veryinelastic: a 10% increase in wages is estimated to increase labor supplyby between 0% and 2%.
These results contradict much of the recent literature investigating mo-nopsony, which has found little (if any) evidence of monopsony powerin the labor market for nurses. In particular, our estimates of the laborsupply elasticity are an order of magnitude below comparable estimatesin the literature. This raises the question: why is this so?
One key difference between this study and others is in the instrumentsused to identify the supply elasticity. We rely on a legislated change inthe wage at the VA as an instrument. Thus, our identification is similarto recent studies of the minimum wage, which also find that legislatedchanges in wages have small positive effects on employment (Card andKrueger 1995). Moreover, these legislated changes in wages are arguablyideal instruments for this problem because they come close to simulatingthe thought experiment that matters for labor supply: how will an ex-ogenous increase in wages affect the VA’s ability to attract nurses? Theearlier literature used changes in caseload at the hospital as an instrument.As argued earlier, there are reasons to believe that caseload may not bea valid instrument and that the potential bias would be in the directionof overstating supply elasticities. However, it is possible that the VAadjusted nonwage margins (e.g., schedule flexibility) in ways that offsetthe legislated wage increase. If so, our elasticity estimates would be biaseddownward because the observed change in wages overstates the net changein wage plus nonwage compensation.
A second difference is our data. We have relied on starting wage data(rather than average wages), which avoids potential aggregation bias thatmay lead to downward bias in estimating wage changes (and hence anupward bias in estimating the supply elasticity). However, because theNurse Pay Act may have increased starting wages more than other wages,our approach may have an upward bias in estimating wage changes (andhence a downward bias in estimating the supply elasticity). Another dif-ference in our data is that we focus on the difference between a hospital’s
232 Staiger et al.
wages and those of its nearest competitors, while the existing literaturehas generally measured competing wages as average wages at the countyor MSA level. Finally, our estimates rely on data from 1990–92, whileboth Sullivan (1989) and Hansen (1992) use data from the early and mid-1980s, when dramatic changes in hospital reimbursement may have re-sulted in bias. While reimbursement rules were stable in our sample period,RN wages were growing rapidly prior to the Nurse Pay Act (Buerhausand Staiger 1996), and it is possible that labor supply was less responsiveto the current wage because of rapidly changing wages at all hospitals.
Apart from differences in our data and instruments, our focus on VAhospitals may be generating the difference in our findings. Our evidenceof market power may be due to the fact that VA hospitals are highlydifferentiated workplaces (by being a federal employer and serving aunique cohort of patients). The supply of nurses might thus be segmentedaccording to RNs’ preferences for working or not working at VA facilities,reducing the response of labor supply to the change in the VA wage.Bhaskar and To (1999) and Manning (2003) suggest that this type ofdifferentiation might produce monopsony power in other employmentsectors. For example, within the fast-food or high-tech industries, work-places are also highly differentiated in terms of corporate culture andcustomer base. Therefore, our results may be representative of the mo-nopsony power exercised by many employers.
Our estimates of the short-run labor supply elasticity around 0.1 arequite low. If these were long-run elasticity estimates, they would implythat the marginal revenue product (MRP) of RNs was about 10 timestheir wage. However, common sense and most empirical studies (Sullivan1989; Hansen 1992) suggest that long-run elasticities are considerablyhigher than short-run elasticities. Unfortunately, data were unavailable toexamine longer-run supply elasticities.9 However, if we assume that thelong-run elasticity is infinite, then Boal and Ransom (1997) have shownthat the amount of “exploitation”—the difference between MRP and thewage as a fraction of the wage—is given by the short-run inverse elasticityof supply multiplied by , where r is the discount rate. Thus, forr/(1 � r)a discount rate of 5%, our elasticity estimates imply that the MRP ofRNs was about 50% above their wages. This evidence, therefore, suggeststhat hospitals have considerable monopsony power.
9 The last year of the NPS was 1992.

Appendix
Table A1First-Stage Estimates Predicting the Change in the Wage Gap between aHospital and Its Two Nearest Competitors, 1990–92
Independent Variables
Using the Actual Changein the Log Wage
at the Nearest VA
Using the VA Log WageGap in 1990 as
Proxy for Wage Changeat the VA
(1) (2) (3) (4) (5) (6)
Difference betweenhospital and nearestcompetitor in:
(1) Dummy for VAhospital (DVA) �.020
(.007)�.018(.007)
�.017(.010)
.014(.005)
.016(.005)
.022(.008)
(2) Dummy if 1 15 milesfrom VA (D15) .019
(.015).018
(.019).006
(.007).011
(.008)(3) Dummy if 1 30 miles
from VA (D30) .016(.012)
.022(.015)
.015(.006)
.022(.007)
(4) DVA # change inlog wage of RNs atnearest VA .477
(.140).548
(.163).606
(.215).659
(.139).754
(.158).821
(.219)(5) (1 � DVA) #
change in log wage ofRNs at nearest VA .149
(.137).227
(.166).268
(.212).331
(.129).438
(.156).485
(.210)(6) D15 # change in log
wage of RNs atnearest VA �.134
(.091)�.110(.117)
�.123(.096)
�.111(.130)
(7) D30 # change in logwage of RNs atnearest VA �.060
(.093)�.028(.118)
�.048(.080)
�.061(.097)
Difference between hospi-tal and second nearestcompetitor in:
(1) Dummy for VAhospital (DVA) �.050
(.010)�.051(.011)
�.049(.017)
.001(.006)
.000(.006)
.004(.011)
(2) Dummy if 1 15 milesfrom VA (D15) �.003
(.009)�.008(.010)
�.005(.005)
�.016(.006)
(3) Dummy if 1 30 milesfrom VA (D30) �.004
(.013)�.012(.016)
�.004(.007)
�.009(.008)
(4) DVA # change inlog wage of RNs atnearest VA .569
(.082).570
(.080).595
(.121).433
(.100).419
(.104).536
(.152)

234 Staiger et al.
Table A1 (Continued)
Independent Variables
Using the Actual Changein the Log Wage
at the Nearest VA
Using the VA Log WageGap in 1990 as
Proxy for Wage Changeat the VA
(1) (2) (3) (4) (5) (6)
(5) (1 � DVA) #change in log wage ofRNs at nearest VA .108
(.064).112
(.073).126
(.102).007
(.075)�.019(.100)
.107(.137)
(6) D15 # change in logwage of RNs atnearest VA .011
(.055)�.020(.058)
.044(.073)
�.019(.084)
(7) D30 # change in logwage of RNs atnearest VA �.007
(.073).019
(.107)�.011(.081)
.006(.104)
Indicator if hospital is aVA �.010
(.015)�.016(.015)
MSA dummies? No No Yes No No YesR2 .254 .258 .360 .203 .208 .322F-test of instruments
( p-value) 61.70(.000)
33.62(.000)
28.69(.000)
43.36(.000)
20.29(.000)
19.32(.000)
No. of observations 1,334 1,334 1,334 1,334 1,334 1,334
Note.—Standard errors are in parentheses, clustered at the Metropolitan Statistical Area (MSA) level.Sample includes all non-VA hospitals within 60 miles of a VA hospital. All regressions are weighted bythe number of hospital beds in 1990. All wages refer to starting (lowest) wages of RNs. Wages ofcompetitors (compwage92 and compwage90) are the average log wage of the hospital’s two closestcompetitors that report wages in both 1990 and 1992. Cols. 4–6 use the VA log wage gap in 1990( ) in place of the change in the log VA wage in constructing alllog(market wage)� log(VA wage)independent variables. The market wage is constructed as discussed in the note to table 3. Dependent
.variable p [ln(wage92)� ln (wage90)]� [ln(compwage92)� ln (compwage90)]
References
Adamache, Killard W., and Frank A. Sloan. 1982. Unions and hospitals:Some unresolved issues. Journal of Health Economics 1, no. 1:81–108.
Aiken, Linda H. 1982. Nursing in the 1980s: Crises, opportunities, chal-lenges. Philadelphia: Lippincott.
Bhaskar, V., Alan Manning, and Ted To. 2002. Oligopsony and monop-sonistic competition in labor markets. Journal of Economic Perspectives16, no. 2:155–74.
Bhaskar, V., and Ted To. 1999. Minimum wages for Ronald McDonaldmonopsonies: A theory of monopsonistic competition. Economic Jour-nal 109:190–203.
Boal, William M. 1995. Testing for employer monopsony in turn-of-the-century coal mining. RAND Journal of Economics 26, no. 3:519–36.
Boal, William M., and Michael R. Ransom. 1997. Monopsony in the labormarket. Journal of Economic Literature 35, no. 1:86–112.

Monopsony in the Labor Market 235
Bruggink, Thomas H., Keith C. Finan, Eugene B. Gendel, and Jeffrey S.Todd. 1985. Direct and indirect effects of unionization on the wagelevels of nurses: A case study of New Jersey hospitals. Journal of LaborResearch 6:407–16.
Buerhaus, Peter I., and Douglas O. Staiger. 1996. Managed care and thenurse workforce. Journal of the American Medical Association 276:1487–93.
Card, David E., and Alan B. Krueger. 1995. Myth and measurement: Thenew economics of the minimum wage. Princeton, NJ: Princeton Uni-versity Press.
Coulam, Robert, and Gary Gaumer. 1991. Medicare’s Prospective Pay-ment System: A critical appraisal. Health Care Financing Review, 1991,suppl.: S45–S77.
Department of Veterans Affairs. 1991. Locality pay system. Circular 00-91-7, April 1.
Falch, Torberg. 2010. The elasticity of labor supply at the establishmentlevel. Journal of Labor Economics 28, no. 2:237–66.
Feldman, Roger, and Richard Scheffler. 1982. The union impact on hos-pital wages and fringe benefits. Industrial and Labor Relations Review35:196–206.
Friss, Lois. 1994. Nursing studies laid end to end form a circle. Journalof Health Politics Policy and Law 19, no. 3:597–631.
Green, Francis, Stephen Machin, and Alan Manning. 1996. The employersize-wage effect: Can dynamic monopsony provide an explanation?Oxford Economic Papers 48, no. 3:433–55.
Greene, Jan, and Anne M. Nordhaus-Bike. 1998. Nurse shortage: Wherehave all the RNs gone? Hospital and Health Networks, August, 78–80.
Hansen, Korinna K. 1992. The U.S. nursing market and its market struc-ture in the 1980s. PhD diss., University of Rochester.
Hirsch, Barry T., and Edward J. Schumacher. 1995. Monopsony powerand relative wages in the labor market for nurses. Journal of HealthEconomics 14, no. 4:443–76.
———. 2005. Classic or new monopsony? Searching for evidence in nurs-ing labor markets. Journal of Health Economics 24:969–89.
Hurd, Richard W. 1973. Equilibrium vacancies in a labor market domi-nated by non-profit firms: The “shortage” of nurses. Review of Eco-nomics and Statistics 55:234–40.
Link, Charles R., and John H. Landon. 1975. Monopsony and unionpower in the market for nurses. Southern Economic Journal 41:649–56.
Manning, Alan. 2003. Monopsony in motion: Imperfect competition inlabor markets. Princeton, NJ: Princeton University Press.
Matsudaira, Jordan D. 2009. Monopsony in the low-wage labor market?Evidence from minimum nurse staffing regulations. Unpublished man-uscript, Department of Public Policy, Cornell University.

236 Staiger et al.
Ransom, Michael R, and David P. Sims. 2010. Estimating the firm’s laborsupply curve in a “new monopsony” framework: Schoolteachers inMissouri. Journal of Labor Economics 28, no. 2:331–55.
Roberts, Marc, Ann Minnick, Eli Ginsberg, and Connie Curran. 1989.What to do about the nursing shortage. New York: CommonwealthFund.
Robinson, James C. 1988. Market structure, employment, and skill mixin the hospital industry. Southern Economic Journal 55:315–25.
Robinson, Joan. 1933. The economics of imperfect competition. London:St. Martin’s.
Salop, Steven C. 1979. Monopolistic competition with outside goods. BellJournal of Economics 10, no. 1:141–56.
Sullivan, Daniel. 1989. Monopsony power in the market for nurses. Jour-nal of Law and Economics 32:S135–S178.
U.S. General Accounting Office. 1992. VA’s implementation of the NursePay Act of 1990. Washington, DC: U.S. General Accounting Office.
Yett, Donald E. 1975. An economic analysis of the nurse shortage. Lex-ington, MA: Lexington.


![[EM-Sofyan] Monopoly and Monopsony Market](https://static.fdocuments.us/doc/165x107/554f1370b4c905723a8b47c1/em-sofyan-monopoly-and-monopsony-market.jpg)