Is the U.S. Surface Temperature Record Reliable? · PDF file09.02.2009 · Is the...
31
Is the U.S. Surface Temperature Record Reliable? BY ANTHONY WATTS SurfaceStations.org How do we know global warming is a problem if we can’t trust the U.S. temperature record?
Transcript of Is the U.S. Surface Temperature Record Reliable? · PDF file09.02.2009 · Is the...

Is the U.S. Surface Temperature
Record Reliable?
by AnThony WATTS
SurfaceStations.org
How do we know global warming is a problem if we can’t trust the U.S. temperature record?
THE HEARTLAND INSTITUTE19 South LaSalle Street #903Chicago, Illinois 60603www.heartland.org
© 2009 SurfaceStations.org. All rights reserved, including the right to reproduce this report or portions thereof in any form. ISBN 13: 978-1-934791-29-5ISBN 10: 1-934791-26-6
Opinions expressed are solely those of the authors. Nothing in this report should be construed as reflecting the views of The Heartland Institute, or as an attempt to influence pending legislation.
Additional copies of this book are available from The Heartland Institute for the following prices:
1-10 copies $12.99 per copy 11-50 copies $10.99 per copy 51-100 copies $ 8.99 per copy 101 or more $ 6.99 per copy
Please use the following reference to the whole report:
Anthony Watts, Is the U.S. Surface Temperature Record Reliable? Chicago, IL: The Heartland Institute, 2009.
About the Author
Anthony Watts is a 25-year broadcast meteorology veteran and currently chief meteorologist for KPAY-AM radio. He got his start as on-air meteorologist for WLFI-TV in Lafayette, Indiana and at KHSL-TV in Chico, California. In 1987, he founded ItWorks, which supplies broadcast graphics systems to hundreds of cable television, television, and radio stations nationwide. ItWorks supplies custom weather stations, Internet servers, weather graphics content, and broadcast video equipment. In 2007, Watts founded SurfaceStations.org, a Web site devoted to photographing and documenting the quality of weather stations across the U.S.
Acknowledgments
The author thanks Gary Boden, for his extensive work in implementing Excel and Google Earth algorithms, plus quality control; Evan M. Jones, for his untiring assistance in station surveys and quality control checking; Dr. Roger Pielke, Sr., Colorado State University, for his guidance and assistance in providing resources that enabled this project to become a reality; Barry Wise, for his assistance in linking Google Earth to the SurfaceStations.org photo gallery; and the more than 650 volunteers who have tirelessly driven thousands of miles to survey and report stations, with particular thanks to the volunteers who have surveyed 25 or more stations, including Craig Limesand, Eric Gamberg, John Goetz, Don Kostuch, Russell Steele, Kristen Byrnes, and Liz and Don Healey. I also thank Steve McIntyre, who provided a large measure of assistance in collating station data.
Is the U.S. Temperature Record Reliable?By Anthony Watts
SurfaceStations.org
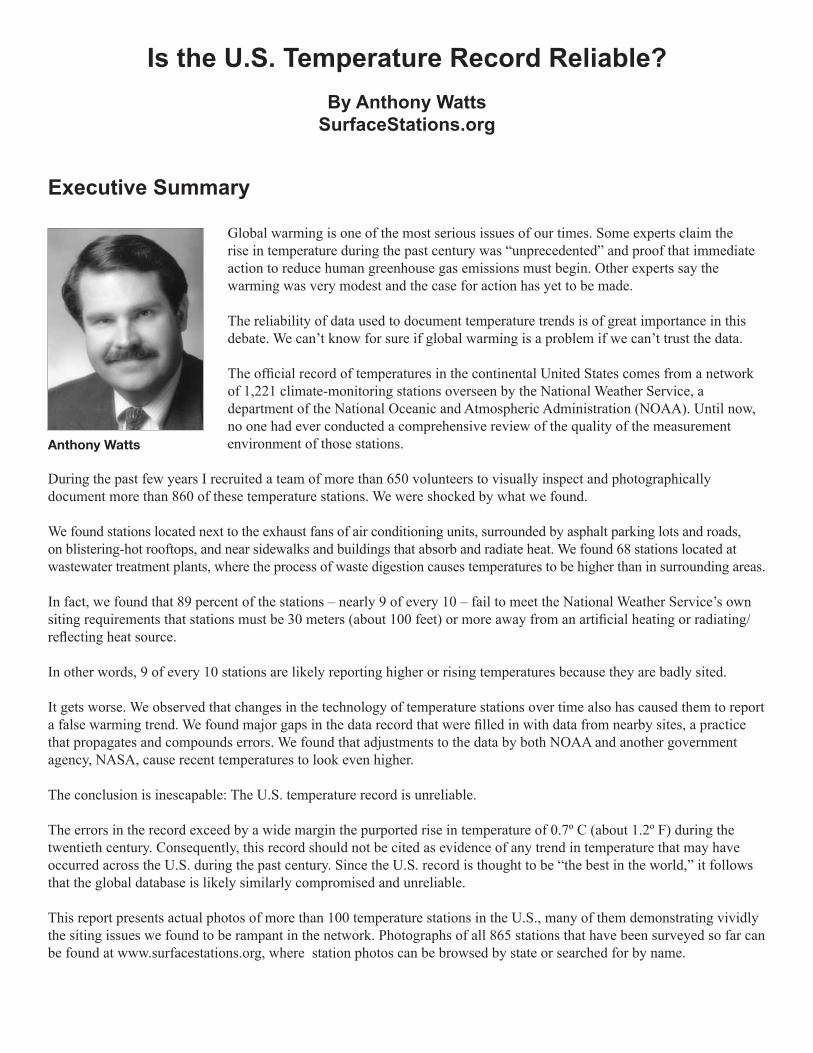
Executive Summary
Global warming is one of the most serious issues of our times. Some experts claim the rise in temperature during the past century was “unprecedented” and proof that immediate action to reduce human greenhouse gas emissions must begin. Other experts say the warming was very modest and the case for action has yet to be made. The reliability of data used to document temperature trends is of great importance in this debate. We can’t know for sure if global warming is a problem if we can’t trust the data. The official record of temperatures in the continental United States comes from a network of 1,221 climate-monitoring stations overseen by the National Weather Service, a department of the National Oceanic and Atmospheric Administration (NOAA). Until now, no one had ever conducted a comprehensive review of the quality of the measurement environment of those stations.
During the past few years I recruited a team of more than 650 volunteers to visually inspect and photographically document more than 860 of these temperature stations. We were shocked by what we found. We found stations located next to the exhaust fans of air conditioning units, surrounded by asphalt parking lots and roads, on blistering-hot rooftops, and near sidewalks and buildings that absorb and radiate heat. We found 68 stations located at wastewater treatment plants, where the process of waste digestion causes temperatures to be higher than in surrounding areas. In fact, we found that 89 percent of the stations – nearly 9 of every 10 – fail to meet the National Weather Service’s own siting requirements that stations must be 30 meters (about 100 feet) or more away from an artificial heating or radiating/reflecting heat source. In other words, 9 of every 10 stations are likely reporting higher or rising temperatures because they are badly sited. It gets worse. We observed that changes in the technology of temperature stations over time also has caused them to report a false warming trend. We found major gaps in the data record that were filled in with data from nearby sites, a practice that propagates and compounds errors. We found that adjustments to the data by both NOAA and another government agency, NASA, cause recent temperatures to look even higher. The conclusion is inescapable: The U.S. temperature record is unreliable. The errors in the record exceed by a wide margin the purported rise in temperature of 0.7º C (about 1.2º F) during the twentieth century. Consequently, this record should not be cited as evidence of any trend in temperature that may have occurred across the U.S. during the past century. Since the U.S. record is thought to be “the best in the world,” it follows that the global database is likely similarly compromised and unreliable. This report presents actual photos of more than 100 temperature stations in the U.S., many of them demonstrating vividly the siting issues we found to be rampant in the network. Photographs of all 865 stations that have been surveyed so far can be found at www.surfacestations.org, where station photos can be browsed by state or searched for by name.
Anthony Watts

2 Is the U.S. Temperature Record Reliable?
Miami, Ariz. .............................................................................. 23Tucson, Ariz. ............................................................................. 27Wickenburg, Ariz. ..................................................................... 28Paso Robles, Calif. .................................................................... 24Yreka, Calif. .............................................................................. 28Fort Morgan, Colo. ................................................................... 20Gunnison, Colo. ........................................................................ 21Grace, Idaho .............................................................................. 21Sandpoint, Idaho ....................................................................... 25Dillon, Mont. .............................................................................. 20Ennis, Mont. .............................................................................. 20Lovelock, Nev. .......................................................................... 22Searchlight, Nev. ....................................................................... 25Santa Rosa, N.M. ...................................................................... 25Tularosa, N.M. ........................................................................... 27Ashland, Ore. ............................................................................ 18Heppner, Ore. ............................................................................ 21Vale, Ore. ................................................................................... 27Panguitch, Utah ........................................................................ 24 Spanish Fork, Utah .................................................................... 25St. George, Utah ........................................................................ 26Thompson, Utah ........................................................................ 26Dayton, Wash. ........................................................................... 19Waterville, Wash. ....................................................................... 28Buffalo Bill Dam, Wyo. ............................................................. 19Worland, Wyo. ........................................................................... 28
Marengo, Ill. .............................................................................. 23Morrison, Ill. ............................................................................. 23Paris, Ill. .................................................................................... 24Brookville, Ind. ......................................................................... 19Mount Vernon, Ind. ................................................................... 23Logan, Iowa ............................................................................... 22Rock Rapids, Iowa ................................................................... 25Atchison, Kan. ........................................................................... 18Fort Scott, Kan. .......................................................................... 20Champion, Mich. ....................................................................... 19Hillsdale, Mich. ......................................................................... 21Midland, Mich. .......................................................................... 23Detroit Lakes, Minn. .................................................................. 20Winnebago, Minn. ..................................................................... 28Lebanon, Mo.............................................................................. 22Neosho, Mo. .............................................................................. 24Hay Springs, Neb. ...................................................................... 21Red Cloud, Neb. ......................................................................... 25Crosby, N.D. .............................................................................. 19Richardton Abbey, N.D. ............................................................ 25Hot Springs, S.D. ....................................................................... 22Kennebec, S.D. .......................................................................... 22Napoleon, Ohio .......................................................................... 23Urbana, Ohio ............................................................................. 27Ardmore, Okla. .......................................................................... 18Okemah, Okla ............................................................................ 24 Milwaukee, Wis. ........................................................................ 23Racine, Wis. ............................................................................... 25Spooner, Wis. ............................................................................. 26
WEST
MIDWEST
EAST
Selected Surface Stations Table of Contents by Region
SOUTHTroy, Ala. ................................................................................... 26 Union Springs, Ala. ................................................................... 27 Brinkley, Ark. ............................................................................ 18Pocahontas, Ark. ....................................................................... 24Bartow, Fla. ............................................................................... 18Titusville, Fla. ............................................................................ 26Gainesville, Ga. ......................................................................... 20Tifton, Ga. ................................................................................. 26 Hopkinsville, Ky. ...................................................................... 22Williamsburg, Ky. ..................................................................... 28Bunkie, La. ................................................................................ 19St. Joseph, La. ........................................................................... 26Monticello, Miss. ....................................................................... 23Woodville, Miss. ........................................................................ 28Hendersonville, N.C. ................................................................. 21Lenoir, N.C. ............................................................................... 22Conway, S.C. ............................................................................. 19Orangeburg, S.C. ....................................................................... 24Clarksville, Tenn. ....................................................................... 19Tullahoma, Tenn. ....................................................................... 27Greenville, Texas ....................................................................... 21Haskell, Texas ............................................................................ 21 Lampasas, Texas ........................................................................ 22Blacksburg, Va. .......................................................................... 18Lexington, Va. ............................................................................ 22
Staunton, Va. .............................................................................. 26Winfield, W. Va. ......................................................................... 28Falls Village, Conn. ................................................................... 20Greenwood, Del. ........................................................................ 21Orono, Maine ............................................................................. 24Baltimore, Md. ........................................................................... 18Salisbury, Md. ............................................................................ 25Amherst, Mass. .......................................................................... 18Durham, N.H. ............................................................................ 20Tuckerton, N.J. .......................................................................... 27Mohonk Lake, N.Y. ................................................................... 23 Troy, N.Y. .................................................................................. 27West Point, N.Y. ........................................................................ 28State College, Pa. ...................................................................... 26Uniontown, Pa. .......................................................................... 27Block Island, R.I. ....................................................................... 18Cornwall, Vt. ............................................................................. 19Enosburg Falls, Vt. .................................................................... 20Northfield, Vt. ........................................................................... 24

Is the U.S. Temperature Record Reliable? 3
Selected Surface Stations Table of Contents by CityAmherst, Mass. .......................................................................... 18Ardmore, Okla. .......................................................................... 18Ashland, Ore. ............................................................................. 18Atchison, Kan. ........................................................................... 18Baltimore, Md. ........................................................................... 18Bartow, Fla. ................................................................................ 18Blacksburg, Va. .......................................................................... 18Block Island, R.I. ....................................................................... 18Brinkley, Ark. ............................................................................ 18
Brookville, Ind. .......................................................................... 19Buffalo Bill Dam, Wyo. ............................................................. 19Bunkie, La. ................................................................................ 19Champion, Mich. ....................................................................... 19Clarksville, Tenn. ....................................................................... 19Conway, S.C. ............................................................................. 19Cornwall, Vt. ............................................................................. 19Crosby, N.D. .............................................................................. 19Dayton, Wash. ............................................................................ 19
Detroit Lakes, Minn. .................................................................. 20Dillon, Mont. ............................................................................. 20Durham, N.H. ............................................................................ 20Ennis, Mont. .............................................................................. 20Enosburg Falls, Vt. ................................................................... 20Falls Village, Conn. ................................................................... 20Fort Morgan, Colo. .................................................................... 20Fort Scott, Kan. ......................................................................... 20Gainesville, Ga. ......................................................................... 20
Grace, Idaho ............................................................................... 21Greenville, Texas ....................................................................... 21Greenwood, Del. ........................................................................ 21Gunnison, Colo. ......................................................................... 21Haskell, Texas ............................................................................ 21Hay Springs, Neb. ...................................................................... 21Hendersonville, N.C. ................................................................. 21Heppner, Ore. ............................................................................. 21Hillsdale, Mich. ......................................................................... 21
Hopkinsville, Ky. ....................................................................... 22Hot Springs, S.D. ....................................................................... 22Kennebec, S.D. .......................................................................... 22Lampasas, Texas ........................................................................ 22Lebanon, Mo. ............................................................................. 22Lenoir, N.C. ............................................................................... 22Lexington, Va. ........................................................................... 22Logan, Iowa ............................................................................... 22Lovelock, Nev. ........................................................................... 22
Marengo, Ill. .............................................................................. 23Miami, Ariz ................................................................................ 23Midland, Mich. .......................................................................... 23Milwaukee, Wis. ........................................................................ 23Mohonk Lake, N.Y. ................................................................... 23Monticello, Miss. ....................................................................... 23 Morrison, Ill. .............................................................................. 23Mount Vernon, Ind. .................................................................... 23Napoleon, Ohio .......................................................................... 23
Neosho, Mo. .............................................................................. 24Northfield, Vt. ............................................................................ 24Okemah, Okla. ........................................................................... 24Orangeburg, S.C. ....................................................................... 24Orono, Maine ............................................................................. 24Panguitch, Utah ......................................................................... 24Paris, Ill. ..................................................................................... 24Paso Robles, Calif. ..................................................................... 24Pocahontas, Ark. ........................................................................ 24
Racine, Wis. ................................................................................ 25Red Cloud, Neb. ........................................................................ 25Richardton Abbey, N.D. ............................................................ 25Rock Rapids, Iowa .................................................................... 25Salisbury, Md. ............................................................................ 25Sandpoint, Idaho ........................................................................ 25Santa Rosa, N.M. ....................................................................... 25Searchlight, Nev. ........................................................................ 25Spanish Fork, Utah .................................................................... 25
Spooner, Wis. .............................................................................. 26St. George, Utah ........................................................................ 26St. Joseph, La. ........................................................................... 26State College, Pa. ....................................................................... 26Staunton, Va. .............................................................................. 26Thompson, Utah ........................................................................ 26Tifton, Ga. .................................................................................. 26Titusville, Fla. ............................................................................ 26Troy, Ala. ................................................................................... 26
Troy, N.Y. ................................................................................... 27Tuckerton, N.J. .......................................................................... 27Tucson, Ariz. .............................................................................. 27Tularosa, N.M. ........................................................................... 27Tullahoma, Tenn. ....................................................................... 27Uniontown, Pa. .......................................................................... 27Union Springs, Ala. ................................................................... 27 Urbana, Ohio ............................................................................. 27Vale, Ore. ................................................................................... 27
Waterville, Wash. ....................................................................... 28West Point, N.Y. ......................................................................... 28Wickenburg, Ariz. ...................................................................... 28Williamsburg, Ky. ...................................................................... 28Winfield, W. Va. ......................................................................... 28Winnebago, Minn. ..................................................................... 28Woodville, Miss. ........................................................................ 28Worland, Wyo. ........................................................................... 28Yreka, Calif. .............................................................................. 28

4
Is the U.S. Temperature Record Reliable?By Anthony Watts
SurfaceStations.org
1. Whitewash versus LatexThe research project described in this report was the result of pure serendipity. It began when I set out to study the effect of paint changes on the thermometer shelters, known as Stevenson Screens, used by the National Oceanic and Atmospheric Administration’s National Weather Service (NOAA/NWS) to track changes in the climate of the U.S.
I had known for a number of years, from my early work in the 1970s with weather instrumentation, that when the U.S. Weather Bureau was commissioned in 1890, it used an instrument shelter designed by Thomas Stevenson (1818-1887), a British civil engineer (and father of the author Robert Louis Stevenson). (See Figure 1.) That wood-slatted box design included a coating of whitewash (slaked lime in water), which was a common outdoor coating of that era. When dried, it leaves a pure white coating of calcium carbonate on the wood surface.
Whitewash was still specified as the coating of choice for Stevenson Screens until 1979, when the National Weather Service (NWS), now an arm of the National Oceanic and Atmospheric Administration (NOAA), made a specification change to switch the surface coating from whitewash to semigloss latex paint. Latex paints have significantly different infrared properties due to the pigment, titanium dioxide, which differs from the calcium carbonate-based whitewash. I wondered if this change might affect the temperature readings inside the Stevenson Screens. In the spring of 2007, having time on my hands for the first time in years, I set off to find the answer.
I purchased three new Stevenson Screen thermometer shelters, shown in Figure 2. One is bare wood, unpainted, as a control; the middle one is painted with latex, as sent by the supplier; and the third is painted with a historically accurate (for early twentieth century) whitewash mixture
that I obtained (both materials and formula) from the head chemist at the National Lime Company. Whitewash was mixed after conferring with chemist Richard Godbey of the Chemical Lime Company in Henderson, Nevada, and after reading a paper he authored on the history and home creation of whitewash.1
The device on the tripod, also shown in Figure 2, is a stacked plate infrared thermometer shield with a small fan to pull air through, called an aspirated shield. I placed it at the same exposure height as the thermistors (electronic temperature sensors) in the screens and used it as the air temperature reference. Each Stevenson Screen and the air temperature reference sensor were fitted with matched, calibrated thermistors, National Institute of Standards and Technology (NIST) traceable with calibration certificates, which were connected to a calibrated data-logger, also with a calibration certificate. The resolution is .01º F with an accuracy of +/- 0.1º F over the range.
Figure 1. Stevenson Screen at the National Weather Service office in Monterey, California.
1. P. Mold and R. Godbey, “Limewash: Compatible Coverings for Masonry and Stucco,” International Building Lime Symposium 2005, Orlando, Florida, March 9-11, 2005, http://www.lime.org/BLG/Mold.pdf.

Is the U.S. Temperature Record Reliable? 5
This test showed that changes to the surface coatings did make a difference in the temperatures recorded in these standard thermometer shelters, shown in Figure 3. I found a 0.3º F difference in maximum temperature and a 0.8º F difference in minimum temperature between the whitewash- and latex-painted screens. This is a big difference, especially when we consider that the concern over anthropogenic global warming was triggered by what these stations reported was an increase of about 1.2º F over the entire twentieth century.
2. Story of Three StationsNext, I set out to determine if the Stevenson Screens of the U.S. network of temperature-monitoring stations had been updated to latex paint as required by NWS specification changes in 1979. I discovered that a specific network of stations existed for the purpose of climate monitoring, called the U.S. Historical Climatology Network (USHCN). The National Climatic Data Center (NCDC) calls the USHCN “a high quality, moderate-sized dataset of daily and monthly records of basic meteorological variables from over 1000 observing stations across the 48 contiguous United States.”2
This seemed like a good place to start my investigation of the whitewash versus latex issue, particularly since there were three stations near my town of Chico, California within easy driving distance. I set out to check the paint on the Stevenson Screens at these locations to see if they had indeed been converted to latex from whitewash. The first station, at the Chico University Experiment Farm, had been converted to latex, but it also contained a surprise. It had two screens, one of which was converted to automated radio reporting. I was surprised to find NWS had installed the radio electronics just inches from the temperature sensor, inside the screen. (See Figure 4.) Surely this station’s temperature readings would be higher than the actual temperature of ambient air outside the screen.
The next station, at Orland, California, was much better. It was well-sited and maintained and had evidence of several coats of latex paint. It had no electronics, just standard-issue mercury maximum and minimum temperature-recording thermometers. The third station, however, in Marysville, California, revealed the Chico University station was not a fluke. (See Figure 5.) As I stood next to the temperature sensor, I could feel warm exhaust air from the nearby cell phone tower equipment sheds blowing past me! I realized this official thermometer was recording the temperature of a hot zone near a large parking lot and other biasing influences including buildings, air conditioner vents, and masonry.
Figure 3. A plot of 24 hours of data from all four temperature probes.
Figure 2. Three Stevenson Screens, as used today in the United States by NOAA/NWS, and a stacked plate infrared thermometer.
2. http://cdiac.ornl.gov/epubs/ndp/ushcn/newushcn.html.

6 Is the U.S. Temperature Record Reliable?
I asked to see the official records kept by the fire station office, called B91 forms, which are mailed monthly to the National Climatic Data Center. They were woefully incomplete. The observer (the office manager) didn’t work weekends or holidays, and the B91 form for July 2007 had only 14 of 31 days completed. A copy of the actual form used to report appears in Figure 6.
Upon seeing the B91 form for Marysville, my first thought was back to my college days in lab exercises, where if I were conducting an experiment and able to complete only 45 percent of the readings, my instructor would surely tell me to repeat the experiment until I could “do it right.” Yet here we had an official climate-monitoring station, dubbed part of the “high quality” USHCN network that provides data for use in scientific studies, actually measuring the temperature of a parking lot with air conditioners blowing exhaust air on it, and missing more than half of its data for the month of July!
I wondered if other researchers had expressed concern about the quality of the U.S. temperature record and found they had. In 2003, NCDC recognized that the existing USHCN network had problems and commissioned the new Climate Reference Network (CRN) to replace the old USHCN network. A report released at the time said:
The research community, government agencies, and private businesses have identified significant shortcomings in understanding and examining long-term climate trends and change over the U.S. and surrounding regions. Some of these shortcomings are due to the lack of adequate documentation of operations and changes regarding the existing and earlier observing networks, the observing sites, and the instrumentation over the life of the network. These include inadequate overlapping observations when new instruments were installed and not using well-maintained, calibrated high-quality instruments. These factors increase the level of uncertainty when government and business decision-makers are considering long-range strategic policies and plans.3
Figure 4. Temperature station at the Chico University Experiment Farm. Who puts a temperature sensor right next to heat-generating electronics?
Figure 5. Temperature station at the Marysville, California fire department surrounded by heat sources.
3. Climate Reference Network (CRN) Site Information Handbook, http://www1.ncdc.noaa.gov/pub/data/uscrn/documentation/program/X030FullDocumentD0.pdf

Is the U.S. Temperature Record Reliable? 7
My search also led me to Dr. Roger Pielke Sr., senior research scientist at the Cooperative Institute for Research in Environmental Sciences (CIRES), University of Colorado in Boulder, and professor emeritus of the Department of Atmospheric Science, Colorado State University, Fort Collins. Dr. Pielke had done some studies on the quality of siting
and measurements at USHCN climate-monitoring stations in Colorado and he confirmed my fears. He too had seen blatant violations of quality control that contaminated the temperature record.
The missing Marysville data (14 of 31 days) led me to research how missing data was dealt with in the climate record. I learned about a data algorithm used by NCDC called FILNET, short for Fill Missing Original Data in the Network, that is used to “infill” missing data using interpolations of data from surrounding stations. After reading about it, I came to the conclusion that NCDC uses FILNET to create “missing” data where none was ever actually. measured.
I looked up FILNET and, sure enough, missing data are created from nearby station estimates. According to a government report,
Estimates for missing data are provided using a procedure similar to that used in SHAP [Station History Adjustment Program]. This adjustment uses the debiased data from the SHAP and fills in missing original data when needed (i.e. calculates estimated data) based on a “network” of the best correlated nearby stations. The FILNET program also completed the data adjustment process for stations that moved too often for SHAP to estimate the adjustments needed to debias the data.4
I asked myself: “With potential heat biases such as temperature measurement near parking lots, air conditioner vents, and radio equipment, plus significant amounts of missing data being interpolated from other stations that may also have issues, how could our national climatic dataset possibly be accurate?” After further discussion with Dr. Pielke, and evaluating how he had done his study there with photography of temperature stations, and realizing the importance of documenting the state of quality control in the U.S. Historical Climatology Network, I decided something needed to be done.
Figure 6. B91 form filed by the temperature station in Marysville, California, for the month of July, 2007.
4. http://cdiac.ornl.gov/epubs/ndp/ushcn/ndp019.html#filnet, last accessed February 9, 2009.

8 Is the U.S. Temperature Record Reliable?
3. The Surface Stations ProjectFrom my discussions with Dr. Pielke, the Surface Stations Project was born. The concept was simple: Create a network of volunteers to visit USHCN climate-monitoring stations and document, with photographs and site surveys, their quality. I worked with Dr. Pielke to encapsulate his survey methods into simple instructions any member of the public could understand and follow. I created a Web site, www.SurfaceStations.org, that featured an interactive online database that would allow for the uploading of photographs and site surveys, along with supporting data.
Since the project’s inception in the Summer of 2007, more than 650 volunteer surveyors have registered, and as of this writing in February 2009, 865 of the 1,221 USHCN climate-monitoring stations have been surveyed, representing more than 70 percent of the operational climate-monitoring network in the continental United States.
To rate the quality of the station siting characteristics, we used the same metric developed by NOAA’s National Climatic Data Center to set up the Climate Reference Network (CRN). According to Section 2.2. of the Climate Reference Network (CRN) Site Information Handbook, “the most desirable local surrounding landscape is a relatively large and flat open area with low local vegetation in order that the sky view is unobstructed in all directions except at the lower angles of altitude above the horizon.” Five classes of sites – ranging from most reliable to least – are defined:
Class 1: Flat and horizontal ground surrounded by a clear surface with a slope below 1/3 (less than 19º). Grass/low vegetation ground cover less than 10 centimeters high. Sensors located at least 100 meters from artificial heating or reflecting surfaces, such as buildings, concrete surfaces, and parking lots. Far from large bodies of water, except if it is representative of the area, and then located at least 100 meters away. No shading for a sun elevation greater than 3 degrees.
Class 2: Same as Class 1 with the following differences. Surrounding vegetation less than 25 centimeters. Artificial heating sources within 30 meters. No shading for a sun elevation greater than 5º.
Class 3: (error 1ºC) Same as Class 2, except no artificial heating sources within 10 meters.
Class 4: (error greater than 2ºC) Artificial heating sources less than 10 meters.
Class 5: (error greater than 5ºC) Temperature sensor located next to/above an artificial heating source, such as a building, roof top, parking lot, or concrete surface.
This rating system is duplicated for the Surface Stations Project. Distances to objects and surfaces are measured by volunteer surveyors, and in cases where hands-on measurements are not possible, due to the weather station being in a secured area (such as airports) or other inaccessible area, measurements are made using aerial survey tools such as Google Earth and other aerial mapping and measurement systems. When the site is inaccessible and the quality of aerial photography is poor, photographic analysis of objects of known size and length that appear with the weather stations (such as chain link fence segments) are used to determine distances.
Armed with these rating tools provided by NOAA, NWS, and NCDC, the Surface Stations Project was able to quantify the quality of the operational USHCN climate-monitoring network. Due to the open and accessible nature of the project, having all photographs and data available online for public viewing, the surveys are seen by dozens to hundreds of people, who readily point out errors or concerns, such as a misidentified station. In such cases where an error is identified, surveys are removed from the database, and the site survey is redone when practical. Each USHCN site rating, once applied, is seen by three different individuals, ensuring it represents a true rating.

Is the U.S. Temperature Record Reliable? 9
4. Examples of Poor SitingThe Surface Stations Project found an amazing array of siting issues in the USHCN, many the product of poor planning during installation or lack of time to complete a quality job of installation. Others are almost comical in their ineptitude. In this section we present some examples that represent the most commonly seen issues. Infrared photography was used to illustrate heat sources near the official thermometer.
The most frequent siting issue was proximity to artificial heating or radiative heat surfaces. These nearby heat sources, such as concrete and asphalt, have been demonstrated to heat nearby air and bias thermometer readings upwards by as much as 7º C (12º F).5 Thermometers are often much closer than the 100 meters required for Class 1 status in the new CRN, or even the 100-foot (30.48 meters) standard NOAA recommended for the older USHCN network.6 The four locations photographed below show instances where heat from nearby buildings, an electric transformer, a water treatment plant, and a sidewalk are all apparent from the infrared photos.
Figures 7 and 8. Perry, Oklahoma–near downtown fire department; infrared view.
5. H. Yilmaz, S. Toy, M.A. Irmak, S. Yilmaz, and Y. Bulut, “Determination of Temperature Differences between asphalt, concrete, soil and grass surfaces in the City of Erzurum, Turkey,” Atmosfera 21, #2 (2008), pp. 135-146.
6. “The sensor should be at least 100 feet from any paved or concrete surface.” NOAA’s National Weather Service, Cooperative Ob-server Program, “Proper Siting,” http://www.nws.noaa.gov/om/coop/standard.htm, last visited February 11, 2009.
Figures 9 and 10. Glenns Ferry, Idaho–near power transformer; infrared view.

10 Is the U.S. Temperature Record Reliable?
A trend illustrated by the photos above is for the newer style MMTS/Nimbus thermometers to be installed much closer to buildings and radiative surfaces than the older Stevenson Screens. NOAA’s sensor cable specification cites a maximum distance of 1/4 mile,7 but installers often can’t get past simple obstructions such as roads, driveways, or even some concrete walkways using the simple hand tools (shovel, pickaxe, etc.) they are provided to trench a cable run. The photo on the next page, of the USHCN station in Bainbridge, Georgia, illustrates the systemic problem.
The original Stevenson Screen can be seen in the grass beyond the road, and the new MMTS/Nimbus thermometer appears in the foreground. The new location is just 8.9 feet from an air conditioning heat exchanger and 14.3 feet from a heated building. Note the parking spaces near the MMTS as well. Thus, the new station location may report higher temperatures than the old station even if ambient temperatures remain unchanged.
The problem illustrated by the Bainbridge, Georgia picture is widespread in the dataset. Local National Weather Service Cooperative Observer Program (COOP) managers lack the tools and often the time needed to install the new cabled electronic thermometer in locations that comply with NOAA guidelines. As a result, most MMTS/Nimbus thermometers get installed close to the building that houses the electronic readout equipment, which is not weatherproof.
Figures 11 and 12. Independence, Kansas–near water treatment plant; infrared view.
Figures 13 and 14. Fayetteville, North Carolina–next to a sidewalk; infra-red view.
7. http://www.srh.noaa.gov/ohx/dad/coop/specs-1.html

Is the U.S. Temperature Record Reliable? 11
Since these MMTS/Nimbus electronic thermometers have been gradually phased in since their inception in the mid-1980s, the bias trend that likely results from the thermometers being closer to buildings, asphalt, etc. would be gradual, and likely not noticed in the data. If they had been installed all at once, or even over the course of a year, there would be a step function in the annual data announcing the problem.
The impact of moving a station can be dramatic. For example, Figure 16 shows a new temperature station in Lampasas, Texas, located in a radio station’s parking lot in the very center of town, just 28 feet from U.S. Highway 183. Previously the station was in a residential backyard over grass. According to the NCDC metadata database, the station was moved on October 1, 2000. Figure 17 shows the giant step upward in temperature that coincided with the move.
Figure 15. Old Stevenson Screen and new MMTS/Nimbus electronic thermometer in Bainbridge, Georgia. The new station is recording heat from the air conditioning unit, house, cars, and asphalt parking lot. Shading issues mean winter temperatures are also affected when leaves are absent.
Figure 17. Since the station was moved in October 2000, temperatures recorded for Lampasas have soared.
Figure 16. The recently moved temperature station in Lampasas, Texas – now in the parking lot of a downtown radio station.
Station moved
12 Is the U.S. Temperature Record Reliable?
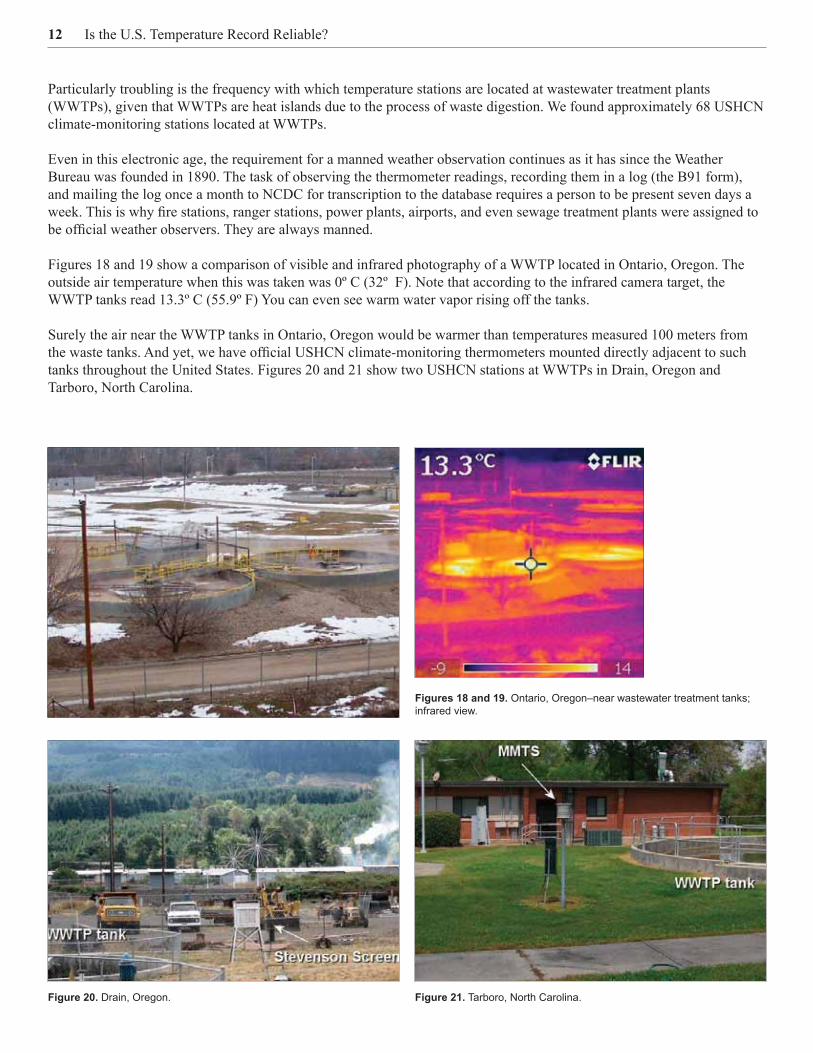
Particularly troubling is the frequency with which temperature stations are located at wastewater treatment plants (WWTPs), given that WWTPs are heat islands due to the process of waste digestion. We found approximately 68 USHCN climate-monitoring stations located at WWTPs.
Even in this electronic age, the requirement for a manned weather observation continues as it has since the Weather Bureau was founded in 1890. The task of observing the thermometer readings, recording them in a log (the B91 form), and mailing the log once a month to NCDC for transcription to the database requires a person to be present seven days a week. This is why fire stations, ranger stations, power plants, airports, and even sewage treatment plants were assigned to be official weather observers. They are always manned.
Figures 18 and 19 show a comparison of visible and infrared photography of a WWTP located in Ontario, Oregon. The outside air temperature when this was taken was 0º C (32º F). Note that according to the infrared camera target, the WWTP tanks read 13.3º C (55.9º F) You can even see warm water vapor rising off the tanks.
Surely the air near the WWTP tanks in Ontario, Oregon would be warmer than temperatures measured 100 meters from the waste tanks. And yet, we have official USHCN climate-monitoring thermometers mounted directly adjacent to such tanks throughout the United States. Figures 20 and 21 show two USHCN stations at WWTPs in Drain, Oregon and Tarboro, North Carolina.
Figures 18 and 19. Ontario, Oregon–near wastewater treatment tanks; infrared view.
Figure 20. Drain, Oregon. Figure 21. Tarboro, North Carolina.

Is the U.S. Temperature Record Reliable? 13
5. Bias in Adjustments by NOAA and NASAChanging the technology and locations of temperature stations and a blatant disregard for NOAA’s own rules about keeping sensors at least 100 feet away from heat sources and radiative surfaces have undoubtedly contaminated the U.S. temperature record. But it gets worse. Adjustments applied to “homogenize” the data (comparing to surrounding stations and adjusting) impart an even larger false warming trend to the data.
For example, consider the difference between what NOAA publishes and what NASA GISS publishes after NASA “homogenized” the Lampasas USHCN station data, shown in Figure 22. The revised data (shown in red) are made to appear cooler than the original data (shown in blue) in the past, making the positive slope of the trend in the last century even steeper.
It is not only NASA GISS that does this. NOAA adjusts temperature data also, and despite the pervasive evidence that recent changes in technology and location have introduced an upward bias in the temperature record over time,8 NOAA has been making adjustments that increase the warming trend. Figures 23 and 24 show the trend over time of all the adjustments applied to the USHCN data.
As illustrated in the graphs below, in simplest terms, NOAA adds a positive bias by its own “adjustment” methodology. It is important to note that Figure 24 shows a positive adjustment of 0.5º F from 1940 to 1999. The generally agreed-upon “global warming signal” is said to be about 1.2º F (0.7ºC) over the last century.9 NOAA’s “adjustments,” in other words, account for nearly one-half of the agreed-upon rise in temperature in the twentieth century. The same adjustments are applied to the GHCN global temperature dataset.
Figure 22. USHCN “raw” data and NASA GISS “homogenized” data for Lampasas, Texas. NASA’s adjustments made the recent temperature increase look even steeper. Source: http://data.giss.nasa.gov/gistemp/station_data/.
8. R. McKitrick and P.J. Michaels, “A test of corrections for extraneous signals in gridded surface temperature data,” Climate Research 26 (2004), pp. 159-173; G.C. Hegerl and J.M. Wallace, “Influence of patterns of climate variability on the difference between satellite and surface temperature trends,” Journal of Climate 15 (2002), pp. 2412-2428.
9. National Climatic Data Center, “Global Warming -- Frequently Asked Questions,” “Item 3: Global surface temperatures have in-creased about 0.74º C (plus or minus 0.18º C) since the late-19th century.” http://lwf.ncdc.noaa.gov/oa/climate/globalwarming.html.

14 Is the U.S. Temperature Record Reliable?
Figure 23. NOAA’s adjustments to raw temperature data have generally been to increase, not decrease, recent temperatures. Source: http://cdiac.ornl.gov/epubs/ndp/ushcn/ndp019.html.
Figure 24. The net effect of NOAA’s adjustments is to increase the rise in temperature since 1900 by 0.5º F. Source: http://cdiac.ornl.gov/epubs/ndp/ushcn/ndp019.html.
Is the U.S. Temperature Record Reliable? 15
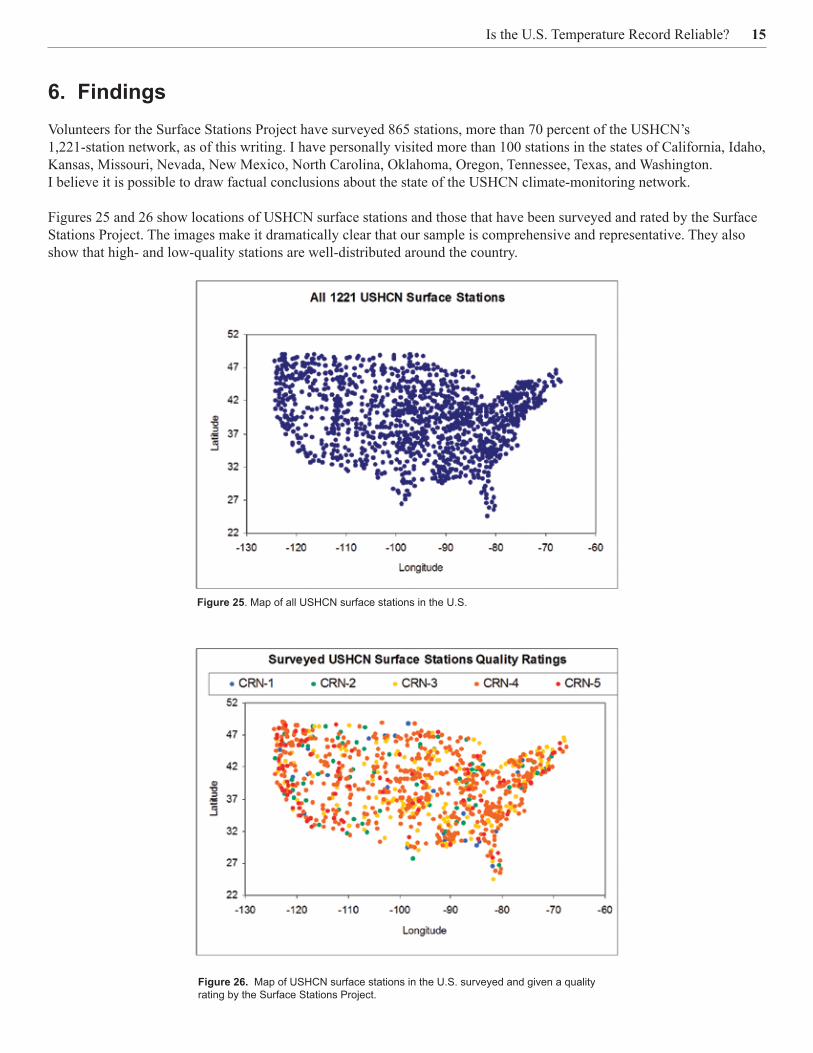
6. FindingsVolunteers for the Surface Stations Project have surveyed 865 stations, more than 70 percent of the USHCN’s 1,221-station network, as of this writing. I have personally visited more than 100 stations in the states of California, Idaho, Kansas, Missouri, Nevada, New Mexico, North Carolina, Oklahoma, Oregon, Tennessee, Texas, and Washington. I believe it is possible to draw factual conclusions about the state of the USHCN climate-monitoring network.
Figures 25 and 26 show locations of USHCN surface stations and those that have been surveyed and rated by the Surface Stations Project. The images make it dramatically clear that our sample is comprehensive and representative. They also show that high- and low-quality stations are well-distributed around the country.
Figure 25. Map of all USHCN surface stations in the U.S.
Figure 26. Map of USHCN surface stations in the U.S. surveyed and given a quality rating by the Surface Stations Project.

16 Is the U.S. Temperature Record Reliable?
Each station has been assigned a CRN rating based on the quality rating system provided by NOAA. We found only 3 percent of the stations surveyed meet the requirements of Class 1, while an additional 8 percent meet the requirements of Class 2. Stations that don’t qualify as Class 1 or 2 have artificial heating sources closer than 10 meters to the thermometer, a far cry from the gold standard of 100 meters. This means 89 percent – nearly 9 of 10 – of the stations surveyed produce unreliable data by NOAA’s own definition.
Twenty percent of stations were rated as Class 3, 58 percent as Class 4, and 11 percent as Class 5. Recall that a Class 3 station has an expected error greater than 1ºC, Class 4 stations have an expected error greater than 2ºC, and Class 5 stations have an expected error greater than 5ºC. These are enormous error ranges in light of the fact that climate change during the entire twentieth century is estimated to have been only 0.7º C. In other words, the reported increase in temperature during the twentieth century falls well within the margin of error for the instrument record.
This project has shown that the vast majority of the temperature stations in the USHCN network have proximity to biasing elements that make them unreliable. Figure 27 offers a visual representation of how low-quality stations greatly outnumber high-quality stations.
The USHCN has stations in venues that are incompatible with continuous quality of measurements due to localized operational factors that likely impart a warm bias to measurements due to waste heat from industrial, government, and business processes. Examples include:
Prior to the Surface Stations Project, the weather stations that produced data for inclusion into the USHCN dataset had never been subject to a network-wide site quality assessment. The placement, maintenance, and calibration of each site is left up to the COOP manager at local National Weather Service Forecast Offices (NWSFO). The gradual introduction of the MMTS/Nimbus electronic thermometers since their inception in the mid-1980s has likely introduced a slow and likely undetectable warming bias due to thermometers being moved closer to buildings, asphalt, concrete, and other man-made influences as they were upgraded.
Figure 27. Most of the surveyed temperature stations in the U.S. fall into categories that mean they are unreliable. Only stations in CRN=1 and CRN=2 – 11 percent of all stations – are reliable.
• Small and large city airports• Industrial/factory complexes• Fire and Ranger stations
• Electrical substations• City water purification plants• City wastewater treatment plants

Is the U.S. Temperature Record Reliable? 17
7. Policy Implications and RecommendationsThis report reveals a serious deterioration in the reliability of the U.S. temperature record due to siting decisions that violate NOAA’s own rules. With only 11 percent of surveyed stations being of acceptable quality, the raw temperature data produced by the USHCN stations are not sufficiently accurate to use in scientific studies or as a basis for public policy decisions. Adjustments to the data by NOAA/NCDC and NASA add significant additional warming biases, which compound the errors present from localized site biases. With 89 percent of the stations in the USHCN network having been shown not to meet NOAA’s own criteria, the use of data from adjacent stations to infill, adjust, or homogenize data likely results in a greater distribution of error through the network.
These findings have significant implications for the scientific and policymaking communities in the U.S. and around the world. The USHCN data are widely used and cited by many major scientific centers for climate analysis. These include but are not limited to:
• NASA Goddard Institute for Space Studies (GISS) managed by Dr. James Hansen• Carbon Dioxide Information Analysis Center (CDIAC) at Oak Ridge Laboratory• Hadley Climate Research Unit (CRU) in the UK managed by Dr. Phil Jones• National Climatic Data Center (NCDC) managed by Mr. Thomas Karl• Intergovernmental Panel on Climate Change (IPCC), a joint project of the World Meteorological Organization and the United Nations Environment Program
The findings and recommendations of these highly respected and influential scientific and political organizations are now in doubt. The data currently used to claim that the twentieth century witnessed a statistically significant warming trend are unreliable. The truth of that claim can be established only with new and more-reliable data. Since the U.S. temperature record is widely regarded as being the most reliable of the international databases, it follows that data used to estimate the change in global temperatures over the past century must also be revisited.
These findings lead me to make the following suggestions to NOAA/NCDC:
• An independently managed and comprehensive quality-control program should be implemented by NOAA/NWS to determine the best stations in the network.
• A pristine dataset should be produced from the best stations and then compared to the remainder of the USHCN network to quantify the total magnitude of bias.
• Users of the current USHCN data should be advised of the quality-control issues so that they may reexamine results derived from such data.
• NOAA should undertake a comprehensive effort to improve the siting of the stations and correct the temperature record for contamination that has been observed to occur during the past two decades.
On the following pages are examples of stations around the country, in alphabetical order by city name, with descriptions of their siting condi-tions, and temperature charts. The USHCN station temperature graphs were provided by NASA Goddard Institute for Space Studies (GISS).

18 Is the U.S. Temperature Record Reliable?
Amherst, Mass., sited on gravel bed near driveway.
Ardmore, Okla., between city hall and side-walk, main street.
Ashland, Ore., patch of green, sea of gray.
Blacksburg, Va., nearby concrete platforms, satellite dish.
Block Island, R.I., adjacent to parking lot and aircraft parking area.
Brinkley, Ark., nearby building with 3 air blowers, dirt mound, raw sewage.
Atchison, Kan., near corner of large stone buildings.
Baltimore, Md., sited on red platform on city rooftop.
Bartow, Fla., nearby building, road, parking lot.

Is the U.S. Temperature Record Reliable? 19
Brookville, Ind., nearby driveway, building. Buffalo Bill Dam, Wyo., sited on concrete, between two buildings.
Bunkie, La., too close to sidewalk and building.
Cornwall, Vt., nearby building. Crosby, N.D., nearby building, patio. Dayton, Wash. Water plant, over cinder rock, near vents, buildings.
Champion, Mich., nearby road, parking area, house.
Clarksville, Tenn., surrounded by sewage plant and parking lot.
Conway, S.C., near large asphalt area, building.

20 Is the U.S. Temperature Record Reliable?
Detroit Lakes, Minn., nearby air-condition-ing unit, building, gas tank.
Dillon, Mont., tanks, building, sited on con-crete border of sidewalk.
Durham, N.H., nearby building, parking lot.
Fort Scott, Kan., overwhelmed by large paved area, nearby building.
Fort Morgan, Colo., huge industrial build-ing, parking lot.
Gainesville, Ga., between two driveways.
Ennis, Mont., nearby building, trailer, assorted junk.
Enosburg Falls, Vt., adjacent to driveway, nearby building.
Falls Village, Conn., nearby building and parking lot.

Is the U.S. Temperature Record Reliable? 21
Grace, Idaho, industrial nightmare. Greenville, Texas, nearby building, satellite dish, two air-conditioning units.
Greenwood, Del., sited on concrete platform.
Hendersonville, N.C., nearby parking lot, satellite dish, building.
Heppner, Ore., sea of crushed rock, city disposal plant.
Hillsdale, Mich., near large paved area.
Gunnison, Colo., nearby parking lot. Haskell, Texas, between road and parking lot, nearby building.
Hay Springs, Neb., next to building, narrow sidewalk, telephone pole.

22 Is the U.S. Temperature Record Reliable?
Hopkinsville, Ky., adjacent building, driveway, accumulated junk, BBQ.
Hot Springs, S.D., partially obscured by foliage.
Kennebec, S.D., sited on gravel path, nearby shed.
Lexington, Va., sewage plant, near building, sidewalks, road, parking lot.
Logan, Iowa, nearby building, concrete slabs.
Lovelock, Nev., nearby building, U-Haul unit.
Lampasas, Texas, next to sidewalk, near satellite dish, road, parking lot, building.
Lebanon, Mo., nearby building. Lenoir, N.C., nearby sidewalk, road, building.

Is the U.S. Temperature Record Reliable? 23
Marengo, Ill., nearby buildings, parking lot. Miami, Ariz., sited on gravel, next to building.
Midland, Mich., next to vent at wastewater treatment plant.
Morrison, Ill., sited on concrete, between open wastewater tanks.
Mount Vernon, Ind., nearby road, building, ironwork.
Napoleon, Ohio, over concrete, wastewater tank.
Milwaukee, Wis., nearby road. Mohonk Lake, N.Y., much too close to ground, shading issues, nearby building.
Monticello, Miss., between two buildings, nearby sidewalk.

24 Is the U.S. Temperature Record Reliable?
Neosho, Mo., nearby driveway and house. Northfield, Vt., nearby driveway, building. Okemah, Okla., sited on edge of driveway, nearby street.
Paris, Ill., adjacent rooftop. Paso Robles, Calif., sited on concrete slab next to sidewalk, nearby road.
Pocahontas, Ark., fairly well sited. (Note cooling trend.)
Orangeburg, S.C., nearby metal coverings, parking lot, building.
Orono, Maine, sited on roof of large building with parking lot.
Panguitch, Utah, former location (screen removed) on concrete, by parking lot.

Is the U.S. Temperature Record Reliable? 25
Racine, Wis., between building and road. Red Cloud, Neb., on premises of city power plant. Nearby wall, structures.
Richardton Abbey, N.D., at edge of side-walk, nearby road, building.
Santa Rosa, N.M., exposed cabling, nearby metal boats, burn barrel, junk.
Searchlight, Nev., in Department of Trans-portation parking lot, heavy equipment.
Spanish Fork, Utah, sited on gravel, near concrete wall.
Rock Rapids, Iowa, nearby building, side-walk, driveway.
Salisbury, Md., nearby building, air-conditioning unit.
Sandpoint, Idaho, heavy gravel base.

26 Is the U.S. Temperature Record Reliable?
Spooner, Wis., nearby road and building. St. George, Utah, between building and raised parking lot, car radiator level.
St. Joseph, La., well-sited station. (Note temperature trend.)
Tifton, Ga., nearby air-conditioning units, sidewalk, road.
Titusville, Fla., mounted near sewage di-gester, near air-conditioning unit, generator.
Troy, Ala., nearby parking lot, satellite dish, assorted junk.
State College, Pa., nearby concrete path, building.
Staunton, Va., sewage plant, between tank wall and paved road.
Thompson, Utah, nonstandard equipment, over asphalt, nearby building.

Is the U.S. Temperature Record Reliable? 27
Troy, N.Y., nearby parking lot, sidewalk, building.
Tuckerton, N.J., unshielded sensor attached to building.
Tucson, Ariz., sited on concrete in a parking lot.
Uniontown, Pa., nearby building, road, parking areas.
Urbana, Ohio, at sewage plant, multiple violations (see labels).
Vale, Ore., next to road, screen facing wrong direction.
Tularosa, N.M., at edge of gravel road. Tullahoma, Tenn., sewage plant, electrical transformer, cement path.
Union Springs, Ala., nearby building.

28 Is the U.S. Temperature Record Reliable?
Waterville, Wash., adjacent to sidewalk, parking lots.
West Point, N.Y., sited on edge of paved path, nearby stone building.
Wickenburg, Ariz., adjacent building, park-ing lot, accumulated junk.
Woodville, Miss., nearby building. Worland, Wyo., nearby sidewalk, brick mounting, gravel at base, outbuilding.
Yreka, Calif., sited on cinder rock, nearby concrete driveway, parking lot.
Williamsburg, Ky., next to building (note the adjacent exhaust vent).
Winfield, W. Va., up on the roof. Winnebago, Minn., nearby sewage tanks.

How reliable are the data produced by this temperature station?
The stakes in the debate over global warming are high. If human activities are causing a major warming of the earth’s atmosphere, then actions to reduce greenhouse gas emissions costing hundreds of billions of dollars would be necessary.
But how do we know if global warming is a problem if we can’t trust the temperature record?
This report, by meteorologist Anthony Watts, presents the results of the first-ever compre-hensive review of the quality of data coming from the National Weather Service’s network of temperature stations. Watts and a team of volunteers visually inspected and took pictures of more than 850 of these stations. What they found will shock you:
We found stations located next to the exhaust fans of air conditioning units, surrounded by asphalt parking lots and roads, on blistering-hot rooftops, and near sidewalks and buildings that absorb and radiate heat. We found 68 sta-tions located at wastewater treatment plants, where the process of waste diges-tion causes temperatures to be higher than in surrounding areas.
In fact, we found that 89 percent of the stations – nearly 9 of every 10 – fail to meet the National Weather Service’s own siting requirements that stations must be 30 meters (about 100 feet) or more away from an artificial heating or reflecting source.
The conclusion is inescapable: The U.S. temperature record is unreliable. And since the U.S. record is thought to be “the best in the world,” it follows that the global database is likely similarly compromised and unreliable.
www.surfacestations.org