Is the Market on the Trump Train? -...
41
Member FINRA/SIPC Is the Market on the Trump Train?
Transcript of Is the Market on the Trump Train? -...

L P L F i n a n c i a l M e m b e r F I N R A / S I P C
1 M e m b e r F I N R A / S I P C
Is the Market on the Trump Train?

L P L F i n a n c i a l M e m b e r F I N R A / S I P C
2 2
Why Clinton Lost and Trump Won
L P L F i n a n c i a l M e m b e r F I N R A / S I P C
3
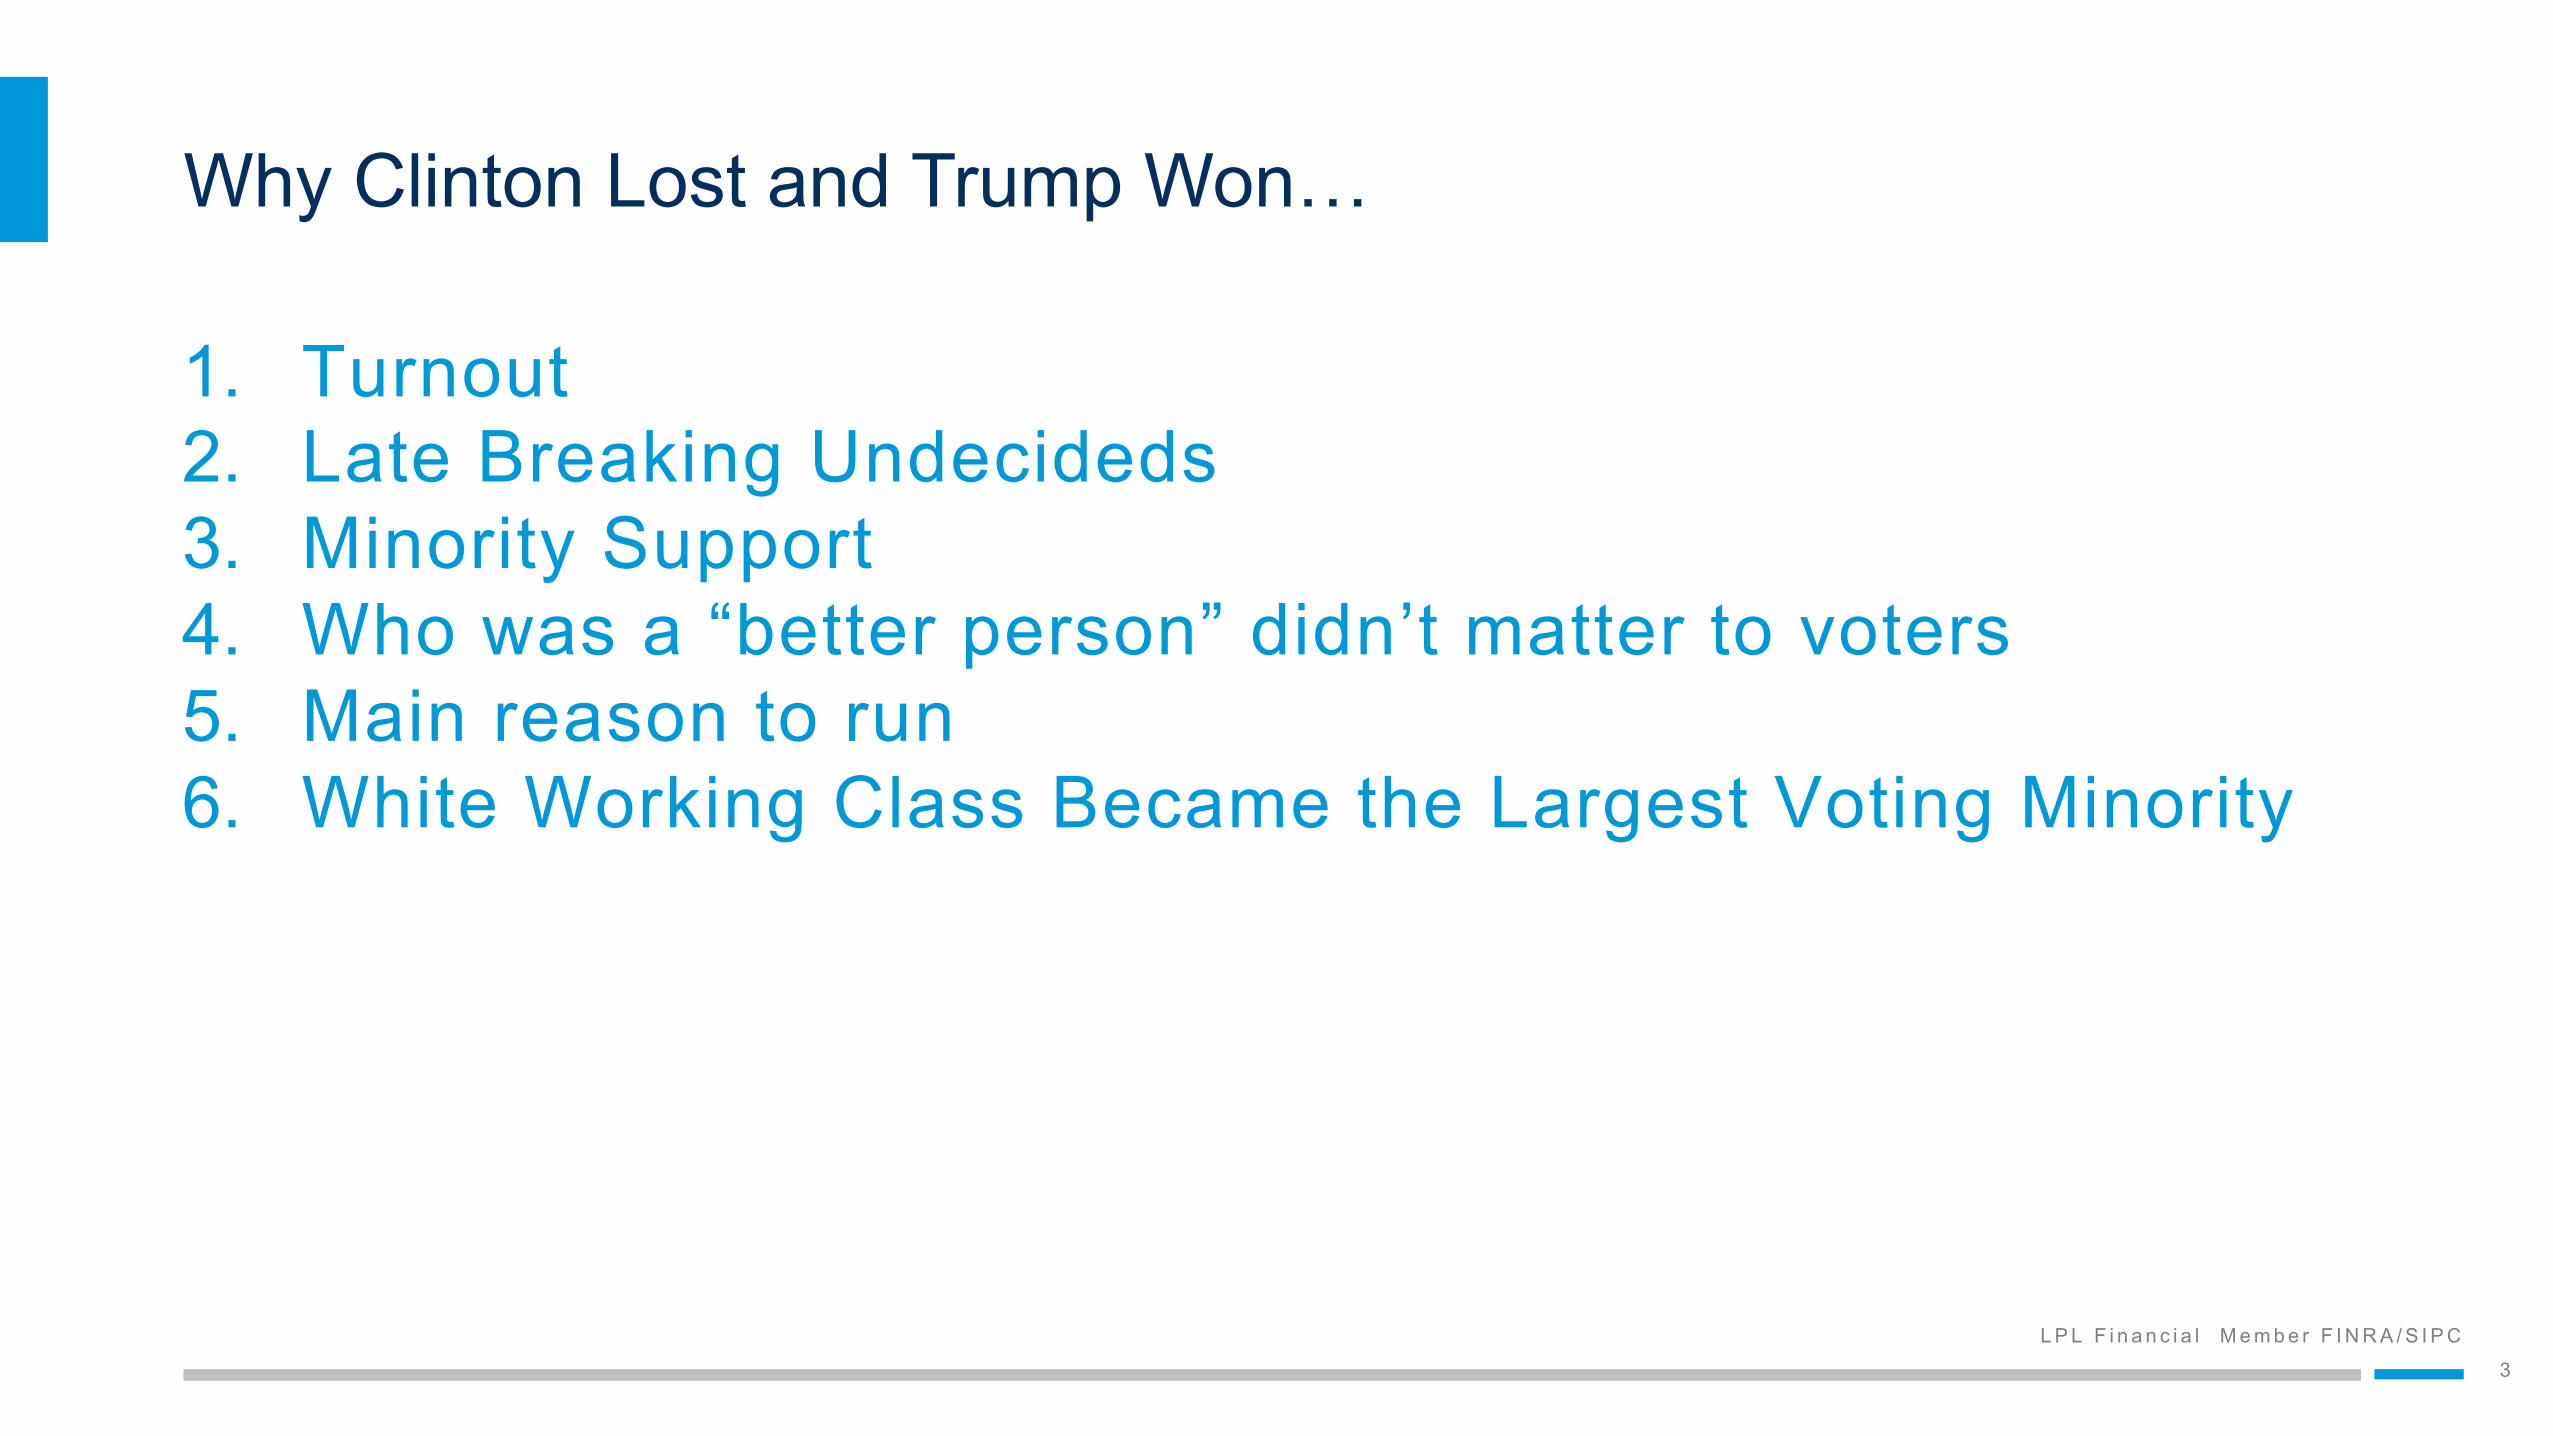
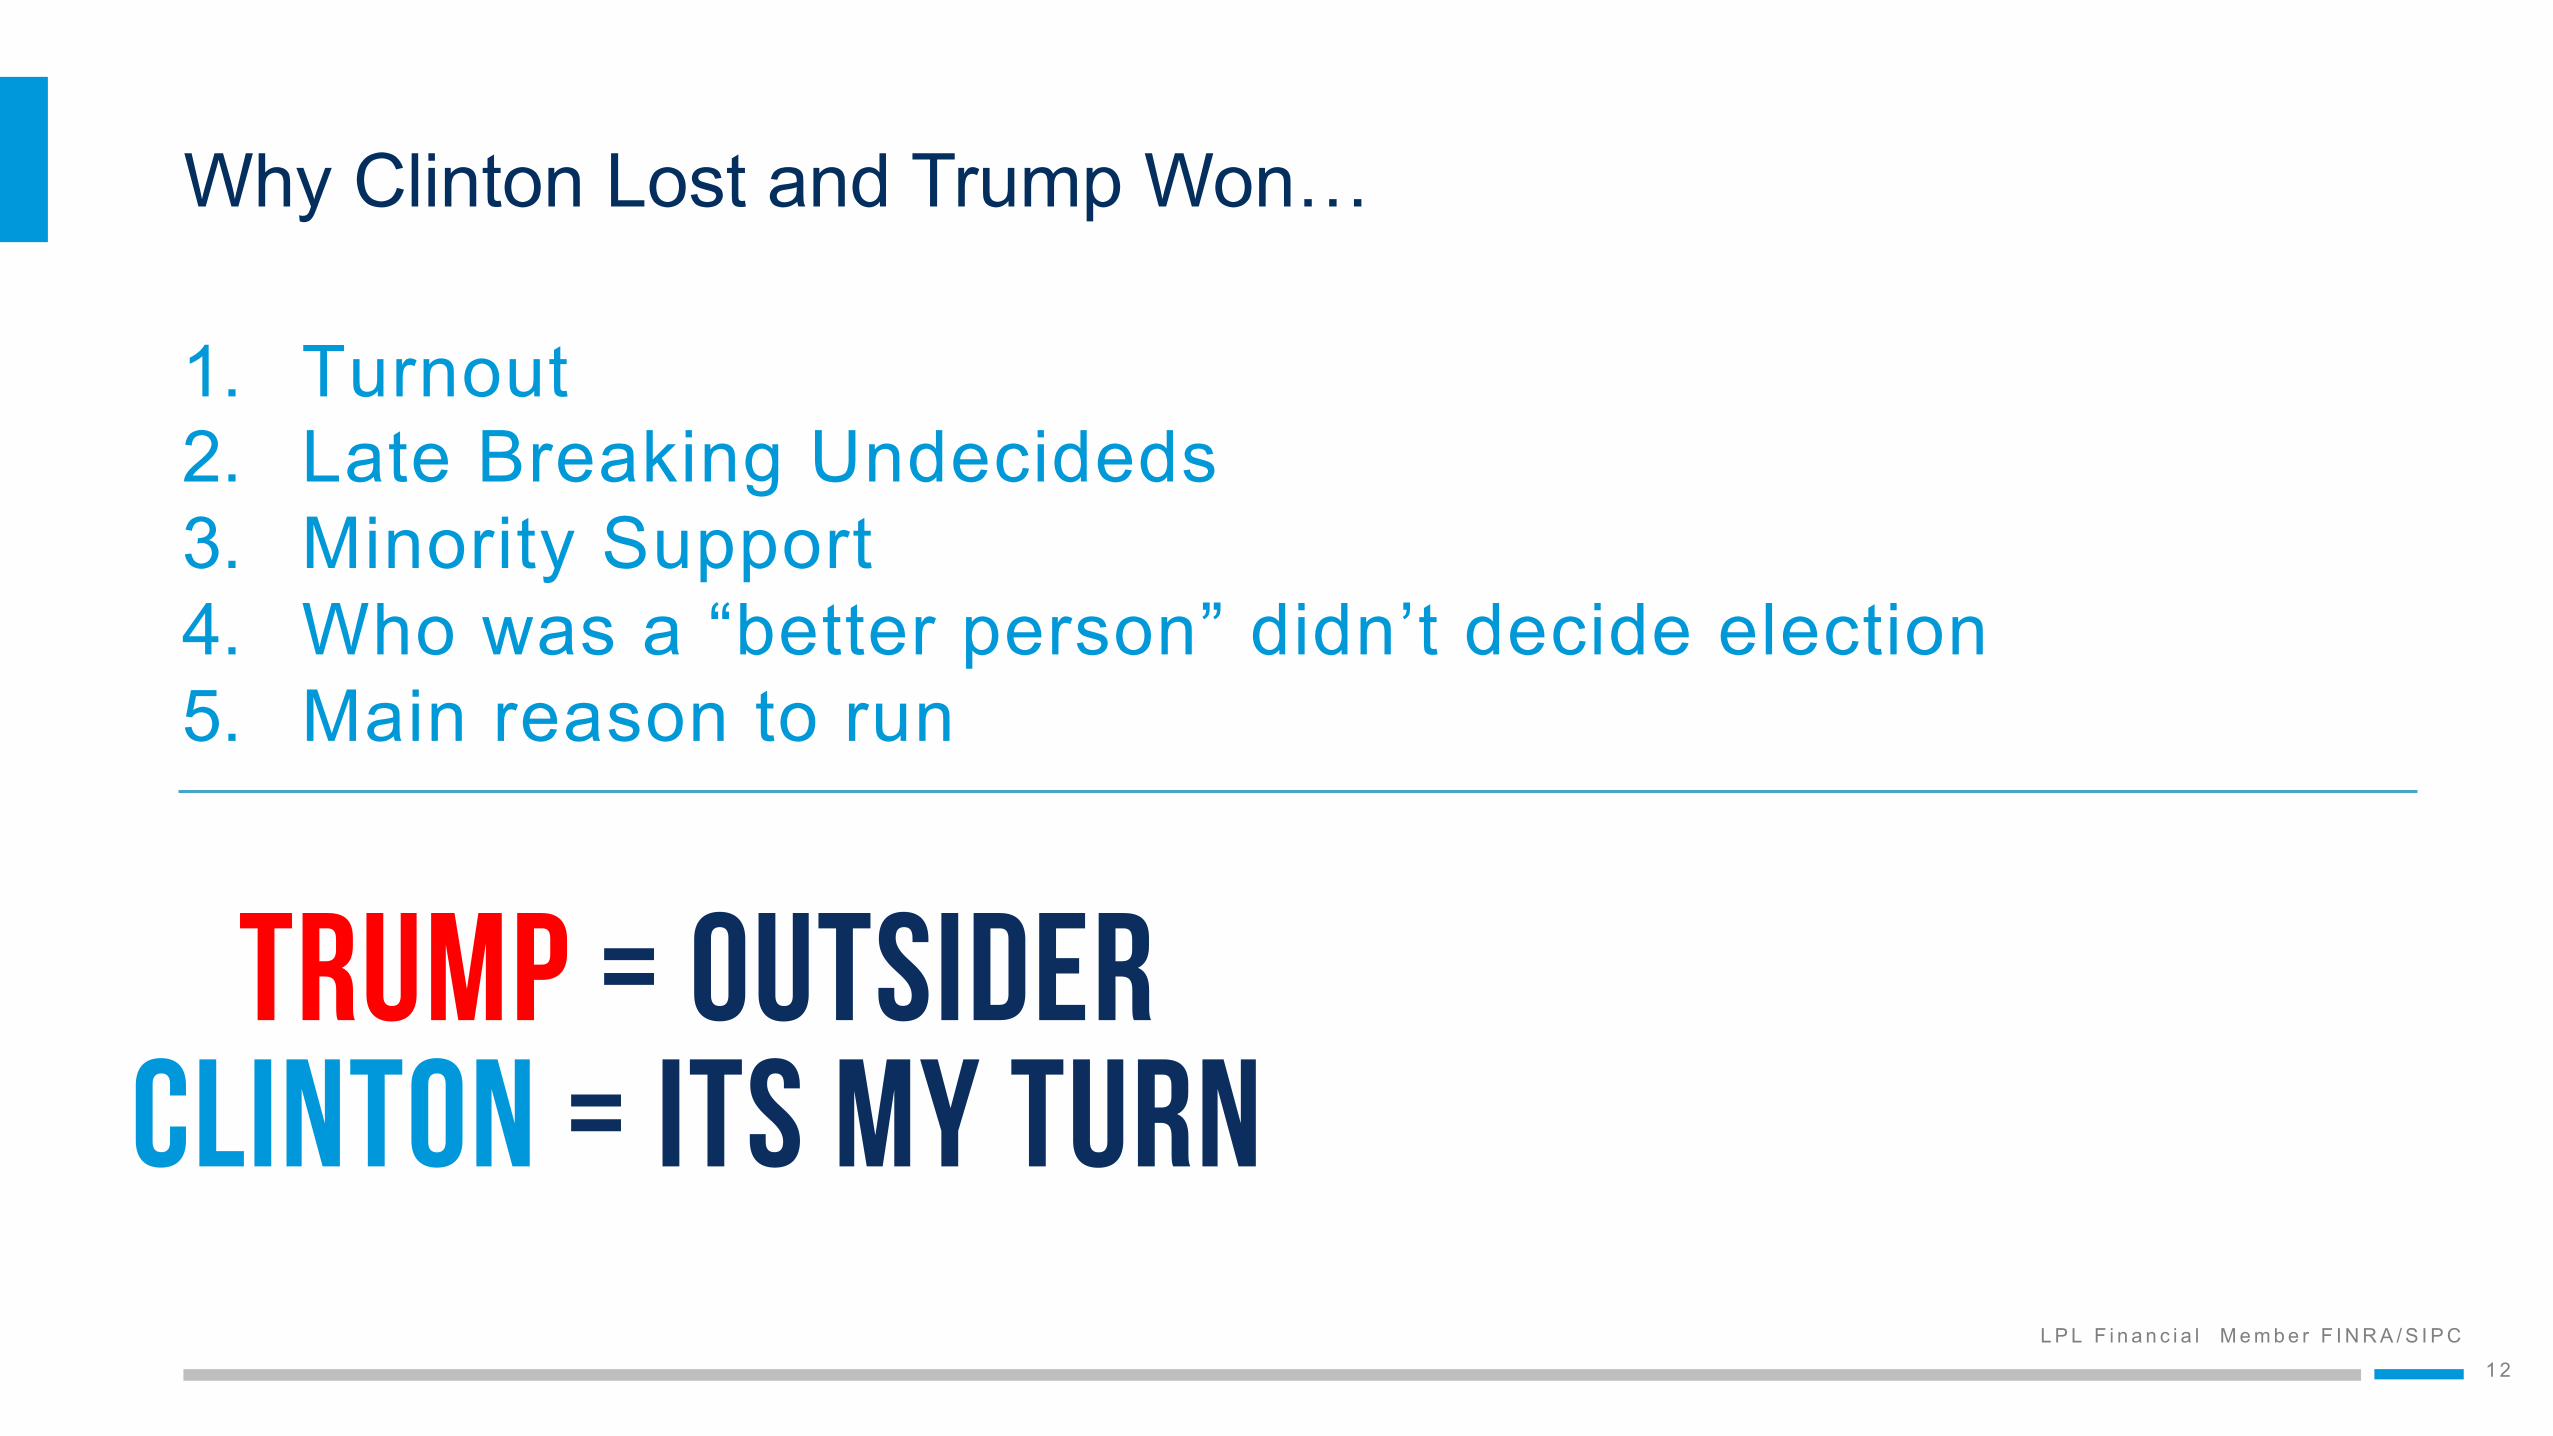
Why Clinton Lost and Trump Won…
1. Turnout 2. Late Breaking Undecideds 3. Minority Support 4. Who was a “better person” didn’t matter to voters 5. Main reason to run 6. White Working Class Became the Largest Voting Minority

L P L F i n a n c i a l M e m b e r F I N R A / S I P C
4
Source: ABC news 11/9/16
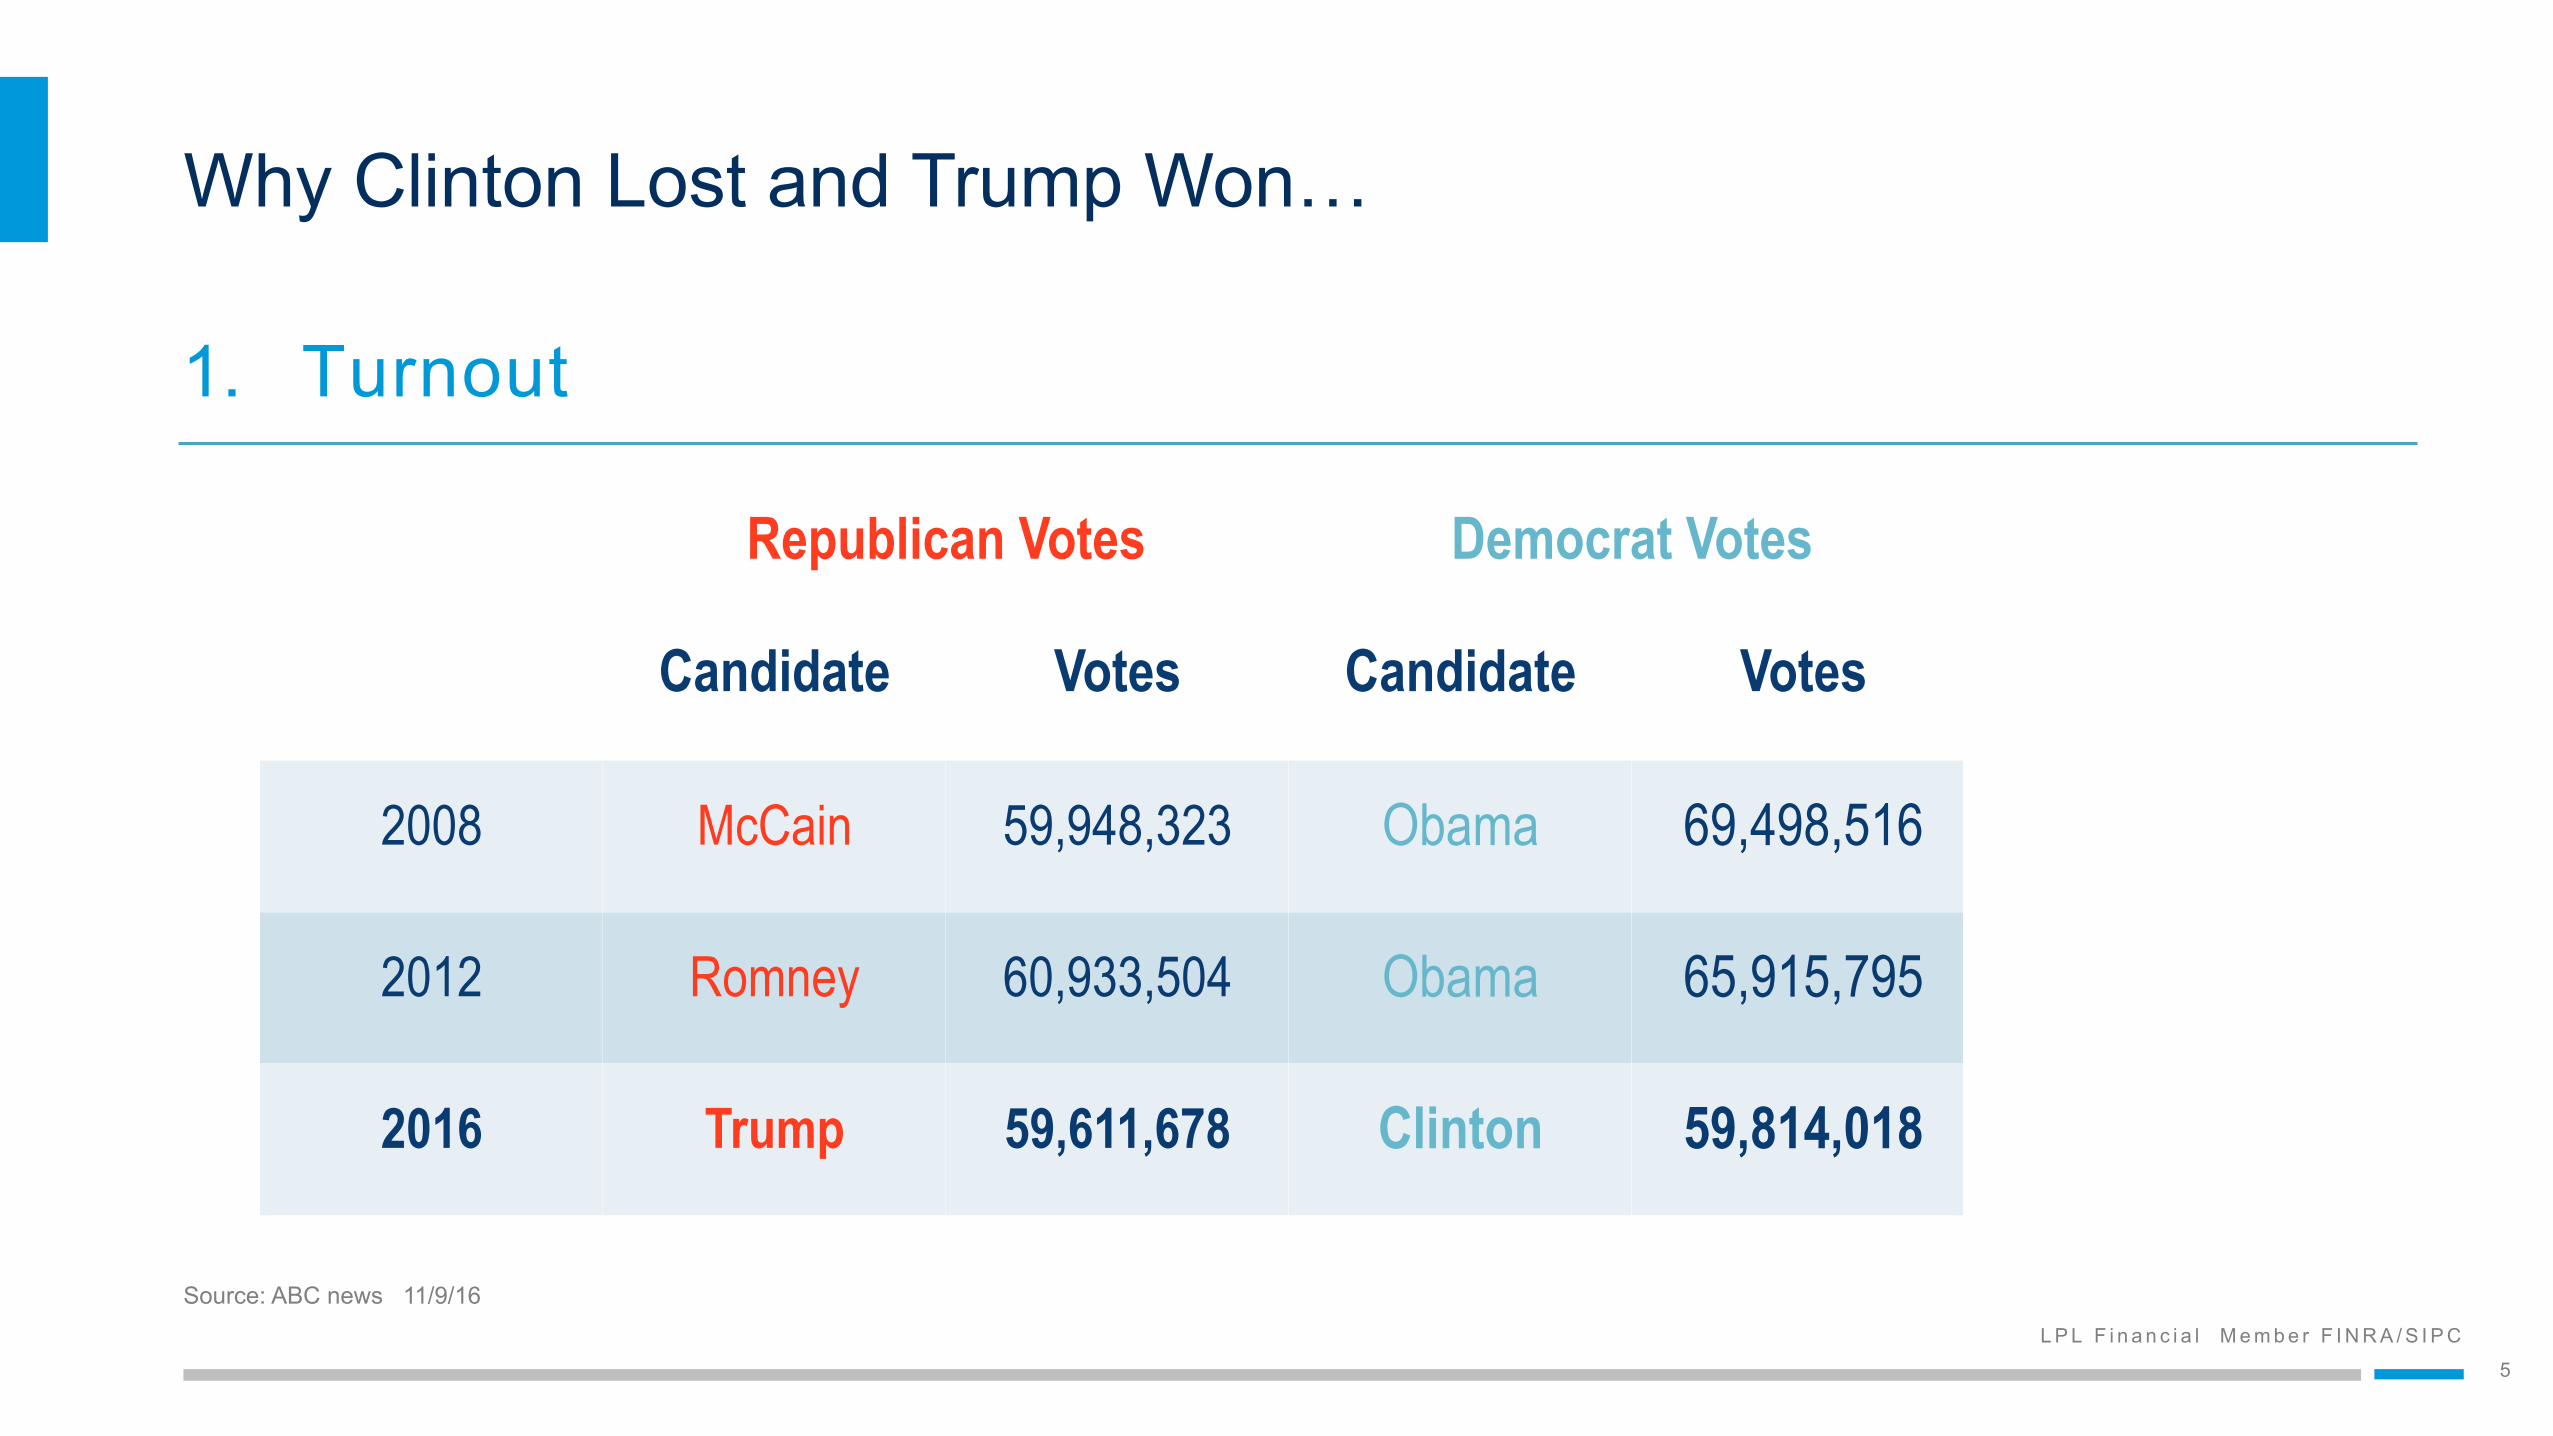
Why Clinton Lost and Trump Won…
1. Turnout
Republican Votes Democrat Votes Total Votes
Candidate Votes Candidate Votes
2008 McCain 59,948,323 Obama 69,498,516 129,446,839
2012 Romney 60,933,504 Obama 65,915,795 126,849,299
2016 Trump 59,611,678 Clinton 59,814,018 119,425,696
L P L F i n a n c i a l M e m b e r F I N R A / S I P C
5
Source: ABC news 11/9/16
Why Clinton Lost and Trump Won…
1. Turnout
Republican Votes Democrat Votes Total Votes
Candidate Votes Candidate Votes
2008 McCain 59,948,323 Obama 69,498,516 129,446,839
2012 Romney 60,933,504 Obama 65,915,795 126,849,299
2016 Trump 59,611,678 Clinton 59,814,018 119,425,696

L P L F i n a n c i a l M e m b e r F I N R A / S I P C
6
Source: ABC news 11/9/16
Why Clinton Lost and Trump Won…
1. Turnout
Republican Votes Democrat Votes Total Votes
Candidate Votes Candidate Votes
2008 McCain 59,948,323 Obama 69,498,516 129,446,839
2012 Romney 60,933,504 Obama 65,915,795 126,849,299
2016 Trump 59,611,678 Clinton 59,814,018 119,425,696

L P L F i n a n c i a l M e m b e r F I N R A / S I P C
7
Source: ABC news 11/9/16
Why Clinton Lost and Trump Won…
1. Turnout 2. Late Breaking Undecideds
Trump Clinton
Decided in last few days 46% 44%
Decided in last week 50% 38%
Decided in October 51% 37%
Decided in September 50% 46%
Decided before September 45% 52%

L P L F i n a n c i a l M e m b e r F I N R A / S I P C
8
Source: ABC news 11/9/16
Why Clinton Lost and Trump Won…
1. Turnout 2. Late Breaking Undecideds
Decided in Last Few Days in… Trump Clinton
Pennsylvania 54% 37%
Wisconsin 58% 31%
Michigan 50% 39%
Florida 51% 43%
L P L F i n a n c i a l M e m b e r F I N R A / S I P C
9
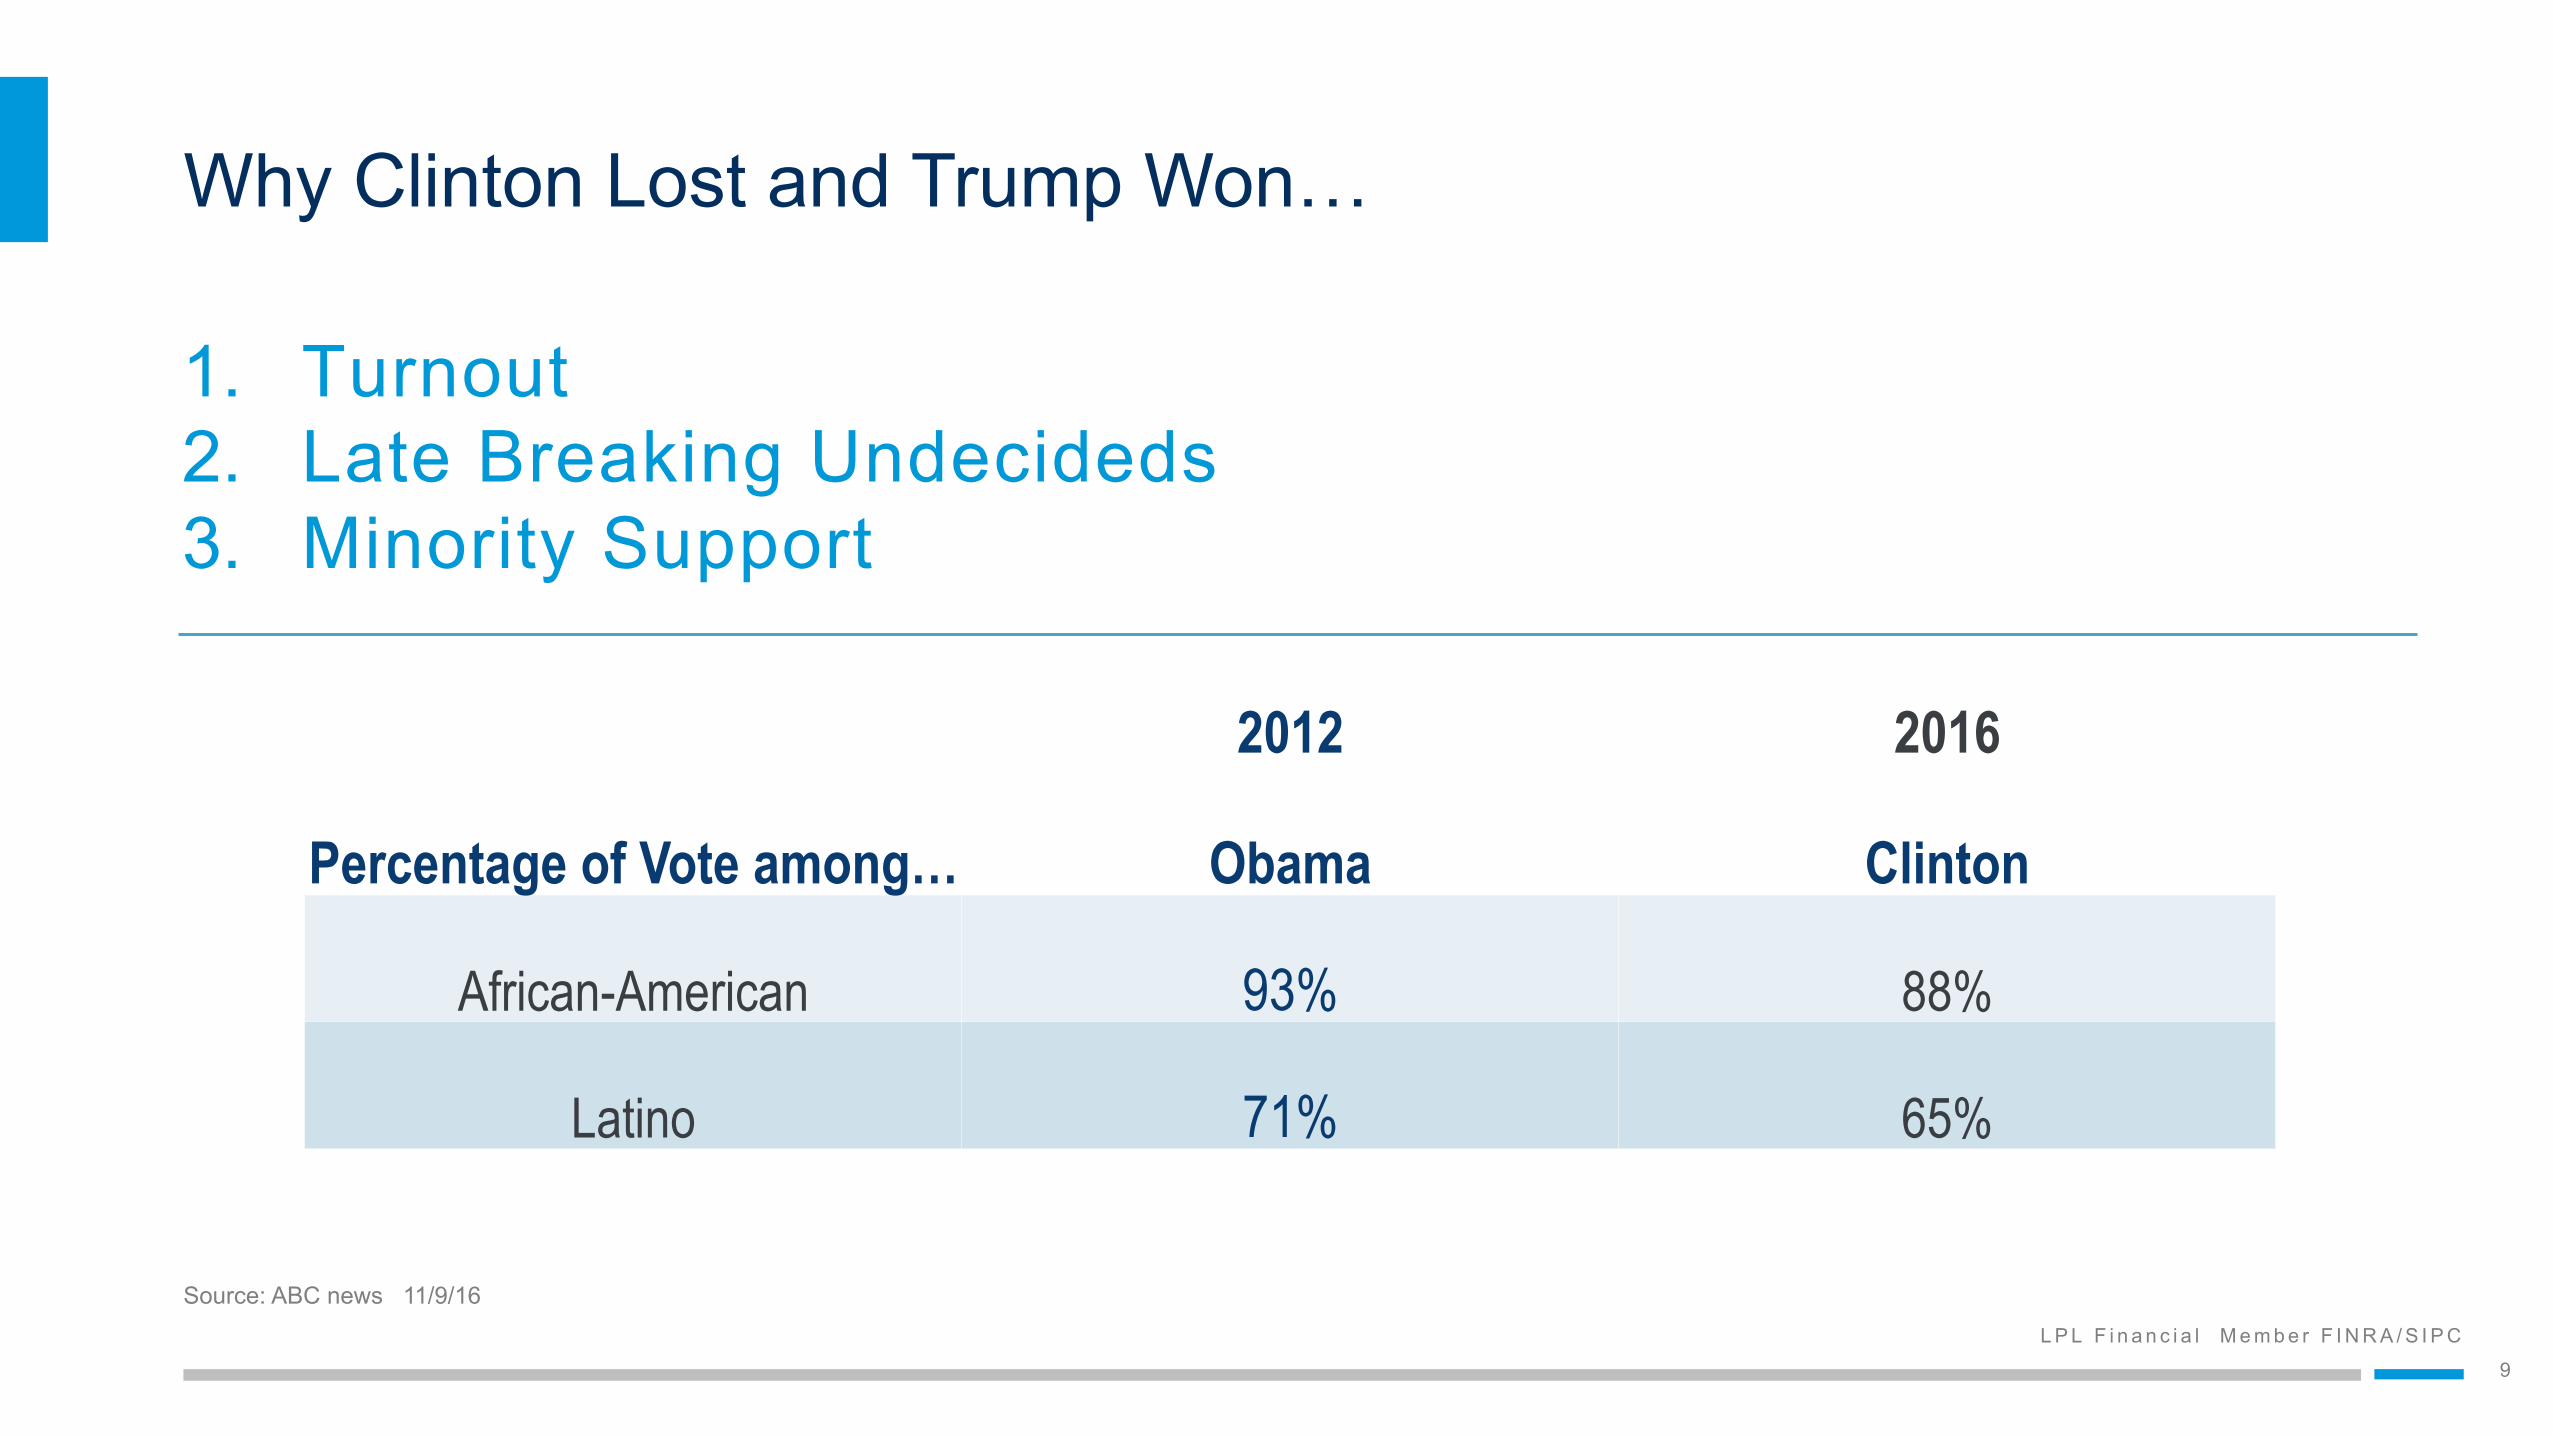
Source: ABC news 11/9/16
Why Clinton Lost and Trump Won…
1. Turnout 2. Late Breaking Undecideds 3. Minority Support
2012 2016
Percentage of Vote among… Obama Clinton
African-American 93% 88%
Latino 71% 65%

L P L F i n a n c i a l M e m b e r F I N R A / S I P C
1 0
Why Clinton Lost and Trump Won…
Why Clinton Lost and Trump Won…
1. Turnout 2. Late Breaking Undecideds 3. Minority Support 4. Who was a “better person” didn’t decide election

L P L F i n a n c i a l M e m b e r F I N R A / S I P C
1 1
Source: ABC news 11/9/16
Why Clinton Lost and Trump Won…
Which Bothered you more? State Clinton’s Emails Trump’s Treatment of Women Difference
Virginia 42% 53% +11 New Mexico 44% 54% +11
Florida 44% 53% +9 Pennsylvania 44% 53% +9
Iowa 44% 51% +7 Michigan 43% 50% +7
New Hampshire 46% 53% +7 Wisconsin 45% 52% +7
Ohio 46% 48% +2 Nevada 46% 47% +1 Arizona 49% 48% -1 Texas 50% 43% -7
National 45% 51% +6
L P L F i n a n c i a l M e m b e r F I N R A / S I P C
1 2
Why Clinton Lost and Trump Won…
TRump = Outsider Clinton = Its My Turn
1. Turnout 2. Late Breaking Undecideds 3. Minority Support 4. Who was a “better person” didn’t decide election 5. Main reason to run

L P L F i n a n c i a l M e m b e r F I N R A / S I P C
1 3
Why Clinton Lost and Trump Won…
Clinton = Its My Turn
1. Turnout 2. Late Breaking Undecideds 3. Minority Support 4. Who was a “better person” didn’t decide election 5. Main reason to run
Just Ask The Last 4 “its my turn” candidates:
President Gore President Dole
President McCain President Kerry

L P L F i n a n c i a l M e m b e r F I N R A / S I P C
1 4
Why Clinton Lost and Trump Won…
TRump = Outsider
1. Turnout 2. Late Breaking Undecideds 3. Minority Support 4. Who was a “better person” didn’t decide election 5. Main reason to run
The european election playbook: Strong Nationalism
And Anti-corruption

L P L F i n a n c i a l M e m b e r F I N R A / S I P C
1 5
Why Clinton Lost and Trump Won…
1. Turnout 2. Late Breaking Undecideds 3. Minority Support 4. Who was a “better person” didn’t decide election 5. Main reason to run 6. White Working Class Became the Largest Voting Minority

L P L F i n a n c i a l M e m b e r F I N R A / S I P C
1 6
Data for 2016 were collected by Edison Research for the National Election Pool, a consortium of ABC News, The Associated Press, CBSNews, CNN, Fox News and NBC News. The voter survey is based on questionnaires completed by 24,537 voters leaving 350 voting places throughout the United States on Election Day including 4,398 telephone interviews with early and absentee voters.
Why Clinton Lost and Trump Won…
1. Turnout 2. Late Breaking Undecideds 3. Minority Support 4. Who was a “better person” didn’t decide election 5. Main reason to run 6. White Working Class Became the Largest Voting Minority

L P L F i n a n c i a l M e m b e r F I N R A / S I P C
1 7 1 7
WHAT HAPPENS NOW?

L P L F i n a n c i a l M e m b e r F I N R A / S I P C
1 8
Source: LPL Research, FactSet 11/03/16 Please note: The modern design of the S&P 500 stock index was first launched in 1957. Performance back to 1950 incorporates the performance of predecessor index, the S&P 90. Indices are unmanaged index and cannot be invested into directly. Unmanaged index returns do not reflect fees, expenses, or sales charges. Index performance is not indicative of the performance of any investment. Past performance is no guarantee of future results.
End-of-Year Equities Historically Tend to Be Strong
S&P 500 Performance in November and December (Since 1950)*
Year of Presidential Cycle Average Return % Positive
1 2.3% 75.0%
2 4.5% 76.5%
3 3.1% 82.4%
4 2.5% 75.0%

L P L F i n a n c i a l M e m b e r F I N R A / S I P C
1 9
Jan Source: LPL Research, FactSet 09/05/16 Study covers 16 election cycles back to 1952. Indexes are unmanaged and cannot be invested in directly. Past performance is no guarantee of future results.
Presidential Cycle Pattern Suggests Volatile Summer and Late-Year Rally
6
2
8%
0
4
Mar May Jul Feb Apr Jun Aug Dec
Average Election Year since 1950 (S&P 500)
Sep Oct Nov

L P L F i n a n c i a l M e m b e r F I N R A / S I P C
2 0
Year Winning President Party Return From Election Day Till
Inauguration Day 1952 Eisenhower Republican 6.3% 1956 Eisenhower Republican -6.7% 1960 Kennedy Democrat 8.8% 1964 Johnson Democrat 1.7% 1968 Nixon Republican -1.4% 1972 Nixon Republican 4.2% 1976 Carter Democrat -0.1% 1980 Reagan Republican 2.0% 1984 Reagan Republican 2.8% 1988 Bush Republican 4.2% 1992 Clinton Democrat 3.2% 1996 Clinton Democrat 8.8% 2000 Bush Republican -6.2% 2004 Bush Republican 4.0% 2008 Obama Democrat -19.9% 2012 Obama Democrat 4.0%
Average 1.0% Median 3.0% % Higher 68.8%
Source: LPL Research, FactSet 10/30/16.
What Happens from Election Day until Inauguration Day?

L P L F i n a n c i a l M e m b e r F I N R A / S I P C
2 1
S&P 500 Performance Under Recent Presidents Inauguration Date Party S&P 500 Return During Term
Eisenhower 1/20/53 Republican 26.14 69.9% Eisenhower 1/21/57 Republican 44.4 35.0%
Kennedy 1/20/61 Democrat 59.96 16.1% Johnson 11/22/63 Democrat 69.61 24.4% Johnson 1/20/65 Democrat 86.6 17.4%
Nixon 1/20/69 Republican 101.69 16.8% Nixon 1/20/73 Republican 118.78 -31.9% Ford 8/9/74 Republican 80.86 27.3%
Carter 1/20/77 Democrat 102.97 27.9% Reagan 1/20/81 Republican 131.65 33.1% Reagan 1/21/85 Republican 175.23 63.6%
Bush 1/20/89 Republican 286.63 51.2% Clinton 1/20/93 Democrat 433.37 79.2% Clinton 1/20/97 Democrat 776.70 72.9% Bush 1/20/01 Republican 1342.54 -12.4% Bush 1/20/05 Republican 1175.41 -31.5%
Obama 1/20/09 Democrat 805.22 84.5% Obama 1/21/13 Democrat 1485.98 44.9%
Clinton/Trump 1/20/17 ? ? ?
Stocks Tend to Do Well Regardless of the Party in Power
Source: LPL Research, FactSet 10/30/16 Indices are unmanaged index and cannot be invested into directly. Unmanaged index returns do not reflect fees, expenses, or sales charges. Index performance is not indicative of the performance of any investment. Past performance is no guarantee of future results.

L P L F i n a n c i a l M e m b e r F I N R A / S I P C
2 2
Indexes are unmanaged index and cannot be invested into directly. Unmanaged index returns do not reflect fees, expenses, or sales charges. Index performance is not indicative of the performance of any investment. Past performance is no guarantee of future results.
A Recession After a Two-Term President Is Very Common
President Party Term Recession? Time Until Recession After Left Office
TheodoreRoosevelt R Sep1901-Mar1909 Feb1910-Dec1912 11monthsWoodrowWilson D Mar1913-Mar1921 Feb1920-Jul1921 InrecessionwhenleCoffice
FranklinD.Roosevelt D Mar1933-Apr1945 Mar1945-Oct1945 InrecessionwhenleCofficeDwightD.Eisenhower R Jan1953-Jan1961 May1960-Feb1961 InrecessionwhenleCoffice
JohnF.Kennedy/LyndonB.Johnson D Jan1961-Jan1969 Jan1970-Nov1970 12monthsRichardNixon/GeraldFord R Jan1969-Jan1977 No Norecession
RonaldReagan R Jan1981-Jan1989 Aug1990-Mar1991 19monthsBillClinton D Jan1993-Jan2001 Apr2001-Nov2001 3months
GeorgeW.Bush R Jan2001-Jan2009 Jan2008-Jun2009 InrecessionwhenleCofficeBarackObama D Jan2009-Jan2017 ? ?

L P L F i n a n c i a l M e m b e r F I N R A / S I P C
2 3 2 3
WHAT WILL TRUMP DO?

L P L F i n a n c i a l M e m b e r F I N R A / S I P C
2 4
Trump’s Gettysburg Address
1. Take on Corruption 2. Improve the Economy and Employment 3. Security and Freedoms

L P L F i n a n c i a l M e m b e r F I N R A / S I P C
2 5
Trump’s Gettysburg Address
1. Take on Corruption
2. Improve the economy and employment 3. Security and Freedoms
• Term limits for Congress • Hiring freeze of Fed workers • Lobbyist reforms

L P L F i n a n c i a l M e m b e r F I N R A / S I P C
2 6
Trump’s Gettysburg Address
1. Take on Corruption 2. Improve the economy and employment
3. Security and Freedoms
• Fix NAFTA and Withdraw from TPP • Declare China is a Currency Manipulator • Open up Energy (Keystone, etc) • Stop Supporting Climate Change • Change Affordable Care Act • Tax Reform • Tariff on Companies that Send Jobs Overseas

L P L F i n a n c i a l M e m b e r F I N R A / S I P C
2 7
Trump’s Gettysburg Address
1. Take on Corruption 2. Improve the economy and employment 3. Security and Freedoms
• Immigration • Supreme Court

L P L F i n a n c i a l M e m b e r F I N R A / S I P C
2 8
Things to Watch Under a Trump Presidency
1. Regulation Rollback and Infrastructure 2. Trade 3. Climate Change 4. Taxes • RegulaZonRollback
(Energy,Financials,Healthcare)
• Infrastructure-$1T?• InflaZonontheriseand
Fedfastertoact

L P L F i n a n c i a l M e m b e r F I N R A / S I P C
2 9
Source: LPL Research, FactSet 11/03/16 Indexes are unmanaged index and cannot be invested into directly. Past performance is no guarantee of future results. Data measured by S&P 500 GICS Subindexes
2-Day Sector Returns
S&P
500
Ener
gy
Mate
rials
Indu
stria
ls
Cons
umer
Di
scre
tiona
ry
Cons
umer
St
aples
Healt
hcar
e
Fina
ncial
s
Info
rmat
ion
Tech
nolo
gy
Real
Esta
te
Utilit
ies
2 Day 1.3 2.0 3.1 4.5 0.6 -4.0 4.5 7.8 -1.8 -4.1 -6.0
RegulaZonRollback

L P L F i n a n c i a l M e m b e r F I N R A / S I P C
3 0
Source: LPL Research, FactSet 11/03/16 Indexes are unmanaged index and cannot be invested into directly. Past performance is no guarantee of future results.
2-Day Sector Returns
S&P
500
Ener
gy
Mate
rials
Indu
stria
ls
Cons
umer
Di
scre
tiona
ry
Cons
umer
St
aples
Healt
hcar
e
Fina
ncial
s
Info
rmat
ion
Tech
nolo
gy
Real
Esta
te
Utilit
ies
2 Day 1.3 2.0 3.1 4.5 0.6 -4.0 4.5 7.8 -1.8 -4.1 -6.0
Infrastructure(TheWall)

L P L F i n a n c i a l M e m b e r F I N R A / S I P C
3 1
Source: LPL Research, FactSet 11/03/16 Indexes are unmanaged index and cannot be invested into directly. Past performance is no guarantee of future results.
2-Day Sector Returns
S&P
500
Ener
gy
Mate
rials
Indu
stria
ls
Cons
umer
Di
scre
tiona
ry
Cons
umer
St
aples
Healt
hcar
e
Fina
ncial
s
Info
rmat
ion
Tech
nolo
gy
Real
Esta
te
Utilit
ies
2 Day 1.3 2.0 3.1 4.5 0.6 -4.0 4.5 7.8 -1.8 -4.1 -6.0
InterestRateSensiZves

L P L F i n a n c i a l M e m b e r F I N R A / S I P C
3 2
Things to Watch Under a Trump Presidency
• EmergingMarkets• InternaZonal• MulZ-NaZonals
1. Early Trades 2. Trade 3. Climate Change 4. Taxes
L P L F i n a n c i a l M e m b e r F I N R A / S I P C
3 3
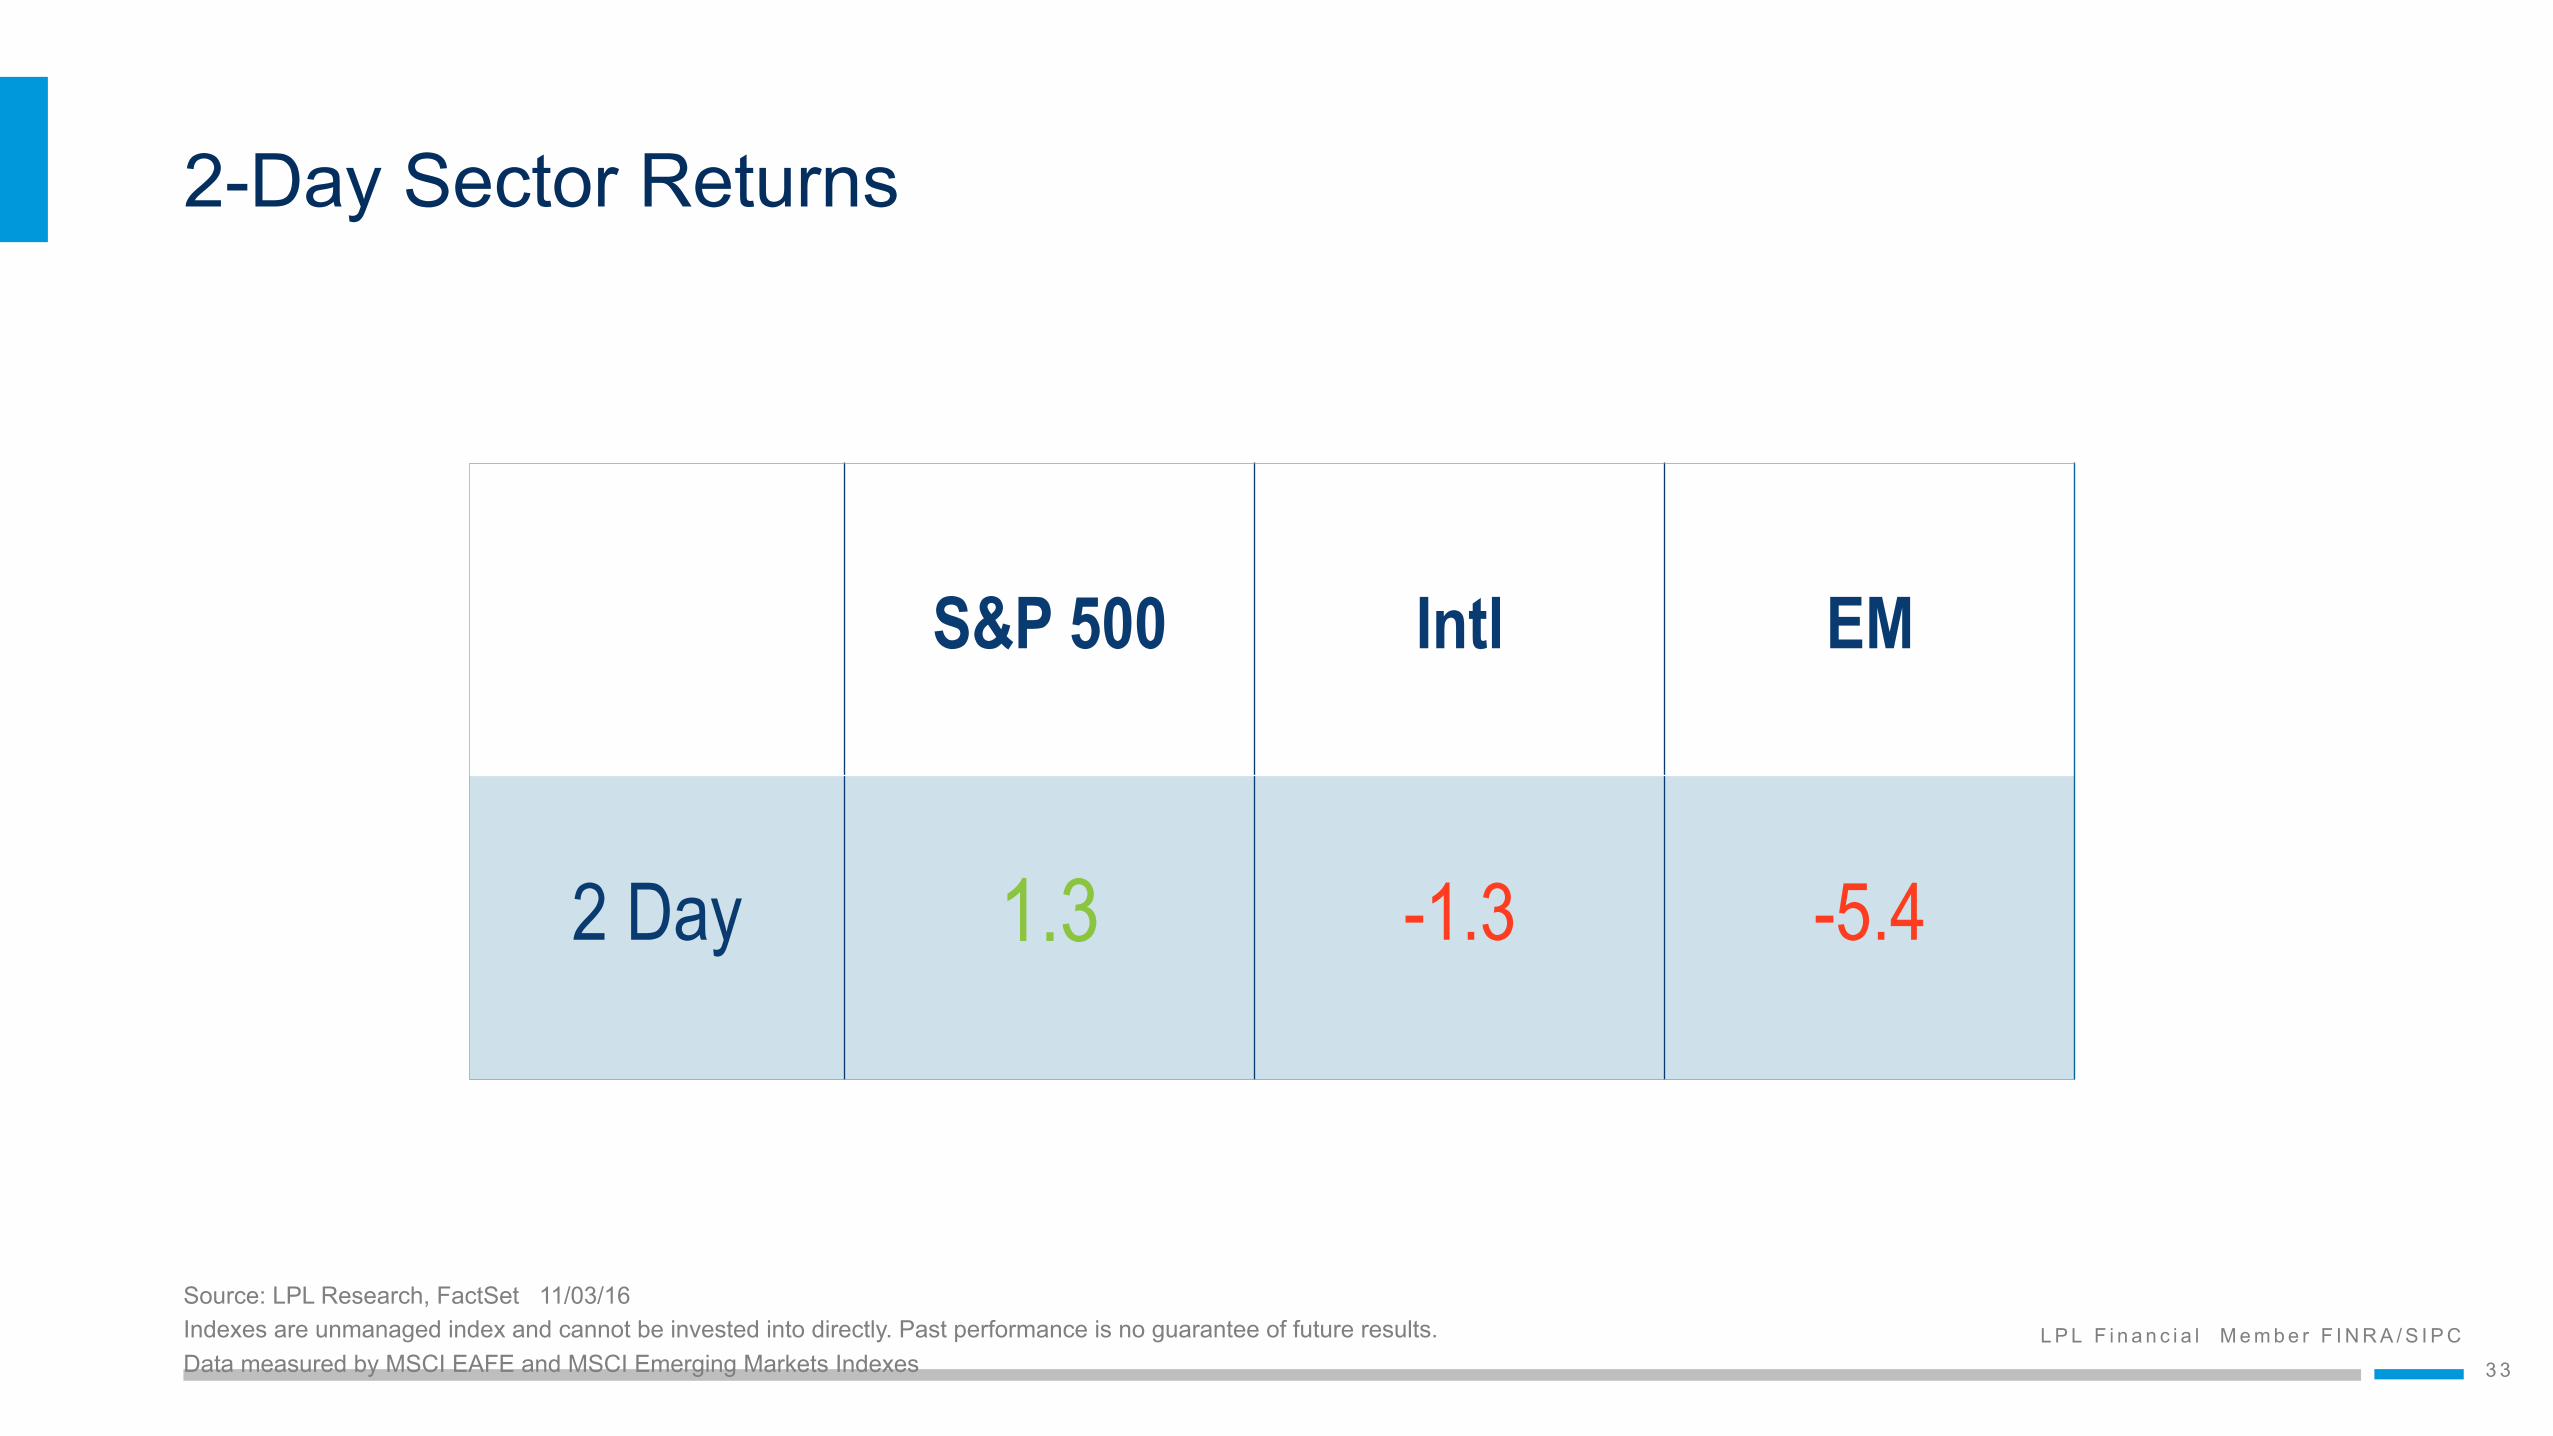
Source: LPL Research, FactSet 11/03/16 Indexes are unmanaged index and cannot be invested into directly. Past performance is no guarantee of future results. Data measured by MSCI EAFE and MSCI Emerging Markets Indexes
2-Day Sector Returns
S&P 500 Intl EM
2 Day 1.3 -1.3 -5.4
L P L F i n a n c i a l M e m b e r F I N R A / S I P C
3 4
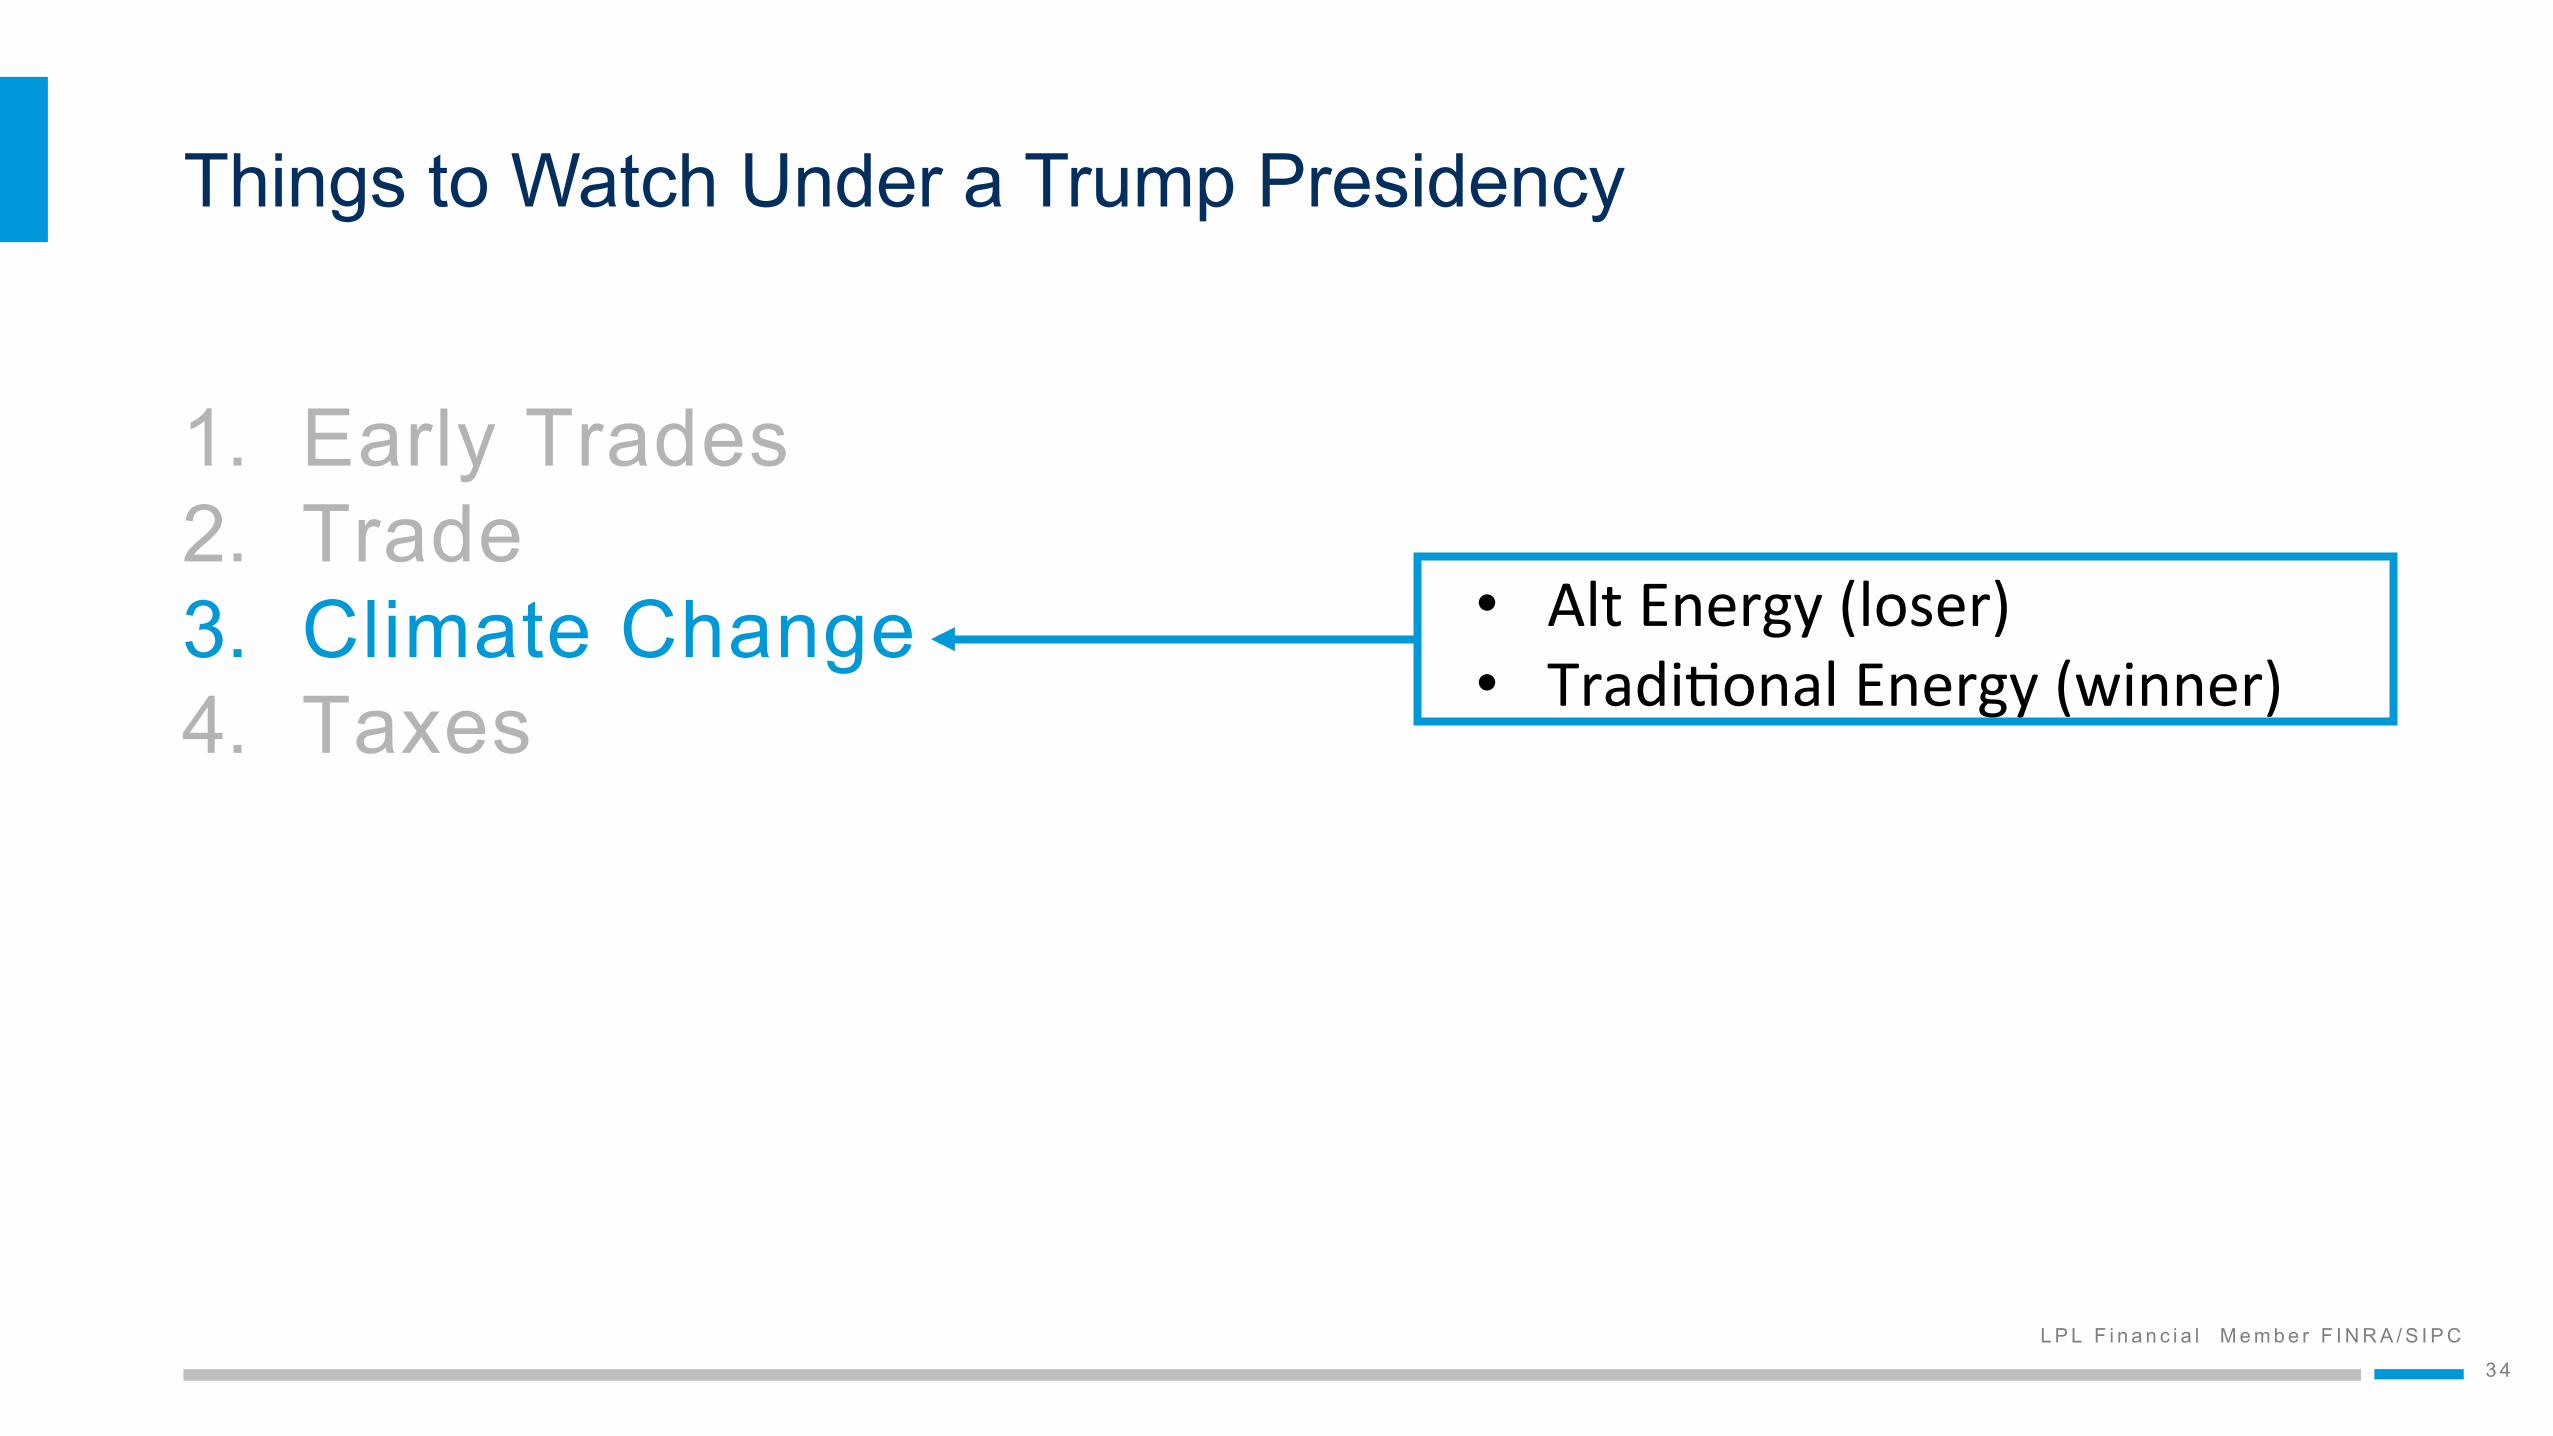
Things to Watch Under a Trump Presidency
• AltEnergy(loser)• TradiZonalEnergy(winner)
1. Early Trades 2. Trade 3. Climate Change 4. Taxes

L P L F i n a n c i a l M e m b e r F I N R A / S I P C
3 5
Source: LPL Research, FactSet 11/03/16 Data measured by S&P 500 GICS Subindexes
2-Day Sector Returns
Energy Clean Energy
2 Day 2.0 -7.7
L P L F i n a n c i a l M e m b e r F I N R A / S I P C
3 6
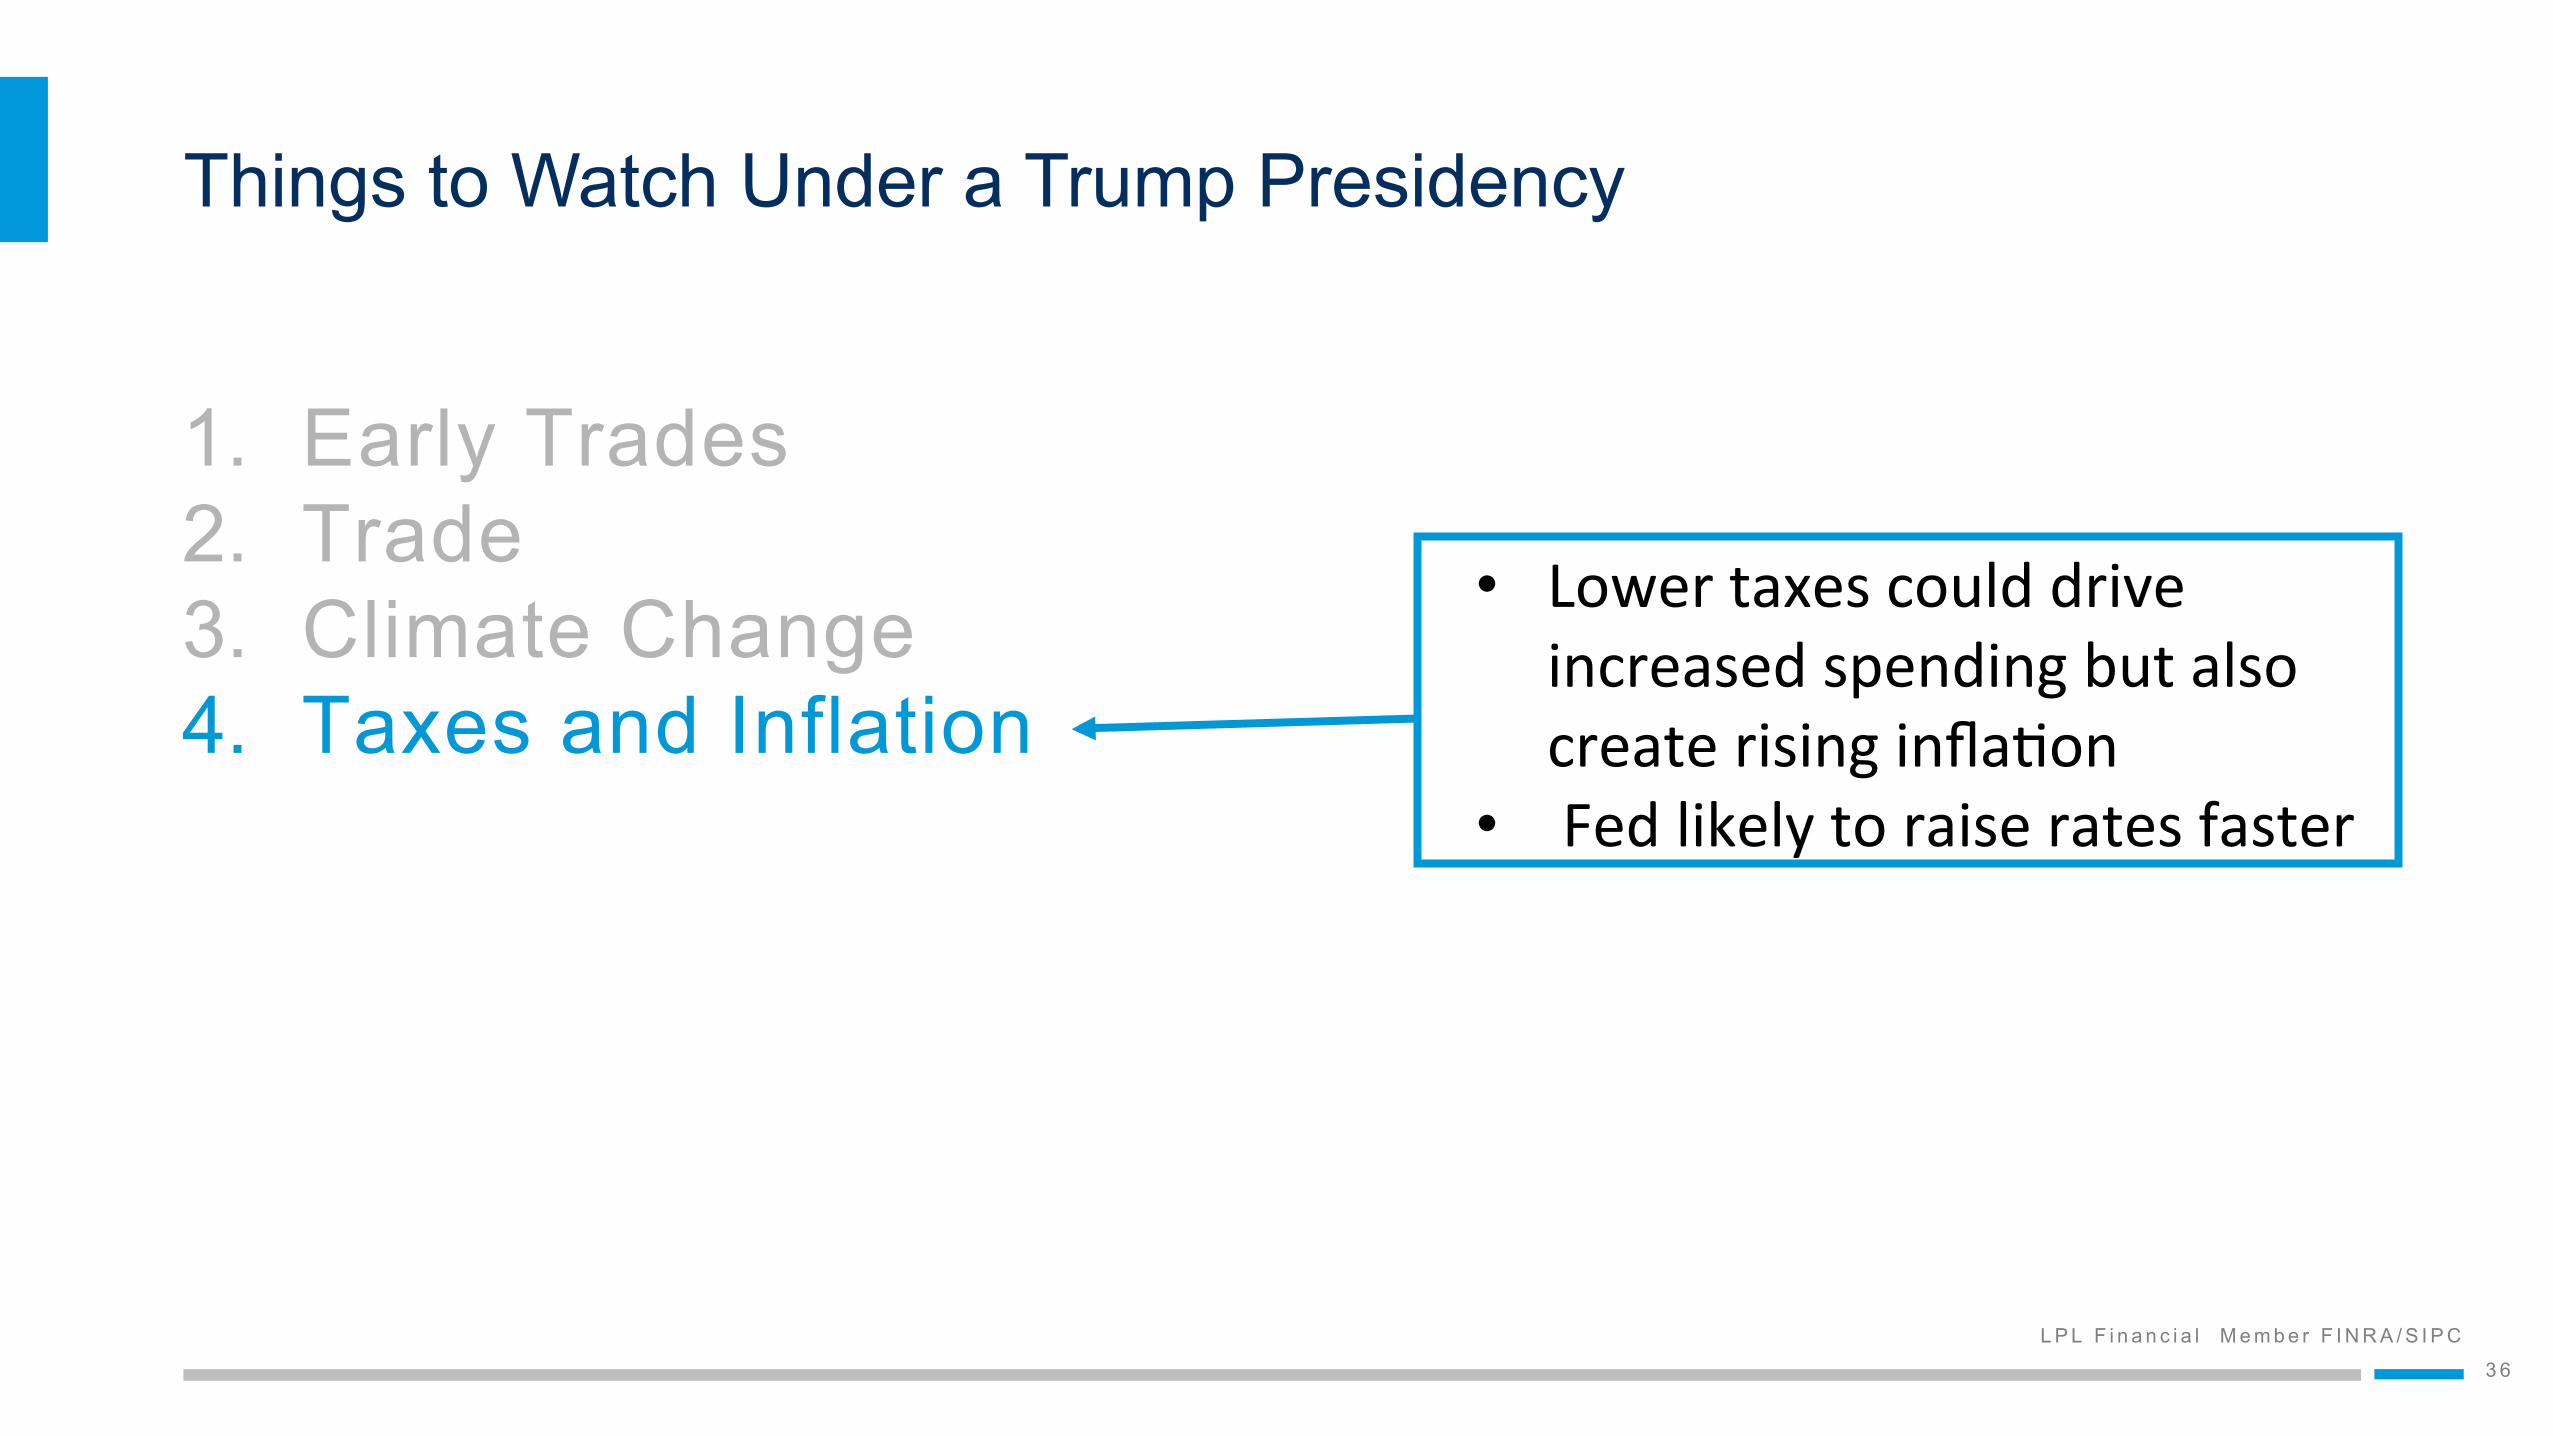
Things to Watch Under a Trump Presidency
• LowertaxescoulddriveincreasedspendingbutalsocreaterisinginflaZon
• Fedlikelytoraiseratesfaster
1. Early Trades 2. Trade 3. Climate Change 4. Taxes and Inflation

L P L F i n a n c i a l M e m b e r F I N R A / S I P C
3 7 3 7
Fiscal/Deficit Spending Could Be Good for Job Growth and Drive the Fed To Raise Rates Faster

L P L F i n a n c i a l M e m b e r F I N R A / S I P C
3 8
Source: LPL Research, BEA 08/13/16
The Fed Is Hurting More than Helping Interest Received, $ Billions Interest Paid, $ Billions
0 1977
200
400
600
800
1000
1200
1400
$1600
1979 1981 1983 1985 1987 1989 1991 1993 1995 1997 1999 2001 2013 2015

L P L F i n a n c i a l M e m b e r F I N R A / S I P C
3 9
Source: LPL Research, FactSet 08/15/16 Actual Yields: 08/15/85 – 10.36% 08/15/01 – 5.00% 08/15/16 – 1.56% The rule of 72 is a common shortcut in which 72 is divided by an investment’s annual return to determine the number of years it will take for an investor’s money to double.
The Fed Is Hurting More than Helping
Years to Double Investment (Based on 10-Year Treasury Yield and the Rule of 72)
0 5 10 15 20 25 30 35 40 45
1985
2001
2016~6X
Longer
2XLonger Investmentwoulddouble
onlyonceoveravg.investor’sworkinglife

L P L F i n a n c i a l M e m b e r F I N R A / S I P C
4 0
The opinions voiced in this material are for general information only and are not intended to provide or be construed as providing specific investment advice or recommendations for any individual security.
There is no assurance that the techniques and strategies discussed are suitable for all investors or will yield positive outcomes. The purchase of certain securities may be required to affect some of the strategies.
Past performance is no guarantee of future results. All indexes are unmanaged and cannot be invested into directly. Unmanaged index returns do not reflect fees, expenses, or sales charges. Index performance is not indicative of the performance of any investment.
The economic forecasts set forth in the presentation may not develop as predicted.
Stock investing involves risk including loss of principal.
Because of their narrow focus, specialty sector investing, such as healthcare, financials, or energy, will be subject to greater volatility than investing more broadly across many sectors and companies.
Investing in foreign and emerging markets securities involves special additional risks. These risks include, but are not limited to, currency risk, geopolitical risk, and risk associated with varying accounting standards. Investing in emerging markets may accentuate these risks.
Commodity-linked investments may be more volatile and less liquid than the underlying instruments or measures, and their value may be affected by the performance of the overall commodities baskets as well as weather, geopolitical events, and regulatory developments.
IMPORTANT DISCLOSURES

L P L F i n a n c i a l M e m b e r F I N R A / S I P C
4 1
The S&P 500 Index is a capitalization-weighted index of 500 stocks designed to measure performance of the broad domestic economy through changes in the aggregate market value of 500 stocks representing all major industries.
The MSCI Emerging Markets Index is a free float-adjusted, market capitalization index that is designed to measure equity market performance of emerging markets.
The MSCI EAFE Index is a free float-adjusted, market-capitalization index that is designed to measure the equity market performance of developed markets, excluding the United States and Canada.
This research material has been prepared by LPL Financial LLC.
To the extent you are receiving investment advice from a separately registered independent investment advisor, please note that LPL Financial LLC is not an affiliate of and makes no representation with respect to such entity.
Not FDIC/NCUA Insured | Not Bank/Credit Union Guaranteed | May Lose Value | Not Guaranteed by any Government Agency | Not a Bank/Credit Union Deposit
Tracking # 1-556242
IMPORTANT DISCLOSURES