Is Tesla Revolutionary or Evolutionary?
46
www.ubs.com/investmentresearch This report has been prepared by UBS Securities LLC. ANALYST CERTIFICATION AND REQUIRED DISCLOSURES BEGIN ON PAGE 40. UBS does and seeks to do business with companies covered in its research reports. As a result, investors should be aware that the firm may have a conflict of interest that could affect the objectivity of this report. Investors should consider this report as only a single factor in making their investment decision. Global Research 15 August 2018 Is Tesla Revolutionary or Evolutionary? Lap 1: Powertrain – An Engineer's Dream, But An Accountant's Nightmare What's better than tearing down a Tesla Model 3? Tesla is now ramping production of the Model 3, the highest-profile car launch in the past decade. Last year, UBS Evidence Lab tore down an electric car to understand the progress of EV powertrains. This time, UBS Evidence Lab did not only tear down the new Tesla Model 3, we also tore down a 2014 BMW i3, and a 2017 Chevy Bolt to find out if Tesla deserves its reputation as the leader in electric powertrain and technology. This report focuses on EV powertrain, while subsequent reports will look at the electronics and fit & finish of all three vehicles. Surprise #1: Amazing powertrain tech falls short on cost Who won Lap 1 for EV powertrain? Tesla! All in, Tesla delivered the best powertrain at the lowest cost. Tesla's battery cost was $178/kWh vs. $205/kWh for the Chevy Bolt. TSLA's powertrain had the best power, torque and acceleration. The teardown engineers were crazy about the powertrain, highlighting next-gen, military-grade tech years ahead of peers. However, the excitement did not translate into large cost savings. TSLA indicated in 2016 that the Model S battery was already <$190/kWh; therefore, $178/kWh reflects <6% improvement. The powertrain cost was $950 higher than we forecast. With these economics, we expect the $35k base Model 3 to lose ~$6k/car. Surprise #2: Semi content rises 10%, while high voltage wiring falls 48% The Tesla Model 3 shifted to silicon carbide in the inverter, which offers major system benefits through higher efficiency, extending range and providing more heat tolerance. This resulted in a 10% increase in semi content in the powertrain. On the other hand, the more efficient design of the powertrain resulted in a 48% reduction in HV cabling. Surprise #3: Powertrain vertical integration significantly higher Almost all the design recommendations from our Chevy Bolt teardown were already incorporated into the Model 3. Our experts attribute much of the Model 3 engineering leadership to higher vertical integration. Outside of Panasonic battery cells, the entire EV powertrain was done in-house at TSLA. In contrast, LG alone supplied ~90% of the Chevy Bolt's powertrain content. Traditional automakers may need to bring more in- house, or more likely, leverage suppliers with broad EV capabilities. Equities Global Automobiles Colin Langan, CFA Analyst [email protected] +1-212-713 9949 Gene Vladimirov, CFA Associate Analyst [email protected] +1-212-713-1091 Patrick Hummel, CFA Analyst [email protected] +41-44-239 79 23 David Lesne Analyst [email protected] +44-20-7567 5815 Julian Radlinger, CFA Analyst [email protected] +44-20-7568 1171 Kohei Takahashi Analyst [email protected] +81-3-5208 6172 Paul Gong Analyst [email protected] +852-2971 7868 Eugene Jung Analyst [email protected] +82 2 3702 8801 David Mulholland, CFA Analyst [email protected] +44-20-7568 4069 Kenji Yasui Analyst [email protected] +81-3-5208 6211 Timothy Arcuri Analyst [email protected] +1-415-352 5676 Nicolas Gaudois Analyst [email protected] +852-2971 5681
Transcript of Is Tesla Revolutionary or Evolutionary?

www.ubs.com/investmentresearch
This report has been prepared by UBS Securities LLC. ANALYST CERTIFICATION AND REQUIRED DISCLOSURES BEGIN ON PAGE 40. UBS does and seeks to do business with companies covered in its research reports. As a result, investors should be aware that the firm may have a conflict of interest that could affect the objectivity of this report. Investors should consider this report as only a single factor in making their investment decision.
Global Research 15 August 2018
Is Tesla Revolutionary or Evolutionary? Lap 1: Powertrain – An Engineer's Dream, But An Accountant's Nightmare
What's better than tearing down a Tesla Model 3? Tesla is now ramping production of the Model 3, the highest-profile car launch in the past decade. Last year, UBS Evidence Lab tore down an electric car to understand the progress of EV powertrains. This time, UBS Evidence Lab did not only tear down the new Tesla Model 3, we also tore down a 2014 BMW i3, and a 2017 Chevy Bolt to find out if Tesla deserves its reputation as the leader in electric powertrain and technology. This report focuses on EV powertrain, while subsequent reports will look at the electronics and fit & finish of all three vehicles.
Surprise #1: Amazing powertrain tech falls short on cost Who won Lap 1 for EV powertrain? Tesla! All in, Tesla delivered the best powertrain at the lowest cost. Tesla's battery cost was $178/kWh vs. $205/kWh for the Chevy Bolt. TSLA's powertrain had the best power, torque and acceleration. The teardown engineers were crazy about the powertrain, highlighting next-gen, military-grade tech years ahead of peers. However, the excitement did not translate into large cost savings. TSLA indicated in 2016 that the Model S battery was already <$190/kWh; therefore, $178/kWh reflects <6% improvement. The powertrain cost was $950 higher than we forecast. With these economics, we expect the $35k base Model 3 to lose ~$6k/car.
Surprise #2: Semi content rises 10%, while high voltage wiring falls 48% The Tesla Model 3 shifted to silicon carbide in the inverter, which offers major system benefits through higher efficiency, extending range and providing more heat tolerance. This resulted in a 10% increase in semi content in the powertrain. On the other hand, the more efficient design of the powertrain resulted in a 48% reduction in HV cabling.
Surprise #3: Powertrain vertical integration significantly higher Almost all the design recommendations from our Chevy Bolt teardown were already incorporated into the Model 3. Our experts attribute much of the Model 3 engineering leadership to higher vertical integration. Outside of Panasonic battery cells, the entire EV powertrain was done in-house at TSLA. In contrast, LG alone supplied ~90% of the Chevy Bolt's powertrain content. Traditional automakers may need to bring more in-house, or more likely, leverage suppliers with broad EV capabilities.
Equities
Global
Automobiles
Colin Langan, CFA Analyst
[email protected] +1-212-713 9949
Gene Vladimirov, CFA Associate Analyst
[email protected] +1-212-713-1091
Patrick Hummel, CFA Analyst
[email protected] +41-44-239 79 23
David Lesne Analyst
[email protected] +44-20-7567 5815
Julian Radlinger, CFA Analyst
[email protected] +44-20-7568 1171
Kohei Takahashi Analyst
[email protected] +81-3-5208 6172
Paul Gong Analyst
[email protected] +852-2971 7868
Eugene Jung Analyst
[email protected] +82 2 3702 8801
David Mulholland, CFA Analyst
[email protected] +44-20-7568 4069
Kenji Yasui Analyst
[email protected] +81-3-5208 6211
Timothy Arcuri Analyst
[email protected] +1-415-352 5676
Nicolas Gaudois Analyst
[email protected] +852-2971 5681

Is Tesla Revolutionary or Evolutionary? 15 August 2018
2
Contents
Summary ........................................................................................... 3
Surprise #1: Tesla's powertrain not as cheap as expected ............................ 3
Surprise #2: More Semis Content, Less HV Wiring ....................................... 4
Surprise #3: More Vertically Integrated ........................................................ 4
Surprise #4: Battery Pack Cost ..................................................................... 7
Surprise #5: Base Model Unprofitable .......................................................... 8
Surprise #6: EV Pack Cost on Trend ............................................................. 9
Q: Who is Best & Worst Positioned? ............................................. 10
Sector Summaries........................................................................... 11
Global Autos.............................................................................................. 12
Global Auto Suppliers ................................................................................ 13
Global Batteries ......................................................................................... 14
Global Semis .............................................................................................. 14
Let the Race Begin! ........................................................................ 16
Q: Who Won Lap 1: Powertrain & Battery? ................................................ 17
The First Turn: The Battery ............................................................ 19
Straightaway: Battery Management & Charging ........................ 24
Final Turn: E-Motor & Inverter ...................................................... 28
Home Stretch: Cooling & Wiring ................................................... 33
Other Indirect EV Costs .............................................................................. 35
Appendix ........................................................................................ 36
Battery Background ................................................................................... 36
Colin Langan, CFA Analyst
[email protected] +1-212-713 9949
Gene Vladimirov, CFA Associate Analyst
[email protected] +1-212-713-1091
Patrick Hummel, CFA Analyst
[email protected] +41-44-239 79 23
David Lesne Analyst
[email protected] +44-20-7567 5815
Julian Radlinger, CFA Analyst
[email protected] +44-20-7568 1171
Kohei Takahashi Analyst
[email protected] +81-3-5208 6172
Paul Gong Analyst
[email protected] +852-2971 7868
Eugene Jung Analyst
[email protected] +82 2 3702 8801
David Mulholland, CFA Analyst
[email protected] +44-20-7568 4069
Kenji Yasui Analyst
[email protected] +81-3-5208 6211
Timothy Arcuri Analyst
[email protected] +1-415-352 5676
Nicolas Gaudois Analyst
[email protected] +852-2971 5681

Is Tesla Revolutionary or Evolutionary? 15 August 2018
3
Summary The UBS Evidence Lab hired engineers to tear down the 2017 Tesla Model 3, 2014 BMW i3 and 2017 Chevy Bolt. The UBS teardown experts provided a full breakdown of the vehicle of the major vehicle components including the Powertrain & Battery, the Controlling Electronics, the Body & Chassis, and the Interior & Safety. Each component was removed, studied, and scrutinized for a full view of the pros and cons of the design, functionality, the ease of manufacturing, and the cost of production. Lap 1 of our Teardown series will focus on the BEV (battery electric vehicle) powertrain. We discuss the top six surprising finding from our teardowns below.
Surprise #1: Tesla's powertrain not as cheap as expected While Tesla's powertrain was better than peers in terms of cost per kWh and performance, their lead was not as large as we would have expected. The overall cost at $178/kWh is only ~6% better than their <$190/kWh estimate for the Model S/X provided in 2016. Moreover, the cell cost at $148/kWh is well above Tesla's guidance of below $100/kWh ending 2018. We note that this cost estimate is based on our engineering partners' expertise and channel checks at the time the teardown was performed. We look forward to doing more detailed work with our partners in UBS Evidence Lab to better understand the breakdown of these costs. That said, Tesla's powertrain was $178/kWh vs. $205/kWh on the Chevy Bolt and $442/kWh on the 2014 BMW i3 (est. now at ~$300-320/kWh now). We'd expect future EVs from traditional automakers to have similar cost.
Figure 1: TSLA Model 3 Actual vs. Estimated Cost Figure 2: Tesla Model 3 vs. Chevy Bolt & BMW i3
Source: UBS Source: UBS
$16,900 $17,800
Model 3 Estimate Model 3 Actual
Interior & Safety Body & ChassisControlling Electronics Powertrain & Battery
+$950 higher
than our estimate
Lap 3
Lap 2
Tesla Model 3 2017 Chevy Bolt 2014 BMW i3Battery E Motor Power Distrib. Inverter Other
$178/kWh $205/kWh $442/kWh
(Gen 2 est. ~$300-320/kWh)
The UBS Evidence Lab tore down a Tesla Model 3, BMW i3, and Chevy Bolt to understand if Tesla is an EV and electronics leader.
At $148/kWh, Tesla's battery cell cost was well above its guidance for <$100/kWh by the end of 2018.

Is Tesla Revolutionary or Evolutionary? 15 August 2018
4
Surprise #2: More Semis Content, Less HV Wiring Overall, the semi content in the Model 3 was 10% (~$60) higher than the Chevy Bolt. However, the high voltage (HV) wiring content was about $160 lower than the Bolt. Despite the fact the Model 3 is more powerful and larger, it actually is slightly more than half of the cost of the Bolt's HV wiring. The key suppliers for semi content on the Model 3 are ST Micro & Texas Instruments. However, the significant decline in high voltage wiring is an incremental negative for suppliers like Aptiv, Leoni & Lear.
Figure 3: Powertrain Semiconductor Content Figure 4: HV Wiring & Harnessing Content
Source: UBS Source: UBS
Surprise #3: More Vertically Integrated While the cost of the Tesla powertrain was higher than expected, the teardown engineers are crazy for the powertrain, highlighting next-gen, military-grade tech that's years ahead of peers. The Model 3 appears to have been built with a goal of simplifying the engineering, removing components, and building things as modularly as possible. The inverter was embedded into the e-motor and gearbox. More impressively, the battery management and charging electronics merged the DC/DC converter, on board charger, and power distribution module into one simple unit (see basic illustration below). We see this as driving two possible shifts: 1) Suppliers needed a wider range of EV capabilities, or 2) automakers bringing these capabilities in-house.
$0
$100
$200
$300
$400
$500
$600
$700
Tesla Model 3 Chevy Bolt
OtherBattery ManagementOn-Board Charger & DC-DC ConverterHigh Voltage System ControllerInverted Module & Control
0
50
100
150
200
250
300
350
400
HV Charger Other HV Wiring/Harnessing
Chevy Bolt BMW i3 Tesla Model 3
The Model 3 had 10% higher semi content than the Chevy Bolt, but the HV wiring is almost 50% lower.
Tesla's vertical integration appears to be a crucial advantage allowing revolutionary designs

Is Tesla Revolutionary or Evolutionary? 15 August 2018
5
Figure 5: Battery Management & Charging Electronics Bolt vs. Model 3
Source: UBS
Broader is better on EV. If this is indeed the way of the future, an OEM shift to larger and integrated components would mean Tier 1 suppliers need to have a diversified expertise in electronics and potentially a larger piece of each vehicle. Overall, this would likely drive a separation of suppliers into winners and losers with electrical powertrain leaders becoming a larger part of vehicles and ancillary component makers losing content share. This shift may also drive incremental power to the suppliers as they become more crucial to an OEM.
This likely explains why BorgWarner acquired Sevon as it provides inverter capabilities and why Valeo formed a JV with Siemens at the end of 2016 which can supply the full system. It has already developed modules which are merging most of the moving parts. After 1.5 years, the JV has gained almost €11bn worth of orders. We estimate this should translate into a global market share for key EV components of 25% for EV powertrain related parts. Another example of increasing electrical capabilities among suppliers is the recent Toyota sale of an electric component factory to Denso. Nissan has also recently decided to sell key subsidiaries Calsonic Kansei (inverter) and AESC (battery).
If size matters most in electric components, we believe both Japanese suppliers and companies which deal with Japanese HEVs like Denso will be winners in the early phase of the electrification. Toyota, which sold 1.5m HEVs last year, will share key electric components such as the motor, inverter, converter, and others among its full HEVs, PHEVs, BEVs, and FVCs. The new FCV model “Mirai” actually shares the majority of its power electric components and modules with the “Prius”, which is a HEV. We see the Japanese, US and Korean OEMs as aggressively expanding full HEVs in the next 3-5 years. We note that 48V "mild" hybrid systems are too small to share electric components with BEVs, so suppliers with full HEV technology and components will enjoy the benefit of early adoption in our opinion.
Among the major auto suppliers, Conti, Denso, and Valeo appear to the most capable providers of BEV components. Each has electric motor and inverter capabilities, among the most important and expensive (outside the battery) components in an EV.
On-Board Charger DC-DC ConverterPower Distribution
ModuleBattery Mangagment
Module

Is Tesla Revolutionary or Evolutionary? 15 August 2018
6
Figure 6: Chevy Bolt EV Powertrain
Source: UBS
Figure 7: Model 3 Battery Mang. & Charging Electronics Figure 8: 3D Rendering of Model 3 Motor & Inverter
Source: UBS Source: UBS
OEMs bringing in-housing? The opposite case, however, would see much of the tech developed and kept in-house. Tesla's strides forward seem to be in large part due to its development of technologies in-house. As expected, the more complex and unique the technology, the more likely OEMs will develop it in house. A specific example of technology different that OEMs have mostly kept in house is the e-motor. E-motors have numerous designs which can help differentiate the EVs performance from competitors and thus far some OEMs seem dedicated to keeping the tech in-house.
DC-DC ConverterOn Board ChargerPower DistributionInverterE-Motor

Is Tesla Revolutionary or Evolutionary? 15 August 2018
7
Figure 9: In-House or Develop
Source: UBS
Surprise #4: Battery Pack Cost Battery packs-to-cell cost ratio suggests innovation progressing. Because Tesla uses cylindrical cells for the Model 3 battery, its cell to total pack cost ratio is ~83%. This compares to a Chevy Bolt ratio of ~70% for the cells and 30% for the pack. As battery technology advances, we expect cells to become a larger part of the pack cost as battery manufacturers/OEMs are able to remove production cost and are left primarily with raw materials cost.
Our previous expectations were for a similar 70/30 split to transition to an 80/20 split eventually but Tesla's ratio could suggest that the battery tech is advancing faster than expectations.
Figure 10: Model 3 vs. Bolt Battery Cell & Pack Costs Figure 11: Estimated Cost of 53 kWh Model 3 Pack
Actual 75 kWh
Pack
Est. 53 kWh
Pack
Material 1,162 95% 1,104
Labor/SG&A 1,041 71% 739
Total Pack 2,203
1,843
kWh 75
53
Price per kWh 29
35
Source: UBS Source: UBS
Relative to the Chevy Bolt, the Model 3 battery pack was cheaper due to several meaningful reasons: (1) Bolt pouch cells require additional metal and polymer enclosures, (2) the Bolt pack requires many more large bus-bars and a complex relay sub-system, (3) the Bolt has a large service disconnect assembly, and (4) the Model 3 has integrated temp sensors on control boards vs. the Bolt's independent sensors throughout the pack.
Battery Cap
(kWh) Battery Cells Battery Pack BMS Charger
Power
Distribution
DC-DC
Converter Inverter E-Motor Gearbox Cooling
Tesla Model 3 (2017) LR 75 Pansonic Various
Tesla Model S (2013) 100D 90 Pansonic Various
BMW i3 (2014) Ext Range 22 Samsung SDI Preh NA NA NA Various
Nissan Leaf (2017) LR 40 AESC AESC
Calsonic
Kansei Panasonic NA NA
Calsonic
Kansei Aichi Machine NA
Chevy Bolt (2017) 60 LG Chem LG Chem
LG Innotek/
LG Chem Various
LG Innotek/
LG Chem
LG Innotek/
LG Chem
LG Innotek/
LG Chem LG Electronics LG Electronics Various
BYD E6 LR (2016) 75 NA
Hyundai Kona Electric 64 LG Chem
HL Green
Power*
Hyundai
Mobis
Hyundai
Mobis NA
Hyundai
Mobis
Hyundai
Mobis
Hyundai
Mobis NA NA
Kia Niro EV 64 SK Innovation
HL Green
Power*
Hyundai
Mobis
Hyundai
Mobis NA
Hyundai
Mobis
Hyundai
Mobis
Hyundai
Mobis NA NA
External In-house
$148 $145
$29 $60
Model 3 Bolt
~$1,400 Lower Pack Cost
Pack costs are falling faster than expected.

Is Tesla Revolutionary or Evolutionary? 15 August 2018
8
Figure 12: Model 3 Pack Cost Split Figure 13: Model 3 Pack Cost Split
Source: UBS Source: UBS
Most expensive Battery Management. The battery management and charging electronics were extremely well engineered and enabled $160 in savings around high voltage wiring. However, it did not result in overall cost savings. The system was actually $350 more expensive than the combined Bolt systems (DC/DC converter, power distribution module, and on board charger), more than offsetting the cost savings on wiring.
Surprise #5: Base Model Unprofitable The Model 3 we disassembled was $49,000 which included the 75 kWh battery (+$9,000) and the high end trim (+$5,000). We estimate this model has a factory variable margin of ~29%, a gross margin of ~18%, and an operating margin of ~7%. However, the incremental margins on the options are high. We assume the base version at $35,000 would lose about $5,900 per car.
Figure 14: Tesla Profit Analysis
Source: UBS
Material 53%
Process & Labor 47%
Housing 20%
Cooling 11%
Battery Monitor
10% Sensor Stips 10%
Pack Cover 4%
Other 45%
14,280
3,630
-5,900
FactoryVariable
Profit
D&A,Warranty &
Freight
R&D SG&A OperatingProfit
53 kWhBattery
Lower Trim OperatingProfit Base
Based on the teardown, we believe the base Tesla Model 3 will lose $5.9k per car.

Is Tesla Revolutionary or Evolutionary? 15 August 2018
9
Surprise #6: EV Pack Cost on Trend We are forecasting ~6% annual reduction in cell & pack costs through 2025. At $178/kWh, this would be ~2 years ahead of our forecast. However, Tesla uses NCA batteries, which have been used in consumer applications for longer than NMC, and therefore we expected these costs to be lower today. Moreover, we estimate that cost of the 53 kWh pack will be slightly higher than the 75 kWh. This would offer comparable range to the Chevy Bolt today. The cell cost of $148/kWh should be unchanged; however the pack costs we estimate increases from $29/kWh to ~$35/kWh. This implies that a luxury ICE is about $5,700 cheaper up front than an EV today.
Figure 15: EV Battery Cost Projections Figure 16: Updated EV vs. ICE Upfront Cost Comparison
Source: UBS Source: UBS
For additional color, please see our companion notes:
Tesla – Teardown Gives Us a View on Model 3 P&L
Semis: Who's powering Tesla's Model 3?
$205 $183 $178
$130
2017 2018 2019 2020 2021 2022 2023 2024 2025
$14,200
$8,500
$6,500
TSLA Powertrain (53kWh)
Luxury ICE Mass Market ICE
Battery (53 kWh) EV Powertrain ICE
Tesla's use of non-standard NCA battery chem allows a cheaper battery; b/c of this, we can't extrapolate overall EV battery costs for the industry.

Is Tesla Revolutionary or Evolutionary? 15 August 2018
10
Q: Who is Best & Worst Positioned?

Is Tesla Revolutionary or Evolutionary? 15 August 2018
11
Sector Summaries In Figure 17 below, we recap the best and worst positioned based on the teardown.
Figure 17: Who are the best and worst positioned?
Sector Best Positioned Worst Positioned Sector Comments
Auto OEMs Daimler FCA The Model 3 teardown showed continued declines in EV costs, consistent with our prior
outlook. Earlier cost parity implies sooner and higher returns on EVs, in particular in the
premium segment and, regionally, speaking, in Europe. European OEMs can also benefit from a
strong tailwind to CO2 fleet targets post 2020. The flipside of the accelerated shift is the
residual value to fincos and lower contribution from highly profitable aftermarket long-term.
Volkswagen PSA
Renault Subaru
GM
Toyota
Auto Suppliers Valeo Schaeffler Suppliers with strong exposure to EV/hybrid and other megatrends (AV, connectivity, LED, etc)
will likely outperform industry growth, while those with big ICE exposure are likely to
underperform. Incrementally the EV wiring opportunity is shrinking fast which implies the EV
upside for suppliers like APTV, LEA, and Leoni is more limited. While in our Bolt teardown we
saw risk from competition from non-traditional suppliers (LG), the Model 3 teardown highlights
in-sourcing risks at the OEMs and/or the need for suppliers with broad EV capabilities.
Conti Faurecia
Delphi Tenneco
Hyundai Mobis
Denso
Batteries LG Chem While the Model 3 used NCA chemistry, we continued to believe NMC will be the long term
winner having better safety characteristics today and potentially lower cost over time. The
battery suppliers with NMC scale like LG Chem and Samsung SDI look best positioned long
term. Panasonic’s issue today is its single biggest customer: TSLA. If & when the company is
able to make a deal with an OEM such as Toyota, it would likely stabilize its business.
Samsung SDI
Panasonic
Chemicals Sumitomo Chem Johnson Matthey The Model 3 teardown did not drive any material changes vs. our previous view on the impact
from the shift to EVs. The most negative impacts should be to the autocatalysts producers. The
risks to consider are hydrogen growth and process catalyst companies. Hitachi Chem EMS Chemie
Umicore
Albermarle
Semiconductors Infineon Melexis Tesla's approach to in-housing its modules does not appear to be lowering the semi content –
but is changing the mix (less MCU content than Bolt). Its adoption of Silicon Carbide (SiC) in
the inverter could help to accelerate that shift. Overall, it reinforces our view that EVs provide a
significant content opportunity to semis – especially power semi suppliers.
Source: UBS

Is Tesla Revolutionary or Evolutionary? 15 August 2018
12
Figure 18: Global Team Analysts
Sector Region Analyst Email
Autos & Auto Parts Americas Colin Langan [email protected]
Autos & Auto Parts Americas Gene Vladimirov [email protected]
Autos & Auto Parts EMEA Patrick Hummel [email protected]
Autos & Auto Parts EMEA Julian Radlinger [email protected]
Autos & Auto Parts EMEA David Lesne [email protected]
Autos & Auto Parts EMEA Benedikt Baumann [email protected]
Autos & Auto Parts APAC Kohei Takahashi [email protected]
Autos & Auto Parts APAC Paul Gong [email protected]
Autos & Auto Parts APAC Eugene Jung [email protected]
Autos & Auto Parts APAC Sonal Gupta [email protected]
Autos & Auto Parts Americas Rogerio Araujo [email protected]
Batteries APAC Tim Bush [email protected]
Batteries APAC Kenji Yasui [email protected]
Chemicals Americas John Roberts [email protected]
Chemicals Americas Josh Spector [email protected]
Chemicals APAC Go Miyamoto [email protected]
Chemicals EMEA Andrew Stott [email protected]
Chemicals EMEA Geoff Haire [email protected]
Semis Americas Tim Arcuri [email protected]
Semis Americas John Ahn [email protected]
Semis EMEA David Mulholland [email protected]
Semis EMEA Francois-Xavier Bouvignies [email protected]
Semis APAC Nicolas Gaudois [email protected]
Semis APAC Bill Lu [email protected]
Semis APAC Taewoo Lee [email protected]
Source: UBS
Global Autos In the US, GM remains well positioned for the transition to EVs. While the Bolt's engineering was not as advanced as the Model 3, the overall package relative to the cost of the system was still impressive. Recently, GM said it would increase production of its Chevy Bolt by 20% in Q4 2018 due to increasing demand for the model. It noted that sales increased by over 40% in H1 2018. In 2017, the company sold ~28.5k Chevy Bolts.
In the European space, we see Daimler, Volkswagen and Renault best positioned for the transition to EVs. All three OEMs will launch dedicated EV platforms within 1-2 years and have aggressive model launch targets. Moreover, all three OEMs guide for at least a breakeven EBIT margin for their BEVs by 2020 or shortly thereafter. Daimler is the best-positioned premium OEM in our view: Daimler will launch 8 BEV models by 2022 and has already managed EBIT margin expectations by guiding for 8-10% during the transition phase (instead of 10%). The first of these models, the EQC SUV, will launch in early 2019. Volkswagen has the advantage of utilizing its dedicated platform(s) across brands and segments, which should reduce costs and group margin dilution. It will launch the first Audi BEV before year-end, followed by Porsche's first BEV and multiple mass-market BEVs amongst the VW, Skoda and Seat brands in quick succession starting in early 2020. Renault's advantage is that it invested in electrification earlier than most other OEMs and already has a strong sales track-record with the Renault Zoe and Nissan Leaf. Sharing a dedicated EV platform within its alliance should give it a similar edge on costs as Volkswagen. BMW has little to offer near-term, with only electrified versions of two ICE models (the Mini in 2019 and the X3 in 2020). The

Is Tesla Revolutionary or Evolutionary? 15 August 2018
13
next dedicated volume BEV won't be launched until 2021. BMW is working on a platform that fits all powertrains. This might sacrifice range and interior space of the EVs compared to a dedicated BEV architecture, we think.
Toyota is also well positioned for the transition to EVs. It is currently a leader in electrification as it sold 1.5 million HEVs/PHEVs last year. As the company is able to share key electric components across its lines of HEVs/PHEVs, it should be able to keep the cost of key electric components lower than competitors, even over the next five years. We estimate current average operating margins on HEVs of about 8-10% not including any subsidies. With its tie-up with Panasonic and aggressive development of solid state batteries, we believe it will keep the leading position within battery tech. The company has also formed an alliance to develop EVs with Suzuki, Mazda, Subaru, and Isuzu. Total sales volume from the alliance was ~17 million last year.
Global Auto Suppliers We recap the relative ICE vs. BEV content exposure for the global suppliers below.
Figure 19: ICE Specific Content vs. BEV Specific Content Figure 20: BEV Specific Content Less ICE Specific Content
Source: UBS Source: UBS
-5,000-4,000-3,000-2,000-1,000 0 1,000 2,000 3,000
Aisin SeikiSchaeffler
TennecoFaurecia
DanaAptivLeoniHella
ValeoBWA
MagnaConti
DensoDelphi
Lear
ICE -4,000 -3,000 -2,000 -1,000 0 1,000 2,000 3,000
Aisin SeikiSchaeffler
TennecoFaurecia
DanaAptivLeoniHella
ValeoBWA
MagnaConti
DensoDelphi
Lear

Is Tesla Revolutionary or Evolutionary? 15 August 2018
14
Figure 21: Who Supplies What?
Source: UBS
Global Batteries While NCA battery packs provides higher energy density with lower cost vs NMC (according to our teardown), we don't think we can conclude a winner on battery cell chemistry just based on this. We have been seeing most major OEMs turning towards NMC and not NCA, despite the latter having been around and available for a much longer time.
An important aspect to consider other than cost and performance is safety. Our understanding is that OEMs' priorities in battery cell qualification in order of importance are 1) safety, 2) cost, 3) reliability, 4) durability and 5) performance (Battery Expert call: Focus on Technology).
Concerns on safety has been the main drawback for NCA batteries, as they are known to be less stable given the higher nickel content and having to work with significantly higher number of cells. Tesla seems to be managing this better with a more precise battery management system, but this could be one of the main reasons why we have not seen NCA being adopted by others.
Global Semis Tesla's approach to in-housing its modules does not appear to be lowering the semi content – but is changing the mix (less MCU content than Bolt). Its adoption of Silicon Carbide (SiC) in the inverter could help to accelerate that shift. Overall, it reinforces our view that EVs provide a significant content opportunity to semis – especially power semi suppliers.
Overall we estimate a semis bill of materials for the powertrain of $640, 10% higher than the $580 we found in the Bolt. While the Model 3 is a key success story for STMicro's SiC products, this was already known and we believe is coming
Components / partsAverage pricing
($)Aisin Seiki Aptiv BWA Conti Delphi Dana Denso Faurecia Hella
Hyundai Mobis
Lear Leoni Magna Schaeffler TennecoToyota
IndustriesValeo
Battery - main 13,330
Battery cell 11,100 Developing
BMS 230 Developing
Battery pack 2,000 Developing
Wiring 390
High voltage cables 240
Charging cord 150
Propulsion 2,140
Electric motor 750 Developing
Gearbox 410
Inverter 800 Developing
Half Shafts 180
Power electronics 1,300
Power distribution module 375
DC/DC converter 275
On board charger 650 Developing
Cooling 280 Developing
Electric compressor 250
Total 17,440 1,960 390 2,240 3,360 1,955 460 3,360 280 785 4,705 2,490 390 2,240 410 0 14655 3,165
Engine 5,130
Internal combustion engine (ICE) 3,760
Fuel injection system 250
Fuel Storage 150
Starter + alternator / starter-generator 250
Engine actuators 200
Engine sensors / electronics 520
Transmission 1,200
Clutch system (incl. torque converter) 350
Multi-speed gearbox (incl. control valve) 700
Prop / drive shaft 50
Differential 100
AWD Content 325
Exhaust system 700
Exhaust gas recirculation / heat recovery 150
SCR system 300
Patriculate filter 150
Manifolds 50
Muffler 50
Total * 7,030 5,410 100 1,480 2,510 770 475 2,918 700 388 2,150 100 100 1,475 1,542 700 3,760 2,742
BEV powertrain
ICE powertrain

Is Tesla Revolutionary or Evolutionary? 15 August 2018
15
at low margins today given limited premium vs. silicon being charged. We also found much TI content for many small components but totaling to a small overall amount making it the second largest supplier we identified.
The teardown affirms our positive view on the content opportunity for semis in the shift to electric vehicles. Despite its limited presence in the Model 3, we continue to see Infineon (Buy, €28 PT) as the best positioned play on the shift to electric vehicles in semis and is continuing to win key design wins for mass-market European EV ramps in 2020. We are cautious to read too much into Tesla's approach to manufacturing and whether other OEMs will follow immediately. For more details, please see the global semis team companion piece: Semis: Who's Powering Tesla's Model 3?

Is Tesla Revolutionary or Evolutionary? 15 August 2018
16
Let the Race Begin!

Is Tesla Revolutionary or Evolutionary? 15 August 2018
17
Q: Who Won Lap 1: Powertrain & Battery? The EV powertrain is divided into several components. Outside the battery, there are five key parts of the powertrain (see below). This section will compare the batteries & electric drivetrain: the design, technology, integration and cost of each.
Figure 22: EV Powertrain Overview
Source: UBS
Lap 1 goes to Tesla! All-in, the Tesla Model 3 is the Lap 1 Battery & Powertrain winner among these vehicles. Through the teardown of the battery and drivetrain, we saw numerous advancements and innovations within the Model 3. The technology in the battery pack appears to be ahead of all current production EVs and the BMS operates within tolerances not seen in others. The focus on modularity and compact design also suggests potential for automated production.
Compared to the i3 and Bolt, the Tesla Model 3 long-range has a larger battery capacity and as such is both more powerful and has a longer range. It is the first Tesla car aimed at the mass-market as TSLA aims to become more than a niche EV player. Although the company is aiming to sell a base version for $35k (for a 210 mile range version), at the time of this writing, the cheapest available version sells for $49k and some were actually selling for $80.5k. This puts it well above both the $37.5k Chevy Bolt and the 2014 BMW i3 we used for compare. Currently, the 2019 Chevy Bolt's base MSRP is ~$36.5k and the 2018 BMW i3's (94Ah) is ~$44.5. With a range extender, the i3 gets up to ~$51.5k as a starting price. The 75 kWh Tesla powertrain is more expensive; however per kWh cost is the lowest. Moreover, miles per kWh are also slightly higher. More importantly, the overall performance is superior with much better power, torque, and acceleration.

Is Tesla Revolutionary or Evolutionary? 15 August 2018
18
Figure 23: EV Powertrain & Battery Comparison
Tesla Model 3 2014 BMW i3 2017 Chevy Bolt
MSRP as analyzed $49,000 $47,825 $37,495
EPA Fuel Economy Rating 126 124 119
Range (miles) 310 81 238
Battery cost ($, total) $13,331 $9,716 $12,300
kWh 75 22 60
Battery cost ($ / kWh) $178 $442 $205
EV Powertrain $4,496 $6,218 $4,293
Total Battery & Powertrain $17,827 $15,934 $16,593
Range (miles) 310 81 238
Miles per kWh 4.1 3.7 4.0
Power 306 HP 170 HP 200 HP
Torque 415 lb-ft 184 lb-ft 266 lb-ft
Acceleration (0 to 60 mph) 4.8 sec. 7.9 sec. 6.5 sec.
Source: UBS Evidence Lab
From a cost standpoint, the Model 3's drivetrain is the most expensive, mostly owing to the battery and BMS systems. The weight of the entire drive train is also the heaviest. Both of these features are explained by the range and performance of the vehicle however. At 75kWh, it's well ahead of the BMW i3 and just a bit ahead of the Chevy Bolt.
Figure 24: EV Powertrain Components
Battery Pack
(per kWh) BMS HV Wiring
Cooling
System Inverter E-motor Gearbox
Tech Winner Telsa Model 3 Telsa Model 3 Telsa Model 3 Telsa Model 3 Tesla Model 3 Telsa Model 3 Undetermined
Cost Winner Telsa Model 3 BMW i3 Telsa Model 3 Chevy Bolt Chevy Bolt Telsa Model 3 BMW i3
Weight Winner Telsa Model 3 BMW i3 BMW i3 Telsa Model 3 Telsa Model 3 Telsa Model 3 BMW i3
Source: UBS

Is Tesla Revolutionary or Evolutionary? 15 August 2018
19
The First Turn: The Battery What does it do?
The battery contains the following two basic components:
Cells: This is the main power source for the vehicle.
Pack: The pack ensures the battery cells are properly cooled and monitored for safety. The pack includes a strong outer case to ensure the cells can't be punctured, a battery management system that ensure the cells do not have a thermal runaway event (catch fire), and a cooling system to make sure the cells remain at the optimal temperature to ensure safety and long life.
Who makes it?
Cells: Panasonic, LG, Samsung SDI, and CATL are the top four cell suppliers globally.
Packs: This is typically performed in-house by the automaker.
Who is the winner?
TSLA has the advantage in terms of timing and we would expect them to lead the field in battery tech. Our teardown confirmed this hypothesis and to a larger degree than expected. The Model 3 battery is more power dense, cheaper to manufacture and has an overall larger range (and would even at similar battery pack sizes). Although the longevity and safety are still in the process of being determined, there is not much data to suggest that currently any of these vehicles are better than the others in that sense. Battery winner: Tesla Model 3.
Figure 25: Battery Cell Comparison
2017 Model 3 (LR, RWD) 2017 Chevy Bolt 2014 BMW i3 (LR)
Chemistry NCA NMC LMO
Supplier Panasonic LG Chem Samsung SDI
Format Cylindrical Pouch Prismatic
# Cells 4416 288 96
Easily Swappable? No Yes Yes
Battery Pack
Cost as analyzed $13,331 $12,300 $9,716
Power Capacity (kWh) 75 60 22
Weight (kgs) 442 428 230
Pack Power:Weight Ratio (Wh/kg) 170 140 96
Charge Times
Leve 1: Basic - 120V residential ~55 hours ~60 hours ~20 hours
Level 2: Fast - 240V fast-charging ~9 hours ~9.5 hours ~3.5 hours
Super-fast - public DC fast-charging ~1.25 hours ~1.5 hours ~0.5 hours
Source: UBS
Is Tesla Revolutionary or Evolutionary? 15 August 2018
20
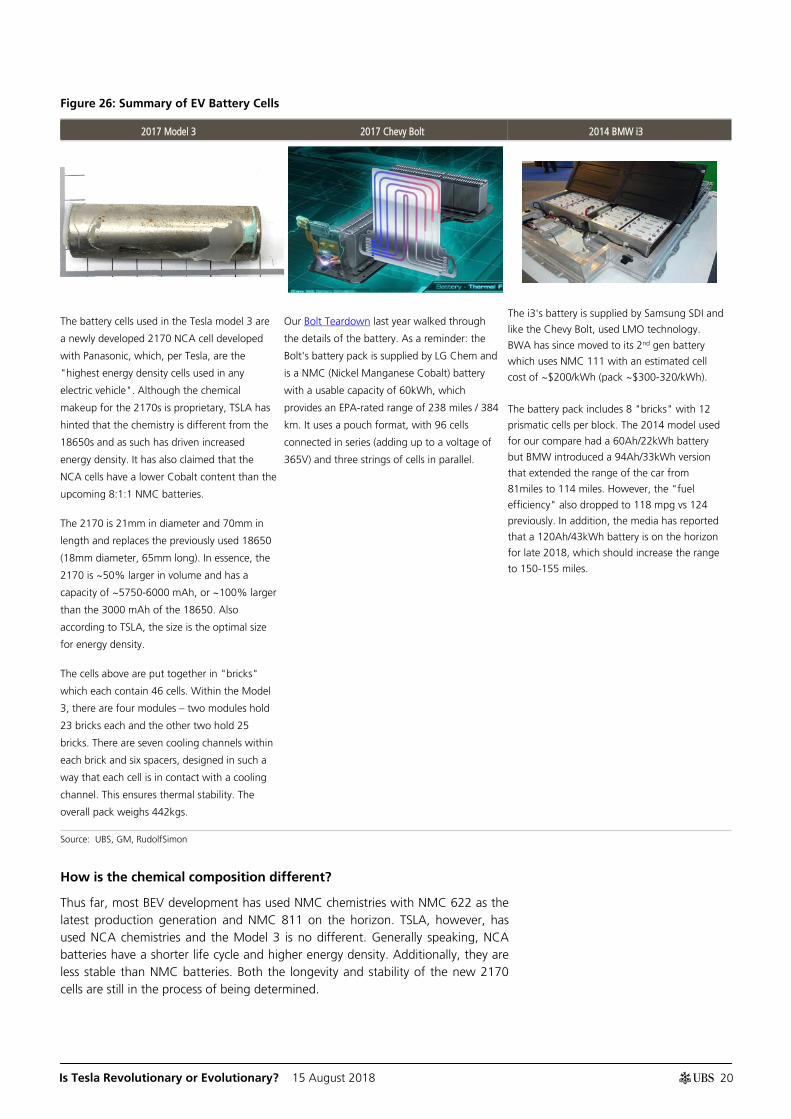
Figure 26: Summary of EV Battery Cells
2017 Model 3 2017 Chevy Bolt 2014 BMW i3
The battery cells used in the Tesla model 3 are
a newly developed 2170 NCA cell developed
with Panasonic, which, per Tesla, are the
"highest energy density cells used in any
electric vehicle". Although the chemical
makeup for the 2170s is proprietary, TSLA has
hinted that the chemistry is different from the
18650s and as such has driven increased
energy density. It has also claimed that the
NCA cells have a lower Cobalt content than the
upcoming 8:1:1 NMC batteries.
The 2170 is 21mm in diameter and 70mm in
length and replaces the previously used 18650
(18mm diameter, 65mm long). In essence, the
2170 is ~50% larger in volume and has a
capacity of ~5750-6000 mAh, or ~100% larger
than the 3000 mAh of the 18650. Also
according to TSLA, the size is the optimal size
for energy density.
The cells above are put together in "bricks"
which each contain 46 cells. Within the Model
3, there are four modules – two modules hold
23 bricks each and the other two hold 25
bricks. There are seven cooling channels within
each brick and six spacers, designed in such a
way that each cell is in contact with a cooling
channel. This ensures thermal stability. The
overall pack weighs 442kgs.
Our Bolt Teardown last year walked through
the details of the battery. As a reminder: the
Bolt's battery pack is supplied by LG Chem and
is a NMC (Nickel Manganese Cobalt) battery
with a usable capacity of 60kWh, which
provides an EPA-rated range of 238 miles / 384
km. It uses a pouch format, with 96 cells
connected in series (adding up to a voltage of
365V) and three strings of cells in parallel.
The i3's battery is supplied by Samsung SDI and
like the Chevy Bolt, used LMO technology.
BWA has since moved to its 2nd gen battery
which uses NMC 111 with an estimated cell
cost of ~$200/kWh (pack ~$300-320/kWh).
The battery pack includes 8 "bricks" with 12
prismatic cells per block. The 2014 model used
for our compare had a 60Ah/22kWh battery
but BMW introduced a 94Ah/33kWh version
that extended the range of the car from
81miles to 114 miles. However, the "fuel
efficiency" also dropped to 118 mpg vs 124
previously. In addition, the media has reported
that a 120Ah/43kWh battery is on the horizon
for late 2018, which should increase the range
to 150-155 miles.
Source: UBS, GM, RudolfSimon
How is the chemical composition different?
Thus far, most BEV development has used NMC chemistries with NMC 622 as the latest production generation and NMC 811 on the horizon. TSLA, however, has used NCA chemistries and the Model 3 is no different. Generally speaking, NCA batteries have a shorter life cycle and higher energy density. Additionally, they are less stable than NMC batteries. Both the longevity and stability of the new 2170 cells are still in the process of being determined.

Is Tesla Revolutionary or Evolutionary? 15 August 2018
21
In the case of these three vehicles, from a performance and cost standpoint, Tesla's NCA chemistry appears to be advantageous to the NMC 622 chemistry used in the Bolt. As our teardown shows, the pack has a higher power to weight ratio and a lower cost to kWh ratio. Although this may change with the introduction of NMC 811 chemistries, Tesla/Panasonic's batteries appear to be leading.
How is the form factor different?
In terms of total material distribution within the three vehicles, battery cells make up ~40% of the Chevy Bolt's total, ~30% of the Model 3's and ~15% of the i3's. This is driven by the combination of form factor used, desired power capacity and overall vehicle size.
Tesla's use of cylindrical cells appears at least partially a function of its partnership with Panasonic who has long been a leader in cylindrical cells. Use of the cylindrical cells make for an easier automated production process as well as easier pack design. Given the steel case for each cell, it also helps the long-term stability of the cells. One concern with using this design is that it requires many more cells, 4416 in the Model 3's case vs. the 288 and 96 in the Chevy Bolt and i3, respectively. Ensuring steady connection and battery power load becomes more challenging. Tesla has overcome this problem by wire bonding the conductors to the batteries and gluing the entire pack shut. In addition, the BMS within the Model 3 appears to be far ahead of competition: our teardown measured the variation of voltage between different bricks was 2-3 mV, a miniscule amount given the possible range.
The Chevy Bolt and i3, however, use pouch and prismatic cells, respectively. One advantage of this form factor is the weight to power profile as well as the design flexibility offered by rectangular boxes. One of the things we've learned in the teardown of the Model 3 is how the design of the car from the ground up has allowed it more freedom to be developed as a pure electric vehicle. Traditional OEM's have strong incentives to use components across different platforms, often limiting design elements within their electric cars. Therefore, the use of rectangular pouch/prismatic cells allows for design flexibility.
Tesla's use of the cylindrical form factor doesn’t necessarily seem to give an advantage over the Bolt or i3 from a performance standpoint. However, the combination of using the NCA chemistry as well as advanced BMS appears to work in conjunction with the cylindrical form factor to help drive lower cost and better performance. With that in mind, we'll call the form factor competition to be undetermined for now.

Is Tesla Revolutionary or Evolutionary? 15 August 2018
22
Figure 27: Summary of EV Battery Packs
2017 Model 3 2017 Chevy Bolt 2014 BMW i3
'The TLSA pack is complicated by the volume of
cells which requires advanced battery
management software. However, it also enables
a simpler cooling system.
Within the pack, each 2170 cell is welded to the
current collectors in such a way that a short
circuit causes the connecting wire to burn out.
This wire bonding process is just one of multiple
safety disconnects built into the Model 3 pack.
Furthermore, due to the volume of individual
cells, an individual cell should not cause any
meaningful impact on total capacity or power.
The cells are housed in 10 module cases. It
weighs 436 kg, out of which 300 kg relate to
the battery cells. Of the total weight, 26% is
contributed by the packaging and cooling (steel,
aluminum and iron), and about 68% by the
"active" materials in the battery cells.
The pack has fewer, but larger cells. The larger
cell format requires a more robust cooling
system as the risk of a thermal event in once cell
is more severe.
The pack used in our analysis weighs
~230kgs/500lbs and translates to 96Wh/Kg, well
below the 140 & 170 values for the Chevy Bolt
and Tesla Model 3, respectively.
In terms of swap ability, the i3's pack is actually a
structural part of the chassis but relatively easy to
remove and replace. Individual "bricks" are
replaceable and given the importance of each to
the overall power, this makes sense. On a limited
basis, owners of older 22kWh battery packs have
been able to get 33kWh battery packs installed.
The modularity and usability of the BMW
developed packs is such that their use has
extended to non-automotive applications: from
electric boats to electric delivery vehicles. This
widespread usage should help Samsung
SDI/BMW to scale production, discover long-term
issues, and feed aftermarket sales.
Source: UBS
How do the costs compare?
Battery costs are typically compared relative to cost per kWh as the higher kWh the longer the vehicle range. Companies often quote just a cell cost vs. the cell and pack cost, which clear makes a difference. Beyond these differences, there can also be difference in what is included in the cost (supplier profit margin or allocations for D&A & R&D). Below are the relative costs.

Is Tesla Revolutionary or Evolutionary? 15 August 2018
23
Figure 28: Battery Pack Cost per kWh Figure 29: Model 3 vs. Bolt Cell and Pack Costs
Source: UBS Source: UBS
Our Model 3 teardown puts the cost of the full battery pack at $13,331. At 75kWh, this translates to a rate of $178 per kWh. Tesla itself has stated the cost is <$190 per kWh. Although slightly dated, this compares to $209 per kWh for the 2017 Chevy Bolt and $441 per kWh for the 2014 BMW i3 (est. 2nd gen NMC 111 battery is closer to $300-320/kWh).
For the Model 3, the cost of the cells breaks down to $148 per kWh, which is actually slightly more than the $145/kWh we calculate for the Chevy Bolt. Despite the fact that the Model 3 pack has more components (4416 vs 288 cells), each of which is welded to the conductors, the pack itself ends up costing less than the Bolt. This is likely due to a combination of Tesla's well engineered cooling system as well as the complexity of working with Prismatic cells in the i3.
Once again, Tesla appears to be ahead of the competition as it has leveraged its battery tech and developed battery packs that are ~15% cheaper than the competition. As the Model 3 is designed to be a longer range vehicle than the others, on an absolute basis, the battery pack is actually more expensive. Although the company's engineering makes the pack cheaper on a per kWh basis, when considering overall cost, consumers may lean towards cheaper vehicles with enough range to cover their needs.
$178 $209
$441
2017 Model 3 (LR,RWD)
2017 Chevy Bolt 2014 BMW i3 (LR)
Tesla Model 3 2017 Chevy BoltCell Pack

Is Tesla Revolutionary or Evolutionary? 15 August 2018
24
Straightaway: Battery Management & Charging What does it do?
One of the hardest parts of developing and manufacturing BEV's is the ability to design and integrate a robust battery management system (BMS) and associated components. There are typically three main components:
Power Distribution Module: The "brains" of the power operation which monitors and directs power to where it is needed safely and efficiently.
DC-DC Converter Module: Converts high-voltage DC from the battery management system to low voltage for the non-propulsion electricity users such as car electronics or power windows. Before "arriving" in the DC/DC converter, the current is routed through the HV system controller from the battery management module.
On-Board Charger: For safely and efficiently directing charging input to the battery pack. Converts AC power to DC for battery charging. Also responsible for AC filtering, rectification, power factor correction and DC conditioning.
Battery Management System: Electronics that manage the state of charge of the batteries to ensure safety and battery life.
Who makes it?
Power Distribution Module: Bosch, Conti, Delphi, Denso, & LG Electronics
DC-DC Converter: Bosch, Conti, Delphi, Denso, Hyundai Mobis, LG Electronics, Valeo, & ZF
On-Board Charger: Conti, Delphi, Denso, Hyundai Mobis, Lear, LG Electronics, & Valeo
Battery Management System: Preh, Calsonic Kansei, LG Electronics, Hyundai Mobis
Who is the winner?
Overall, despite its all-in-one modular design for the power management system, the Model 3 has significantly more components and weight in the BMS and charging electronics systems than the BMW i3 and the Chevy Bolt. However, the weight and cost distributions are in line with the mileage range and battery capacity of each vehicle.
The level of engineering within the BMS of the Model 3, however, appears to be multiple technological steps ahead of the Chevy Bolt or i3. Once again, Tesla's later entry into the market, as well as its pure focus on electric vehicles gives it an advantage here. Battery Management winner: Tesla Model 3.
Is Tesla Revolutionary or Evolutionary? 15 August 2018
25
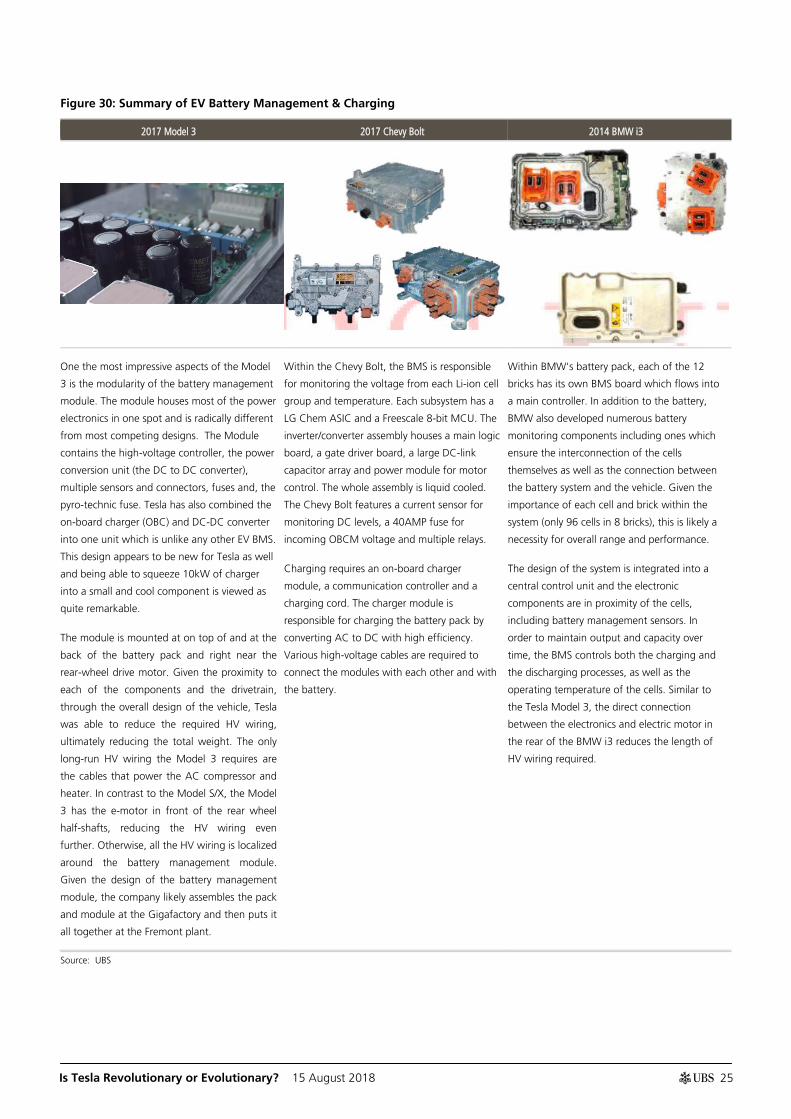
Figure 30: Summary of EV Battery Management & Charging
2017 Model 3 2017 Chevy Bolt 2014 BMW i3
One the most impressive aspects of the Model
3 is the modularity of the battery management
module. The module houses most of the power
electronics in one spot and is radically different
from most competing designs. The Module
contains the high-voltage controller, the power
conversion unit (the DC to DC converter),
multiple sensors and connectors, fuses and, the
pyro-technic fuse. Tesla has also combined the
on-board charger (OBC) and DC-DC converter
into one unit which is unlike any other EV BMS.
This design appears to be new for Tesla as well
and being able to squeeze 10kW of charger
into a small and cool component is viewed as
quite remarkable.
The module is mounted at on top of and at the
back of the battery pack and right near the
rear-wheel drive motor. Given the proximity to
each of the components and the drivetrain,
through the overall design of the vehicle, Tesla
was able to reduce the required HV wiring,
ultimately reducing the total weight. The only
long-run HV wiring the Model 3 requires are
the cables that power the AC compressor and
heater. In contrast to the Model S/X, the Model
3 has the e-motor in front of the rear wheel
half-shafts, reducing the HV wiring even
further. Otherwise, all the HV wiring is localized
around the battery management module.
Given the design of the battery management
module, the company likely assembles the pack
and module at the Gigafactory and then puts it
all together at the Fremont plant.
Within the Chevy Bolt, the BMS is responsible
for monitoring the voltage from each Li-ion cell
group and temperature. Each subsystem has a
LG Chem ASIC and a Freescale 8-bit MCU. The
inverter/converter assembly houses a main logic
board, a gate driver board, a large DC-link
capacitor array and power module for motor
control. The whole assembly is liquid cooled.
The Chevy Bolt features a current sensor for
monitoring DC levels, a 40AMP fuse for
incoming OBCM voltage and multiple relays.
Charging requires an on-board charger
module, a communication controller and a
charging cord. The charger module is
responsible for charging the battery pack by
converting AC to DC with high efficiency.
Various high-voltage cables are required to
connect the modules with each other and with
the battery.
Within BMW's battery pack, each of the 12
bricks has its own BMS board which flows into
a main controller. In addition to the battery,
BMW also developed numerous battery
monitoring components including ones which
ensure the interconnection of the cells
themselves as well as the connection between
the battery system and the vehicle. Given the
importance of each cell and brick within the
system (only 96 cells in 8 bricks), this is likely a
necessity for overall range and performance.
The design of the system is integrated into a
central control unit and the electronic
components are in proximity of the cells,
including battery management sensors. In
order to maintain output and capacity over
time, the BMS controls both the charging and
the discharging processes, as well as the
operating temperature of the cells. Similar to
the Tesla Model 3, the direct connection
between the electronics and electric motor in
the rear of the BMW i3 reduces the length of
HV wiring required.
Source: UBS

Is Tesla Revolutionary or Evolutionary? 15 August 2018
26
Overall Battery Management: Tesla's battery management begins with a control board mounted directly to each of the four battery modules. This local control of the battery module reduces the amount of wiring required to perform the overall battery management process vs a centrally located board monitoring the full pack. The PC board monitors the SOC (state of charge) for each of the individual “Bricks” in the modules.
The Model 3 BMS controls the voltage of the 23 to 25 individual brick sections to within 2 to 3 millivolts. This precise level of voltage variance demonstrates an improved methodology for balancing batteries and is much better than what is typically achieved in an EV battery pack.
Figure 31: Tesla Model 3 Battery Management Module
Source: UBS
How do the costs compare?
Tesla's Model 3 BMS and charging components come in at $1.7k and weigh 28.5kg. This covers the entire battery management module noted above. Key components include the HV OBC/DC-DC converter, estimated at $1,065 and the HV system controller assembly at $207.
The Chevy Bolt BMS components in this sub-group cost $1.3k with a total weight of 21.1kg. Within that, the DC-DC converter costs $179 and the high-power distribution module costs $328 with any future cost reduction potential mainly seen through economies of scale.
The BMW i3 BMS and charging electronics come in at a similar $1.3k price but weigh 16.5kg. Given the lower capacity of the i3, the weight drop is expected.

Is Tesla Revolutionary or Evolutionary? 15 August 2018
27
Figure 32: Battery Management & Charging Electronics Figure 33: Model 3 vs. Bolt Battery Mang. Breakout
Source: UBS Source: UBS
$1,700
$1,300 $1,300
Model 3 Chevy Bolt BMW i3
$1,700
Model 3 Chevy Bolt
Battery ManagementSystem
Power DistributionModule
On Board Charger
DC-DC Converter

Is Tesla Revolutionary or Evolutionary? 15 August 2018
28
Final Turn: E-Motor & Inverter What does it do?
There are three main components to the overall motor – the inverter, the electric motor, and the gearbox.
Inverter: To drive the e-motor and wheels, power from the battery pack flows through the HV controller/power distribution module to an inverter. The inverter takes DC supplied from the power distribution and converts it to 3-phase AC for synchronous motor control. This also works in the reverse to take AC power from regenerative braking and charge the DC battery pack.
E Motor & Gearbox: Once the inverter has converted the power flow to an AC current, the e-motor converts the current to a rotational motion. This motion feeds through the gearbox to turn the half-shafts to drive the wheels. There are different e-motor designs in the market, and each one has pros and cons. Generally speaking, permanent-magnet (PM) motors are more efficient while induction motors allow for higher performance. Thus far, most OEMs have used PM motors while Tesla has used induction motors in the Roadster, Model S and Model X.
Who makes it?
Inverter: Aisen Seiki, Bosch, Conti, Delphi, Denso, Hitachi, Hyundai Mobis, LG Electronics, Valeo, Toyota industries, BorgWarner (with Sevon acquisition) and ZF
E Motor: LG Electronics, Bosch, Conti, Denso, Valeo, Hitachi, Hyundai Mobis, BorgWarner, Magna, Nidec, Aisin Seiki, and Mahle
Gearbox: Aisin Seiki, BorgWaner, Magna, Schaeffler, and Valeo.
Who is the winner?
Of the three vehicles, the Tesla Model 3 has the lightest motor that's able to deliver the most power. Together with the gearbox and other components, its cost falls between that of the cheaper BMW i3 and the more expensive Chevy Bolt. Although a new technology for Tesla, the e-motor appears to be another step forward for EVs. The compact and modular design of the drive unit should help keep weights down and manufacturing cost low. Although the i3 and Chevy Bolt motors were steps forward when they were introduced, the Model 3 once again appears to have the benefit of time on its side and appears to be the tech leader. E-Motor winner: Tesla Model 3.
Is Tesla Revolutionary or Evolutionary? 15 August 2018
29
Figure 34: Summary of Inverter
2017 Model 3 2017 Chevy Bolt 2014 BMW i3
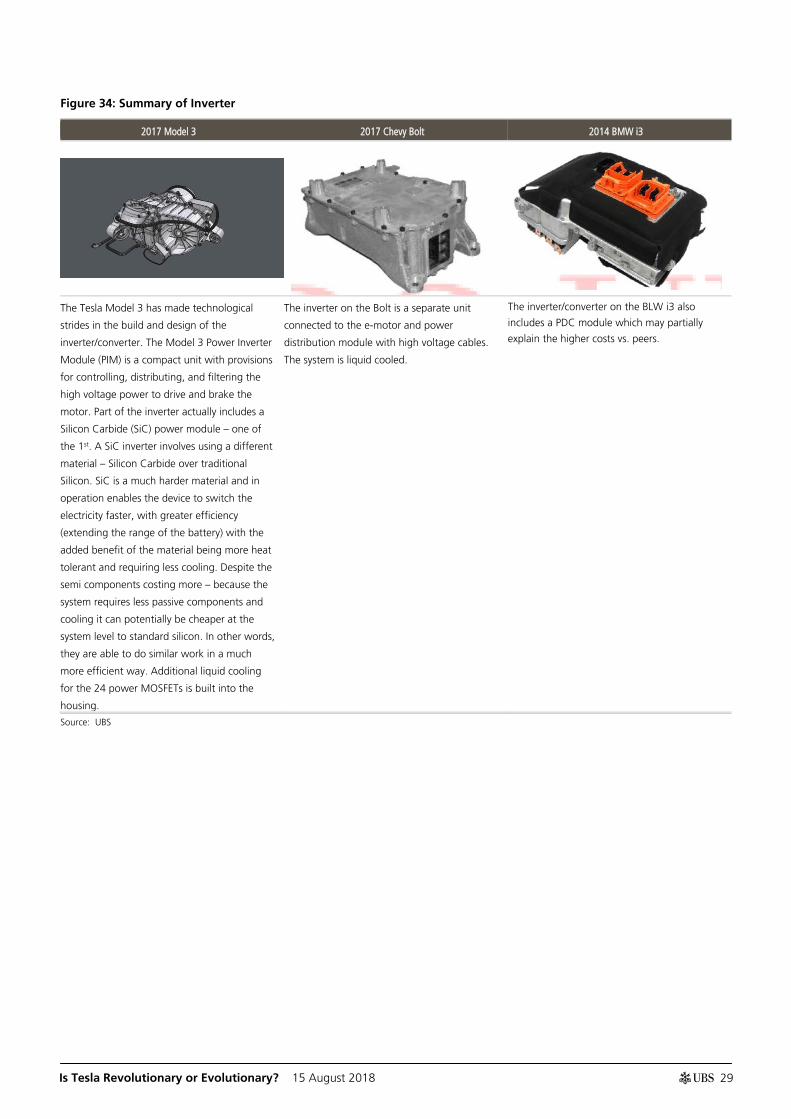
The Tesla Model 3 has made technological
strides in the build and design of the
inverter/converter. The Model 3 Power Inverter
Module (PIM) is a compact unit with provisions
for controlling, distributing, and filtering the
high voltage power to drive and brake the
motor. Part of the inverter actually includes a
Silicon Carbide (SiC) power module – one of
the 1st. A SiC inverter involves using a different
material – Silicon Carbide over traditional
Silicon. SiC is a much harder material and in
operation enables the device to switch the
electricity faster, with greater efficiency
(extending the range of the battery) with the
added benefit of the material being more heat
tolerant and requiring less cooling. Despite the
semi components costing more – because the
system requires less passive components and
cooling it can potentially be cheaper at the
system level to standard silicon. In other words,
they are able to do similar work in a much
more efficient way. Additional liquid cooling
for the 24 power MOSFETs is built into the
housing.
The inverter on the Bolt is a separate unit
connected to the e-motor and power
distribution module with high voltage cables.
The system is liquid cooled.
The inverter/converter on the BLW i3 also
includes a PDC module which may partially
explain the higher costs vs. peers.
Source: UBS

Is Tesla Revolutionary or Evolutionary? 15 August 2018
30
Figure 35: Summary of Electric Motor & Gearbox
2017 Model 3 2017 Chevy Bolt 2014 BMW i3
The Model 3 gearbox houses the motor and
the gear train and several direct mounted
components in a compact configuration: oil
pump, oil filter, resolver, Power Inverter
Module, cooling lines, heat exchanger &
mounts. The gearbox is divided into 3 sections:
1: the rotor, stator, resolver, and thermistor; 2:
the drivetrain, oil filer, oil pump, and heat
exchanger and 3: dry PIM and housing. This
assembly continues the design theme we've
seen with the rest of the Model 3 components:
modular and compact.
In contrast to previous Tesla models which used
induction motors, Model 3 uses a permanent
magnet Motor. Most all other EVs have
traditionally used PM motors as they are more
efficient. Tesla's choice to switch to a PM
version is likely driven by a desire to increase
the range, especially in city driving conditions.
This efficiency comes at a price however, as
performance is impacted. In the AWD version,
the FWD motor is an induction motor while the
rear remains the PM motor – this allows for a
balance of both performance and efficiency.
The Drive unit including both the gearbox and
the rotor, are cooled using Automatic
Transmission Fluid (ATF). ATF is pumped
through an externally mounted plate style
cooler. Ethylene glycol also passes through the
external cooler in a separate cell, dissipating
the heat of the ATF through convection. The
motor sits inside of the gearbox housing which
allows coolant to flow around the outside of
the motor with no cooling jacket. Rather the
gearbox housing has cast-in inlets and outlets
to allow the trans oil to move around the
motor. Elimination of the cooling jacket is not
only a cost savings; it also reduces the size of
the gearbox housing.
The Chevy Bolt uses a permanent-magnet
synchronous motor supplied by LG Electronics
and engineered by GM. The one-speed
transmission (7.05:1 final drive ratio) houses in
the same module, also known as drive unit.
The regenerative braking function is
accomplished via the e-motor being utilized as
a generator and the inverter/converter
converting the generated AC in to DC for the
battery, i.e. no additional mechanical
equipment is required.
The one-speed transmission is directly attached
to the e-motor and sits in the same housing.
We counted only four gear wheels. A fixed
transmission ratio (to reduce the rpm of the
engine while increasing the torque) is sufficient
due to the constant torque across the entire
usable rpm range of the motor.
The BMW i3 has a hybrid synchronous electric
motor developed and produced by BMW. The
motor generates a max 125kW with peak
torque of 250 lb-ft. The motor utilizes an
arrangement of components which generates a
self-magnetizing effect helping to keep the
magnetic field stable, even at higher RPMs. This
also allows the e-motor to operate with higher
power output in an efficient size. This
translates to a better vehicle range. The 9.70:1
gear ratio is the highest among the three
vehicles, suggesting that the i3 was tuned
more for acceleration than top speed. Indeed,
the car is limited to a top speed of 93mph.
Like the Model 3 and Chevy Bolt, the i3 has
single-pedal control which allows regeneration
to recharge the battery. According to BMW, its
speed-sensitive speed control allows a driver to
perform 75% of braking maneuvers without
touching the brake pedal.
Among the three vehicles, the i3 is also the
only one that offers a range extender, the REx.
The REx is powered by a 650cc two-cylinder
34hp engine borrowed from a BMW scooter. If
equipped, the REx is mounted adjacent to the
electric motor and provides another 50-60
miles of range.
Source: UBS
Is Tesla Revolutionary or Evolutionary? 15 August 2018
31
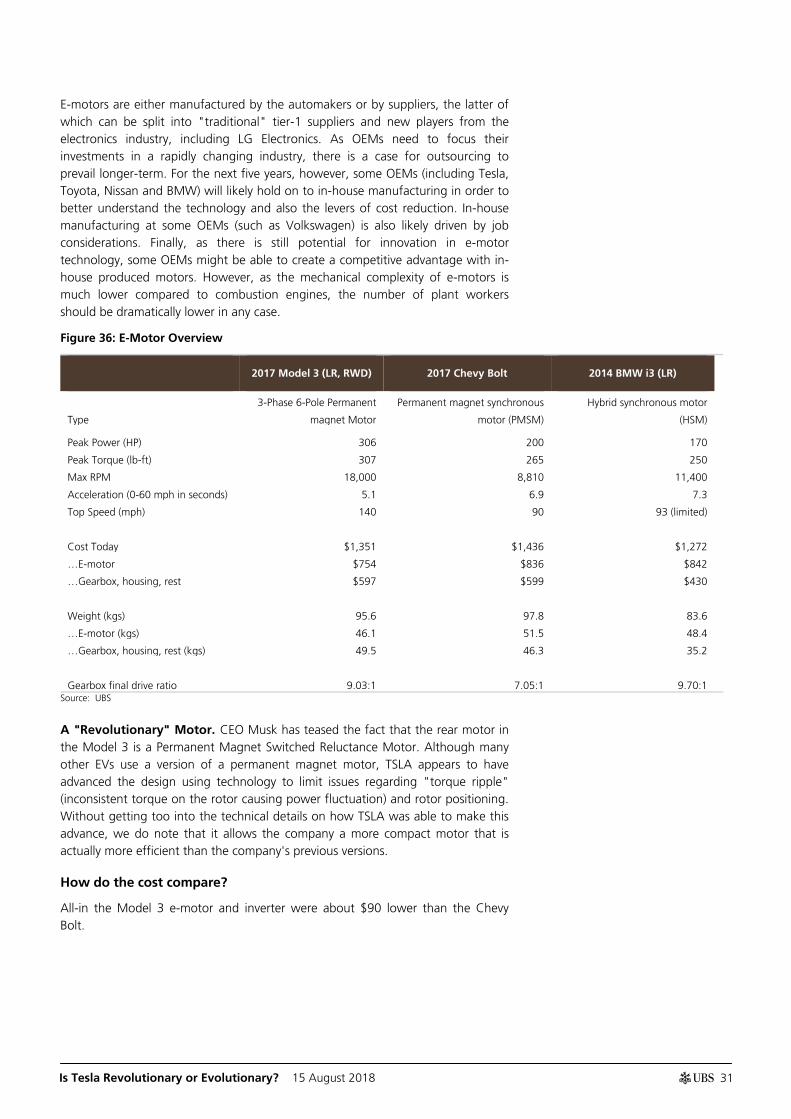
E-motors are either manufactured by the automakers or by suppliers, the latter of which can be split into "traditional" tier-1 suppliers and new players from the electronics industry, including LG Electronics. As OEMs need to focus their investments in a rapidly changing industry, there is a case for outsourcing to prevail longer-term. For the next five years, however, some OEMs (including Tesla, Toyota, Nissan and BMW) will likely hold on to in-house manufacturing in order to better understand the technology and also the levers of cost reduction. In-house manufacturing at some OEMs (such as Volkswagen) is also likely driven by job considerations. Finally, as there is still potential for innovation in e-motor technology, some OEMs might be able to create a competitive advantage with in-house produced motors. However, as the mechanical complexity of e-motors is much lower compared to combustion engines, the number of plant workers should be dramatically lower in any case.
Figure 36: E-Motor Overview
2017 Model 3 (LR, RWD) 2017 Chevy Bolt 2014 BMW i3 (LR)
Type
3-Phase 6-Pole Permanent
magnet Motor
Permanent magnet synchronous
motor (PMSM)
Hybrid synchronous motor
(HSM)
Peak Power (HP) 306 200 170
Peak Torque (lb-ft) 307 265 250
Max RPM 18,000 8,810 11,400
Acceleration (0-60 mph in seconds) 5.1 6.9 7.3
Top Speed (mph) 140 90 93 (limited)
Cost Today $1,351 $1,436 $1,272
…E-motor $754 $836 $842
…Gearbox, housing, rest $597 $599 $430
Weight (kgs) 95.6 97.8 83.6
…E-motor (kgs) 46.1 51.5 48.4
…Gearbox, housing, rest (kgs) 49.5 46.3 35.2
Gearbox final drive ratio 9.03:1 7.05:1 9.70:1
Source: UBS
A "Revolutionary" Motor. CEO Musk has teased the fact that the rear motor in the Model 3 is a Permanent Magnet Switched Reluctance Motor. Although many other EVs use a version of a permanent magnet motor, TSLA appears to have advanced the design using technology to limit issues regarding "torque ripple" (inconsistent torque on the rotor causing power fluctuation) and rotor positioning. Without getting too into the technical details on how TSLA was able to make this advance, we do note that it allows the company a more compact motor that is actually more efficient than the company's previous versions.
How do the cost compare?
All-in the Model 3 e-motor and inverter were about $90 lower than the Chevy Bolt.

Is Tesla Revolutionary or Evolutionary? 15 August 2018
32
Figure 37: E-Motor & Inverter Cost Comparison Figure 38: E-Motor & Inverter Cost Split
Source: UBS Source: UBS
$1,960
$2,050
$2,240
Model 3 Chevy Bolt BMW i3
$750 $840 $840
$410 $460 $290
$800 $750 $1,110
Model 3 Chevy Bolt BMW i3
Inverter Gearbox E-Motor

Is Tesla Revolutionary or Evolutionary? 15 August 2018
33
Home Stretch: Cooling & Wiring What does it do?
There are four main systems left on the EV – the cooling, the high voltage cables, the half shaft, and the range-extender (REx).
Cooling / Thermal Management: There four main components that require thermal management in a vehicle – the battery, the motor, the power electronics, and the passenger. The large battery packs which draw lots of energy as they charge and expel lots of energy as they power the car require cooling systems to function correctly and efficiently. Li-ion cells last longer and perform better when kept within the ideal temperature range. The cooling and heating systems within EVs are designed to keep the cells within this temperature range. The heating and cooling systems within these vehicles also focus on parts of the drive unit. Finally, the HVAC in an ICE leverages the heat from the engine; therefore a new solution is needed for an EV which typically requires separate heaters to accomplish the task.
High Voltage Cables: These are the thick cables that connect the major EV systems. This cost also includes $150-200 related to the charging cord.
Half Shaft: The shaft that transmits the torque from the e-motor to the wheels. There does not appear to be anything unique about this product for EVs.
REx: This is a range extender and is only offered on the BMW i3.
Who makes it?
Cooling / Thermal Management: BorgWarner, Conti, Dana, Denso, Hella, Magna, and Valeo.
Wiring: Aptiv, Lear, Leoni, Yazaki, and Sumitomo.
Half Shaft: traditional drivetrain suppliers.
How do the cost compare?
The cooling pack and lines for all three vehicles are in the $250-$300 range and weigh between 12-16kgs. Despite Tesla's more advanced design, the car is larger/more powerful which adds to the overall cost and weight. However, on this metric, we would say that Tesla is the winner.
Who is the winner?
The Tesla Model 3 had some very innovative engineering solutions, though at a similar cost to the Bolt. More importantly, the Model 3 was able to reduce the use and cost of high voltage cables by consolidating systems in the powertrain. Cooling & wiring winner: Tesla Model 3.

Is Tesla Revolutionary or Evolutionary? 15 August 2018
34
Figure 39: Summary of Cooling
2017 Model 3 2017 Chevy Bolt 2014 BMW i3
One of the notable design features of both the
past and current Tesla models is the unique
battery cooling feature. Tesla's patented system
consists of coated aluminum serpentine micro
extrusion cooling channels running lengthwise
between the cells to transport the ethylene-
glycol through the battery pack. Although the
cells themselves have been updated from the
18650 to the 2170s, the cooling system
appears to be based on the company's previous
designs.
The Model 3 uses a horizontally mounted
cooling pack as opposed to a conventional
vertically mounted cooling pack. Air enters
through the Active Grille Shutters (AGS) of the
lower grille and is pulled downward through
the cooling pack. The horizontal packaging
allows Tesla to lower the front of the hood
which helps with styling and reduces
aerodynamic drag. The cooling fan itself is
located on the bottom of the vehicle and pulls
air down to prevent ingesting road debris into
the cooling pack.
In contrast to other EVs, the Model 3 uses a
centralized coolant reservoir with integrated
chiller and pumps. As seen in the Figure below,
it uses a rotating valve in the coolant reservoir
to distribute the fluid flow in five directions.
Tesla’s coolant bottle is strategically placed to
also minimize hose lengths. The integration of
components eliminates additional brackets and
labor and simplifies the entire cooling system.
This system is also capable of providing both
cooling and heating for the battery pack, in
contrast to other EVs that use multiple systems.
Once again, the efficient layout of the battery
components minimizes the number and length
of coolant hoses and high voltage cables.
The rotating cooling valve is another innovative
advancement within the Model 3 that seems to
improve on previous tech. Its ability to direct
fluid in multiple directions allows for less
components and a more centrally managed
cooling distribution.
The Chevy Bolt has three separate thermal
management circuits: for the battery, for the e-
motor and power electronics and for the cabin.
This means it has three different coolant bottles
and the corresponding requisite pumps, valves,
etc. Battery heating/cooling as well as cooling
of power electronics is performed by liquid
circuits, in the battery pack through aluminum
plates and in the e-motor and electronics
through built-in passages in the module
housing.
Once again, as a vehicle designed from the
ground up to be an EV, the Tesla seems to
have simplified complications that seem to be
legacy for ICE OEMs. Tesla has reduced the
cooling to its bare minimum requirements and
removed components in the process. This saves
both cost and manufacturing time.
For the three vehicles used in our comparison,
the Tesla Model 3 and Chevy Bolt both use
glycol for cooling the battery, while the BMW
i3 uses AC refrigerant. The BMW i3 requires
the AC refrigerant as it needs a higher cooling
capacity for the range extender (REx) engine (if
equipped). The Model 3 and BMW i3 run
coolant lines from the front to the rear of the
vehicle. The Bolt has multiple coolant loops in
the front and does not run any coolant lines to
the rear of the vehicle.
Source: UBS

Is Tesla Revolutionary or Evolutionary? 15 August 2018
35
Figure 40: Tesla Battery Pack Cross-Sectional View Figure 41: Tesla Model 3 Rotating Cooling Valve
Source: UBS Source: UBS
How do the cost compare?
All-in the Model 3 high voltage cables were about $160 lower than the Bolt. The cooling was about in-line, and the half shaft was about $40 more costly than the Bolt.
Figure 42: Cooling, Wiring, & Other Comparison Figure 43: E-Cooling, Wiring, and Half Shaft Costs
Source: UBS Source: UBS
Other Indirect EV Costs There many systems that are powered by the engine. For example, the heating in an ICE leverages heat from the engine. In addition, certain systems need to be electrified like the steering and braking.
$850 $920
$2,670
Model 3 Chevy Bolt BMW i3
$280 $290 $290
$390 $490 $460
$180 $140 $140
Model 3 Chevy Bolt BMW i3 (exRex)
Half Shaft
High VoltageCables
Cooling

Is Tesla Revolutionary or Evolutionary? 15 August 2018
36
Appendix
Battery Background Below we revisit our overall views on batteries: raw materials, global capacity, battery tech, and cost.
Battery Raw Materials
Roughly 70% of the cost of a battery cell reflects raw materials, and therefore battery prices are increasingly dependent on the underlying commodity price. Within the commonly used chemistries: NCA and NMC, Cobalt is by far the most expensive material, and one of the limiting factors in terms of price cuts. Currently most EV batteries are based on nickel-manganese-cobalt (NMC) chemistries while TSLA uses nickel-cobalt-aluminum (NCA) chemistry. In either case, the goal of battery/auto manufacturers continues to be reducing the amount of cobalt within the cell. This not only reduces the price, it also translates to higher nickel content, thus boosting battery capacity.
Figure 44: Historical cobalt prices ($/ton)
Source: Factset, UBS
Current generations of NMC cells use a materials mix of 6:2:2, which means that it is composed of 60% of the cheaper Nickel with manganese and cobalt each around 20%. With a 2020 view, the cathode materials mix is expected to be optimized further to 8:1:1. At the same time, the energy density is expected to be further improved by ~20% for every new generation. This will lower not just the bill of materials per kWh, but also the costs for the module / pack assembly on a per kWh basis.
At our "What is the Future Car" conference, our panelists agreed with our forecasts from our Bolt Teardown that battery costs will fall from ~$205/kWh in 2017 to $130/kWh in 2025. A major factor in driving better performance and lower costs is battery chemistry. The next advancement in chemistry will be wide spread adoption of NMC 811. Our conference panel also highlighted that the next evolution of batteries, solid state, are at least 5-10 years away with even ideal lab-condition versions not working within specs required.
$0
$10,000
$20,000
$30,000
$40,000
$50,000
$60,000
$70,000
$80,000
$90,000
$100,000
Q21
0Q
310
Q41
0Q
111
Q21
1Q
311
Q41
1Q
112
Q21
2Q
312
Q41
2Q
113
Q21
3Q
313
Q41
3Q
114
Q21
4Q
314
Q41
4Q
115
Q21
5Q
315
Q41
5Q
116
Q21
6Q
316
Q41
6Q
117
Q21
7Q
317
Q41
7Q
118
Q21
8C
urre
nt

Is Tesla Revolutionary or Evolutionary? 15 August 2018
37
In terms of battery cell capacity, the equivalent of 16 Gigafactories would be required globally to meet expected 2025 cell demand in our base-case scenario. This equates to $64bn total investments, applying the cost/GWh ratio of the first Gigafactory. Tesla managed to build a green-field (actually, it's located in a desert) Gigafactory within three years. The Korean battery suppliers are investing heavily in new capacity already today, and so are the Chinese suppliers.
Figure 45: NMC battery raw mats demand 2025E in % of proven reserves – NMC 811 likely mainstream after 2020
Figure 46: 16 Tesla Gigafactories required to meet 2025E battery cell demand – ambitious yet possible
Source: UBS estimates Source: UBS estimates
Battery Shapes
Beyond the chemistry, battery cells are produced with different form factors which each have pros and cons in terms of design, manufacturing, cost, and safety. The majority of manufacturers use either prismatic or pouch cells while Tesla uses cylindrical cells.
Cylindrical Cells: Cylindrical cells are made by sandwiching a thin layer of anode material, a separator, an electrolyte, and a cathode material. The sandwich is then rolled up into a "jelly roll" which is fit into a hollow cylindrical case. The manufacture of cylindrical cells is easier to automate and thus can be produced quicker. The form itself is also considered safer for automotive applications due to reduced impact from vibration/movement. Typically, the cells have a much smaller volume than prismatic or pouch cells and constitute a smaller portion to the overall battery pack – translating to lower criticality in the event of single cell failure. However, this requires a more advanced battery management system (BMS) to ensure balanced power.
Prismatic Cell: Prismatic cells are made up of a sandwich of anode, separator, electrolyte and cathode, which are then folded into a rectangular package, usually within aluminum housing. Prismatic cells can be used to make smaller and lighter packs than cylindrical cells but are generally more expensive. Individual cells are much larger than cylindricals as well, and the higher capacity makes it more difficult for the BMS to protect each cell from over-charging and dissipating heat. The larger cell size also minimizes the possibility for automation leading to a lower degree of consistency. Each cell within a pack is a larger portion of the total capacity and the failure of one leads to a larger impact on total capacity /range.
Pouch Cell: Pouch cells are similar to Prismatic cells but are much thinner and instead of being folded are put into a pouch form - leading to a much smaller form
0.0%
0.5%
1.0%
1.5%
2.0%
2.5%
3.0%
3.5%
4.0%
4.5%
5.0%
Manganese Graphite Nickel Lithium CobaltNMC 111 NMC 622 NMC 811
0200400600800
1,0001,2001,4001,6001,8002,0002,2002,4002,6002,800
Downside Base case Upside
Gwh By 2025, our EV penetration scenarios would require ...
1,331 GWh
$120bn
27
712 GWh
$64bn
14
256 GWh
$23bn
5
...battery capacity
...total capex
...Gigafactories

Is Tesla Revolutionary or Evolutionary? 15 August 2018
38
factor. Unlike cylindrical and prismatic cells, they are not built into a solid housing but foil tabs are welded to the pouch and are able to carry charge across them. This gives the pouch a better packaging efficiency. In general, the pouch cell is the most power dense form factor. However, pouches can swell from gas expansion within it and building a pack requires room for this swell.

Is Tesla Revolutionary or Evolutionary? 15 August 2018
39
*UBS Ev idence Lab provides our research analysts with rigorous primary research. The team
conducts representative surveys of key sector decision-makers, mines the Internet, systematically
collects observable data, and pulls information from other innovative sources. They apply a
variety of advanced analytic techniques to derive insights from the data collected. This valuable
resource supplies UBS analysts with differentiated information to support their forecasts and
recommendations—in turn enhancing our ability to serve the needs of our clients.
For this report, UBS Evidence Lab entered a partnership with a team of engineers that specializes
in teardown benchmarking and accurate costing in the automotive industry. The project included
a full teardown of TSLA's Model 3. This included a full breakdown of each of 4 zones: Body &
Chassis, Controlling Electronics, Interior & Safety, and the Powertrain & battery pack. Details
include a full component cost breakdown.
The cost estimates reflect the cost an automaker would pay a supplier. Generally, these costs are
calculated by estimating the raw material costs, the amortization of parts tooling, and estimating
labor costs and applying an industry standard mark-up for supplier overhead and profit. To
create its estimates, the engineers look for numerous variables, including materials and material
comparisons, process, machinery, tooling, labor (modelled by region of production), geography,
competition, and logistics.
Valuation Method and Risk Statement
Our price targets are based on an EBITDA multiple, relative to the local market. The global auto industry is highly cyclical, vulnerable to sudden shifts in consumer sentiment, employment, interest rates, and general economic activity. Auto companies have high fixed costs, and therefore earnings and cash flows can dramatically change with sudden shifts in vehicle demand. A significant and sudden decline in demand would cause automakers to burn through cash and would increase the financial distress of their supply base. Automakers also faces risks associated with the impact of discount rates and asset values on legacy obligations. In addition, the auto industry is highly competitive, and therefore OEMs may face pricing pressure from competitors looking to gain market share. Moreover, the Detroit 3’s North American operations have historically been dependent on light truck sales, and therefore the continued shifts toward cars will remain a headwind.
Is Tesla Revolutionary or Evolutionary? 15 August 2018
40
Required Disclosures
This report has been prepared by UBS Securities LLC, an affiliate of UBS AG. UBS AG, its subsidiaries, branches and affiliates are referred to herein as UBS.
For information on the ways in which UBS manages conflicts and maintains independence of its research product; historical performance information; and certain additional disclosures concerning UBS research recommendations, please visit www.ubs.com/disclosures. The figures contained in performance charts refer to the past; past performance is not a reliable indicator of future results. Additional information will be made available upon request. UBS Securities Co. Limited is licensed to conduct securities investment consultancy businesses by the China Securities Regulatory Commission. UBS acts or may act as principal in the debt securities (or in related derivatives) that may be the subject of this report. This recommendation was finalized on: 16 August 2018 02:21 AM GMT. UBS has designated certain Research department members as Derivatives Research Analysts where those department members publish research principally on the analysis of the price or market for a derivative, and provide information reasonably sufficient upon which to base a decision to enter into a derivatives transaction. Where Derivatives Research Analysts co-author research reports with Equity Research Analysts or Economists, the Derivatives Research Analyst is responsible for the derivatives investment views, forecasts, and/or recommendations.
Analyst Certification:Each research analyst primarily responsible for the content of this research report, in whole or in part, certifies that with respect to each security or issuer that the analyst covered in this report: (1) all of the views expressed accurately reflect his or her personal views about those securities or issuers and were prepared in an independent manner, including with respect to UBS, and (2) no part of his or her compensation was, is, or will be, directly or indirectly, related to the specific recommendations or views expressed by that research analyst in the research report.
UBS Investment Research: Global Equity Rating Definitions
12-Month Rating Definition Coverage1 IB Services2
Buy FSR is > 6% above the MRA. 48% 25%
Neutral FSR is between -6% and 6% of the MRA. 37% 21%
Sell FSR is > 6% below the MRA. 15% 13%
Short-Term Rating Definition Coverage3 IB Services4
Buy Stock price expected to rise within three months from the time the rating was assigned because of a specific catalyst or event. <1% <1%
Sell Stock price expected to fall within three months from the time the rating was assigned because of a specific catalyst or event. <1% <1%
Source: UBS. Rating allocations are as of 30 June 2018. 1:Percentage of companies under coverage globally within the 12-month rating category. 2:Percentage of companies within the 12-month rating category for which investment banking (IB) services were provided within the past 12 months. 3:Percentage of companies under coverage globally within the Short-Term rating category. 4:Percentage of companies within the Short-Term rating category for which investment banking (IB) services were provided within the past 12 months.
KEY DEFINITIONS:Forecast Stock Return (FSR) is defined as expected percentage price appreciation plus gross dividend yield over the next 12 months. In some cases, this yield may be based on accrued dividends. Market Return Assumption (MRA) is defined as the one-year local market interest rate plus 5% (a proxy for, and not a forecast of, the equity risk premium). Under Review (UR) Stocks may be flagged as UR by the analyst, indicating that the stock's price target and/or rating are subject to possible change in the near term, usually in response to an event that may affect the investment case or valuation. Short-Term Ratings reflect the expected near-term (up to three months) performance of the stock and do not reflect any change in the fundamental view or investment case. Equity Price Targets have an investment horizon of 12 months.

Is Tesla Revolutionary or Evolutionary? 15 August 2018
41
EXCEPTIONS AND SPECIAL CASES:UK and European Investment Fund ratings and definitions are: Buy: Positive on factors such as structure, management, performance record, discount; Neutral: Neutral on factors such as structure, management, performance record, discount; Sell: Negative on factors such as structure, management, performance record, discount. Core Banding Exceptions (CBE): Exceptions to the standard +/-6% bands may be granted by the Investment Review Committee (IRC). Factors considered by the IRC include the stock's volatility and the credit spread of the respective company's debt. As a result, stocks deemed to be very high or low risk may be subject to higher or lower bands as they relate to the rating. When such exceptions apply, they will be identified in the Company Disclosures table in the relevant research piece.
Research analysts contributing to this report who are employed by any non-US affiliate of UBS Securities LLC are not registered/qualified as research analysts with FINRA. Such analysts may not be associated persons of UBS Securities LLC and therefore are not subject to the FINRA restrictions on communications with a subject company, public appearances, and trading securities held by a research analyst account. The name of each affiliate and analyst employed by that affiliate contributing to this report, if any, follows.
UBS Securities LLC: Colin Langan, CFA; Gene Vladimirov, CFA; Timothy Arcuri. UBS AG: Patrick Hummel, CFA; Julian Radlinger, CFA. UBS Limited: David Lesne; David Mulholland, CFA. UBS Securities Japan Co., Ltd.: Kohei Takahashi; Kenji Yasui. UBS AG Hong Kong Branch: Paul Gong; Nicolas Gaudois. UBS Securities Pte. Ltd., Seoul Branch: Eugene Jung.

Is Tesla Revolutionary or Evolutionary? 15 August 2018
42
Company Disclosures
Company Name Reuters 12-month rating Short-term rating Price Price date
Albemarle Corp16 ALB.N Buy N/A US$95.54 15 Aug 2018
Aptiv PLC16 APTV.N Neutral N/A US$90.98 15 Aug 2018
Continental7 CONG.DE Buy N/A €182.90 15 Aug 2018
Daimler7 DAIGn.DE Buy N/A €55.05 15 Aug 2018
Delphi Technologies Plc16 DLPH.N Neutral N/A US$39.53 15 Aug 2018
Denso7 6902.T Neutral N/A ¥5,369 15 Aug 2018
Ems-Chemie5 EMSN.S Sell N/A CHF595.50 15 Aug 2018
Faurecia EPED.PA Neutral N/A €52.94 15 Aug 2018
FCA7, 16 FCHA.MI Buy N/A €14.05 14 Aug 2018
General Motors Company6, 7, 16 GM.N Buy N/A US$35.94 15 Aug 2018
Hitachi Chemical 4217.T Buy N/A ¥2,179 15 Aug 2018
Hyundai Mobis 012330.KS Neutral N/A Won230,000 14 Aug 2018
Infineon Technologies AG IFXGn.DE Buy N/A €21.15 15 Aug 2018
Johnson Matthey JMAT.L Sell N/A 3,549p 15 Aug 2018
Lear Corporation16 LEA.N Neutral N/A US$171.75 15 Aug 2018
Leoni LEOGn.DE Neutral N/A €37.31 15 Aug 2018
LG Chemical 051910.KS Buy N/A Won373,000 14 Aug 2018
Melexis NV MLXS.BR Sell N/A €76.15 15 Aug 2018
Panasonic7 6752.T Neutral N/A ¥1,390.5 15 Aug 2018
PSA Group PEUP.PA Neutral N/A €24.33 15 Aug 2018
Renault7, 13 RENA.PA Buy N/A €70.71 15 Aug 2018
Samsung SDI 006400.KS Buy N/A Won214,500 14 Aug 2018
Schaeffler13 SHA_p.DE Neutral N/A €11.82 15 Aug 2018
Subaru 7270.T Sell N/A ¥3,303 15 Aug 2018
Sumitomo Chemical 4005.T Buy N/A ¥615 15 Aug 2018
Tenneco Inc.16 TEN.N Buy N/A US$42.48 15 Aug 2018
Tesla, Inc.16, 22 TSLA.O Sell N/A US$338.69 15 Aug 2018
Toyota Motor7, 16 7203.T Neutral N/A ¥6,815 15 Aug 2018
Umicore UMI.BR Neutral N/A €46.35 15 Aug 2018
Valeo VLOF.PA Buy N/A €39.37 15 Aug 2018
Source: UBS. All prices as of local market close. Ratings in this table are the most current published ratings prior to this report. They may be more recent than the stock pricing date 5. UBS AG, its affiliates or subsidiaries expect to receive or intend to seek compensation for investment banking
services from this company/entity within the next three months. 6. This company/entity is, or within the past 12 months has been, a client of UBS Securities LLC, and non-investment
banking securities-related services are being, or have been, provided. 7. Within the past 12 months, UBS Securities LLC and/or its affiliates have received compensation for products and
services other than investment banking services from this company/entity. 13. UBS AG, its affiliates or subsidiaries beneficially owned 1% or more of a class of this company`s common equity
securities as of last month`s end (or the prior month`s end if this report is dated less than 10 days after the most recent month`s end).
16. UBS Securities LLC makes a market in the securities and/or ADRs of this company. 22. UBS AG, its affiliates or subsidiaries held other significant financial interests in this company/entity as of last
month`s end (or the prior month`s end if this report is dated less than 10 working days after the most recent month`s end).

Is Tesla Revolutionary or Evolutionary? 15 August 2018
43
Unless otherwise indicated, please refer to the Valuation and Risk sections within the body of this report. For a complete set of disclosure statements associated with the companies discussed in this report, including information on valuation and risk, please contact UBS Securities LLC, 1285 Avenue of Americas, New York, NY 10019, USA, Attention: Investment Research.
Company profile and fee and risk statement under the Japanese Financial Instruments & Exchange Law
Company Name etc: UBS Securities Japan Co., Ltd., Financial Instruments & Exchange Firm, Kanto Local Financial Bureau (Kinsho) No.2633
Associated Memberships: Japan Securities Dealers' Association, the Financial Futures Association of Japan, and Type II Financial Instruments Firms Association and Japan Investment Advisers Association
UBS Securities Japan Co., Ltd. will receive a brokerage fee (excluding tax) from clients of Wealth Management calculated by multiplying the executed amount by 1.00% at maximum (excluding tax) for trading domestic stocks; and by 1.25% at maximum (excluding tax) for trading foreign stocks. However, in the case of trading other than the auction market trading such as OTC trading and Tostnet trading, a higher fee may be charged based on an individual agreement with a client. The method of fee calculation is not explained here because fee varies depending on the market condition and the content of trading, etc. From the clients of the Investment Bank, UBS Securities Japan Co., Ltd. will receive a brokerage fee based on an individual contract and no standard upper limit or calculating method. For the trading of domestic stocks, consumption tax is added to the fee. For the trading of foreign stock, fee on the foreign stock exchange or foreign tax may be charged in addition to the domestic fee and tax. Those amounts may vary depending on the jurisdiction. There is a risk that a loss may occur due to a change in the price of the stock in the case of trading stocks, and that a loss may occur due to the exchange rate in the case of trading foreign stocks. There is a risk that a loss may occur due to a change in the price or performance of the properties in the portfolio in the case of trading REITs.
UBS Securities Japan Co., Ltd. will only receive the purchasing amounts for trading unlisted bonds (JGBs, municipals, government guaranteed bonds, corporate bonds) when UBS Securities Japan Co., Ltd. is the counterparty. There is a risk that a loss may occur due to a change in the price of the bond caused by the fluctuations in the interest rates, and that a loss may occur due to the exchange rate in the case of trading foreign bonds.

Is Tesla Revolutionary or Evolutionary? 15 August 2018
44
Global Disclaimer This document has been prepared by UBS Securities LLC, an affiliate of UBS AG. UBS AG, its subsidiaries, branches and affiliates are referred to herein as UBS.
Global Research is provided to our clients through UBS Neo, and in certain instances, UBS.com and any other system or distribution method specifically identified in one or more communications distributed through UBS Neo or UBS.com (each a system) as an approved means for distributing Global Research. It may also be made available through third party vendors and distributed by UBS and/or third parties via e-mail or alternative electronic means. The level and types of services provided by Global Research to a client may vary depending upon various factors such as a client's individual preferences as to the frequency and manner of receiving communications, a client's risk profile and investment focus and perspective (e.g., market wide, sector specific, long-term, short-term, etc.), the size and scope of the overall client relationship with UBS and legal and regulatory constraints.
All Global Research is available on UBS Neo. Please contact your UBS sales representative if you wish to discuss your access to UBS Neo.
When you receive Global Research through a System, your access and/or use of such Global Research is subject to this Global Research Disclaimer and to the terms of use governing the applicable System.
When you receive Global Research via a third party vendor, e-mail or other electronic means, you agree that use shall be subject to this Global Research Disclaimer, where applicable the UBS Investment Bank terms of business (https://www.ubs.com/global/en/investment-bank/regulatory.html) and to UBS's Terms of Use/Disclaimer (http://www.ubs.com/global/en/legalinfo2/disclaimer.html). In addition, you consent to UBS processing your personal data and using cookies in accordance with our Privacy Statement (http://www.ubs.com/global/en/legalinfo2/privacy.html) and cookie notice (http://www.ubs.com/global/en/homepage/cookies/cookie-management.html).
If you receive Global Research, whether through a System or by any other means, you agree that you shall not copy, revise, amend, create a derivative work, provide to any third party, or in any way commercially exploit any UBS research provided via Global Research or otherwise, and that you shall not extract data from any research or estimates provided to you via Global Research or otherwise, without the prior written consent of UBS.
This document is for distribution only as may be permitted by law. It is not directed to, or intended for distribution to or use by, any person or entity who is a citizen or resident of or located in any locality, state, country or other jurisdiction where such distribution, publication, availability or use would be contrary to law or regulation or would subject UBS to any registration or licensing requirement within such jurisdiction.
This document is a general communication and is educational in nature; it is not an advertisement nor is it a solicitation or an offer to buy or sell any financial instruments or to participate in any particular trading strategy. Nothing in this document constitutes a representation that any investment strategy or recommendation is suitable or appropriate to an investor’s individual circumstances or otherwise constitutes a personal recommendation. By providing this document, none of UBS or its representatives has any responsibility or authority to provide or have provided investment advice in a fiduciary capacity or otherwise. Investments involve risks, and investors should exercise prudence and their own judgment in making their investment decisions. None of UBS or its representatives is suggesting that the recipient or any other person take a specific course of action or any action at all. By receiving this document, the recipient acknowledges and agrees with the intended purpose described above and further disclaims any expectation or belief that the information constitutes investment advice to the recipient or otherwise purports to meet the investment objectives of the recipient. The financial instruments described in the document may not be eligible for sale in all jurisdictions or to certain categories of investors.
Options, structured derivative products and futures (including OTC derivatives) are not suitable for all investors. Trading in these instruments is considered risky and may be appropriate only for sophisticated investors. Prior to buying or selling an option, and for the complete risks relating to options, you must receive a copy of "The Characteristics and Risks of Standardized Options." You may read the document at http://www.theocc.com/publications/risks/riskchap1.jsp or ask your salesperson for a copy. Various theoretical explanations of the risks associated with these instruments have been published. Supporting documentation for any claims, comparisons, recommendations, statistics or other technical data will be supplied upon request. Past performance is not necessarily indicative of future results. Transaction costs may be significant in option strategies calling for multiple purchases and sales of options, such as spreads and straddles. Because of the importance of tax considerations to many options transactions, the investor considering options should consult with his/her tax advisor as to how taxes affect the outcome of contemplated options transactions.
Mortgage and asset-backed securities may involve a high degree of risk and may be highly volatile in response to fluctuations in interest rates or other market conditions. Foreign currency rates of exchange may adversely affect the value, price or income of any security or related instrument referred to in the document. For investment advice, trade execution or other enquiries, clients should contact their local sales representative.
The value of any investment or income may go down as well as up, and investors may not get back the full (or any) amount invested. Past performance is not necessarily a guide to future performance. Neither UBS nor any of its directors, employees or agents accepts any liability for any loss (including investment loss) or damage arising out of the use of all or any of the Information.
Prior to making any investment or financial decisions, any recipient of this document or the information should seek individualized advice from his or her personal financial, legal, tax and other professional advisors that takes into account all the particular facts and circumstances of his or her investment objectives.
Any prices stated in this document are for information purposes only and do not represent valuations for individual securities or other financial instruments. There is no representation that any transaction can or could have been effected at those prices, and any prices do not necessarily reflect UBS's internal books and records or theoretical model-based valuations and may be based on certain assumptions. Different assumptions by UBS or any other source may yield substantially different results.
No representation or warranty, either expressed or implied, is provided in relation to the accuracy, completeness or reliability of the information contained in any materials to which this document relates (the "Information"), except with respect to Information concerning UBS. The Information is not intended to be a complete statement or summary of the securities, markets or developments referred to in the document. UBS does not undertake to update or keep current the Information. Any opinions expressed in this document may change without notice and may differ or be contrary to opinions expressed by other business areas or groups, personnel or other representative of UBS. Any statements contained in this report attributed to a third party represent UBS's interpretation of the data, information and/or opinions provided by that third party either publicly or through a subscription service, and such use and interpretation have not been reviewed by the third party. In no circumstances may this document or any of the Information (including any forecast, value, index or other calculated amount ("Values")) be used for any of the following purposes:
(i) valuation or accounting purposes;
(ii) to determine the amounts due or payable, the price or the value of any financial instrument or financial contract; or
(iii) to measure the performance of any financial instrument including, without limitation, for the purpose of tracking the return or performance of any Value or of defining the asset allocation of portfolio or of computing performance fees.
By receiving this document and the Information you will be deemed to represent and warrant to UBS that you will not use this document or any of the Information for any of the above purposes or otherwise rely upon this document or any of the Information.
UBS has policies and procedures, which include, without limitation, independence policies and permanent information barriers, that are intended, and upon which UBS relies, to manage potential conflicts of interest and control the flow of information within divisions of UBS and among its subsidiaries, branches and affiliates. For further information on the ways in which UBS manages conflicts and maintains independence of its research products, historical performance information and certain additional disclosures concerning UBS research recommendations, please visit www.ubs.com/disclosures.
Research will initiate, update and cease coverage solely at the discretion of UBS Research Management, which will also have sole discretion on the timing and frequency of any published research product. The analysis contained in this document is based on numerous assumptions. All material information in relation to published research reports, such as valuation methodology, risk statements, underlying assumptions (including sensitivity analysis of those assumptions), ratings history etc. as required by the Market Abuse Regulation, can be found on UBS Neo. Different assumptions could result in materially different results.
The analyst(s) responsible for the preparation of this document may interact with trading desk personnel, sales personnel and other parties for the purpose of gathering, applying and interpreting market information. UBS relies on information barriers to control the flow of information contained in one or more areas within UBS into other areas, units, groups or affiliates of UBS. The compensation of the analyst who prepared this document is determined exclusively by research management and senior management (not including investment banking). Analyst compensation is not based on investment banking revenues; however, compensation may relate to the revenues of UBS and/or its divisions as a whole, of which investment banking, sales and trading are a part, and UBS's subsidiaries, branches and affiliates as a whole.

Is Tesla Revolutionary or Evolutionary? 15 August 2018
45
For financial instruments admitted to trading on an EU regulated market: UBS AG, its affiliates or subsidiaries (excluding UBS Securities LLC) acts as a market maker or liquidity provider (in accordance with the interpretation of these terms in the UK) in the financial instruments of the issuer save that where the activity of liquidity provider is carried out in accordance with the definition given to it by the laws and regulations of any other EU jurisdictions, such information is separately disclosed in this document. For financial instruments admitted to trading on a non-EU regulated market: UBS may act as a market maker save that where this activity is carried out in the US in accordance with the definition given to it by the relevant laws and regulations, such activity will be specifically disclosed in this document. UBS may have issued a warrant the value of which is based on one or more of the financial instruments referred to in the document. UBS and its affiliates and employees may have long or short positions, trade as principal and buy and sell in instruments or derivatives identified herein; such transactions or positions may be inconsistent with the opinions expressed in this document.
Within the past 12 months UBS AG, its affiliates or subsidiaries may have received or provided investment services and activities or ancillary services as per MiFID II which may have given rise to a payment or promise of a payment in relation to these services from or to this company.
United Kingdom and the rest of Europe: Except as otherwise specified herein, this material is distributed by UBS Limited to persons who are eligible counterparties or professional clients. UBS Limited is authorised by the Prudential Regulation Authority and regulated by the Financial Conduct Authority and the Prudential Regulation Authority. France: Prepared by UBS Limited and distributed by UBS Limited and UBS Securities France S.A. UBS Securities France S.A. is regulated by the ACPR (Autorité de Contrôle Prudentiel et de Résolution) and the Autorité des Marchés Financiers (AMF). Where an analyst of UBS Securities France S.A. has contributed to this document, the document is also deemed to have been prepared by UBS Securities France S.A. Germany: Prepared by UBS Limited and distributed by UBS Limited and UBS Europe SE. UBS Europe SE is regulated by the Bundesanstalt fur Finanzdienstleistungsaufsicht (BaFin). Spain: Prepared by UBS Limited and distributed by UBS Limited and UBS Securities España SV, SA. UBS Securities España SV, SA is regulated by the Comisión Nacional del Mercado de Valores (CNMV). Turkey: Distributed by UBS Limited. No information in this document is provided for the purpose of offering, marketing and sale by any means of any capital market instruments and services in the Republic of Turkey. Therefore, this document may not be considered as an offer made or to be made to residents of the Republic of Turkey. UBS Limited is not licensed by the Turkish Capital Market Board under the provisions of the Capital Market Law (Law No. 6362). Accordingly, neither this document nor any other offering material related to the instruments/services may be utilized in connection with providing any capital market services to persons within the Republic of Turkey without the prior approval of the Capital Market Board. However, according to article 15 (d) (ii) of the Decree No. 32, there is no restriction on the purchase or sale of the securities abroad by residents of the Republic of Turkey. Poland: Distributed by UBS Limited (spolka z ograniczona odpowiedzialnoscia) Oddzial w Polsce regulated by the Polish Financial Supervision Authority. Where an analyst of UBS Limited (spolka z ograniczona odpowiedzialnoscia) Oddzial w Polsce has contributed to this document, the document is also deemed to have been prepared by UBS Limited (spolka z ograniczona odpowiedzialnoscia) Oddzial w Polsce. Russia: Prepared and distributed by UBS Bank (OOO). Switzerland: Distributed by UBS AG to persons who are institutional investors only. UBS AG is regulated by the Swiss Financial Market Supervisory Authority (FINMA). Italy: Prepared by UBS Limited and distributed by UBS Limited and UBS Limited, Italy Branch. Where an analyst of UBS Limited, Italy Branch has contributed to this document, the document is also deemed to have been prepared by UBS Limited, Italy Branch. South Africa: Distributed by UBS South Africa (Pty) Limited (Registration No. 1995/011140/07), an authorised user of the JSE and an authorised Financial Services Provider (FSP 7328). Israel: This material is distributed by UBS Limited. UBS Limited is authorised by the Prudential Regulation Authority and regulated by the Financial Conduct Authority and the Prudential Regulation Authority. UBS Securities Israel Ltd is a licensed Investment Marketer that is supervised by the Israel Securities Authority (ISA). UBS Limited and its affiliates incorporated outside Israel are not licensed under the Israeli Advisory Law. UBS Limited is not covered by insurance as required from a licensee under the Israeli Advisory Law. UBS may engage among others in issuance of Financial Assets or in distribution of Financial Assets of other issuers for fees or other benefits. UBS Limited and its affiliates may prefer various Financial Assets to which they have or may have Affiliation (as such term is defined under the Israeli Advisory Law). Nothing in this Material should be considered as investment advice under the Israeli Advisory Law. This Material is being issued only to and/or is directed only at persons who are Eligible Clients within the meaning of the Israeli Advisory Law, and this material must not be relied on or acted upon by any other persons. Saudi Arabia: This document has been issued by UBS AG (and/or any of its subsidiaries, branches or affiliates), a public company limited by shares, incorporated in Switzerland with its registered offices at Aeschenvorstadt 1, CH-4051 Basel and Bahnhofstrasse 45, CH-8001 Zurich. This publication has been approved by UBS Saudi Arabia (a subsidiary of UBS AG), a Saudi closed joint stock company incorporated in the Kingdom of Saudi Arabia under commercial register number 1010257812 having its registered office at Tatweer Towers, P.O. Box 75724, Riyadh 11588, Kingdom of Saudi Arabia. UBS Saudi Arabia is authorized and regulated by the Capital Market Authority to conduct securities business under license number 08113-37. UAE / Dubai: The information distributed by UBS AG Dubai Branch is only intended for Professional Clients and/or Market Counterparties, as classified under the DFSA rulebook. No other person should act upon this material/communication. The information is not for further distribution within the United Arab Emirates. UBS AG Dubai Branch is regulated by the DFSA in the DIFC. UBS is not licensed to provide banking services in the UAE by the Central Bank of the UAE, nor is it licensed by the UAE Securities and Commodities Authority. United States: Distributed to US persons by either UBS Securities LLC or by UBS Financial Services Inc., subsidiaries of UBS AG; or by a group, subsidiary or affiliate of UBS AG that is not registered as a US broker-dealer (a ‘non-US affiliate’) to major US institutional investors only. UBS Securities LLC or UBS Financial Services Inc. accepts responsibility for the content of a document prepared by another non-US affiliate when distributed to US persons by UBS Securities LLC or UBS Financial Services Inc. All transactions by a US person in the securities mentioned in this document must be effected through UBS Securities LLC or UBS Financial Services Inc., and not through a non-US affiliate. UBS Securities LLC is not acting as a municipal advisor to any municipal entity or obligated person within the meaning of Section 15B of the Securities Exchange Act (the "Municipal Advisor Rule"), and the opinions or views contained herein are not intended to be, and do not constitute, advice within the meaning of the Municipal Advisor Rule. Canada: Distributed by UBS Securities Canada Inc., a registered investment dealer in Canada and a Member-Canadian Investor Protection Fund, or by another affiliate of UBS AG that is registered to conduct business in Canada or is otherwise exempt from registration. Mexico: This report has been distributed and prepared by UBS Casa de Bolsa, S.A. de C.V., UBS Grupo Financiero, an entity that is part of UBS Grupo Financiero, S.A. de C.V. and is a subsidiary of UBS AG. This document is intended for distribution to institutional or sophisticated investors only. Research reports only reflect the views of the analysts responsible for the reports. Analysts do not receive any compensation from persons or entities different from UBS Casa de Bolsa, S.A. de C.V., UBS Grupo Financiero, or different from entities belonging to the same financial group or business group of such. For Spanish translations of applicable disclosures, please go to www.ubs.com/disclosures. Brazil: Except as otherwise specified herein, this material is prepared by UBS Brasil CCTVM S.A. to persons who are eligible investors residing in Brazil, which are considered to be Investidores Profissionais, as designated by the applicable regulation, mainly the CVM Instruction No. 539 from the 13th of November 2013 (determines the duty to verify the suitability of products, services and transactions with regards to the client´s profile). Hong Kong: Distributed by UBS Securities Asia Limited and/or UBS AG, Hong Kong Branch. Please contact local licensed/registered representatives of UBS Securities Asia Limited and/or UBS AG, Hong Kong Branch in respect of any matters arising from, or in connection with, the analysis or document. Singapore: Distributed by UBS Securities Pte. Ltd. [MCI (P) 008/09/2017 and Co. Reg. No.: 198500648C] or UBS AG, Singapore Branch. Please contact UBS Securities Pte. Ltd., an exempt financial adviser under the Singapore Financial Advisers Act (Cap. 110); or UBS AG, Singapore Branch, an exempt financial adviser under the Singapore Financial Advisers Act (Cap. 110) and a wholesale bank licensed under the Singapore Banking Act (Cap. 19) regulated by the Monetary Authority of Singapore, in respect of any matters arising from, or in connection with, the analysis or document. The recipients of this document represent and warrant that they are accredited and institutional investors as defined in the Securities and Futures Act (Cap. 289). Japan: Distributed by UBS Securities Japan Co., Ltd. to professional investors (except as otherwise permitted). Where this document has been prepared by UBS Securities Japan Co., Ltd., UBS Securities Japan Co., Ltd. is the author, publisher and distributor of the document. Distributed by UBS AG, Tokyo Branch to Professional Investors (except as otherwise permitted) in relation to foreign exchange and other banking businesses when relevant. Australia: Clients of UBS AG: Distributed by UBS AG (ABN 47 088 129 613 and holder of Australian Financial Services License No. 231087). Clients of UBS Securities Australia Ltd: Distributed by UBS Securities Australia Ltd (ABN 62 008 586 481 and holder of Australian Financial Services License No. 231098). This Document contains general information and/or general advice only and does not constitute personal financial product advice. As such, the Information in this document has been prepared without taking into account any investor’s objectives, financial situation or needs, and investors should, before acting on the Information, consider the appropriateness of the Information, having regard to their objectives, financial situation and needs. If the Information contained in this document relates to the acquisition, or potential acquisition of a particular financial product by a ‘Retail’ client as defined by section 761G of the Corporations Act 2001 where a Product Disclosure Statement would be required, the retail client should obtain and consider the Product Disclosure Statement relating to the product before making any decision about whether to acquire the product. The UBS Securities Australia Limited Financial Services Guide is available at: www.ubs.com/ecs-research-fsg. New Zealand: Distributed by UBS New Zealand Ltd. UBS New Zealand Ltd is not a registered bank in New Zealand. You are being provided with this UBS publication or material because you have indicated to UBS that you are a “wholesale client” within the meaning of section 5C of the Financial Advisers Act 2008 of New Zealand (Permitted Client). This publication or material is not intended for clients who are not Permitted Clients (non-permitted Clients). If you are a non-permitted Client you must not rely on this publication or material. If despite this warning you nevertheless rely on this publication or material, you hereby (i) acknowledge that you may not rely on the content of this publication or material and that any recommendations or opinions in such this publication or material are not made or provided to you, and (ii) to the maximum extent permitted by law (a) indemnify UBS and its associates or related entities (and their respective Directors, officers, agents and Advisors) (each a ‘Relevant Person’) for any loss, damage, liability or claim any of them may incur or suffer as a result of, or in connection with, your unauthorised reliance on this publication or material and (b) waive any rights or remedies you may have against any Relevant Person for (or in respect of) any loss, damage, liability or claim you may incur or suffer as a result of, or in connection with, your unauthorised reliance on this publication or material. Korea: Distributed in Korea by UBS Securities Pte. Ltd., Seoul Branch. This document may have been edited or contributed to from time to time by affiliates of UBS Securities Pte. Ltd., Seoul Branch. This material is intended for professional/institutional clients only and not for distribution to any retail clients. Malaysia: This material is authorized to be distributed in Malaysia by UBS Securities Malaysia Sdn. Bhd (Capital Markets Services License No.: CMSL/A0063/2007). This material is intended for professional/institutional clients only and not for distribution

Is Tesla Revolutionary or Evolutionary? 15 August 2018
46
to any retail clients. India: Distributed by UBS Securities India Private Ltd. (Corporate Identity Number U67120MH1996PTC097299) 2/F, 2 North Avenue, Maker Maxity, Bandra Kurla Complex, Bandra (East), Mumbai (India) 400051. Phone: +912261556000. It provides brokerage services bearing SEBI Registration Numbers: NSE (Capital Market Segment): INB230951431, NSE (F&O Segment) INF230951431, NSE (Currency Derivatives Segment) INE230951431, BSE (Capital Market Segment) INB010951437; merchant banking services bearing SEBI Registration Number: INM000010809 and Research Analyst services bearing SEBI Registration Number: INH000001204. UBS AG, its affiliates or subsidiaries may have debt holdings or positions in the subject Indian company/companies. Within the past 12 months, UBS AG, its affiliates or subsidiaries may have received compensation for non-investment banking securities-related services and/or non-securities services from the subject Indian company/companies. The subject company/companies may have been a client/clients of UBS AG, its affiliates or subsidiaries during the 12 months preceding the date of distribution of the research report with respect to investment banking and/or non-investment banking securities-related services and/or non-securities services. With regard to information on associates, please refer to the Annual Report at: http://www.ubs.com/global/en/about_ubs/investor_relations/annualreporting.htmlTaiwan: Distributed by UBS Securities Pte. Ltd., Taipei Branch which is regulated by the Taiwan Securities and Futures Bureau. Indonesia: This report is being distributed by PT UBS Sekuritas Indonesia and is delivered by its licensed employee(s), including marketing/sales person, to its client. PT UBS Sekuritas Indonesia, having its registered office at Wisma GKBI, 22nd floor, JL. Jend. Sudirman, kav.28, Jakarta 10210, Indonesia, is a subsidiary company of UBS AG and licensed under Capital Market Law no. 8 year 1995, a holder of broker-dealer and underwriter licenses issued by the Capital Market and Financial Institution Supervisory Agency (now Otoritas Jasa Keuangan/OJK). PT UBS Sekuritas Indonesia is also a member of Indonesia Stock Exchange and supervised by Otoritas Jasa Keuangan (OJK). Neither this report nor any copy hereof may bedistributed in Indonesia or to any Indonesian citizens except in compliance with applicable Indonesian capital market laws and regulations. This report is not an offer of securities in Indonesia and may not be distributed within the territory of the Republic of Indonesia or to Indonesian citizens in circumstance whichconstitutes an offering within the meaning of Indonesian capital market laws and regulations.
The disclosures contained in research documents produced by UBS Limited shall be governed by and construed in accordance with English law.
UBS specifically prohibits the redistribution of this document in whole or in part without the written permission of UBS and in any event UBS accepts no liability whatsoever for any redistribution of this document or its contents or the actions of third parties in this respect. Images may depict objects or elements that are protected by third party copyright, trademarks and other intellectual property rights. © UBS 2018. The key symbol and UBS are among the registered and unregistered trademarks of UBS. All rights reserved.