Is internet on the right track? The digital divide, path ...
39
Is internet on the right track? The digital divide, path dependence, and the rollout of New Zealand’s ultra-fast broadband Eyal Apatov, Nathan Chappell and Arthur Grimes Motu Working Paper 18-04 Motu Economic and Public Policy Research March 2018
Transcript of Is internet on the right track? The digital divide, path ...

Is internet on the right track? The digital divide, path dependence, and the rollout of New Zealand’s ultra-fast broadband
Eyal Apatov, Nathan Chappell and Arthur Grimes
Motu Working Paper 18-04
Motu Economic and Public Policy Research
March 2018

Is internet on the right track? The digital divide, path dependence, and the rollout of New Zealand’s ultra-fast broadband
i
Document information
Author contact details
Eyal Apatov
Ministry of Business, Innovation and Employment
Nathan Chappell
Motu Economic and Public Policy Research
Arthur Grimes
Motu Economic and Public Policy Research
Victoria University of Wellington
Acknowledgements and disclaimer
This research was undertaken as part of a broader programme funded by a grant from Huawei
New Zealand. We thank Huawei New Zealand for this research funding. The funder had no role
in specifying or reviewing the work of this project and is not responsible for the research
findings. We thank Wilbur Townsend for early help with web-scraping the internet access data,
and for feedback.
Motu Economic and Public Policy Research
PO Box 24390
Wellington
New Zealand
www.motu.org.nz
+64 4 9394250
© 2018 Motu Economic and Public Policy Research Trust and the authors. Short extracts, not exceeding two paragraphs, may be quoted provided clear attribution is given. Motu Working Papers are research materials circulated by their authors for purposes of information and discussion. They have not necessarily undergone formal peer review or editorial treatment. ISSN 1176-2667 (Print), ISSN 1177-9047 (Online).
Is internet on the right track? The digital divide, path dependence, and the rollout of New Zealand’s ultra-fast broadband
ii
Abstract
Using data on internet access for New Zealand’s 46,637 meshblocks, we examine issues of path
dependence and the digital divide. We test whether areas that had the best railway access in the
1880s also have best access to new fibre internet infrastructure. Results suggest strong path
dependence with respect to topography: people in areas that lacked 19th century rail due to
remoteness or terrain are much less likely to have prioritised fibre access and slightly less likely
to have current or (planned) future fibre access. Next, we examine path dependence with
respect to ethnicity, given that 19th century railways deliberately avoided predominantly Māori
areas. The results suggest weak path dependence: countrywide, Māori are slightly less likely to
get fibre access than other New Zealanders, though are slightly more likely to have access within
urban areas. Finally, we examine whether the rollout of fibre is increasing or decreasing the
digital divide in access between rich and poor. Results show that those in more deprived areas
are the most likely to benefit from fibre access, because these areas also tend to be denser and
density was a factor in determining the path of the fibre rollout.
JEL codes
L92, L96, N97
Keywords
Digital divide, path dependence, economic history, inequality, broadband
Summary haiku
New fibre broadband:
Addressing deprivation
In urban areas.

Is internet on the right track? The digital divide, path dependence, and the rollout of New Zealand’s ultra-fast broadband
iii
Table of Contents
1 Introduction 1
2 Background on modern and past infrastructure 3
3 Data 4
4 Methods and results 9
4.1 Path dependency from 19th century railways 9
4.2 Fibre rollout and ethnicity divide 11
4.3 The digital divide and deprivation 17
5 Conclusions 23
References 25
Appendix tables 27
Appendix figures 33
Recent Motu Working Papers 34
Table and Figures
Figure 1: Maps of internet access across New Zealand 8
Figure 2: Raw correlation of Māori proportion with current or future fibre, all New Zealand 13
Figure 3: Correlation of Māori proportion with current or future fibre, by area type 13
Figure 4: Raw correlation of deprivation with current or future fibre, all New Zealand 18
Figure 5: Correlation of deprivation with current or future fibre, by area type 20
Appendix Figure 1: Urban areas mapped by 1880 railway access 33
Table 1: Internet access & deprivation by area type 7
Table 2: Percentage of people with internet access, by 1880 railway status of area 10
Table 3: Proportion in cities and who are Māori, by 1880 railway status of area 11
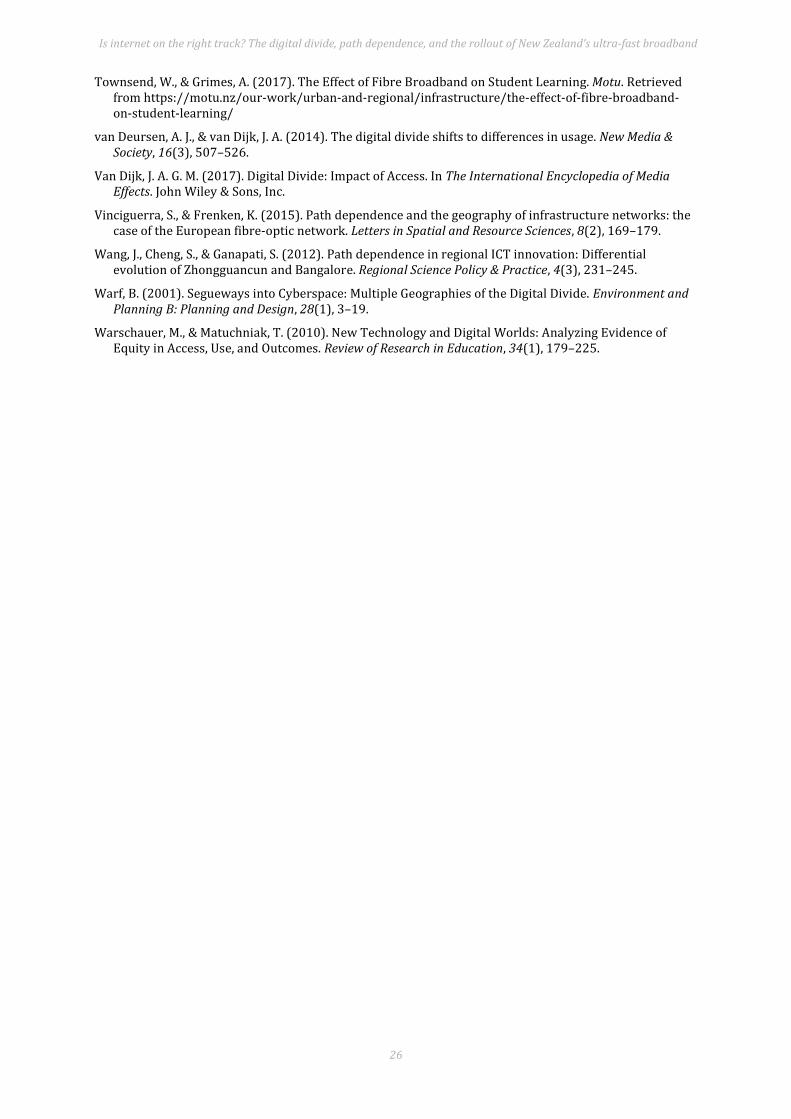
Appendix Table 1: Māori access to current or future fibre 27
Appendix Table 2: Māori access to current fibre 28
Appendix Table 3: Māori access to current or future fast internet 29
Appendix Table 4: Deprived areas’ access to current or future fibre 30
Appendix Table 5: Deprived areas’ access to current fibre 31
Appendix Table 6: Deprived areas’ access to current or future fast internet 32

Is internet on the right track? The digital divide, path dependence, and the rollout of New Zealand’s ultra-fast broadband
1
1 Introduction
Inequality has many faces, and exists both within and between many societal groups. In this
analysis, the face of inequality that we explore is people’s access to new ultra-fast broadband
technologies. Such access may be instrumental in improving an individual’s place within society
in this digital age. The societal groups with which we are concerned are defined by: (i) material
deprivation; (ii) ethnicity; and (iii) geography – particularly with respect to gradations from
urban to rural, and in areas’ remoteness and difficulty of access.
Information technology has the potential to increase economic growth and social well-
being, and yet there is widespread concern about a growing digital divide in which digital
inequalities exacerbate existing inequalities (OECD 2017, World Bank Group 2016). The New
Zealand government’s ultra-fast broadband (UFB) initiative, announced in 2011 and to be
completed by 2022, makes available a new technology through the rollout of fibre broadband
which boosts the opportunities of those with access. Conversely, it may hurt those lacking
access.
We examine three key questions about the rollout of UFB in New Zealand. First, is there
long-term path dependence in the rollout of new infrastructure with respect to topography? In
particular, are the areas that lacked 1880 railways due to terrain or remoteness less likely to
have access to fibre today? Second, is there path dependence with respect to ethnicity – that is,
are areas that were deliberately avoided for railway construction in the 19th century due to the
predominantly Māori population less likely to gain fibre access, and are areas with a higher
proportion of Māori residents today less likely to gain fibre access? Such path dependencies
highlight whether historic infrastructure policies create trajectories that still influence divides
today, just as historic colonial policies have more broadly shaped development across the world
(Acemoglu et al. 2001). Third, is the fibre rollout increasing or decreasing the digital divide with
respect to deprivation – that is, are thriving or struggling areas more likely to gain fibre access?
We use data on all New Zealand meshblocks, which are small geographic areas with an
average of around 100 residents.
To preview our results, we find evidence of strong path dependence due to topography:
people in areas without 1880 railways due to terrain or isolation are much less likely to have
current access to fibre (as of October 2017) than those in areas that had 1880 railway access (40
percent vs. 66 percent), and are slightly less likely to get future access to fibre (90 percent vs. 94
percent). These data are for urban areas only, and we note that path dependencies from railway
infrastructure may be even stronger in broader-rural1 areas.
1 We use this term to refer to rural centres and rural areas.

Is internet on the right track? The digital divide, path dependence, and the rollout of New Zealand’s ultra-fast broadband
2
Second, we find evidence of weaker (though still enduring) path dependence with respect
to ethnicity. Compared with people in urban areas that had 1880 railway access, those in urban
areas without 1880 railway due to the predominantly Māori population are just as likely to have
current or future fibre access, and are more likely to have prioritised fibre access as of October
2017. On the other hand, Māori are slightly less likely than other New Zealanders to get fibre
access due to the rollout: countrywide, a 10 percentage point increase in the Māori population
share is associated with a 1.1 percentage point decrease in the probability of current or future
fibre access. This is despite the fact that within urban areas (cities and medium-sized towns),
Māori are more likely to benefit. This apparent discrepancy arises because main urban areas
have the lowest proportion of Māori residents, and the best fibre access.
Third, our analysis of the digital divide with respect to deprivation suggests that more
deprived areas tend to have better access to current or planned future access to fibre as of
October 2017. This result holds countrywide, where a standard deviation increase in
deprivation is associated with an 8 percentage point increase in the probability of current or
future fibre. It also holds separately for urban and broader-rural area types (though is not
statistically significant in broader-rural meshblocks), and holds when we control for each of the
143 urban areas2 in which New Zealand’s meshblocks fall. Thus the rollout has decreased rather
than exacerbated the prior digital divide by area deprivation. The positive association
disappears when controlling for population density, suggesting that the digital divide has
decreased because internet access comes first to denser areas, and denser areas tend to be more
deprived.
There are two strands of literature related to our paper. The first relates to path
dependency on previous infrastructure. Looking at entire towns, Michaels and Rauch
(forthcoming) use the collapse of the Western Roman Empire as a natural experiment which
reset Britain’s urban network but not France’s. They argue British towns relocated in better
places with access to water, and that history locked French towns into unfavourable places.
Other papers suggest that colonial investments in the early 1900s in French West Africa
increased modern access to infrastructure (Huillery 2009); that differing Silicon Valley
involvement in Zhongguancun, China, and Bangalore, India, led to different paths of ICT
innovation in these regions (Wang et al. 2012); and that European cities that were previously
connected through ports or railways are more likely to have fibre-optic connections, as
estimated with a gravity model (Vinciguerra and Frenken 2014).
Our paper fits into this path dependence literature by using historic data on the reasons
that certain areas missed out on early access to 19th century railways. Such dependence on
railway could arise due to the physical geography of the areas: some areas may not sustain a
2 We control for these urban areas through fixed effects, and add a further two fixed effects for being either in a ‘rural centre’ or being ‘other rural’, in which all non-urban meshblocks fall.

Is internet on the right track? The digital divide, path dependence, and the rollout of New Zealand’s ultra-fast broadband
3
large population and so could miss out on railway and internet infrastructure. Path dependence
may also arise because of the effects of the infrastructure: railways increase connectivity and
may encourage urbanisation and population growth, which in turn increase the probability of
receiving UFB. We find evidence of strong path dependence due to topography, and evidence of
weaker path dependence due to ethnicity, when it comes to modern internet access.
The second related strand explores the digital divide, with work in the early 2000s
emphasising that the wealthy had best access to the internet (Warf 2001, Bonfadelli 2002,
Selwyn 2004, Middleton and Sorensen 2005, Longley and Singleton 2009, Warschauer and
Matuchniak 2010). Some recent studies have moved beyond the divide in access to examine the
divide in usage (van Deursen and van Dijk 2013, van Dijk 2017). Others document the groups for
whom the digital divide remains a problem of access, such as rural dwellers (Townsend et al.
2013, Philip et al. 2017).
We extend this literature by examining access to ultra-fast broadband, an infrastructure
which has improved primary schools’ passing rates (Townsend and Grimes 2017) and improved
the productivity of firms also investing in organisational capital (Fabling and Grimes 2016). The
rollout had the potential to increase the divide in access. Instead, we find that the rollout has
worked in the opposite direction, with struggling areas more likely to gain access. It is possible,
however, that the UFB rollout has increased the rural-urban divide in connectivity; the most
isolated rural households do not have and will not get fibre. Nevertheless, many rural centres
which service surrounding rural households are scheduled to get fibre3, and the Rural
Broadband Initiative is concurrently seeking to improve the connectivity of rural areas.
Section 2 of the paper provides background on previous railway infrastructure and
current internet infrastructure; section 3 outlines the data used; section 4 presents descriptive
statistics and regressions exploring path dependencies of fibre internet access on previous
railway infrastructure, and examines whether the UFB rollout is increasing or decreasing the
digital divide in access between rich and poor; section 5 concludes.
2 Background on modern and past infrastructure
The New Zealand government’s ultrafast broadband (UFB) initiative was announced in 2009 as
a NZ$1.35 billion package (0.7 percent of annual GDP) to give 75 percent of the population
access to fibre broadband by 2019. The initiative’s goal was to improve the connectivity of
businesses, schools, hospitals, and households; fibre broadband was rare prior to the
government rollout, and the main alternative connections (wireless, ADSL, and VDSL) are
slower. The fibre rollout was expanded in August 2017 with a new target of 87 percent coverage
by 2022. In conjunction, the Rural Broadband Initiative was announced as a $300 million
3 From phase 2 of the rollout, announced in 2017.

Is internet on the right track? The digital divide, path dependence, and the rollout of New Zealand’s ultra-fast broadband
4
package of new and upgraded cell towers, to improve 3G and 4G wireless technology in rural
areas missing out on UFB.4
To put our results in context, we first document how the government decided which areas
would gain fibre access. The government worked with four private providers with a focus on
clusters of schools, health premises, and businesses; areas of high demand; areas of high density;
extensions from existing networks transferring to the UFB scheme; and took into consideration
other costs (geography, local planning rules, local works underway, etc.).5 In general, areas that
are not scheduled to gain UFB access tend to be rural with low population density. Urban
meshblocks missing out also tend to have low population density and are often located on the
edge of a town or city. Some towns in the North Island6 (Whangarei and towns in the central
North Island) gained early fibre access because a contract with the provider was signed earlier.
Regarding historic infrastructure, from the 1870s railways opened up areas of New
Zealand for settlement and carried products from farms, forests, and mines to coastal ports
(Atkinson 2010). The lower half of the South Island Main Trunk was completed in 1879,
connecting Christchurch and Invercargill, though the extension to Picton at the top of the South
Island was not finished until 1945. The North Island Main Trunk was not completed until 1908,
connecting Wellington and Auckland. Because railways were built principally to connect
European settlers, areas with mainly Māori inhabitants were often avoided (see the 1880 New
Zealand Railway Commission for explicit recommendations to avoid building railways to
predominantly Māori areas). Areas were also avoided due to difficult terrain or remoteness.
Hence we ask two questions on the links between historic and current infrastructure in
New Zealand. First, are the areas gaining access to UFB also the areas that gained access to
railways in the 19th century? Second, is there an ethnicity gap in access to UFB, given that New
Zealand’s early railway infrastructure deliberately avoided predominantly Māori areas?
3 Data
We use data on the 46,637 meshblocks in New Zealand7, which are small geographic areas with
an average of around 100 residents. We web-scraped the National Broadband Map8 in October
2017 to find whether the centroid of each meshblock has current or future access to fibre, and
also current access to cable, VDSL, ADSL, and wireless broadband connections.
4 The RBI was also extended in August 2017, and received $290 million along with the new Mobile Black Spot Fund. The latter programme will improve mobile access for highways and tourist zones. 5 https://www.crowninfrastructure.govt.nz/ufb-initiative/frequently-asked-questions/ 6 Over 99% of New Zealand’s population lives in two islands, imaginatively named the North Island and the South Island. 7 Dropping water inlets and coastal islands removes 557 meshblocks, dropping areas without any 2013 population removes a further 2,237 meshblocks, and dropping areas without a deprivation score removes a further 138 meshblocks. This leaves 43,689 meshblocks with core data, to which we limit attention in the rest of this paper. 8 https://broadbandmap.nz/. Scraping was completed on 18 October 2017, and so includes the areas gaining fibre access in the future due to phase 2 of the UFB rollout. A meshblock’s internet access is recorded from the coordinates of that meshblock’s centroid.

Is internet on the right track? The digital divide, path dependence, and the rollout of New Zealand’s ultra-fast broadband
5
To this meshblock-connectivity data we link historic railway data from the 1880 report of
the Railway Commission, which details New Zealand’s 1880 railway network. Crucially, it also
recommends areas to which railways should be extended, and gives reasons for not
recommending railways to other areas. Some areas were avoided because of the terrain or
because there were few people living there, while others were avoided because of large
concentrations of Māori people with whom the colonising Europeans had few economic ties.
This allows us to measure whether each urban area in 1880 New Zealand had railway access,
planned railway access, no access due to the prevalence of the Māori population, or no access for
other reasons such as poor terrain or remoteness.9
We also use demographic data from the 2013 census to record each meshblock’s
population, population density, deprivation level, and the proportion of the population who are
Māori. The measure of meshblock deprivation comes from Atkinson et al. (2014), who use
principal component analysis on 9 variables from the 2013 census. We standardise their
deprivation index to have a mean of zero and standard deviation of one across meshblocks, to
ease the interpretation of regression results.
We also document the area type, urban area, and area unit that each meshblock falls
under. Area types are the broad class of urban areas for which the categories comprise: main
urban (30,000 or more people), secondary urban (10,000 to 29,999 people), minor urban (1,000
to 9,999 people), rural centres (under 1,000 people) and rural. Descriptive statistics are
presented separately for the different area types, and key regression covariates are allowed to
vary by area type. Urban areas capture the specific city or town that a meshblock lies within (for
example: Wellington or Hokitika). There are 139 urban areas and two further categories for
‘rural centre’ and ‘rural’, which we include as dummy variables in some regressions.10 Finally,
area units are aggregations of meshblocks that are similar to suburbs, with a mean population of
around 2,300 in our data. In our regressions we cluster standard errors at the area unit level,
because shocks to internet access not accounted for by our regression controls are likely to be
correlated within area units.
The first panel of Table 1 shows the proportion of people with access to different internet
types, separately by area type. As of October 2017, the majority of people in main and secondary
urban areas had access to fibre (69 percent and 81 percent), while very few in minor urban and
rural areas had access (9 percent and 0 percent). Future fibre access is primarily focused on
minor urban areas due to phase 2 of the UFB rollout – 80 percent of people in minor urban areas
will get fibre access in coming years. Together, the first two rows show that most people in cities
9 In the 1880 Railway Commission report, the areas avoided because of the local Māori population do not refer to poor terrain or remoteness. Hence, from the historical data we cannot ascertain whether the areas that were avoided because of the predominantly Māori population would otherwise have lacked a railway due to topographical reasons. 10 We amalgamate Northern, Western, Central, and Southern Auckland into one Auckland urban area. We also amalgamate Porirua, Upper Hutt, Lower Hutt, and Wellington City into one Wellington urban area. This avoids the artificial splitting of New Zealand’s two largest cities.

Is internet on the right track? The digital divide, path dependence, and the rollout of New Zealand’s ultra-fast broadband
6
and towns have or will have fibre access, and that those in broader-rural areas are missing out
(90 percent of whom are not scheduled to receive fibre). We also show other internet access
categories, including fast cable and VDSL and slower ADSL and wireless. Access to these
categories tends to be similar across main, secondary and minor urban areas. Broader-rural
meshblocks again have the worst internet access; only 7 percent of people in broader-rural
meshblocks can access VDSL, and only 44 percent can access ADSL.
The second panel of Table 1 shows, for urban areas only, the proportion of people in 2013
living in an area which had 1880 railway access, planned access, or no access. The majority in
main and secondary urban areas live in places that were connected to an 1880 railway (87
percent and 52 percent respectively), while in minor urban areas the plurality live in areas that
lacked an 1880 railway due to miscellaneous reasons such as remoteness or unsuitable terrain
(49 percent). In all area types, a small but noticeable proportion of people live in areas that
historically lacked railway due to the local Māori population (7-11 percent). The third panel
repeats this information but shows proportions by urban areas, rather than population. The
patterns are similar, though proportions tend to be larger for the ‘no planned railway’
categories, implying that these urban areas tend to have fewer people today.
The fourth panel presents the Māori population share, and shows that main urban areas
have the lowest share (14 percent) while rural centres have the highest (27 percent).
Finally, the fifth panel of Table 1 summarises the distribution of deprivation scores for
people in different area types.11 People in minor urban areas and rural centres tend to have
higher deprivation levels, with respective means that are 0.4 and 0.25 standard deviations above
the national mean. Rural areas are the least deprived.
Figure 1 maps all meshblocks in New Zealand based on their internet access. Panel A
highlights the small amount of land with current fibre access, despite the 55 percent of New
Zealanders with current fibre access.12 Panel B shows the changes due to the ongoing fibre
rollout, with many meshblocks in small and often inland towns getting fibre in the coming years.
Panel C shows the meshblocks with current fast internet access (fibre, cable, or VDSL), covering
many more areas than in Panel A. For completion, Panel D shows the meshblocks with current
or future fast internet access.
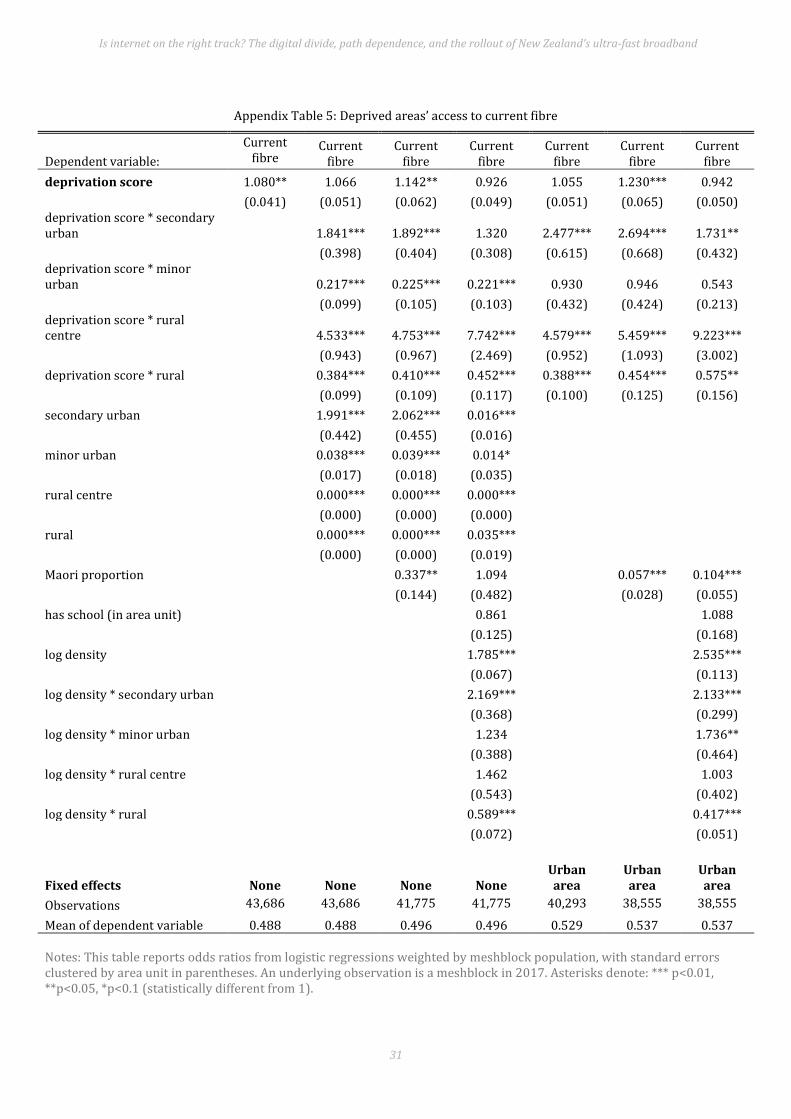
Finally, Appendix Figure 1 maps the urban areas of New Zealand by 19th century railway
access.13 The largest cities today (other than Hamilton) were also the urban centres in the late
1800s, and had railway access. Areas without planned railway access due to the Māori
population were in the North Island and tended to be north and south of the King Country,
11 Note that the deprivation data is at the meshblock level. These results are meshblock-level statistics that are weighted by population size. 12 This comes from the final column of Table 1. 13 This figure is only suitable for viewing in colour.

Is internet on the right track? The digital divide, path dependence, and the rollout of New Zealand’s ultra-fast broadband
7
where colonial forces had invaded local iwi (tribes) in the 1860s over disputed land sales,
leading to land confiscations in the New Zealand Wars.
Table 1: Internet access & deprivation by area type
Main urban
Second-ary
urban
Minor urban
Rural centre
Rural All New Zealand
Internet access
Current fibre (%) 69% 81% 9% 0% 0% 55%
Planned fibre (%) 25% 8% 80% 51% 4% 26%
Cable (%) 15% 0% 0% 1% 0% 11%
VDSL (%) 74% 72% 64% 51% 7% 64%
ADSL (%) 96% 96% 96% 84% 44% 90%
Wireless (%) 96% 95% 96% 93% 82% 94%
1880 railway access (population-weighted)
Had 1880 railway 87% 52% 32% -- -- --
Planned 1880s railway 2% 13% 8% -- -- --
No planned 1880s railway due to Maori population
7% 8% 11% -- --
--
No planned 1880s railway due to other reasons
4% 27% 49% -- --
--
1880 railway access (urban-area level)
Urban areas with 1880 railway 60% 50% 35% -- -- --
Urban areas with planned railway 10% 14% 6% -- -- --
Urban areas with no planned railway due to Maori population
20% 7% 7% -- --
--
Urban areas with no planned railway due to other reasons
10% 29% 52% -- --
--
Māori population share (%) 14% 19% 23% 27% 17% 16%
Deprivation
Mean deprivation -0.01 0.17 0.40 0.25 -0.38 0.00
10th percentile deprivation -1.08 -0.93 -0.82 -0.87 -1.04 -1.04
Median deprivation -0.29 -0.03 0.22 0.02 -0.55 -0.28
90th percentile deprivation 1.47 1.54 1.89 1.74 0.44 1.45
Observations
Number of urban areas 20 14 103 1 1 139
Observations (meshblocks) 27,467 2,609 4,186 1,058 8,369 43,689
Weighted observations (people) 3,066,495 238,995 337,065 71,970 513,528 4,228,053
Notes: Underlying observations are meshblocks weighted by population size, except for the third panel where underlying observations are urban areas. Current and planned fibre together have a maximum possible value of 100%; each other access category individually has a maximum possible value of 100%. Internet data are from October 2017. Deprivation scores are from Atkinson et al. (2014) and have been standardised to have a mean of 0 and standard deviation of 1 across all meshblocks. The 1880 railway data are collected only for main urban, secondary urban, and minor urban areas.

Is internet on the right track? The digital divide, path dependence, and the rollout of New Zealand’s ultra-fast broadband
8
Figure 1: Maps of internet access across New Zealand
Panel A: Current fibre Panel B: Current or future fibre
Panel C: Current fast internet Panel D: Current or future fast internet
Notes: ‘Current’ access is as of October 2017, for the centroid of a given meshblock. ‘Fast’ internet denotes fibre, cable, or VDSL.
Is internet on the right track? The digital divide, path dependence, and the rollout of New Zealand’s ultra-fast broadband
9
4 Methods and results
4.1 Path dependency from 19th century railways
We now explore whether current internet access is related to railway infrastructure in the
1880s. Specifically, we calculate the proportion of people with fibre or fast internet access,
shown separately for people in different areas based on the area’s railway infrastructure in
1880, to see whether areas lacking railway infrastructure in the 1880s also had worse internet
access as of October 2017. Note that the patterns exclude broader-rural meshblocks for which
we lack railway data.
Table 2 presents the proportions. Row (1) considers current fibre access (at October
2017), and shows that people in areas with planned railways or that lacked railways because of
the Māori population are more likely to have fibre access than areas that had railway in 1880
(75 percent and 73 percent respectively). People in areas with 1880 railway are somewhat less
likely to have early fibre access (66 percent), while those in areas lacking 1880 railway for other
reasons, such as remoteness or terrain, have significantly worse fibre access (40 percent).
Row (2) considers current or future fibre access, and shows that areas with access to 1880
railway are more likely to benefit from the UFB rollout, though the differences are small: 94
percent of people in areas with an 1880 railway had current or future fibre access as at October
2017. The corresponding figure is around 90 percent for people in areas that had a planned
1880s railway and for areas that had no railway due to other reasons, showing that the poor
terrain/remoteness disadvantage will be mostly rectified by 2022. Almost 93 percent of people
had current or future fibre access in areas that had no planned 1880s railway due to the
predominantly Māori population. This implies that old ethnic disparities in infrastructure access
have not translated into current disparities in internet access, at least when looking at
geographic areas.14
Row (3) replicates row (1) but looks broadly at fast internet (fibre, cable, or VDSL) rather
than just at fibre. People in areas that had a railway in 1880 are most likely to have fast internet
access, while those in planned-railway and no-railway-due-to-Māori areas are only slightly less
likely. As before, those in areas that had no railway due to remoteness or unsuitable terrain are
substantially less likely to have fast internet access than other areas (an estimated 78 percent
versus 90 percent). In row (4) we replicate row (2) but with a fast internet variable. The
patterns are similar to those in row (2).15
14 However, we are unable to look at disparities in fibre uptake and usage. 15 We have also estimated logistic regressions of internet access on the railway-access dummy variables. The predictive margins are, by nature, identical to the reported group-level means, and standard errors are small (usually around 1-3 percent, except for ‘has fibre access’ where they are closer to 9 percent).

Is internet on the right track? The digital divide, path dependence, and the rollout of New Zealand’s ultra-fast broadband
10
Table 2: Percentage of people with internet access, by 1880 railway status of area
Had 1880 railway
Planned 1880s railway
No planned 1880s railway due to Māori population
No planned 1880s railway due to other reasons
Has fibre access (%) 66% 75% 73% 40%
Has or getting fibre (%) 94% 90% 93% 90%
Has fast internet (%) 90% 87% 89% 78%
Has or getting fast internet (%) 96% 92% 94% 92%
Observations (meshblocks) 26,236 1,272 2,735 4,019
Weighted observations (people) 2,894,334 123,957 283,413 340,851 Notes: This table reports population-weighted meshblock means of internet access variables, presented separately for meshblocks based on their 1880 railway infrastructure. Internet access is ‘fast’ if it is fibre, cable, or VDSL.
If access to 19th century railways had a causal impact on access to 21st century internet
infrastructure, one plausible mechanism is by fostering development, and hence urbanisation
and greater density. To explore this mechanism, the first row of Table 3 calculates the
percentage of people living in a main urban area, separately by an area’s 1880 railway
infrastructure. The results show that people in areas with 1880 rail access are the most likely to
be in main urban areas (92 percent) followed by people in areas that had no planned railway
due to the Māori population (80 percent). The numbers are much lower for people in areas with
planned 1880s railway or no railway due to terrain or remoteness (54 percent and 33 percent
respectively). These correlations do not establish causality because historic railways may have
been built in areas that were already growing. However, they are consistent with the
international literature which indicates that 19th century railways fostered population growth
and urbanisation in a variety of countries (see, for example, Atack et al. 2010 and Beeson et al.
2001 in the United States; Schwartz et al. 2011 in rural France and the United Kingdom;
Koopmans et al. 2012 in the Netherlands; and Hornung 2015 for historic Prussia).

Is internet on the right track? The digital divide, path dependence, and the rollout of New Zealand’s ultra-fast broadband
11
Table 3: Proportion in cities and who are Māori, by 1880 railway status of area
Had 1880 railway
Planned 1880s railway
No planned 1880s railway due to Māori population
No planned 1880s railway due to other reasons
In a main urban area (%) 92% 54% 80% 33%
Māori population share (%) 13% 24% 24% 25%
Observations (meshblocks) 26,236 1,272 2,735 4,019
Weighted observations (people) 2,894,334 123,957 283,413 340,851 Notes: This table reports population-weighted meshblock means, presented separately for meshblocks based on their 1880 railway infrastructure. Internet access is ‘fast’ if it is fibre, cable, or VDSL.
In conjunction with this literature, our correlations are suggestive of path dependencies in
which urban internet infrastructure reflects past railway infrastructure. People in areas that
were historically avoided for railways because of Māori settlement are very close in terms of
access to those that had an 1880 railway, suggesting that historic discrimination in
infrastructure access has not translated into current disparity in internet access. Although
people in areas lacking 1880s railway because of terrain or remoteness currently have the worst
fibre and fast broadband access, this disparity largely disappears when taking future access into
account because the updated UFB rollout will reach many of these people in the coming years.
Thus there has been a divide in priority of access, but not in long-term access to fibre and/or fast
broadband in urban areas.
The second row of Table 3 replicates the first row but reports the share of the population
who are Māori. The results show some path dependence with respect to ethnicity population
shares: the Māori population share is lowest (13 percent) in areas that had an 1880 railway and
is higher in the other three railway categories (24-25 percent).
We stress that we have focused only on urban cities and towns in this aspect of the
analysis because the source of our railway data only captures the 1880 railways status for
current towns and cities. We conjecture that it is likely that railway-internet path dependencies
are stronger in broader-rural areas.
4.2 Fibre rollout and ethnicity divide
Section 4.1 suggested that old ethnic disparities in railway access have not translated into worse
internet access today at the geographic level. But people move, and after World War Two there
was a flow of Māori from rural into urban areas. This section explores whether areas with higher
proportions of Māori residents today are more or less likely to have access to fibre and/or fast
internet. Any inequalities in digital access are especially relevant, both because colonial railway
construction deliberately avoided predominantly Māori areas and because Māori people tend to

Is internet on the right track? The digital divide, path dependence, and the rollout of New Zealand’s ultra-fast broadband
12
experience worse socioeconomic outcomes than other New Zealanders (see Marie et al. 2014
and the references within). We estimate descriptive logistic regressions of the following form:
𝑦𝑖 = 𝛼𝑃𝑟𝑜𝑝_𝑀ā𝑜𝑟𝑖𝑖 + 𝛽𝐴𝑟𝑒𝑎_𝑡𝑦𝑝𝑒𝑖 + 𝛾𝑃𝑟𝑜𝑝_𝑀ā𝑜𝑟𝑖𝑖 ∗ 𝐴𝑟𝑒𝑎_𝑡𝑦𝑝𝑒𝑖 + 𝛿𝑋𝑖 + 휀𝑖 (1)
where the subscript i denotes the meshblock; 𝑦𝑖 is a binary variable capturing whether the
meshblock has (or will get) fibre access; 𝑃𝑟𝑜𝑝_𝑀ā𝑜𝑟𝑖𝑖 is the proportion of a meshblock’s
population who are Māori ; 𝐴𝑟𝑒𝑎_𝑡𝑦𝑝𝑒𝑖 is a vector of dummy variables capturing whether the
meshblock is in a main urban, secondary urban, minor urban, rural centre, or rural area; 𝑋𝑖 is a
vector of other control variables including the log of population density and a dummy for
whether the meshblock’s area unit contains a school (one of the determining factors in the
prioritisation of fibre rollout); and 휀𝑖 is the error term. As discussed in the data section, we
cluster standard errors by area unit to allow within-area-unit correlation of the error term. Note
that all regressions are weighted by a meshblock’s population, because we are more interested
in people’s internet access than an area’s access.
The key parameters are 𝛼, which tells us how the Māori proportion correlates with
internet access in main urban areas, and – in some specifications – the vector 𝛾 which tells us
how much larger or smaller this correlation is in other area types (since ‘main urban’ is the
omitted variable from the Area_type vector). In certain specifications we also include a set of
dummy variables for the 139 urban areas of New Zealand to examine the UFB rollout within a
given city or town and control for the fact that some places gained early access due to
contractual reasons.
To display the most basic relationship, Figure 3 presents average marginal effects of the
current Māori population proportion on the probability of having current or future fibre,
without controlling for area type and each area type’s interaction with the Māori population
proportion. We focus on this outcome variable because we are interested in whether the fibre
rollout will cause (or rectify) a persistent change in digital divides, and so we include planned
fibre together with current fibre access in the outcome.16 Because of our scaling, point estimates
are for a 10 percentage point increase in the Māori population proportion. The point estimate is
small, negative, and statistically significant: on average, a 10 percentage point increase in the
Māori population proportion is associated with a 1.1 percentage point decrease in the
probability of current or future fibre access.
16 Full results are shown in Appendix Table 1. For completeness, Appendix Table 2 and Appendix Table 3 replicate Appendix Table 1 but with current fibre and current or future fast internet, respectively, as the dependent variables.

Is internet on the right track? The digital divide, path dependence, and the rollout of New Zealand’s ultra-fast broadband
13
Figure 2: Raw correlation of Māori proportion with current or future fibre, all New Zealand
Notes: This figure presents average marginal effects from the regression shown in column (1) of Appendix Table 1. The bar represents the 95% confidence interval of the estimate.
Figure 3: Correlation of Māori proportion with current or future fibre, by area type
Panel A: No further controls
Is internet on the right track? The digital divide, path dependence, and the rollout of New Zealand’s ultra-fast broadband
14
Panel B: Deprivation Control
Panel C: Deprivation, density & school controls

Is internet on the right track? The digital divide, path dependence, and the rollout of New Zealand’s ultra-fast broadband
15
Panel D: Urban area FE
Panel E: Urban area FE & deprivation controls

Is internet on the right track? The digital divide, path dependence, and the rollout of New Zealand’s ultra-fast broadband
16
Panel F: UA, depr., school & density controls
Notes: Panels A-F present average marginal effects, separately by area type, from the regressions shown in columns (2)-(7) of Appendix Table 1. The bars represent the 95% confidence intervals of the estimates.
To highlight differences by area type, we estimate logistic regressions which include
dummies for area type and their interactions with the Māori population proportion. The six
panels of Figure 3 present average marginal effects of the Māori population proportion
corresponding to columns (2)-(7) of Appendix Table 1, which are based on equation (1); the
specifications differ from each other according to the nature of additional controls that are
included.
Panel A presents the most parsimonious specification that includes the Māori proportion
and controls for area type, and the interaction of each of these variables. It suggests that areas
with a higher Māori proportion have somewhat better access in cities and towns, and somewhat
worse access in broader-rural areas. For example, the largest estimate is for secondary urban
areas and implies that a 10 percentage point increase in the Māori population proportion is
associated with a 1.3 percentage point increase in the probability of having current or future
fibre. None of these estimates, however, is statistically significant.
Panel B further controls for the deprivation level of a meshblock. The estimates are all
negative and statistically significant. Hence there is a Māori disparity in fibre access in each area
type, after accounting for the fact that predominantly Māori areas also tend to experience
greater material deprivation.

Is internet on the right track? The digital divide, path dependence, and the rollout of New Zealand’s ultra-fast broadband
17
Panel C controls for a meshblock’s deprivation, the presence of a school, and the log of
population density and its interaction with urban type. The point estimates are negative but
close to zero, suggesting that density explains the patterns seen in the previous two panels.17
Panel D returns to the most basic specification and includes urban area fixed effects, to
compare meshblocks within a given town or city. The point estimates for main and secondary
urban areas are positive and statistically significant, while estimates for minor urban, rural
centre and rural areas are close to zero and statistically insignificant. Panel E controls for
deprivation and the estimates are negative and statistically significant except for secondary
urban areas. This again suggests an ethnic disparity within towns after accounting for
deprivation. Panel F controls for the deprivation, the log of density and urban area fixed effects.
The estimates again tend to be negative and close to zero, further suggesting little association
between the Māori population proportion and fibre access after accounting for density.
How do we reconcile Figure 1, which suggests Māori are less likely than other New
Zealanders to benefit from the fibre rollout, with Figure 3, which suggests Māori are likely to
benefit in urban areas and are only slightly less likely to benefit in broader-rural areas? The
reconciliation comes from the fact that main urban areas have the lowest proportion of Māori
residents, and the best fibre access (see Table 1). Hence overall Māori are less likely to get fibre
access, though within cities and large towns Māori are more likely.
4.3 The digital divide and deprivation
We also examine the UFB rollout’s impact on the digital divide by deprivation (rather than
ethnicity), by analysing the relationship between area deprivation and fibre access.
Appendix Table 4 shows estimates based on model (1), with deprivation substituted for
the Māori population proportion, reporting odds ratios and with standard errors again clustered
at the area unit level. Average marginal effects of column (1) are shown in Figure 4, which
presents the simplest raw relationship between deprivation and fibre access. The point estimate
is positive, large, and statistically significant: a standard deviation increase in deprivation is
associated with an 8 percentage point increase in the probability of current or future fibre
access.
17 Unreported specifications which include density but exclude school dummies look very similar, meaning population density is the most important addition to Panel C.

Is internet on the right track? The digital divide, path dependence, and the rollout of New Zealand’s ultra-fast broadband
18
Figure 4: Raw correlation of deprivation with current or future fibre, all New Zealand
Notes: This figure presents average marginal effects from the regression shown in column (1) of Appendix
Table 4. The bar represents the 95% confidence interval of the estimate.
To highlight differences by area type, we again estimate this relationship separately for
each area type and present the results in Figure 5. The six panels correspond to columns (2) to
(7) of Appendix Table 4.18
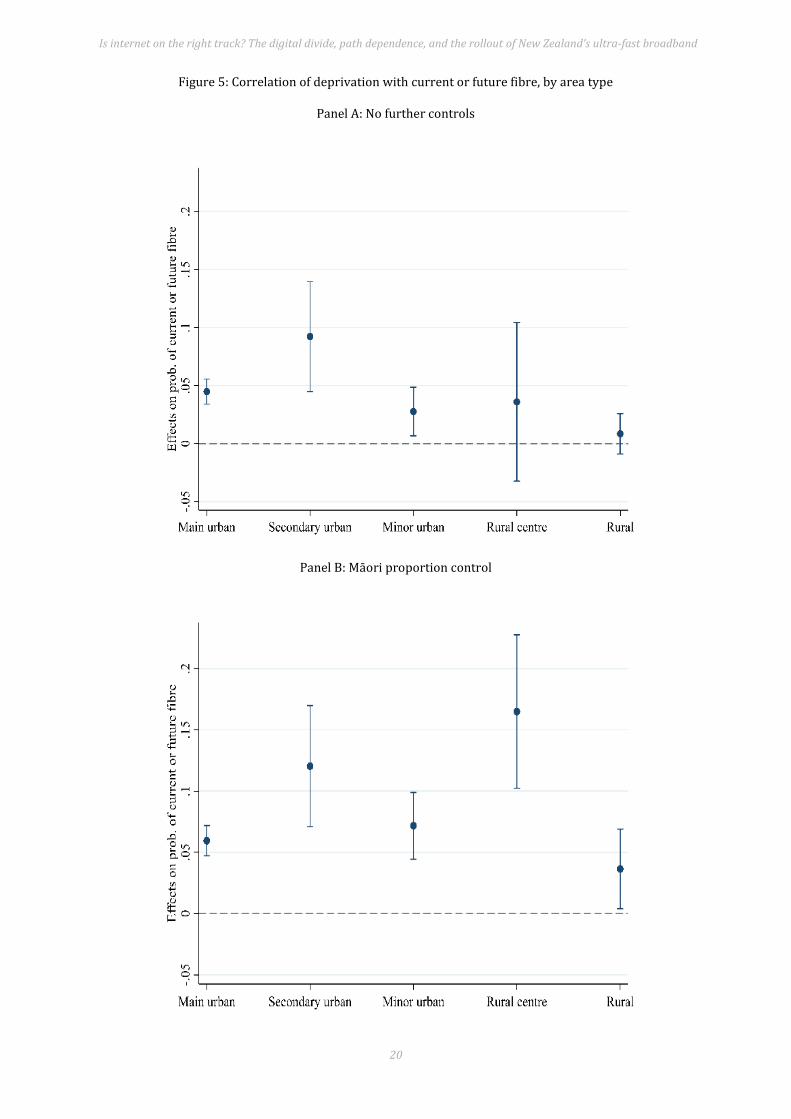
Panel A of Figure 5, which contains no additional control variables, shows that people in
more deprived meshblocks are more likely to have gained from the UFB rollout across all area
types; a one standard deviation increase in deprivation is associated with a 5 percentage point
(pp) increase in the probability of having current or future fibre access in main urban areas. The
corresponding estimate is 10 pp for secondary urban areas, 3 pp for minor urban areas, 4 pp for
rural centres, and 1 pp for rural areas. These estimates are of moderate size, and are statistically
significant in the urban areas.
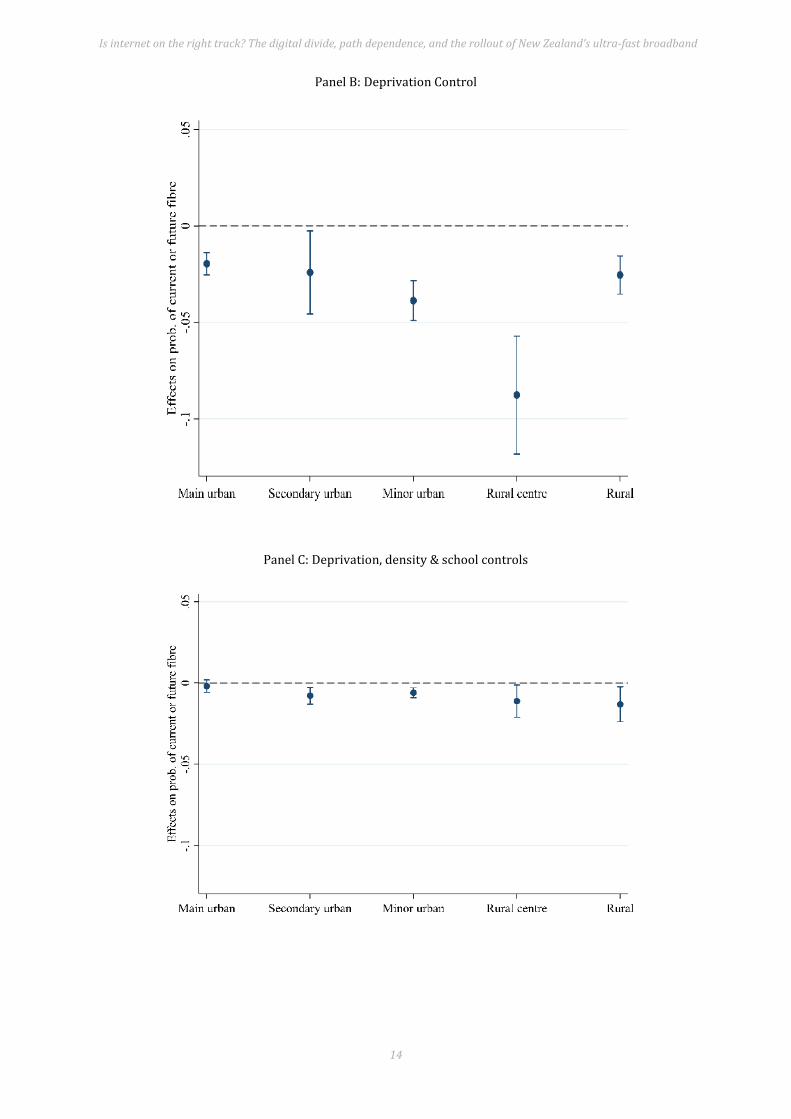
Panel B controls for the proportion of a meshblock’s population who are Māori. The point
estimates increase relative to Panel A for all area types, meaning deprivation brings better
access to fibre by an even greater extent after controlling for the ethnicity of an area. This is the
flipside of our result in Section 4.2 that, controlling for deprivation, Māori experience reduced
access to fibre.
18 Appendix Table 5 and Appendix Table 6 present results for current fibre and for current or future fast internet
respectively.

Is internet on the right track? The digital divide, path dependence, and the rollout of New Zealand’s ultra-fast broadband
19
Panel C adds further controls for the log of population density and whether the
meshblock’s area unit contains a school. In all area types the point estimates shrink and become
close to zero, and are statistically insignificant except for main urban areas. Unreported
estimates that control only for having a school are very similar to Panel A, suggesting that UFB
went to deprived areas because these areas tend to be denser.
Panel D returns to our parsimonious specification but includes urban area fixed effects.
Estimates are similar to Panel A. Panel E retains urban area fixed effects and controls for the
Māori proportion, and again the point estimates on deprivation increase moderately. Panel F
further controls for population density and having a school. Estimates again shrink to around
zero, suggesting that deprivation’s positive association with UFB access can be explained mostly
by population density.
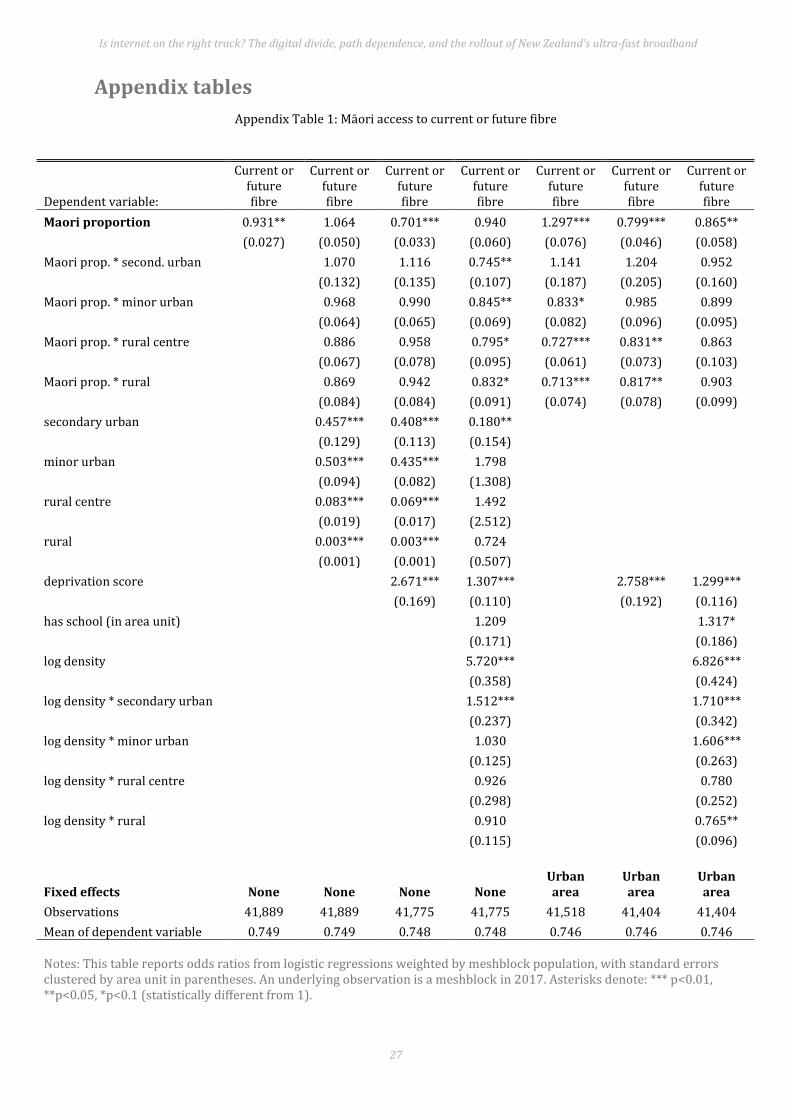
When we replace current or future fibre access by current access only (Appendix Table 5), the
key change is that people in more deprived parts of minor urban areas have a reduced likelihood
of access (especially in the three cases that exclude urban area fixed effects). We have also
estimated a multinomial logit regression replicating column (2) of Appendix Table 4 but where
the dependent variable can take on values ‘no fibre’, ‘current fibre’ and ‘future fibre’.19 The
results corroborate our previous findings; more deprived areas are more likely to have current
or future fibre access, particularly in main and secondary urban areas. In minor urban areas,
current fibre access is less likely among more deprived areas but future fibre access is more
likely, suggesting any socioeconomic divide in access will soon be eliminated.
The results above focus on the UFB rollout. We have also explored whether more deprived
areas have better access to fast internet of any type (Appendix Table 6).20 The results show very
similar patterns to those of Figure 5, indicating that the combined effect of the UFB rollout with
New Zealand’s pre-existing internet infrastructure is not exacerbating a digital divide within
towns and cities; once the rollout is complete, people in more deprived areas will have better
access to fast internet than people in wealthier areas.
19 The underlying regression results are not reported but are available upon request. 20 We also ran regressions where the dependent variable is a dummy for having current fast internet (fibre, cable, or VDSL). Results, not reported, are similar to Appendix Table 6: in non-rural areas, more deprived meshblocks are more likely to have current access to fast internet, and this is driven by the higher density of more deprived areas.
Is internet on the right track? The digital divide, path dependence, and the rollout of New Zealand’s ultra-fast broadband
20
Figure 5: Correlation of deprivation with current or future fibre, by area type
Panel A: No further controls
Panel B: Māori proportion control

Is internet on the right track? The digital divide, path dependence, and the rollout of New Zealand’s ultra-fast broadband
21
Panel C: Māori, density & school control
Panel D: Urban area FE

Is internet on the right track? The digital divide, path dependence, and the rollout of New Zealand’s ultra-fast broadband
22
Panel E: Urban area FE & Māori control
Panel F: UA FE and Māori, school & density controls
Notes: Panels A-F present average marginal effects, separately by area type, from the regressions shown
in columns (1)-(6) of Appendix Table 4. The bars represent the 95% confidence intervals of the estimates.

Is internet on the right track? The digital divide, path dependence, and the rollout of New Zealand’s ultra-fast broadband
23
5 Conclusions
We have examined whether the rollout of ultra-fast broadband in New Zealand is path
dependent on 19th century railway infrastructure, either due to topographical or discriminatory
reasons, and whether the rollout is creating a new digital divide in access. Using data on all
meshblocks in New Zealand, we find that people in urban areas that lacked 1880 railway due
principally to reasons of remoteness and terrain were 26 percentage points less likely to have
had prioritised fibre access as of October 2017, but are only 4 percentage points less likely to
have current or future fibre access. These path dependence results pertain to urban areas only; it
is quite possible that broader-rural areas exhibited stronger path dependence in terms of the
lingering effects of remoteness and terrain on infrastructure access.
The data suggest weaker but still enduring path dependence relating to ethnicity. On the
one hand, people in urban areas that lack 1880 railways due to a higher concentration of the
Māori population are only one percentage point less likely to have current or future fibre than
those in areas with an 1880 railway, and are more likely to have had prioritised access (75
percent versus 66 percent). However, when we consider all of New Zealand, Māori are slightly
less likely to benefit from the UFB rollout: a 10 percentage point increase in the Māori
population share is associated with a 1.1 percentage point decrease in the probability of current
or future access. This countrywide pattern holds despite the fact that Māori are more likely to
gain fibre access in urban areas, and only slightly less likely to have access in broader-rural
areas; the discrepancy arises because cities have the lowest Māori population share and the best
fibre access.
Finally, we find that people in more deprived areas are more likely to have current or
future access to fibre than people in less deprived areas. Countrywide, a standard deviation
increase in the material deprivation measure of an area is associated with an 8 percentage point
increase in the probability of current or future fibre access. The positive association also holds
within different area types. This relationship disappears after controlling for population density;
more deprived areas tend to be denser, and it appears to be density that fosters better internet
access.
It is important to highlight that we have focused on geographical internet access, which is
different from an individual’s internet use. Although the data provide an optimistic picture of the
UFB rollout for those concerned with a geographical digital divide in access related to
deprivation, it is possible that more disadvantaged households use the internet in different ways
and/or are less likely to take up fibre broadband when available. Future research could look
more closely at how different types of individual use their increasingly powerful internet
connections, and whether some groups are gaining from online education and training while

Is internet on the right track? The digital divide, path dependence, and the rollout of New Zealand’s ultra-fast broadband
24
others fall (relatively) behind. Such individual-based analysis would complement our spatial
analysis.
The spatial analysis shows that while there is a digital divide between more and less
remote areas, and while we find a slight worsening of the overall divide in access by ethnicity,
New Zealand’s fibre rollout has positively addressed potential divides based on material
deprivation. With respect to this face of inequality, therefore, some key divides have been
narrowed through the provision of ultra-fast fibre broadband.

Is internet on the right track? The digital divide, path dependence, and the rollout of New Zealand’s ultra-fast broadband
25
References
Acemoglu, D., Johnson, S., & Robinson, J. A. (2001). The Colonial Origins of Comparative Development: An Empirical Investigation. American Economic Review, 91(5), 1369–1401.
Atack, J., Bateman, F., Haines, M., & Margo, R. A. (2010). Did Railroads Induce or Follow Economic Growth?: Urbanization and Population Growth in the American Midwest, 1850–1860. Social Science History, 34(2), 171–197.
Atkinson, J., Salmond, C., & Crampton, P. (n.d.). NZDep2013 Index of Deprivation. Retrieved November 1, 2017, from http://www.health.govt.nz/publication/nzdep2013-index-deprivation
Atkinson, N. (2010, revised 2016). Railways. Te Ara – the Encyclopedia of New Zealand. Retrieved November 1, 2017, from http://www.TeAra.govt.nz/en/railways.
Beeson, P. E., DeJong, D. N., & Troesken, W. (2001). Population growth in U.S. counties, 1840–1990. Regional Science and Urban Economics, 31(6), 669–699.
Bonfadelli, H. (2002). The Internet and Knowledge Gaps: A Theoretical and Empirical Investigation. European Journal of Communication, 17(1), 65–84.
Fabling, R., & Grimes, A. (2016). Picking up speed: Does ultrafast broadband increase firm productivity? Retrieved October 31, 2017, from https://motu.nz/our-work/productivity-and-innovation/firm-productivity-and-performance/picking-up-speed-does-ultrafast-broadband-increase-firm-productivity/
Hornung, E. (2015). Railroads and Growth in Prussia. Journal of the European Economic Association, 13(4), 699–736.
Huillery, E. (2009). History Matters: The Long-Term Impact of Colonial Public Investments in French West Africa. American Economic Journal: Applied Economics, 1(2), 176–215.
Koopmans, C., Rietveld, P., & Huijg, A. (2012). An accessibility approach to railways and municipal population growth, 1840–1930. Journal of Transport Geography, 25(Supplement C), 98–104.
Longley, P. A., & Singleton, A. D. (2009). Linking Social Deprivation and Digital Exclusion in England. Urban Studies, 46(7), 1275–1298.
Marie, D., Fergusson, D. M., & Boden, J. M. (2014). Childhood socio-economic status and ethnic disparities in psychosocial outcomes in New Zealand. Australian & New Zealand Journal of Psychiatry, 48(7), 672–680.
Michaels, G., & Rauch, F. (forthcoming). Resetting the Urban Network: 117-2012. The Economic Journal.
Middleton, C. A., & Sorensen, C. (2005). How Connected Are Canadians? Inequities in Canadian Households’ Internet Access. Canadian Journal of Communication, 30(4).
OECD. (2016). Economic and Social Benefits of Internet Openness (OECD Digital Economy Papers). Paris: Organisation for Economic Co-operation and Development. Retrieved from http://www.oecd-ilibrary.org/content/workingpaper/5jlwqf2r97g5-en
Philip, L., Cottrill, C., Farrington, J., Williams, F., & Ashmore, F. (2017). The digital divide: Patterns, policy and scenarios for connecting the “final few” in rural communities across Great Britain. Journal of Rural Studies, 54(Supplement C), 386–398.
Schwartz, R., Gregory, I., & Thévenin, T. (2011). Spatial History: Railways, Uneven Development, and Population Change in France and Great Britain, 1850–1914. The Journal of Interdisciplinary History, 42(1), 53–88.
Selwyn, N. (2004). Reconsidering Political and Popular Understandings of the Digital Divide. New Media & Society, 6(3), 341–362.
The World Bank. (2016). World Development Report 2016: Digital Dividends. Retrieved from http://ictlogy.net/bibliography/reports/projects.php?idp=2958
Townsend, L., Sathiaseelan, A., Fairhurst, G., & Wallace, C. (2013). Enhanced broadband access as a solution to the social and economic problems of the rural digital divide. Local Economy, 28(6), 580–595.
Is internet on the right track? The digital divide, path dependence, and the rollout of New Zealand’s ultra-fast broadband
26
Townsend, W., & Grimes, A. (2017). The Effect of Fibre Broadband on Student Learning. Motu. Retrieved from https://motu.nz/our-work/urban-and-regional/infrastructure/the-effect-of-fibre-broadband-on-student-learning/
van Deursen, A. J., & van Dijk, J. A. (2014). The digital divide shifts to differences in usage. New Media & Society, 16(3), 507–526.
Van Dijk, J. A. G. M. (2017). Digital Divide: Impact of Access. In The International Encyclopedia of Media Effects. John Wiley & Sons, Inc.
Vinciguerra, S., & Frenken, K. (2015). Path dependence and the geography of infrastructure networks: the case of the European fibre-optic network. Letters in Spatial and Resource Sciences, 8(2), 169–179.
Wang, J., Cheng, S., & Ganapati, S. (2012). Path dependence in regional ICT innovation: Differential evolution of Zhongguancun and Bangalore. Regional Science Policy & Practice, 4(3), 231–245.
Warf, B. (2001). Segueways into Cyberspace: Multiple Geographies of the Digital Divide. Environment and Planning B: Planning and Design, 28(1), 3–19.
Warschauer, M., & Matuchniak, T. (2010). New Technology and Digital Worlds: Analyzing Evidence of Equity in Access, Use, and Outcomes. Review of Research in Education, 34(1), 179–225.
Is internet on the right track? The digital divide, path dependence, and the rollout of New Zealand’s ultra-fast broadband
27
Appendix tables
Appendix Table 1: Māori access to current or future fibre
Dependent variable:
Current or future fibre
Current or future fibre
Current or future fibre
Current or future fibre
Current or future fibre
Current or future fibre
Current or future fibre
Maori proportion 0.931** 1.064 0.701*** 0.940 1.297*** 0.799*** 0.865**
(0.027) (0.050) (0.033) (0.060) (0.076) (0.046) (0.058)
Maori prop. * second. urban 1.070 1.116 0.745** 1.141 1.204 0.952
(0.132) (0.135) (0.107) (0.187) (0.205) (0.160)
Maori prop. * minor urban 0.968 0.990 0.845** 0.833* 0.985 0.899
(0.064) (0.065) (0.069) (0.082) (0.096) (0.095)
Maori prop. * rural centre 0.886 0.958 0.795* 0.727*** 0.831** 0.863
(0.067) (0.078) (0.095) (0.061) (0.073) (0.103)
Maori prop. * rural 0.869 0.942 0.832* 0.713*** 0.817** 0.903
(0.084) (0.084) (0.091) (0.074) (0.078) (0.099)
secondary urban 0.457*** 0.408*** 0.180**
(0.129) (0.113) (0.154)
minor urban 0.503*** 0.435*** 1.798
(0.094) (0.082) (1.308)
rural centre 0.083*** 0.069*** 1.492
(0.019) (0.017) (2.512)
rural 0.003*** 0.003*** 0.724
(0.001) (0.001) (0.507)
deprivation score 2.671*** 1.307*** 2.758*** 1.299***
(0.169) (0.110) (0.192) (0.116)
has school (in area unit) 1.209 1.317*
(0.171) (0.186)
log density 5.720*** 6.826***
(0.358) (0.424)
log density * secondary urban 1.512*** 1.710***
(0.237) (0.342)
log density * minor urban 1.030 1.606***
(0.125) (0.263)
log density * rural centre 0.926 0.780
(0.298) (0.252)
log density * rural 0.910 0.765**
(0.115) (0.096)
Fixed effects None None None None Urban area
Urban area
Urban area
Observations 41,889 41,889 41,775 41,775 41,518 41,404 41,404
Mean of dependent variable 0.749 0.749 0.748 0.748 0.746 0.746 0.746 Notes: This table reports odds ratios from logistic regressions weighted by meshblock population, with standard errors clustered by area unit in parentheses. An underlying observation is a meshblock in 2017. Asterisks denote: *** p<0.01, **p<0.05, *p<0.1 (statistically different from 1).

Is internet on the right track? The digital divide, path dependence, and the rollout of New Zealand’s ultra-fast broadband
28
Appendix Table 2: Māori access to current fibre
Dependent variable: Current
fibre Current
fibre Current
fibre Current
fibre Current
fibre Current
fibre Current
fibre
Maori proportion 0.857*** 0.964 0.905** 1.031 0.841*** 0.732*** 0.789***
(0.024) (0.039) (0.041) (0.048) (0.039) (0.037) (0.043)
Maori prop. * second. urban 1.090 1.099 0.871 1.687*** 1.722*** 1.408
(0.125) (0.125) (0.123) (0.267) (0.276) (0.294)
Maori prop. * minor urban 0.592*** 0.593*** 0.547*** 1.195 1.282 0.934
(0.093) (0.094) (0.090) (0.344) (0.376) (0.324)
Maori prop. * rural centre 3.657*** 3.805*** 3.715*** 4.188*** 4.624*** 4.819***
(0.636) (0.676) (0.904) (0.735) (0.847) (1.190)
Maori prop. * rural 0.669 0.689 0.640 0.766 0.828 0.821
(0.197) (0.199) (0.196) (0.226) (0.235) (0.251)
secondary urban 1.704** 1.688** 0.011***
(0.448) (0.441) (0.011)
minor urban 0.109*** 0.109*** 0.075
(0.046) (0.046) (0.178)
rural centre 0.000*** 0.000*** 0.000***
(0.000) (0.000) (0.000)
rural 0.001*** 0.001*** 0.096***
(0.001) (0.001) (0.061)
deprivation score 1.138** 0.907* 1.269*** 0.953
(0.060) (0.046) (0.067) (0.050)
has school (in area unit) 0.860 1.089
(0.126) (0.168)
log density 1.795*** 2.529***
(0.067) (0.113)
log density * secondary urban 2.389*** 2.266***
(0.408) (0.312)
log density * minor urban 1.148 1.634*
(0.362) (0.462)
log density * rural centre 0.991 0.704
(0.214) (0.155)
log density * rural 0.598*** 0.426***
(0.068) (0.050)
Fixed effects None None None None Urban area
Urban area
Urban area
Observations 41,889 41,889 41,775 41,775 38,661 38,555 38,555
Mean of dependent variable 0.496 0.496 0.496 0.496 0.538 0.537 0.537 Notes: This table reports odds ratios from logistic regressions weighted by meshblock population, with standard errors clustered by area unit in parentheses. An underlying observation is a meshblock in 2017. Asterisks denote: *** p<0.01, **p<0.05, *p<0.1 (statistically different from 1).

Is internet on the right track? The digital divide, path dependence, and the rollout of New Zealand’s ultra-fast broadband
29
Appendix Table 3: Māori access to current or future fast internet
Dependent variable:
Current or future fast
internet
Current or future fast
internet
Current or future fast
internet
Current or future fast
internet
Current or future fast
internet
Current or future fast
internet
Current or future fast
internet
Maori proportion 0.935** 1.094* 0.730*** 0.959 1.412*** 0.878** 0.924
(0.028) (0.056) (0.037) (0.062) (0.092) (0.058) (0.062)
Maori prop. * second. urban 1.070 1.114 0.813 1.044 1.102 0.896
(0.147) (0.152) (0.138) (0.189) (0.209) (0.172)
Maori prop. * minor urban 0.960 0.979 0.851* 0.773** 0.913 0.854
(0.067) (0.068) (0.070) (0.084) (0.100) (0.102)
Maori prop. * rural centre 0.907 0.989 0.848* 0.703*** 0.812** 0.873
(0.066) (0.075) (0.078) (0.059) (0.070) (0.083)
Maori prop. * rural 0.841** 0.912 0.844** 0.652*** 0.747*** 0.868*
(0.061) (0.064) (0.070) (0.055) (0.061) (0.074)
secondary urban 0.393*** 0.353*** 0.429
(0.118) (0.105) (0.344)
minor urban 0.439*** 0.383*** 1.522
(0.086) (0.076) (1.070)
rural centre 0.087*** 0.074*** 0.191
(0.020) (0.018) (0.221)
rural 0.005*** 0.005*** 7.631***
(0.001) (0.001) (3.756)
deprivation score 2.615*** 1.311*** 2.721*** 1.338***
(0.151) (0.090) (0.169) (0.091)
has school (in area unit) 1.172 1.207
(0.170) (0.173)
log density 5.895*** 6.467***
(0.372) (0.426)
log density * secondary urban 1.236 1.418*
(0.195) (0.277)
log density * minor urban 0.979 1.548***
(0.120) (0.248)
log density * rural centre 1.364 1.246
(0.295) (0.271)
log density * rural 0.615*** 0.561***
(0.057) (0.053)
Fixed effects None None None None Urban area
Urban area
Urban area
Observations 41,889 41,889 41,775 41,775 41,415 41,301 41,301
Mean of dependent variable 0.773 0.773 0.773 0.773 0.771 0.770 0.770 Notes: This table reports odds ratios from logistic regressions weighted by meshblock population, with standard errors clustered by area unit in parentheses. An underlying observation is a meshblock in 2017. Asterisks denote: *** p<0.01, **p<0.05, *p<0.1 (statistically different from 1).

Is internet on the right track? The digital divide, path dependence, and the rollout of New Zealand’s ultra-fast broadband
30
Appendix Table 4: Deprived areas’ access to current or future fibre
Dependent variable:
Current or future fibre
Current or future fibre
Current or future fibre
Current or future fibre
Current or future fibre
Current or future fibre
Current or future fibre
deprivation score 1.736*** 2.307*** 2.968*** 1.440*** 2.558*** 3.085*** 1.355***
(0.091) (0.188) (0.249) (0.157) (0.222) (0.284) (0.146) deprivation score * secondary urban 1.075 1.151 0.774 1.358 1.370 0.957
(0.225) (0.232) (0.202) (0.334) (0.334) (0.239) deprivation score * minor urban 0.561*** 0.687*** 0.706** 0.676** 0.675** 0.704**
(0.068) (0.085) (0.111) (0.104) (0.104) (0.122) deprivation score * rural centre 0.501*** 0.688** 0.857 0.452*** 0.573*** 0.994
(0.082) (0.114) (0.218) (0.075) (0.096) (0.251)
deprivation score * rural 0.527*** 0.660** 0.891 0.475*** 0.569*** 1.009
(0.104) (0.140) (0.165) (0.095) (0.120) (0.186)
secondary urban 0.453*** 0.496*** 0.115**
(0.085) (0.092) (0.107)
minor urban 0.353*** 0.405*** 1.047
(0.046) (0.053) (0.759)
rural centre 0.048*** 0.060*** 1.148
(0.008) (0.010) (1.958)
rural 0.002*** 0.003*** 0.524
(0.000) (0.001) (0.348)
Maori proportion 0.036*** 0.205*** 0.083*** 0.119***
(0.013) (0.090) (0.033) (0.059)
has school (in area unit) 1.200 1.308*
(0.170) (0.185)
log density 5.674*** 6.832***
(0.353) (0.425)
log density * secondary urban 1.487** 1.717***
(0.232) (0.354)
log density * minor urban 1.076 1.669***
(0.132) (0.268)
log density * rural centre 0.884 0.743
(0.284) (0.238)
log density * rural 0.908 0.756**
(0.110) (0.092)
Fixed effects None None None None Urban area
Urban area
Urban area
Observations 41,889 41,889 41,775 41,775 41,518 41,404 41,404
Mean of dependent variable 0.749 0.749 0.748 0.748 0.746 0.746 0.746 Notes: This table reports odds ratios from logistic regressions weighted by meshblock population, with standard errors clustered by area unit in parentheses. An underlying observation is a meshblock in 2017. Asterisks denote: *** p<0.01, **p<0.05, *p<0.1 (statistically different from 1).
Is internet on the right track? The digital divide, path dependence, and the rollout of New Zealand’s ultra-fast broadband
31
Appendix Table 5: Deprived areas’ access to current fibre
Dependent variable:
Current fibre
Current fibre
Current fibre
Current fibre
Current fibre
Current fibre
Current fibre
deprivation score 1.080** 1.066 1.142** 0.926 1.055 1.230*** 0.942
(0.041) (0.051) (0.062) (0.049) (0.051) (0.065) (0.050) deprivation score * secondary urban 1.841*** 1.892*** 1.320 2.477*** 2.694*** 1.731**
(0.398) (0.404) (0.308) (0.615) (0.668) (0.432) deprivation score * minor urban 0.217*** 0.225*** 0.221*** 0.930 0.946 0.543
(0.099) (0.105) (0.103) (0.432) (0.424) (0.213) deprivation score * rural centre 4.533*** 4.753*** 7.742*** 4.579*** 5.459*** 9.223***
(0.943) (0.967) (2.469) (0.952) (1.093) (3.002)
deprivation score * rural 0.384*** 0.410*** 0.452*** 0.388*** 0.454*** 0.575**
(0.099) (0.109) (0.117) (0.100) (0.125) (0.156)
secondary urban 1.991*** 2.062*** 0.016***
(0.442) (0.455) (0.016)
minor urban 0.038*** 0.039*** 0.014*
(0.017) (0.018) (0.035)
rural centre 0.000*** 0.000*** 0.000***
(0.000) (0.000) (0.000)
rural 0.000*** 0.000*** 0.035***
(0.000) (0.000) (0.019)
Maori proportion 0.337** 1.094 0.057*** 0.104***
(0.144) (0.482) (0.028) (0.055)
has school (in area unit) 0.861 1.088
(0.125) (0.168)
log density 1.785*** 2.535***
(0.067) (0.113)
log density * secondary urban 2.169*** 2.133***
(0.368) (0.299)
log density * minor urban 1.234 1.736**
(0.388) (0.464)
log density * rural centre 1.462 1.003
(0.543) (0.402)
log density * rural 0.589*** 0.417***
(0.072) (0.051)
Fixed effects None None None None Urban area
Urban area
Urban area
Observations 43,686 43,686 41,775 41,775 40,293 38,555 38,555
Mean of dependent variable 0.488 0.488 0.496 0.496 0.529 0.537 0.537 Notes: This table reports odds ratios from logistic regressions weighted by meshblock population, with standard errors clustered by area unit in parentheses. An underlying observation is a meshblock in 2017. Asterisks denote: *** p<0.01, **p<0.05, *p<0.1 (statistically different from 1).

Is internet on the right track? The digital divide, path dependence, and the rollout of New Zealand’s ultra-fast broadband
32
Appendix Table 6: Deprived areas’ access to current or future fast internet
Dependent variable: Current or future fast
Current or future fast
Current or future fast
Current or future fast
Current or future fast
Current or future fast
Current or future fast
deprivation score 1.756*** 2.742*** 3.388*** 1.604*** 3.217*** 3.741*** 1.586***
(0.097) (0.228) (0.272) (0.169) (0.285) (0.325) (0.158) deprivation score * secondary urban 0.954 1.011 0.714 1.135 1.132 0.737
(0.225) (0.231) (0.236) (0.316) (0.314) (0.218) deprivation score * minor urban 0.502*** 0.598*** 0.655*** 0.599*** 0.595*** 0.669**
(0.064) (0.078) (0.107) (0.103) (0.102) (0.132) deprivation score * rural centre 0.432*** 0.579*** 0.712* 0.368*** 0.445*** 0.744
(0.067) (0.095) (0.136) (0.058) (0.074) (0.142)
deprivation score * rural 0.354*** 0.427*** 0.656*** 0.301*** 0.344*** 0.680***
(0.058) (0.075) (0.099) (0.050) (0.061) (0.100)
secondary urban 0.364*** 0.394*** 0.248
(0.075) (0.081) (0.238)
minor urban 0.277*** 0.312*** 0.852
(0.038) (0.044) (0.598)
rural centre 0.050*** 0.062*** 0.123*
(0.009) (0.011) (0.145)
rural 0.003*** 0.003*** 4.367***
(0.000) (0.001) (2.139)
Maori proportion 0.056*** 0.271*** 0.141*** 0.223***
(0.020) (0.099) (0.052) (0.091)
has school (in area unit) 1.173 1.205
(0.169) (0.172)
log density 5.806*** 6.398***
(0.368) (0.423)
log density * secondary urban 1.256 1.464*
(0.212) (0.311)
log density * minor urban 1.019 1.592***
(0.125) (0.248)
log density * rural centre 1.374 1.251
(0.308) (0.282)
log density * rural 0.628*** 0.571***
(0.058) (0.054)
Fixed effects None None None None Urban area
Urban area
Urban area
Observations 43,686 43,686 41,775 41,775 43,334 41,301 41,301
Mean of dependent variable 0.762 0.762 0.773 0.773 0.760 0.770 0.770 Notes: This table reports odds ratios from logistic regressions weighted by meshblock population, with standard errors clustered by area unit in parentheses. An underlying observation is a meshblock in 2017. Asterisks denote: *** p<0.01, **p<0.05, *p<0.1 (statistically different from 1).
Is internet on the right track? The digital divide, path dependence, and the rollout of New Zealand’s ultra-fast broadband
33
Appendix figures
Appendix Figure 1: Urban areas mapped by 1880 railway access
Notes: Unsuitable terrain or remoteness are the most common reasons for having no rail due to miscellaneous reasons.

Is internet on the right track? The digital divide, path dependence, and the rollout of New Zealand’s ultra-fast broadband
34
Recent Motu Working Papers
All papers in the Motu Working Paper Series are available on our website www.motu.nz, or by contacting us on [email protected] or +64 4 939 4250.
17-15 Sin, Isabelle, Steven Stillman and Richard Fabling. 2017. “What drives the gender wage gap? Examining the roles of sorting, productivity differences, and discrimination.”
17-14 MacCulloch, Robert. 2017. “Political systems, social welfare policies, income security and unemployment.”
17-13 Fleming, David A., Arthur Grimes, Laurent Lebreton, David C Maré and Peter Nunns. 2017. “Valuing sunshine.”
17-12 Hyslop, Dean and Wilbur Townsend. 2017. “The longer term impacts of job displacement on labour market outcomes.”
17-11 Carver, Thomas, Patrick Dawson and Suzi Kerr. 2017. “Including forestry in an Emissions Trading Scheme: Lessons from New Zealand.”
17-10 Daigneault, Adam, Sandy Elliott, Suzie Greenhalgh, Suzi Kerr, Edmund Lou, Leah Murphy, Levente Timar and Sanjay Wadhwa. 2017. “Modelling the potential impact of New Zealand’s freshwater reforms on land-based Greenhouse Gas emissions”
17-09 Coleman, Andrew. 2017. “Housing, the ‘Great Income Tax Experiment’, and the intergenerational consequences of the lease”
17-08 Preston, Kate and Arthur Grimes. 2017. “Migration and Gender: Who Gains and in Which Ways?”
17-07 Grimes, Arthur, Judd Ormsby and Kate Preston. 2017. “Wages, Wellbeing and Location: Slaving Away in Sydney or Cruising on the Gold Coast.”
17-06 Leining, Catherine, Judd Ormsby and Suzi Kerr. 2017. “Evolution of the New Zealand Emissions Trading Scheme: Linking.”
17-05 Leining, Catherine, Corey Allan and Suzi Kerr. 2017. “Evolution of the NZ ETS: Sectoral Coverage and Points of Obligation.”
17-04 Maré, David C., Trinh Le, Richard Fabling and Nathan Chappell. 2017. “Productivity and the Allocation of Skills.”
17-03 Grimes, Arthur and Wilbur Townsend. 2017. “The Effect of Fibre Broadband on Student Learning.”
17-02 Alimi, Omoniyi, David C Maré and Jacques Poot. 2017. “More pensioners, less income inequality?”
17-01 Carver, Thomas and Suzi Kerr. 2017. “Facilitating Carbon Offsets from Native Forests.”
16-22 Fabling, Richard, and Arthur Grimes. 2016. “Picking Up Speed: Does Ultrafast Broadband Increase Firm Productivity?”
16-21 Maré, David C. 2016. “Urban Productivity Estimation with Heterogeneous Prices and Labour.”
16-20 Allan, Corey, and Suzi Kerr. 2016. “Who’s Going Green? Decomposing the Change in Household Consumption Emissions 2006–2012.”
16-19 Hyslop, Dean, and Wilbur Townsend. 2016. “Employment Misclassification in Survey and Administrative Reports.”
16-18 Hyslop, Dean, and Wilbur Townsend. 2016. “Earnings Dynamics and Measurement Error in Matched Survey and Administrative Data.”
16-17 Hollis, Michele, Cecile de Klein, Dave Frame, Mike Harvey, Martin Manning, Andy Reisinger, Suzi Kerr, and Anna Robinson. 2016. “Cows, Sheep and Science: A Scientific Perspective on Biological Emissions from Agriculture.”
16-16 Kerr, Suzi. 2016. “Agricultural Emissions Mitigation in New Zealand: Answers to Questions from the Parliamentary Commissioner for the Environment.”

35