IS EXPORT LED-GROWTH HYPOTHESIS VALID IN PAKISTAN · PDF file234 IS EXPORT LED-GROWTH...
27
EUROPEAN UNION FUTURE PERSPECTIVES: INNOVATION, ENTREPRENEURSHIP AND ECONOMIC POLICY Copyright © 2016 Juraj Dobrila University of Pula IS EXPORT LED-GROWTH HYPOTHESIS VALID IN PAKISTAN? IF SO, HOW RELEVANT IS EXPORT TO EUROPE? Najid Ahmad a a School of Economics, Dongbei University of Finance and Economics, Dalian, P.R. China, [email protected] Katarina Kostelić b b Teacher of economics, School for tourism, hospitality and trade Pula, and project research expert at University Juraj Dobrila of Pula, [email protected] Arslan Ahmad c c Department of Economics, PU Lahore, Pakistan [email protected] ARTICLE INFO Article category: Review JEL classification: O47, R11, R15, Keywords: - Export-Led Growth, - ARDL, - Pakistan, - Europe ABSTRACT This paper investigates the validity of export-led growth hypothesis in Pakistan and its relevancy to Europe with latest technique. We use annual time series data for the period of 1977-2012. GDP per capita is treated as dependent variable and export as independent variable along with other explanatory variables i.e. FDI, exchange rate, infant mortality rate and inflation. Different unit roots tests confirm that none of variable is stationary at second difference. So, we apply ARDL model as it is an appropriate in this situation. Results show that one percent increase in export will raise GDP by 1.11% in the long run and a 1% increase in export will raise GDP around 1.34% in the short run. The other explanatory variables have expected sign. The coefficient of ECT (- 1.2051) is negative and highly significant that confirms the quick convergence of the model from short run to long run. Different diagnostic tests confirm the perfectness of our model. After the confirmation of export-led growth hypothesis, we use correlation method to show how it is showing relevancy to Europe. Policy Suggestions are given for EU-Pakistan trade.
Transcript of IS EXPORT LED-GROWTH HYPOTHESIS VALID IN PAKISTAN · PDF file234 IS EXPORT LED-GROWTH...

EUROPEAN UNION FUTURE PERSPECTIVES:
INNOVATION, ENTREPRENEURSHIP AND ECONOMIC POLICY
Copyright © 2016 Juraj Dobrila University of Pula
IS EXPORT LED-GROWTH HYPOTHESIS VALID IN
PAKISTAN? IF SO, HOW RELEVANT IS EXPORT TO
EUROPE?
Najid Ahmad a
a School of Economics, Dongbei University of Finance and Economics, Dalian, P.R. China,
Katarina Kostelić b
b Teacher of economics, School for tourism, hospitality and trade Pula, and project research expert at University
Juraj Dobrila of Pula, [email protected]
Arslan Ahmad c
c Department of Economics, PU Lahore, Pakistan [email protected]
ARTICLE INFO
Article category: Review
JEL classification: O47, R11, R15,
Keywords: - Export-Led Growth,
- ARDL,
- Pakistan, - Europe
ABSTRACT
This paper investigates the validity of export-led growth
hypothesis in Pakistan and its relevancy to Europe with
latest technique. We use annual time series data for the
period of 1977-2012. GDP per capita is treated as
dependent variable and export as independent variable
along with other explanatory variables i.e. FDI, exchange
rate, infant mortality rate and inflation. Different unit
roots tests confirm that none of variable is stationary at
second difference. So, we apply ARDL model as it is an
appropriate in this situation. Results show that one
percent increase in export will raise GDP by 1.11% in the
long run and a 1% increase in export will raise GDP
around 1.34% in the short run. The other explanatory
variables have expected sign. The coefficient of ECT (-
1.2051) is negative and highly significant that confirms
the quick convergence of the model from short run to long
run. Different diagnostic tests confirm the perfectness of
our model. After the confirmation of export-led growth
hypothesis, we use correlation method to show how it is
showing relevancy to Europe. Policy Suggestions are
given for EU-Pakistan trade.

Najid Ahmad, Katarina Kostelić, Arslan Ahmad
234 IS EXPORT LED-GROWTH HYPOTHESIS VALID IN PAKISTAN? IF SO, HOW RELEVANT IS EXPORT TO EUROPE?
1. INTRODUCTION
Major concern for developed and developing countries is to avail and maintain high
economic growth and development. To achieve this, different countries are using different
strategies. Among them, one can be to promote export. If we look at literatures, it remains
debated issue whether export is necessary for economic growth or economic growth is
necessary to promote export and then this promoted export can encourage economic growth.
Neo-classical economists’ has viewed that export make positive and significant contribution
to the growth and development. However, different economists have different views and
their findings differ from each other. Some studies show mix and inclusive results (Xu et al.,
2009). Many researchers are agree that there is a long run relationship between export and
economic growth (see for example: Faye Ensermu, 2001; Per- Ola, 2008; Jorge M.Andraz,
2010; Ananda Jayawickrama, 2010; Kimberly, 2011; Yilmaz Akyuz, 2011; Udah, 2012;
Arif Billah Dar , 2013; Biru Paksha, 2014). In this long run connection, there can be three
possibilities like export-led growth, growth led export or bi-directional relation. If we look
back at history, it can be seen that Germany is the first country to adopt export led growth
idea in 1950s and Japan is the second (1960s) country. Till 1970s, the import substitution
policy prevailed in most of the developing countries. Export led growth idea rose three
decades after the World War II to replace the import-oriented strategy. World Bank and IMF
are playing important role in the promotion and implementation of it since 1970s. In 1970s
and 1980s, Asian Tigers (Taiwan, Singapore, South Korea and Hong Kong) adopted export
led growth strategy. In 1980s and 1990s, it was followed by Malaysia, Thailand and
Indonesia. In 2000s, China exemplified it. Now, exports of goods and services is considered
as an important source not only for foreign exchange but also for job opportunities. Many
economists support export led growth idea for different countries with different techniques,
sample and variables (See, for example Tyler, 1981; Darrat, 1987; Panas and Vamvoukas,
2002; Ari Kokko, 2002; Abual-Foul; 2004) as the demand led growth strategy cannot replace
the export led growth hypothesis (Lai, 2004) although it remains popular in some extent (see
for example, Palley, 2011).
If we talk about Pakistan, it is not an exceptional case, the recent growth and
development in Pakistan raises several questions such as (1) is there any relationship between
export and economic growth in Pakistan? (2) If there is associaitonship, whether it is short
run or long run. (3) Is growth led exports valid in Pakistan? (4) Is export led growth
hypothesis valid in Pakistan (5) If really export led growth hypothesis is true for Pakistan,
then how it is important to export to Europe? This paper answers these questions by using the
advance and latest technique that has several advantages. Moreover, there are limited studies
available to offer export led growth or growth led export idea in Pakistan. For example,
Shujatt Abbas (2012) states that causality runs from economic growth to exports. He
concludes that economic growth is necessary for export’s promotion in short and long run in
Pakistan. Further, Afzal and Hussain (2010) examines the relationship between export and
economic growth in Pakistan by using monthly data from 1990 to 2008. The authors fails to

EUROPEAN UNION FUTURE PERSPECTIVES:
INNOVATION, ENTREPRENEURSHIP AND ECONOMIC POLICY
IS EXPORT LED-GROWTH HYPOTHESIS VALID IN PAKISTAN? IF SO, HOW RELEVANT IS
EXPORT TO EUROPE? 235
find any granger causality between exports and economic growth. So, he concludes that
exports led growth hypothesis is invalid in case of Pakistan. Further, they added that export
led growth hypothesis depends on number of other factors that are not in the favor of
Pakistan. So, these factors force exports to be low and it cannot contribute to economic
growth of Pakistan. Pakistan should not reply on exports as its exported products have to face
cut throat competition in international market. Other studies from Pakistan state that there is
no causality that runs from export to economic growth of Pakistan (See for example, Dodaro,
1993: Ahmad et al., 2000; Afzal, 2004; Afzal and Ali, 2008; Afzal and Hussain, 2010).
Growth-led export hypothesis has already been rejected by most of the economists of the
world. We have a lesson from Asian tigers about the importance of export for the
development of the country (World Bank, 1993). Asian tigers’ tremendous progress force
policy makers to promote export for economic growth. Therefore, these days, focus is on
export-led growth hypothesis. Ari Kakko (2012) rightly said that export is not only a single
factor that can boom the economic growth but foreign direct investment and Government
role is also important for growth and development of the country. So, knowing the important
of other factors that can influence the economic growth, we use FDI, inflation, exchange rate
and infant mortality rate to see how these variables are contributing to the economic growth
and development of Pakistan. After the confirmation of the export led growth hypothesis
validity in Pakistan, we move further to check how this export is relevant to Europe.
The novelty of the paper and our contribution in the existence literature can be judged in
several way: for example, first we test export led growth hypothesis validity of Pakistan by
using advance and latest technique that is quite popular among researchers because of its
several advantages on other techniques. It is known as ARDL bound testing approach. In
previous work, most of the researchers were use granger causality test as is reported by Giles
and Williams (2000) who reviewed 150 papers (during 1963-1999) papers for export led
growth hypothesis and find that most of the researchers are using Johansen Cointegration and
in case of Pakistan most of the researchers were using Johansen Cointegration (see for
example: Shujatt Abbas 2012; Afzal and Hussain, 2010; Dodaro, 1993: Ahmad et al., 2000;
Afzal, 2004; Afzal and Ali, 2008). If we look back at different techniques, we know Ordinary
least squares method is applicable only if all variables under investigation are stationary at
level meaning that they are not showing trend with the time. Usually time series data show
trend with the time. So, if variables are moving to first difference and become stationary at
first difference, then we have two choices, one is Eangle and Granger (1987) and second is
Johansen (1988). Eangle and Granger technique is used for two variables’ relation. Johansen
Cointegration (1988) is used for more than two variables. In this way, Johansen
Cointegration has advantage on Eangle and Granger (1987). But it can be applied only for
large sample size and second if all variables are integrated of same order i.e. I(1). It is seen in
most of the time, some variables are stationary at level and some are stationary at first
difference. Second, if we have small sample size. Then we cannot use the above techniques.
So, ARDL bound testing introduction make many things convenient and easy. It covers all
problems that was in previous techniques. For example, It can used weather all variables are
stationary at level, first difference or mixture of both. It can capture the maximum number of
lags in the Data Generating Process (DGP). It can be used in case of small sample size. It

Najid Ahmad, Katarina Kostelić, Arslan Ahmad
236 IS EXPORT LED-GROWTH HYPOTHESIS VALID IN PAKISTAN? IF SO, HOW RELEVANT IS EXPORT TO EUROPE?
removes endogneity problem by making the model dynamic. It gives short run and long run
estimations separately. The error correction term shows if disturbance in the short run will
occur, how much time it will take to reach to its long run equilibrium (M. H. Pesaran and B.
Pesaran, 1997; M. H. Pesaran and Y. Shin, 1999; M. H. Pesaran, Y. Shin, and R. J. Smith,
2001). These features make this technique quite popular among researchers and it is widely
used.
The other advantage of our paper is that using the appropriate model, variables and
proper methodology can reverse the sign of the variables as is stated by Farla et al. (2014)
that proper method and variables can reverse the sign. So, we were interested to see whether
it is true that growth led export hypothesis is true for Pakistan as is suggested by Shujatt
Abbas (2012) that causality runs from economic growth to exports and growth led export is
valid in Pakistan. Further, Afzal and Hussain (2010) examines the relationship between
export and economic growth in Pakistan. The authors fails to find any granger causality
between exports and economic growth. So, he concludes that exports led growth hypothesis
is invalid in case of Pakistan. Further, they add that export led growth hypothesis also depend
on number of other factors that are not in the favor of Pakistan. Most studies from Pakistan
state that there is no causality between export and economic growth of Pakistan (See for
example, Shujatt Abbas, 2012; Dodaro, 1993: Ahmad et al., 2000; Afzal, 2004; Afzal and
Ali, 2008). But at second side, most of the researchers, World Bank and IMF are promoting
export led growth for developing countries (see for example Tyler, 1981; World Bank, 1987;
Panas and Vamvoukas, 2002; Ari Kokko, 2002; Abual-Foul, 2004). So, owing this reason,
we included FDI, inflation, exchange rate and infant mortality rate in order to capture the
influence of other factors for the economic growth of Pakistan.
We did not finish our task by just confirming the export led growth hypothesis validity
with latest and appropriate techniques and variables. We did analysis and extend our work to
make it more novel by adding analysis and explaining if export led growth hypothesis is
valid and reject the previous idea that growth led export is true in Pakistan, then how this
export is showing relevance to Europe. The reason behind the checking of this relevancy is
that if there is a positive connection, then Pakistan can promote its export to EU rather than
focusing on some countries as Pakistan’s exported products are absorbed in USA, UK,
Germany, Hong Kong and Saudi Arabia. So, if there is connection of export to EU then it
should be encouraged to get benefits from EU as the country’s relation can be developed
with EU countries and more trade can be beneficial for both parties.
All the above things make our work novel and interesting. To our knowledge, there is
no study on Pakistan’s economy that creates linkage between export and economic growth,
along with relevant explanatory variables and with the latest techniques. This study does not
only prove export led growth hypothesis but also show its relevance to Europe. Simply, if
Pakistan export to EU, then how it can be beneficial for the domestic economy. So, the aim
of this paper is not limited to test the validity of export-led growth hypothesis in Pakistan but
to check if there is a significant export to Europe in order to formulate future policies. The
rest of the paper is structured as follows: in section 2, brief literature review is given; in
section 3, data collection and methods, empirical results regarding export led growth

EUROPEAN UNION FUTURE PERSPECTIVES:
INNOVATION, ENTREPRENEURSHIP AND ECONOMIC POLICY
IS EXPORT LED-GROWTH HYPOTHESIS VALID IN PAKISTAN? IF SO, HOW RELEVANT IS
EXPORT TO EUROPE? 237
hypothesis in Pakistan are presented. Section 4 shows the export relevancy to Europe and
section 5 offers conclusion and policy implication.
2. BRIEF LITERATURE REVIEW FROM PREVIOUS WORK
In this section, we discuss briefly the importance of export for the economic growth
from the previous work from different countries with different techniques like Titus (2010)
points out that the nature of relation between export and economic growth has remained
debatable in last few decades. He uses Granger Causality test and Vector Error Correction
model to find the relationship with export and economic growth for Canadian’s economy. He
finds positive association between export and economic growth in the long run. Arif Billah
Dar (2013) adds that export and growth relation is not only positive but it grows stronger
with the passage of time as is the case of China whose growth is export dependent. If we look
at the work of Yilmaz Akyuz (2011) who check the contribution of export in the progress of
China. He thinks it difficult for China to maintain high economic growth by just depending
on export. Therefore, he views that consumption should be increased for the economic
growth and public spending should be encouraged. Winters et.al (2004) states that
international trade is important for poverty reduction and economic growth as it provides job
opportunities for local people.
Konya (2004) states that scholars and researchers are showing great interest to
investigate the relation between exports and economic growth. But till now different
economists have different views. Some economists believe that growth is necessary for the
promotion of exports and some views that export will lead to economic growth. Renuka
(2007) viewed that the relationship between exports and economic growth is debatable for
policy makers. Export allows us to specialize in the specific field and this specialization
increases economic growth. However, economic growth also granger cause export. We can
see the example of Botswana that is highlighted in Andre’s (2007) study. He finds bi-
directional causal relation between exports and economic growth. Economic growth is
encouraging exports and on the other hand, export is increasing economic growth. Ahmad et
al., (2000) finds no significance contribution of export to economic growth when he uses the
data set for 8 Asian countries in which Pakistan was included. Afzal and Ali (2008) viewed
that export led growth hypothesis is not valid in Pakistan.
Giles and Williams efforts cannot be ignored while talking about export led growth
hypothesis as they reviewed 150 papers that has been published between 1963-1999. They
viewed that most of the researchers used granger causality tests to find export led growth
hypothesis (Giles and Williams, 2000). Here is the Per Ola (2008) study who explores the
relation between exports and economic growth for three countries i.e. Argentina, Brazil and
Mexico by using Johansen Cointegration and Granger causality tests. Results indicate the
existence of co-integration between pre and post break periods for Mexico and Argentina. He
considers GDP as a leading variable that encourage export for Mexico. He concludes that
export led growth hypothesis strategy should be adopted for high economic growth.

Najid Ahmad, Katarina Kostelić, Arslan Ahmad
238 IS EXPORT LED-GROWTH HYPOTHESIS VALID IN PAKISTAN? IF SO, HOW RELEVANT IS EXPORT TO EUROPE?
Policy makers and higher authorities focus is always on poverty reduction. It is stated
that export is an important factor that can be responsible for poverty reduction and economic
growth (Adetunji Babatunde, 2012). Liang Hun Shan (2015) views that export is the only
factor that is responsible for economic growth. The author uses Johansen Cointegration and
Granger Causality test to check the short and long run relation between exports and
economic growth for Malaysia. He finds strong positive relationship between exports and
economic growth in both periods. So, he proved, exports led growth hypothesis is valid for
Malaysia. Yousaf (1999) also finds relation between exports and economic growth for
Malaysia economy. He views that export-led growth hypothesis is true in short run while in
the long run, there are other factors that can be influence the economic growth.
Faye Ensermu (2001) uses Cobb-Douglas production function to test export-led growth
hypothesis for Ethiopia for the period of 1950 to 1986. Results show that export is
contributing to economic growth in short and long run. Jorge M. Andraz (2010) explores the
relation between exports and economic growth for Portugal. He concludes that export is
necessary for the growth as there is long run relationship between exports and economic
growth. In, 2007, Khan (2007) confirms the existence of export led growth hypothesis in case
of Bangladesh. Biru Paksha (2014) shows the importance of trade for Bangladesh’s economy
as its growth is trade dependent. With the help of bound testing approach, he finds strong
evidence about the export-led growth hypothesis for Bangladesh.
Udah (2012) states that export led growth hypothesis has gained much attention for
growth policies. Basically, this idea is based on export expansion that will lead to economic
growth. One can get lesson from the success of Asian tigers whose success is based on export
led growth hypothesis. They achieved high growth by adopting free market oriented policies.
Nigeria and other economies has also adopted export led growth hypothesis as they think it
as a key factor for growth and development. Andras Inotai (2013) discusses about Bulgaria’s
economy. He states that global environment is changing and this new environment is
focusing on export-oriented approaches. However, we should remember that theory of export
led growth hypothesis is based on comparative and absolute advantage. He points out that
global growth is the reflection of trade. In the case of Zimbabwe, Chigusiwa (2011)
examines the validity of export led growth hypothesis for Zimbabwe. The author uses ARDL
approach to find short and long run relation between exports and growth. The results show
the existence of export-led growth hypothesis. Here is Pakistani other study from Afzal
(2004) who finds insignificant relation between export and economic growth in case of
Pakistan. Dodaro (1993) finds no causality between export and growth in case of Pakistan.
Tuck Cheong (2013) examines the influence of export on growth and development. He
uses data for the period of 1972 to 2008 for Cambodia’s economy. GDP is used as a growth
indicator for the economy and other variables such as imports and exports as independent
variable. Granger causality test confirms bi-directional causality between growth and
exports. Growth led exports and exports led growth hypothesis are true in case of Cambodia.
It means that growth can be achieved by both methods. Kimberly (2011) discusses growth
policies for Mexico. He finds positive relation in short run while negative relation in the long
EUROPEAN UNION FUTURE PERSPECTIVES:
INNOVATION, ENTREPRENEURSHIP AND ECONOMIC POLICY
IS EXPORT LED-GROWTH HYPOTHESIS VALID IN PAKISTAN? IF SO, HOW RELEVANT IS
EXPORT TO EUROPE? 239
run. He justified this inverse relation in the long run by saying that import contents and
domestic supplier have weak links with exporters. Mexico should change its strategy related
to tax-free imports and exports of raw material as raw material prices are too low in
international markets. Deepak finds uni-directional causality from economic growth to export
(Deepak, 2007).
3. DATA AND METHODOLOGY
The variables GDP per capita, export, foreign direct investment, inflation, infant
mortality rate and exchange rate are used in our study for the period of 1977-2012 in order to
investigate the validity of export-led growth hypothesis in Pakistan. The data set is collected
from World Development Indicators (WDI), Economic surveys of Pakistan and European
Commission reports (EC). Real GDP per capita is measured in local currency unit and it is
treated as dependent variable. Export that is measured in millions Rupees, FDI measured in
millions dollars, inflation (CPI) and exchange rate (RS/$) are independent variables in our
model. The explanatory variables are used in the model that have special influence on the
economic growth of Pakistan and are relevant to explain the theory.
The function form of our model is given as:
GDP=F(EXP, IMR, INF, FDI, EXC) (1.1)
(1.2)
Where LEG=Ln(GDP per capita), LEXP=Ln(Export), LIMR=Ln(Infant Mortality
Rate), LINF= Ln(Inflation Rate), LFDI=Ln(Foreign Direct Invest), LEXC=Ln(Exchange
Rate), Where β1, β2, β3, β4, β5 are the respective parameters. Β0 is constant term, t is the
time trend and Ɛ is the Stochastic Error term. The variables are converted into logarithmic
form as log form of the data provides efficient, better and consistent results (Cameron, 1994;
Layson, 1983; Ehrlich, 1996). The logarithmic form of the data does not only make data
smooth but also reduce heteroskedasticity problem (Amine Boutabba, 2014).
3.1. Descriptive statistics
Table 3.1 reports the descriptive Statistics for the sample of six variables under
investigation. The mean Median, Maximum, Minimum, Skenewness, Kurtosis and JB values
are reported. Our overall calculations indicate that export, FDI, exchange rate, inflation and
infant mortality rate are normally distributed and economic growth is not normally
distributed.

Najid Ahmad, Katarina Kostelić, Arslan Ahmad
240 IS EXPORT LED-GROWTH HYPOTHESIS VALID IN PAKISTAN? IF SO, HOW RELEVANT IS EXPORT TO EUROPE?
TABLE 3.1 – DESCRIPTIVE STATISTICS
LEG LEXP LFDI LEXC LINF LIMR
Mean 1.508112 12.35216 5.770458 3.413915 2.051581 4.437737
Median 1.589817 12.54797 5.842004 3.437208 2.145665 4.465842
Maximum 2.323926 14.7615 8.596042 4.53684 3.009937 4.751864
Minimum 0.014293 9.546169 2.370244 2.292535 1.069573 4.074142
Std. Dev. 0.509615 1.535081 1.588872 0.743499 0.471075 0.214071
Skewness -0.95975 -0.18111 -0.1093 -0.14715 -0.44757 -0.20095
Kurtosis 3.775113 1.861393 2.320926 1.643973 2.526152 1.726574
Jarque-Bera 6.427966 2.141449 0.763389 2.888127 1.538715 2.674715
Probability 0.040196 0.34276 0.682704 0.235967 0.463311 0.262539
Sum 54.29203 444.6778 207.7365 122.9009 73.85693 159.7585
Sum Sq. Dev. 9.089766 82.47655 88.35799 19.34767 7.766923 1.603919
Observations 36 36 36 36 36 36
Source: Authors’ estimation using Eviews 8.
3.2. Unit root testing
A researcher has to perform several statistical tests when he/she is dealing with time
series data as usually a time series data show trend with the time. Second, the nature of the
data points out about the type of test (s) that can be appropriate choice to employ. So,
stationary of the data should be checked before deciding about the technique (s). For this
purpose, we use different statistical tests to check and confirm the unit root property of the
variables under investigation. The tests that are used in our study are: Augmented Dickey
fuller test (Dickey and Fuller, 1979, 1981), Phillips–Perron (1988) test and
Kwiatkowski–Phillips–Schmidt–Shin (1992) test to check whether our data is stationary
at level or it is showing trend with the time. Usually KPSS is used to check confirm the
outcome of ADF and PP tests because KPSS has strong power (See, Kwiatkowski et al.
1992).
Three kinds of regression can be made to check the unit roots.
Having no trend and intercept
∑ (2.1)
Having intercept but no trend:

EUROPEAN UNION FUTURE PERSPECTIVES:
INNOVATION, ENTREPRENEURSHIP AND ECONOMIC POLICY
IS EXPORT LED-GROWTH HYPOTHESIS VALID IN PAKISTAN? IF SO, HOW RELEVANT IS
EXPORT TO EUROPE? 241
∑ (2.2)
Having both intercept and trend:
∑ (2.3)
Where ∆Yt=Yt - Yt-1, p = Number of lags in the dependent variable and є1t, є2t, є3t are
stochastic error terms.
The ADF test is based on the given hypothesis
H0: β = 0; (Yt is non-stationary) Null Hypothesis
H1: β < 0; (Yt is stationary) Alternative Hypothesis
The results of ADF test are reported in table 3.2 with trend and with intercept. Calculations
show that economic growth, export, inflation, foreign direct investment, infant mortality rate
are stationary at level where as exchange rate is non-stationary at level and become stationary
at first difference.
TABLE 3.2 – AUGMENTED DICKEY – FULLER TEST WITH TREND AND WITH
INTERCEPT
Variables Level / 1st
Difference
ADF test statistic Conclusion
Trend Drift
LEG Level -3.484** -2.282* I (0)
LEXP Level -2.536 -1.589** I (0)
LIMR Level -3.605* 0.656 I (0)
LINF Level -2.291 -2.309* I (0)
LEXC Level -2.117 -0.590 ---
∆ LEXC First Diff -3.865* -3.894* I (1)
LFDI Level -1.866 -1.448** I (0)
Note: * denote significance at 5% and ** denote significance at 10%.
Source: Authors’ estimation using Eviews 8
After checking the ADF test, we use Phillips–Perron (1988) and Kwiatkowski–Phillips–
Schmidt–Shin (1992) tests in order to check the stationary of the variables weather all
variables are stationary at level I(0) or I(1) or the mixture of both I(0) and I(1). It is also
possible that any variable will move to second difference. We can decide the technique (s)
after the confirmation of the unit root property that what method can be used in our study.
Because if our any variable will become stationary at second difference, we cannot use

Najid Ahmad, Katarina Kostelić, Arslan Ahmad
242 IS EXPORT LED-GROWTH HYPOTHESIS VALID IN PAKISTAN? IF SO, HOW RELEVANT IS EXPORT TO EUROPE?
ARDL bound testing approach until and even we use some treatments on our variable (taking
difference) to make it stationary at first difference. KPSS (1992) test is commonly used to
confirm the results of ADF and PP as KPSS has strong power to reject the null.
TABLE 3.3: PP test and KPSS test for stationary
Note: PP: Phillips–Perron test. KPSS: Kwiatkowski–Phillips–Schmidt–Shin. PP null is unit root like ADF test but
KPSS null is stationary. * indicate the rejection of null at 1% level of significance. ADF and PP critical values are
from MacKinnon (1991). KPSS critical values are from Kwiatkowski et al. (1992).
The results of ADF, PP and KPSS show that the variables GDP, FDI, inflation,
export, exchange rate and infant mortality rate are the mixture of integration i.e. I(0) and I(1)
in ADF and PP while in KPSS they are stationary at level and none of our variable is
stationary at second difference. So, we can use ARDL model.
4. Autoregressive Distributed Lag Model
Autoregressive Distributed Lag technique can be can be used if all variables are I(0)
or I(1) or mixture of both. Infact, this technique has several advantages on previous
techniques. Like, it can be used in any case of the variables stationary i.e. if all variables are
stationary at level, stationary at first difference or the mixture of both as is stated above. It
use optimal number of lags in Data Generating Process (DGP). Our study used ARDL bound
test approach (M. H. Pesaran and B. Pesaran, 1997; M. H. Pesaran and Y. Shin, 1999; M. H.
Pesaran, Y. Shin, and R. J. Smith, 2001). Second, this technique is more appropriate in small
sample size than other techniques. For example, Johansen Cointegration techniques required
large sample size to deal with long run Cointegration and short run VECM (Haug, 2002).
Variables PP test. KPSS test
Level
1st difference Level
Test Statistic Test statistic Test statistic
LEG -4.98* 0.11*
LEXP -2.44 -5.82* 0.19*
LIMR -2.24 -4.67* 0.20*
LINF -2.55 -6.13* 0.07*
LEXC -1.99
-4.27* 0.12*
LFDI -2.17 -5.76* 0.08*
Source: Authors’ Estimation using eviews 8

EUROPEAN UNION FUTURE PERSPECTIVES:
INNOVATION, ENTREPRENEURSHIP AND ECONOMIC POLICY
IS EXPORT LED-GROWTH HYPOTHESIS VALID IN PAKISTAN? IF SO, HOW RELEVANT IS
EXPORT TO EUROPE? 243
Otherwise, it invalidates the results (S. Johansen and K. Juselius, 1990; S. Ghatak and J.
Siddiki, 2001). Bound testing approach provides unbiased long run estimates and it validates
t-statistics even the regressors have endogenous problem. Hence, it deals with endogeneity
problem (P. K. Narayan, 2005; N. M. Odhiambo, 2008; Pesaran and Shin, 1999; Pesaran et
al., 2001). Further, it provides simultaneously long run and short run effects on one variable
to other variable (I. Bentzen and T. Engsted, 2001). However, it is better to check any
variable should not be I(2) as Ouattara (2004) states that in case of I(2) variable, the F-
statistics given by Pesaran et al. (2001) will be invalid.
Basically, Autoregressive Distributed Lag technique is based on two steps to see long run
associationship. (1) To check the existence of long run associationship among the variables.
(2) If there exists associatonship, one need to estimate long and short term model.
ARDL equation can be written as follows:
( ) ( ) ( ) ( ) ( )
( ) ( ) ∑ ( ) ∑ ( )
∑ ( ) ∑ ( )
∑ ( )
∑ ( ) ( )
In equation three, β1, β2, β3, β4, β5 and β6 are long run coefficients while others are short-
run coefficients.
The null and alternative hypotheses are as follows:
Null hypothesis can be written as:
( )
Alternative hypothesis:
( )
The error correction equation is used to find speed of adjustment towards equilibrium
from short run to long run. ECM equation is as follows:
( )
∑ ( ) ∑ ( )
∑ ( )
∑ ( ) ∑ ( )
∑ ( )
( )
( )
The equation 4 indicates the short run relationship among variables. However, ECM is
the first lag of error term. Moreover, the co-efficient (λ) represents speed of adjustment.

Najid Ahmad, Katarina Kostelić, Arslan Ahmad
244 IS EXPORT LED-GROWTH HYPOTHESIS VALID IN PAKISTAN? IF SO, HOW RELEVANT IS EXPORT TO EUROPE?
TABLE 3.4 – AUTOREGRESSIVE DISTRIBUTED LAG ESTIMATES
Dynamic ARDL(1,0,0,0,0,1) selected based on AIC with Dependent variable LEG
Variable Coefficient Std. Error T-Statistic Prob.
LEG(-1) -0.2051 0.1576 -1.3015 [0.204]
LEXP 1.3349 0.4563 2.9254 [0.007]
LIMR -4.5523 1.9974 -2.2791 [0.031]
LINF -0.4414 0.2080 -2.1219 [0.043]
LFDI 0.2248 0.1490 1.5082 [0.143]
LFDI(-1) -0.4034 0.1825 -2.2107 [0.036]
LEXC -3.9536 0.9708 -4.0727 [0.000]
C 20.9104 11.9012 1.7570 [0.090]
R-Squared 0.6065
DW-statistic 2.1521
AIC -17.7098
R-Bar-Squared 0.5045
F-Stat. F(7,27) 5.9459 [0.000]
SBC -23.9312
Source: Authors’ estimation using Microfit 5.0
TABLE 3.5 – F – TEST FOR THE EXISTENCE OF LONG RUN RELATIONSHIP
F-statistic Value Significance
Level
Bound Critical Values
I(0) I(1)
7.1044 5% 3.0301 4.4242
10% 2.5175 3.7320
Source: Authors’ estimation using Microfit 5.0
Dynamic analysis for selected ARDL (1,0,0,0,0,1) technique is based on AIC. It is
reported in table 3.4. Here F-statistic shows that overall model is significance. Coefficient of
determination (R2) is 0.6065 that means 61 % variations in the dependent variable are due to
independent variables and other 39 percent variations are due to error term. DW is 2.1521
that is good sign for our model. Based on this dynamic analysis, we find the F-statistic (table
3.5) that allow us to move further for long run and short run coefficient estimations along
with speed of adjustment (ECT) to show how disturbance in the short run mechanism will be
adjusted in long run.
F-statistic proposed by Pesaran et al. (2001) is reported in table 3.5 that confirm the
existence of long-run relationship among variables as F-statistic is higher than the upper

EUROPEAN UNION FUTURE PERSPECTIVES:
INNOVATION, ENTREPRENEURSHIP AND ECONOMIC POLICY
IS EXPORT LED-GROWTH HYPOTHESIS VALID IN PAKISTAN? IF SO, HOW RELEVANT IS
EXPORT TO EUROPE? 245
bound. Our null hypothesis states that coefficient on lagged levels are equal to zero and
alternative hypothesis states that they are not equal to zero meaning that there is long run
relationship among the variables. F. Statistic provides lower and upper bound critical value.
Lower bound value assumed that all variables are integrated of order zero I(0) and upper
bound critical values suggest that variables are integrated of order one I(1). If F-statistic is
greater than the upper bound, it means that there is a long run Cointegration and in this way,
null of no Cointegration can be rejected. However, if F-statistic is lower than the upper
bound and higher than the lower bound, then the results would be inconclusive. If F-statistic
is less than the lower bound, then there would be no long run cointegration. In our case, it is
found that calculated value of F-statistic=7.1044 is greater than the upper bound at 5 % level
of significance. Hence, long-run relationship exists among the variables. Our findings are
parallel to Faye Ensermu, 2001; Per- Ola, 2008; Jorge M.Andraz, 2010; Ananda
Jayawickrama, 2010; Kimberly, 2011; Yilmaz Akyuz, 2011; Udah, 2012; Arif Billah Dar ,
2013 and Biru Paksha, 2014 who viewed that there is long run relationship between export
and economic growth. We can proceed to check for long run coefficients and error correction
term (speed of adjustment) along with short run results.
TABLE 3.6– LONG RUN COEFFICIENTS USING ARDL APPROACH
Estimated Long Run Coefficients using ARDL(1,0,0,0,0,1) selected based on AIC
Dependent variable is LEG
Variable Coefficient Std. Error T-Statistic Prob.
LEXP 1.1078 0.3726 2.9733 [0.006]
LIMR -3.7776 1.6231 -2.3275 [0.028]
LINF -0.3663 0.1672 -2.1906 [0.037]
LFDI -0.1482 0.1382 -1.0724 [0.293]
LEXC -3.2808 0.7145 -4.5915 [0.000]
C 17.3521 9.6952 1.7898 [0.085]
Source: Authors’ estimation using Microfit 5.0
Table 3.6 reports the result of long-run coefficients. Export has positive and significant
relation with economic growth in the long run. Coefficient of export is 1.1078 meaning that
one percent increase in export will encourage economic growth around 1.11 percent in the
long run. Our results are opposite to Kimberly (2011) who states that export and growth have
negative relation in the long run. However, these results consistent to Ensermu (2001), Khan
(2007), Jorge M. Andraz (2010), Chigusiwa (2011), Udah (2012) and Biru Paksha (2014)
findings. Our results are opposite to Shujatt Abbas (2012) who states that growth-led export
Najid Ahmad, Katarina Kostelić, Arslan Ahmad
246 IS EXPORT LED-GROWTH HYPOTHESIS VALID IN PAKISTAN? IF SO, HOW RELEVANT IS EXPORT TO EUROPE?
hypothesis is valid in case of Pakistan. Afzal and Hussain (2010) examines the relationship
between export and economic growth in Pakistan with the monthly data from 1990 to 2008.
The authors fails to find any granger causality between exports and economic growth. So, he
concludes that exports led growth hypothesis is invalid in Pakistan. There are other studies
available that state that export led growth hypothesis is invalid in Pakistan (Dodaro, 1993:
Ahmad et al., 2000; Afzal, 2004; Afzal and Ali, 2008). Further, our results shows that
foreign direct investment has negative and insignificant relationship with economic growth in
thelong run. It shows that FDI is not contributing to the economic growth of Pakistan. So,
Pakistan should give more focus on export policy in order to get high economic growth. We
find negative impact of inflation on the economic growth of Pakistan. It shows that one
percent increase in inflation will decrease the economic growth by 0.37 percent. For the
economic growth of Pakistan, it is necessary to decrease the inflation as inflation means the
rise in the general price level. So, the consumer side would be affected. The coefficient of
infant mortality rate suggests that one percent increase in infant mortality rate will decrease
growth. Better health care facilities and public investment on hospital and medical facilities
can reduce the infant mortality rate. Usually in developing countries, infant mortality rate
remains higher than the developed countries as developed economies share specific budget
share for health care facilities. But in developing countries like Pakistan, its budget share is
less than 1% on Public health care facility. There is need to care about health facilities as this
sector has key role. Robert Barro (1996) views that life expectancy significantly correlates
with economic growth. David Bloom (2004) rightly states that better health has great
contribution to economic growth. He views that one percent increase in life expectancy will
encourage growth around 4%. Exchange rate has negative and statistically significant effects
on economic growth of Pakistan. It is consistent with the work of Danson Musyoki (2012)
who points out that there is inverse impact of real exchange rate volatility on GDP growth.

EUROPEAN UNION FUTURE PERSPECTIVES:
INNOVATION, ENTREPRENEURSHIP AND ECONOMIC POLICY
IS EXPORT LED-GROWTH HYPOTHESIS VALID IN PAKISTAN? IF SO, HOW RELEVANT IS
EXPORT TO EUROPE? 247
TABLE 3.7 – ERROR CORRECTION MODEL REPRESENTATION FOR SELECTED
ARDL MODEL
ECM for selected ARDL(1,0,0,0,0,1)selected based on AIC
Dependent variable is ∆LEG
Variable Coefficient Std. Error T-Statistic Prob.
∆LEXP 1.3349 0.4563 2.9254 [0.007]
∆LIMR -4.5523 1.9974 -2.2791 [0.030]
∆LINF -0.4414 0.2080 -2.1219 [0.043]
∆LEXC -3.9536 0.9708 -4.0727 [0.000]
∆LFDI 0.2248 0.1490 1.5082 [0.143]
∆C 20.9104 11.9012 1.7570 [0.090]
ECM(-1) -1.2051 0.1576 -7.6479 [0.000]
R-Squared 0.7236
DW-statistic 2.1521
R-Bar-Squared 0.6519
F-stat. F(6,28) 11.7822 [0.000]
Source: Authors’ estimation using Microfit 5.0
Short-run results are presented in table 3.7. In the short-run, export, exchange rate and
infant mortality rate have statically significant impact on economic growth of Pakistan. The
results show that one percent increase in export will raise economic growth around 1.34% in
the short run. These results are similar to Yousaf (1999) and Kimberly (2011) who views that
export has positive effects on economic growth in short run. If we look back the long run
coefficient, it has low coefficient than that of short run as we move from short run to long
run, the exports goes down as Pakistan exports raw materials etc. So, because of their low
price, return is less than that of shot run. In the short run, final products export is possible.
Infant mortality rate has negative and statistically significant coefficient in the short run,
showing the negative relation with economic growth. Foreign direct investment has positive
but insignificant relation with economic growth of Pakistan in short run. Inflation has
negative and significant relation with economic growth of Pakistan in the short run. The
coefficient of inflation shows that 1% increase in inflation will decrease economic growth
around 0.44. One percent increase in exchange rate will decrease economic growth by 3.95
percent. These results are showing consistency with long run results. It is good sign for our
model that from short run to long run, economic fluctuations are not very high. The
coefficient of error correction term (-1.21)) is negative and highly significant. It is good sign
for the model. The coefficient is showing quick convergence to the long run equilibrium path
from short run in case of disturbance in the short run. As Bannerjee et al. (1998) state that
highly significant error correction term verifies the existence of a stable long-run
relationship. We check different diagnostic tests and report with LM and F Version. These

Najid Ahmad, Katarina Kostelić, Arslan Ahmad
248 IS EXPORT LED-GROWTH HYPOTHESIS VALID IN PAKISTAN? IF SO, HOW RELEVANT IS EXPORT TO EUROPE?
tests confirm that there is no serial correlation and hetroskadascity in the model. The
functional form is normal and acceptable. Residuals are normally distributed and our model
is structurally stable (See appendix Appendix-A).
5. EXPORT LED GROWTH HYPOTHESIS IN PAKISTAN AND EU
RELEVANCE
Given that it is proved that Export Led Growth hypothesis is valid in Pakistan, it
remains to determine whether this export is relevant to Europe (or can be relevant) to
Pakistan’ economic growth and development. To do that, first, we consider export regarding
regions, as shown in APPENDIX C, Table 4.2 and Table 4.3. There are 19 missing
observations regarding the export to Europe. We fail to find enough historical data to make a
proper model, but statistical summary is provided in the APPENDIX C, Table 4.2. In
addition, possible correlations are shown in the Table 4.3. It is interesting to notice that there
is a positive correlation of export to Europe and Central Asia to the lneg that is economic
growth. Correlation has been established even with the lack of data.
There are significant trade agreements signed between EU and Pakistan:
The Cooperation Agreement from 2004
EU-Pakistan 5-year Engagement Plan from 2012
Generalized Scheme of Preferences (GSP) from 2014
According to European Commission report, EU-Pakistan trade increased by almost
4.7% annually between 2007 and 2011. In addition, according to the same report, 21.2%
Pakistan’s total export goes to EU. From this increasing trade, Pakistan can get more benefits
and economic growth and development. Given the lack of the data regarding Pakistan export
to European Union, in order to draw some conclusions, we use reciprocal data: EU import
from Pakistan is in Table 8.
EUROPEAN UNION FUTURE PERSPECTIVES:
INNOVATION, ENTREPRENEURSHIP AND ECONOMIC POLICY
IS EXPORT LED-GROWTH HYPOTHESIS VALID IN PAKISTAN? IF SO, HOW RELEVANT IS
EXPORT TO EUROPE? 249
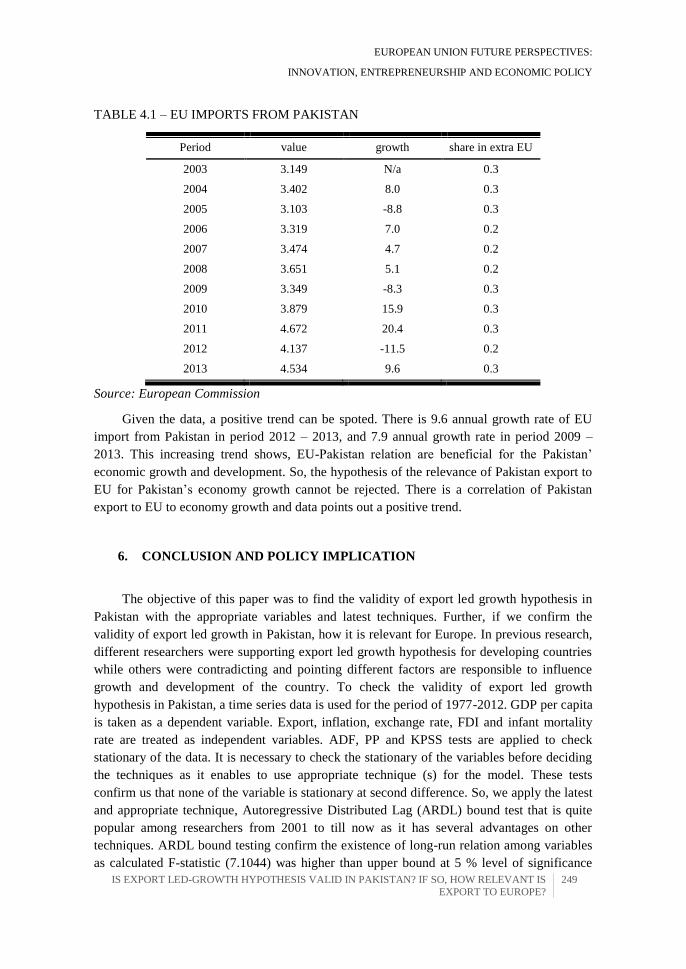
TABLE 4.1 – EU IMPORTS FROM PAKISTAN
Period value growth share in extra EU
2003 3.149 N/a 0.3
2004 3.402 8.0 0.3
2005 3.103 -8.8 0.3
2006 3.319 7.0 0.2
2007 3.474 4.7 0.2
2008 3.651 5.1 0.2
2009 3.349 -8.3 0.3
2010 3.879 15.9 0.3
2011 4.672 20.4 0.3
2012 4.137 -11.5 0.2
2013 4.534 9.6 0.3
Source: European Commission
Given the data, a positive trend can be spoted. There is 9.6 annual growth rate of EU
import from Pakistan in period 2012 – 2013, and 7.9 annual growth rate in period 2009 –
2013. This increasing trend shows, EU-Pakistan relation are beneficial for the Pakistan’
economic growth and development. So, the hypothesis of the relevance of Pakistan export to
EU for Pakistan’s economy growth cannot be rejected. There is a correlation of Pakistan
export to EU to economy growth and data points out a positive trend.
6. CONCLUSION AND POLICY IMPLICATION
The objective of this paper was to find the validity of export led growth hypothesis in
Pakistan with the appropriate variables and latest techniques. Further, if we confirm the
validity of export led growth in Pakistan, how it is relevant for Europe. In previous research,
different researchers were supporting export led growth hypothesis for developing countries
while others were contradicting and pointing different factors are responsible to influence
growth and development of the country. To check the validity of export led growth
hypothesis in Pakistan, a time series data is used for the period of 1977-2012. GDP per capita
is taken as a dependent variable. Export, inflation, exchange rate, FDI and infant mortality
rate are treated as independent variables. ADF, PP and KPSS tests are applied to check
stationary of the data. It is necessary to check the stationary of the variables before deciding
the techniques as it enables to use appropriate technique (s) for the model. These tests
confirm us that none of the variable is stationary at second difference. So, we apply the latest
and appropriate technique, Autoregressive Distributed Lag (ARDL) bound test that is quite
popular among researchers from 2001 to till now as it has several advantages on other
techniques. ARDL bound testing confirm the existence of long-run relation among variables
as calculated F-statistic (7.1044) was higher than upper bound at 5 % level of significance

Najid Ahmad, Katarina Kostelić, Arslan Ahmad
250 IS EXPORT LED-GROWTH HYPOTHESIS VALID IN PAKISTAN? IF SO, HOW RELEVANT IS EXPORT TO EUROPE?
that confirms the long run cointegration among the variables. So, we proceed further to check
long run and short run relationship among the variables under the investigation in our study.
The results show that one percent increase in export will raise GDP growth by 1.11 percent
in the long run and 1% increase in export will raise GDP by 1.34 percent in the short run.
The coefficient of speed of adjustment is negative and statistically significant that shows the
long run convergence in the model. Error correction term coefficient is -1.2051 that show
quick convergence of our model to long run. It means disturbance in the equilibrium in short
run will be corrected within first year. Bannerjee et al. (1998) states that highly significant
error correction term verifies the existence of a stable long-run relationship. Diagnostic tests
confirmed that there is no hetroskadasicity and serial correlation in our model. Residuals are
normally distributed and functional form is satisfactory. The CUSUM and CUSUMSQ show
that our model is structurally stable. So, export led growth hypothesis is valid in case of
Pakistan if we use appropriate techniques and variables.
After the confirmation of Export led growth hypothesis, we check its relevance to
Europe. To do so, first, we consider export regarding regions. There were missing
observations regarding the export to Europe. We fail to find enough historical data to make a
proper model, but statistical summary. In addition, the possible correlations show that there
is a positive correlation of export to Europe and Central Asia to the lneg that is economic
growth. Correlation has been established even with the lack of data. We find that there is
correlation between exports to EU. Our results have twofold policy. At one side, we confirm
the export led growth hypothesis validity in Pakistan. At second side, this export is relevant
to Europe.
Export expansion strategy can encourage productivity and large economies of scale can
be achieved. It encourages specialization that is based on comparative advantage. Trade can
introduce new technologies in Pakistan from different countries particularly from European
countries as they have much advance technologies. In this way, export encourages capital
accumulation. However, economic conditions can vary from period to period because of
internal and external crisis. Terrorism, crime and fluctuating prices are the hindrance for
Pakistan to meet its export targets in global market. Further, depreciation of Pakistani rupee
against dollar and increasing prices of goods and services lead to the reduction of economic
growth. Moreover, the effect of FDI on economic growth is insignificant as foreign investors
reluctant to invest in Pakistan. In this situation, Pakistan has best solution to make economic
growth by encouraging industrial sector. As Pakistan’s exported products are absorbed in
USA, UK, Germany, Hong Kong and Saudi Arabia. Pakistan should not focus on just few
countries for its export but it should search different markets for its products as high export
with few commodities and fewer markets can lead to instability. Possible solution is to
establish trade with an economic association, or political-economic association such as
European Union. Government of Pakistan should take initiatives in order to increase the
volume of exports. Research and Development programs should be encouraged to produce
quality products related to textile and agri. products. Second, Pakistan has different trade
Agreement with different countries of the world like EU. In this situation, it is expected that

EUROPEAN UNION FUTURE PERSPECTIVES:
INNOVATION, ENTREPRENEURSHIP AND ECONOMIC POLICY
IS EXPORT LED-GROWTH HYPOTHESIS VALID IN PAKISTAN? IF SO, HOW RELEVANT IS
EXPORT TO EUROPE? 251
Pakistan will make tremendous progress in the near future by creating favorable environment
for its exports. EU-Pakistan trade cooperation will be beneficial for both countries.
Like other studies, our work is not free from limitations. Additional research is
necessary for modeling the relation (EU-Pakistan).
Funding Source
This work has been fully supported by the Croatian Science Foundation under the
Project number 9481 Modelling Economic Growth-Advanced Sequencing and Forecasting
Algorithm. Any opinions, findings and conclusions or recommendations expressed in this
paper are those of authors and don’t necessarily reflect the views of Croatian Science
Foundation.
Acknowledgements
The authors would like to thank two anonymous reviewers and Dr. Danijela Rabar,
Assistant Professor Faculty of Economics and Tourism, University of Pula, Croatia for their
constructive comments and suggestions on the earlier draft of this research. Whatever
shortcomings that remain in the paper are our responsibility. The usual disclaimer applies.
REFERENCES
Abbas, Shujaat. 2012. “Causality between Exports and Economic Growth: Investigating
Suitable Trade Policy for Pakistan.” Eurasian Journal of Business and Economics 5 (10):
91–98.
Abual-Foul, B. (2004), “Testing export-led growth hypothesis: evidence from Jordan”,
Applied Economics Letters, 11: 393-396.
Afzal, M. (2004), “Exports-Economic Growth Nexus: Pakistan’s Experience”, Indian
Journal of Business and Economics, 3: 315-340.
Ahmad, Q.M., M.S. Butt, and S.Alam (2000), “Economic Growth, Export and External
Debt Causality: The Case of Asian Countries”, The Pakistan Development Review, 39: 591-
608.
Dodaro (1993), “Exports and Growth: A Reconsideration of Causality”, The Journal of
Developing Areas, 27, 237-244.
Afzal, M. and Karamat Ali (2008), “An Historical Evaluation of “Export-led Growth”
Policy in Pakistan”, Lahore Journal of Policy Studies, 2(1), 69-82.
Afzal, Mohammad, and Ijaz Hussain. 2010. “EXPORT-LED GROWTH HYPOTHESIS :
EVIDENCE FROM PAKISTAN. Journal of Quantitative Economics, 8 (1), 131-147.
Adetunji Babatunde, M., Olugboyega A. Oyeranti, Abiodun S. Bankole, and E. Olawale
Ogunkola. 2012. “Exports Trade, Employment and Poverty Reduction in Nigeria.”
International Journal of Social Economics 39 (11): 875–99.
doi:10.1108/03068291211263916.

Najid Ahmad, Katarina Kostelić, Arslan Ahmad
252 IS EXPORT LED-GROWTH HYPOTHESIS VALID IN PAKISTAN? IF SO, HOW RELEVANT IS EXPORT TO EUROPE?
Akyüz, Yilmaz. 2011. “Export Dependence and Sustainability of Growth in China.” China
& World Economy 19 (1): 1–23.
Andraz, Jorge M., and Paulo M.M. Rodrigues. 2010. “What Causes Economic Growth in
Portugal: Exports or Inward FDI?” Journal of Economic Studies 37 (3): 267–87.
doi:10.1108/01443581011061276.
Chigusiwa, Lloyd, Samuel Bindu, Victoria Mudavanhu, Lazarus Muchabaiwa, and D.
Mazambani. 2011. “Export-Led Growth Hypothesis in Zimbabwe: Does Export
Composition Matter?” International Journal of Economic Research 2 (4): 111–29.
Dar, Arif Billah, Niyati Bhanja, Amaresh Samantaraya, and Aviral Kumar Tiwari.
2013. “Export Led Growth or Growth Led Export Hypothesis in India: Evidence Based on
Time-Frequency Approach.” Asian Economic and Financial Review 3 (7): 869–80.
Darrat, A.F. (1987), “Are exports an engine of growth? Another lock at the evidence”.
Applied Economics, 19: 277-283.
Dickey, D.A. and W.A. Fuller (1979), “Distribution of the estimators for autoregressive
time series with a unit root”, Journal of American Statistical Association, 74: 427-431.
Dickey, D.A. and W.A. Fuller (1981), “The likelihood ratio statistics for autoregressive
time series with a unit root”. Econometrica, 49: 1057-1072.
Phillips P.C.B, Perron P., 1988. Testing for a Unit Root in a Time Series Regression.
Biometrica. 75, 335-346.
Kwiatkowski D., Phillips P.C.B., Schmidt P., Shin Y., 1992. Testing the null hypothesis of
stationary against the alternative of a unit root. How sure are we that economic time series
have a unit root? Journal of Econometrics. 54, 159-178.
Engle, R.F. and C.W.J. Granger (1987), “Co-integration and error-correction:
representation, estimation, and testing”. Econometrica, 55: 251-276.
Giles, J.A. and Williams, C.L.(2000a). “Export-Led Growth: A Survey of the Empirical
Literature and Some Non-Causality Results, Part 1”. Journal of International Trade and
Economic Development, vol. 9, pp.261-337.
Giles, J.A. and Williams, C.L.(2000b). “Export-Led Growth: A Survey of the Empirical
Literature and Some Non-Causality Results, Part 2”. Journal of International Trade and
Economic Development, vol. 9, pp.445-470.
I. Bentzen and T. Engsted, “A revival of the autoregressive distributed lag model in
estimating energy demand relationships,” Energy, vol. 26, pp. 45-55, 2001.
Inotai, András. 2013. “Sustainable Growth Based on Export-Oriented Economic
Strategy.”http://www.fes.bg/files/custom/library/2013/Berichte%20und%20Analysen/Sustain
able_Growth_Based_on_Export_Oriented_Economic_Strategy.pdf.
Jayawickrama, Ananda, and Shandre M. Thangavelu. 2010. “Trade Linkages between
China, India and Singapore: Changing Comparative Advantage of Industrial Products.”
Journal of Economic Studies 37 (3): 248–66. doi:10.1108/01443581011061267.
Jordaan, André C., and Joel Hinaunye Eita. 2009. “Testing the Export-Led Growth
Hypothesis for Botswana: A Causality Analysis.” Botswana Journal of Economics 6 (10): 2–
14.
Khan, A.R. (2007), “Growth, employment and poverty: an analysis of the vital nexus based
on some recent UNDP and ILO/SIDA studies”, DESA Working Paper No. 49, July.

EUROPEAN UNION FUTURE PERSPECTIVES:
INNOVATION, ENTREPRENEURSHIP AND ECONOMIC POLICY
IS EXPORT LED-GROWTH HYPOTHESIS VALID IN PAKISTAN? IF SO, HOW RELEVANT IS
EXPORT TO EUROPE? 253
Kokko, Ari, and others. 2002. Export-Led Growth in East Asia: Lessons for Europe’s
Transition Economies. National Europe Centre, Australian National University.
http://www2.hhs.se/eijswp/142.PDF.
Konya, Laszlo. 2004. “Export-Led Growth, Growth-Driven Export, Both or None? Granger
Causality Analysis on OECD Countries.” Granger Causality Analysis on OECD Countries
(August 17, 2008). Applied Econometrics and International Development 4 (1).
http://papers.ssrn.com/sol3/papers.cfm?abstract_id=1231926.
M. H. Pesaran and B. Pesaran, Working with Microfit 4.0: Interactive Econometric
Analysis, Oxford University Press, 1997.
M. H. Pesaran and Y. Shin (1999) “An autoregressive distributed lag modeling approach to
cointegration analysis,” in Econometrics and Economic Theory in the 20th Century: The
Ragnar Frisch Centennial
M. H. Pesaran, Y. Shin, and R. J. Smith, “Bounds testing approaches to the analysis of
level relationships,” Journal of Applied Econometrics, vol. 16, pp. 289-326, 2001.
Mahadevan, Renuka. 2007. “New Evidence on the Export-Led Growth Nexus: A Case
Study of Malaysia.” The World Economy 30 (7): 1069–83. doi:10.1111/j.1467-
9701.2007.01030.x.
N. M. Odhiambo, “Energy consumption and economic growth nexus in Tanzania: An
ARDL bounds testing approach,” Energy Policy, vol. 37, no. 2, pp. 617-622, 2008.
P. K. Narayan, “The saving and investment nexus for China: evidence from cointegration
Tests,” Applied Economics, vol. 37, no. 17, pp. 1979-1990, 2005.
Palley, Thomas I. 2011. “The Rise and Fall of Export-Led Growth.” Levy Economics
Institute of Bard College Working Paper, no. 675.
http://papers.ssrn.com/sol3/papers.cfm?abstract_id=1889167.
Panas, E. and Vamvoukas, G. (2002) Further evidence on the export-led growth
hypothesis, Applied Economics Letters, 9, 731-5.
Paul, Biru Paksha. 2014. “Testing Export-Led Growth in Bangladesh: An ARDL Bounds
Test Approach.” International Journal of Trade, Economics and Finance, 1–5.
doi:10.7763/IJTEF.2014.V5.331.
S. Ghatak and J. Siddiki, “The use of ARDL approach in estimating virtual exchange rates
in India,” Journal of Applied Statistics, vol. 28, pp. 573-583, 2001.
S. Johansen and K. Juselius, “Maximum likelihood estimation and inference on
cointegration with application to the demand for money,” Oxford Bulletin of Economics and
Statistics, vol. 52, pp. 169-209, 1990.
Shan, Liang Hung, and Zuradi Jusoh. 2015. “IS THE EXPORT-LED GROWTH
HYPOTHESIS VALID FOR MALAYSIA?” Accessed March 29.
http://www.statistics.gov.my/portal/download_journals/files/2012/Volume2/02Hypothesis.pd
f.
Srivastava, Deepak K., and Garima Kapoor. 2007. “Test of Export-Led Growth and
Growth-Led Export Hypotheses in Indian Context: An Econometric Analysis for the Period
of 1951-2004.” Asia Pacific Management Review 12 (2): 113.
Tang, Tuck Cheong, Chea Ravin, and others. 2013. Export-Led Growth in Cambodia: An
Empirical Study. Monash University, Department of Economics.
Najid Ahmad, Katarina Kostelić, Arslan Ahmad
254 IS EXPORT LED-GROWTH HYPOTHESIS VALID IN PAKISTAN? IF SO, HOW RELEVANT IS EXPORT TO EUROPE?
http://www.buseco.monash.edu.au/eco/research/papers/2013/0313exportcambodiatangravin.
pdf.
Tyler, W. (1981), “Growth and export expansion in developing countries”, Journal of
Development Economics, 9: 121-30.
Udah, E. B. 2012. “Export-Growth Hypothesis: An Econometric Analysis of the Nigerian
Case.” Interdisciplinary Journal of Research in Business 2 (4): 39–49.
Waithe, Kimberly, Troy Lorde, and Brian Francis. 2011. “Export-Led Growth: A Case
Study of Mexico.” International Journal of Business, Humanities and Technology 1 (1): 33–
44.
Winters, L.A., McCulloch, N. and McKay, A. (2004), “Trade liberalisation and poverty:
the evidence so far”, Journal of Economic Literature, Vol. 42, pp. 72-115.
World Bank (1993), The Asian Miracle: Economic Growth and Public Policy, Oxford:
Oxford University Press.
World Bank (2014). World Development Indicators, World Bank.
Haug, A.,2002.Temporal aggregation and the power of co-integration tests: A Monte Carlo
study.Oxf.Bull.Econ.Stat.64,399–412.
Ouattara, B., 2004. Foreign Aid and Fiscal Policy in Senegal. Mimeo University of
Manchester.
Bannerjee, A., J. W. Dolado, and R. Mestre (1998) Error-Correction Mechanism Tests
for Cointegration in Single Equation Framework. Journal of Time Series Analysis 19,
267–283.
Ehrlich I. Crime, punishment and the market for offences. J Econ Perspect 1996;10:43–67.
Cameron S. A review of the econometric evidence on the effects of capital punishment. J
Socio-econ 1994;23:197–214.
Layson S. Homicide and deterrence: another view of the Canadian time series evidence. Can
J Econ 1983;16:52–73.
Boutabba, Mohamed Amine. 2014. “The Impact of Financial Development, Income,
Energy and Trade on Carbon Emissions: Evidence from the Indian Economy.” Economic
Modelling 40. Elsevier B.V.: 33–41. doi:10.1016/j.econmod.2014.03.005.
David E. Bloom, D. C. (2004). The Effect of Health on Economic Growth:A Production
Function Approach. World Development , 01-13. doi:10.1016/j.worlddev.2003.07.002
Barro, R. J. (1996). Health and economic growth. Paper presented at the “Senior Policy
Seminar on Health, Human Capital and Economic Growth: Theory, Evidence and Policies”.
Washington, DC: Pan American Health Organization and Inter-American Development
Bank.
Danson Musyoki, G. P. (2012). The impact of real exchange rate volatility on economic
growth: Kenyan evidence. Business and Economic Horizons , 59-75.

EUROPEAN UNION FUTURE PERSPECTIVES:
INNOVATION, ENTREPRENEURSHIP AND ECONOMIC POLICY
IS EXPORT LED-GROWTH HYPOTHESIS VALID IN PAKISTAN? IF SO, HOW RELEVANT IS
EXPORT TO EUROPE? 255
Xu, D-q., Ljungwall, C., Xin, L., 2009. The Road to End Poverty: A Comparison of
Development Strategies between China and India. China Mechanic Press, Beijing.
Al-Yousif, Yousif. K. 1999. “On the Role of Exports in the Economic Growth of Malaysia:
A Multivariate Analysis.” International Economic Journal.
doi:10.1080/10168739900080022.
Awokuse, Titus. 2010. “Is the Export-Led Growth Hypothesis Valid for Canada ?, The
Canadian Jouranal Of Economics” 36 (1): 126–36.
Chemeda, Faye Ensermu. 2001. “REFERENCE TO ETHIOPIAN COUNTRY BY : Ethio-
Italian Cooperation Arsi-Bale Rural Development Project Paper Prepared for the Conference
on “ Annual Meeting of the American,” no. May.
Jordaan, André C. 2007. “Testing the Export-Led Growth Hypothesis for Botswana : A
Causality Analysis Joel Hinaunye Eita Department of Economics University of Pretoria
Department of Economics University of Pretoria.”
Maneschiöld, Per-ola. 2008. “A Note on the Export-Led Growth Hypothesis : A Time
Series Approach *.” Cuadernos de Economía 45 (Vol. 45 (Noviembre)): 293–302.
MacKinnon, J.G., 1991. Critical Values for Co-Integration Tests. In: Engle, R.F., Granger,
C.W.J. (Eds.), Long-Run Economic Relationships. Oxford University Press, pp. 267–276.
Lai, Y.W., 2004. The role of domestic demand in the economic growth of Malaysia: A
cointegration analysis. Int. Econ. J. 18, 337–352.

Najid Ahmad, Katarina Kostelić, Arslan Ahmad
256 IS EXPORT LED-GROWTH HYPOTHESIS VALID IN PAKISTAN? IF SO, HOW RELEVANT IS EXPORT TO EUROPE?
APENDIX A
TABLE A-1 – DIAGNOSTIC TESTS
Source: Authors’ estimation
FIGURE 3.1. PLOT OF CUMULATIVE SUM OF RECURSIVE RESIDUALS
Source: Authors
-20
-10
0
10
20
1978 1987 1996 2005 2012
The straight lines represent critical bounds at 5% significance level
Plot of Cumulative Sum of Recursive Residuals
Test Statistics LM Version F Version
Serial correlation 0.4721 [0.492] 0.3555 [0.556]
Functional Form 4.4686 [0.035] 3.8053 [0.062]
Normality 1.3700 [0.504] ---
Heteroscedasticity 3.7160 [0.054] 3.9198 [0.056]
P-values are in parenthesis []

EUROPEAN UNION FUTURE PERSPECTIVES:
INNOVATION, ENTREPRENEURSHIP AND ECONOMIC POLICY
IS EXPORT LED-GROWTH HYPOTHESIS VALID IN PAKISTAN? IF SO, HOW RELEVANT IS
EXPORT TO EUROPE? 257
FIGURE 3.2. PLOT OF CUMULATIVE SUM OF SQUARES OF RECURSIVE
RESIDUALS
Source: Authors’
Cumulative sum (CUSUM) and cumulative sum of square (CUSUMSQ) stay within the 5 %
of critical bounds. It means our model is structurally stable.
FIGURE 3.4. ERROR TERM (Ɛt) OF THE MODEL IS NORMALLY DISTRIBUTED
Source:Authors’
-0.4
-0.2
0.0
0.2
0.4
0.6
0.8
1.0
1.2
1.4
1978 1987 1996 2005 2012
The straight lines represent critical bounds at 5% significance level
Plot of Cumulative Sum of Squares of Recursive Residuals
0.0
0.2
0.4
0.6
0.8
1.0
1.2
1.4
1.6
1.8
-2.0 -1.0 0.0 1.0 2.0
Histogram of Residuals and the Normal Density
Sample from 1978 to 2012

Najid Ahmad, Katarina Kostelić, Arslan Ahmad
258 IS EXPORT LED-GROWTH HYPOTHESIS VALID IN PAKISTAN? IF SO, HOW RELEVANT IS EXPORT TO EUROPE?
APENDIX C
TA
BL
E 4
.2 –
DE
SC
RIP
TIV
E S
TA
TIS
TIC
S
Su
mm
ary S
tati
stic
s, u
sin
g t
he
ob
serv
atio
ns
19
77
- 2
01
4
(mis
sin
g v
alues
wer
e sk
ipp
ed)
Var
iab
le
nu
mb
er
Mea
n
Med
ian
Min
imu
m
Max
imu
m
Std
.
Dev
.
C.V
. S
kew
nes
s E
x.
ku
rtosi
s
5%
Per
c.
95%
Per
c.
IQ
ran
ge
Mis
s-
ing
ob
s.
1
9.5
6E
+09
8.0
3E
+09
1.2
1E
+09
2.5
4E
+10
7.1
7E
+09
0.7
502
0.8
93275
-0
.32749
1.5
9E
+09
2.5
2E
+10
1.1
5E
+10
1
2
15.3
019
15.2
143
8.3
3104
24.6
491
4.4
3619
0.2
89911
0.3
87675
-0
.75992
8.4
2948
23.3
396
6.6
0776
1
3
72.0
843
76.3
896
56.0
896
82.8
691
8.4
858
0.1
1772
-0
.46961
-1.2
3407
57.2
837
81.7
33
14.8
999
1
4
18.9
775
15.8
103
8.7
2499
35.1
892
7.1
6137
0.3
77361
0.6
49537
-0
.83422
10.1
158
32.1
817
12.2
912
1
5
6.0
3563
5.0
1811
2.4
0444
14.6
734
2.9
0686
0.4
81618
1.3
8023
1.4
3786
2.8
1716
13.8
227
2.9
1502
1
6
2.3
6945
2.2
7329
0.9
66576
3.9
2532
0.7
97925
0.3
36756
0.3
07833
-0
.49665
undefi
ned
3.9
2532
1.2
4857
19
7
1.1
0481
1.3
1178
0.0
61359
1.9
647
0.6
19927
0.5
61117
-0
.38406
-1.1
2207
0.0
86331
1.9
4851
1.1
3607
1
8
4.5
8838
2.6
1414
1.3
1886
17.2
731
4.1
4176
0.9
02664
1.6
8216
1.7
8703
1.4
3139
15.3
265
2.9
2698
1
9
6.6
7197
5.7
6471
2.7
1359
12.8
987
3.4
1244
0.5
11459
0.7
78846
-0
.89435
2.8
2345
12.5
466
5.4
5311
1
10
4.2
724
4.2
9916
1.8
6675
7.7
6445
1.5
3178
0.3
58529
0.2
76123
-0
.42292
1.9
2144
7.4
9696
2.1
6396
1
11
9.6
3E
+09
7.9
9E
+09
1.1
7E
+09
2.6
2E
+10
7.4
1E
+09
0.7
68956
0.9
37588
-0
.24559
1.4
6E
+09
2.5
7E
+10
1.1
4E
+10
1
12
6.6
7197
5.7
6471
2.7
1359
12.8
987
3.4
1244
0.5
11459
0.7
78846
-0
.89435
2.8
2345
12.5
466
5.4
5311
1
13
113.4
23
93.6
928
26.5
47
281.1
53
78.4
355
0.6
91532
0.8
45482
-0
.44962
27.8
89
279.2
21
131.1
05
4
14
983.7
2
66
0
5593
1707.0
3
1.7
3528
1.7
2508
1.6
6416
3.6
5533.9
1245.5
13
15
0.0
49894
0.0
40182
0.0
26529
0.1
02029
0.0
26353
0.5
28177
0.9
81096
-0
.39897
undefi
ned
undefi
ned
0.0
42941
29
16
6.4
0E
+12
6.5
2E
+12
4.8
5E
+12
7.3
1E
+12
8.7
2E
+11
0.1
3637
-0
.52467
-1.0
0842
undefi
ned
undefi
ned
1.5
9E
+12
29
17
1.5
0811
1.5
8982
0.0
14293
2.3
2393
0.5
09615
0.3
37916
-0
.95975
0.7
75113
0.3
99509
2.1
2126
0.6
20585
2
1 -
Mer
chan
dis
e ex
port
s (c
urr
ent
US
$),
2 -
Mer
chan
dis
e ex
port
s to
econ
om
ies
in t
he
Ara
b W
orl
d (
% o
f to
tal
mer
chan
dis
e ex
port
), s
3 -
Mer
chan
dis
e ex
port
s to
hig
h-i
nco
me
econ
om
ies
(% o
f to
tal
mer
chan
dis
e ex
port
s),
4 -
Mer
chan
dis
e ex
port
s to
dev
elop
ing e
con
om
ies
ou
tsid
e
regio
n (
% o
f to
tal
mer
chan
dis
e ex
port
s),
5 -
Mer
chan
dis
e ex
port
s to
dev
elop
ing e
con
om
ies
in E
ast
Asi
a &
Pac
ific
(%
of
tota
l m
erch
and
ise
exp
ort
s),
6 -
Mer
chan
dis
e ex
port
s to
dev
elop
ing e
con
om
ies
in E
uro
pe
& C
entr
al A
sia
(% o
f to
tal
mer
chan
dis
e ex
port
s),
7 -
Mer
chan
dis
e ex
port
s
to d
evel
op
ing e
con
om
ies
in L
atin
Am
eric
a &
th
e C
arib
bea
n (
% o
f to
tal
mer
chan
dis
e ex
port
s),
8 -
Mer
chan
dis
e ex
port
s to
dev
elop
ing e
con
om
ies
in M
idd
le E
ast
& N
ort
h A
fric
a (%
of
tota
l m
erch
andis
e ex
port
s),
9 -
Mer
ch
andis
e ex
port
s to
dev
elop
ing e
con
om
ies
in S
ou
th A
sia
(% o
f to
tal
mer
chan
dis
e ex
port
s),
10
-
Mer
chan
dis
e ex
port
s to
d
evel
op
ing ec
on
om
ies
in S
ub
-Sah
aran
A
fric
a (%
of
tota
l m
erch
andis
e ex
port
s),
11 -
Mer
chan
dis
e ex
port
s b
y t
he
rep
ort
ing e
con
om
y,
resi
du
al (
% o
f to
tal
mer
chan
dis
e ex
port
s),
12
- M
erch
andis
e ex
port
s b
y t
he
rep
ort
ing e
con
om
y
(cu
rren
t U
S$
), 1
3 -
Mer
chan
dis
e ex
port
s to
dev
elop
ing e
con
om
ies
wit
hin
reg
ion
(%
of
tota
l m
erch
and
ise
exp
ort
s),
14
- E
xp
ort
val
ue
ind
ex
(200
0 =
100
), 1
5 -
Bat
tle-
rela
ted
dea
ths
(nu
mb
er o
f p
eop
le),
16 -
Fore
ign
dir
ect
inves
tmen
t, n
et o
utf
low
s (%
of
GD
P),
17
– l
neg
So
urc
e: A
uth
ors
’ u
sin
g G
retl

EUROPEAN UNION FUTURE PERSPECTIVES:
INNOVATION, ENTREPRENEURSHIP AND ECONOMIC POLICY
IS EXPORT LED-GROWTH HYPOTHESIS VALID IN PAKISTAN? IF SO, HOW RELEVANT IS
EXPORT TO EUROPE? 259
TABLE 4.3 – CORRELATION COEFFICIENTS FOR EXPORT PER REGION AND
LNGDP
Correlation coefficients, using the observations 1977 - 2014
(missing values were skipped)
5% critical value (two-tailed) = 0.3202 for n = 38
Arab HighIn
come
Develo
upedRe
gion
EastAsi
a
Pacific
Europe
Central
Asia
LatinA
merica
Caribbe
an
Middle
East
NorthA
frica
SouthA
sia
SubSah
aranAfr
ica
DevRe
gion
FDI%G
DP lneg
1 -0.72 0.798 0.2634 0.4509 0.1043 0.7535 0.3594 0.7518 0.3594 -0.227 0.1502 Arab
1 -0.946 -0.714 -0.777 -0.253 -0.657 -0.694 -0.732 -0.694 -0.12 -0.225
HighIn
come
1 0.5981 0.7182 0.1016 0.827 0.4609 0.7613 0.4609 0.1559 0.28
Develo
upedRe
gion
1 0.5242 0.3701 0.1419 0.6485 0.3214 0.6485 0.3257 0.0918
EastAsi
a
Pacific
1 0.6554 0.6522 0.7491 0.5643 0.7491 -0.401 0.109
Europe
Central
Asia
1 -0.263 0.6164 0.291 0.6164 0.0146 -0.452
LatinA
merica
Caribbe
an
1 0.0011 0.5219 0.0011 0.1155 0.2971
Middle
East
NorthA
frica
1 0.5465 1 0.0913 0.0089
SouthA
sia
1 0.5465 -0.6 0.2212
SubSah
aranAfr
ica
1 0.0913 0.0089
DevRe
gion
1 0.2879
FDI%G
DP
1 lneg
Source: Authors’ using Gretl